
 Submit a Paper
 Propose a Special lssue
 Open Access
ARTICLE
Smart Home IoT Privacy and Security Preservation via Machine Learning Techniques
College of Computer Science and Engineering, University of Hafr Albatin, Saudi Arabia
* Corresponding Author: Mubarak Almutairi. Email:
Computers, Materials & Continua 2023, 74(1), 1959-1983. https://doi.org/10.32604/cmc.2023.031155
Received 11 April 2022; Accepted 10 June 2022; Issue published 22 September 2022
 View Full Text
 Download PDF
Abstract
The development and use of Internet of Things (IoT) devices have grown significantly in recent years. Advanced IoT device characteristics are mainly to blame for the wide range of applications that may now be achieved with IoT devices. Corporations have begun to embrace the IoT concept. Identifying true and suitable devices, security faults that might be used for bad reasons, and administration of such devices are only a few of the issues that IoT, a new concept in technological progress, provides. In some ways, IoT device traffic differs from regular device traffic. Devices with particular features can be classified into categories, irrespective of their function or performance. Ever-changing and complex environments, like a smart home, demand this classification scheme. A total of 41 IoT devices were employed in this investigation. To build a multiclass classification model, IoT devices contributed 13 network traffic parameters. To further preprocess the raw data received, preprocessing techniques like Normalization and Dataset Scaling were utilized. Feature engineering techniques can extract features from the text data. A total of 117,423 feature vectors are contained in the dataset after stratification, which are used to further improve the classification model. In this study, a variety of performance indicators were employed to show the performance of the logiboosted algorithms. Logi-XGB scored 80.2% accuracy following application of the logit-boosted algorithms to the dataset for classification, whereas Logi-GBC achieved 77.8% accuracy. Meanwhile, Logi-ABC attained 80.7% accuracy. Logi-CBC, on the other hand, received the highest Accuracy score of 85.6%. The accuracy of Logi-LGBM and Logi-HGBC was the same at 81.37% each. Our suggested Logi-CBC showed the highest accuracy on the dataset when compared to existing Logit-Boosted Algorithms used in earlier studies.Keywords
The IoT is predicted to have a substantial impact on the success of 92% of businesses by end 2021. Businesses consider the IoT concept to be the most challenging to implement. Among the challenges that must be addressed are those related to security, privacy, cost, and regulatory issues. The studies of [1,2] involving 1,430 firms found that 95% of IoT users acknowledge the various advantages provided by the concept (small, medium, and big).
Gartner predicted that the IoT concept would be the most commonly employed in smart building environments before 2017, as determined by the number of devices put in smart buildings prior to 2017. Following 2017, the smart home idea had more IoT devices than any other field. According to [3], thorough information on IoT device represented by application sectors is available.
The smart home concept has been shown to have the most on-premise IoT devices (822.6 million) in comparison to other applications. It has been projected that the industrial IoT concept (expected to increase by 23.4%) will show tremendous growth in IoT application area by 2021 i.e., at 19.6% each year. IoT devices must be classified for a variety of reasons. An IoT device that fails to work as anticipated or is working in unexpected ways, as discussed in this article, may be a signal of security issues in the system, rendering the crucial need to identify precisely the IoT devices in a specific context and setting [4].
In IoT environments, traffic control and network capacity can benefit from the identification and classification of both novel and unfamiliar devices.
The IoT technology allows for the connection and remote monitoring of devices using the Internet [5]. This concept has evolved dramatically in the past years, and is now being used in a variety of disciplines, including smart homes, telemedicine, and industries. Sensor technologies for IoT provide a global connectivity of smart devices with expanded capabilities [6]. A wireless home automation network made up of sensors and actuators with sharing resources and connection to one another is essential for constructing intelligent homes [7]. The IoT paradigm includes an “intelligent house” which aims to include home automation [8,9]. Fig. 1 displays an intelligent home with multiple IoT-connected utilities.
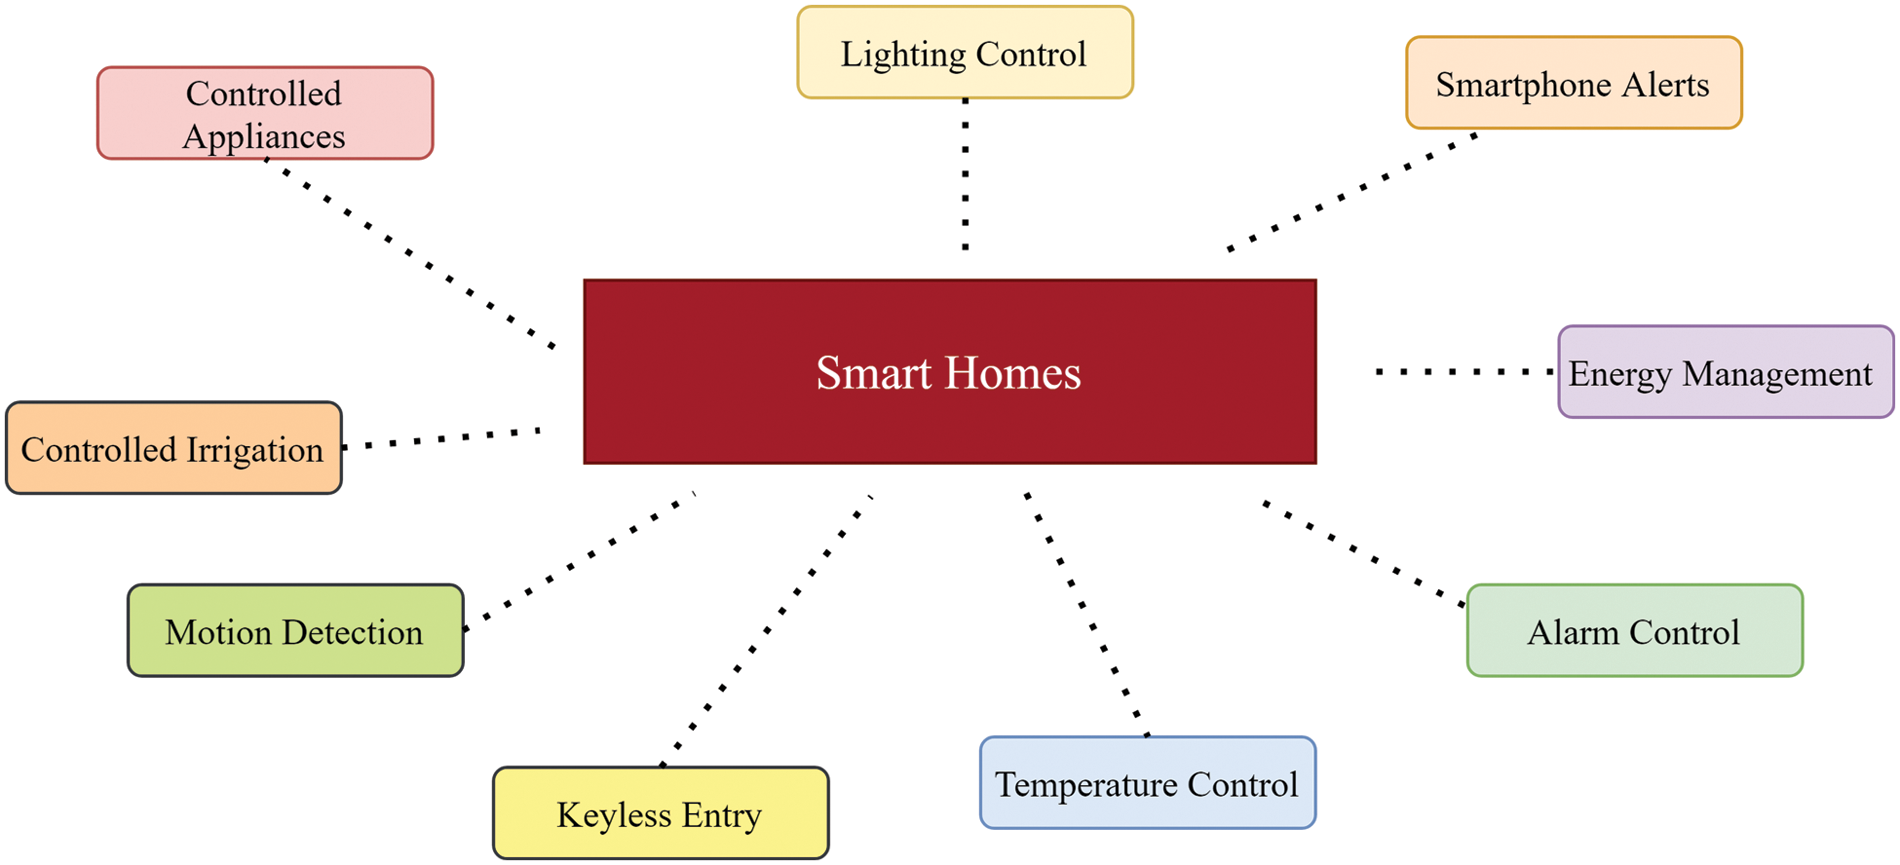
Figure 1: Intelligent smart with different IoT devices connected
Among the most appealing features of home automation systems is their ease of use with a variety of devices, such as smartphones, laptops and desktops, tablets, smart watches, and voice assistantsHome automation systems have several benefits: they improve safety by managing equipment and lighting, protect the home by using automatic door locks, increase awareness by using security cameras, improve convenience via temperature adjustments, save time and money, and regulate them. Currently, the shipment of IoT-based Home Automation constituents has grown in range, as illustrated by Fig. 2:
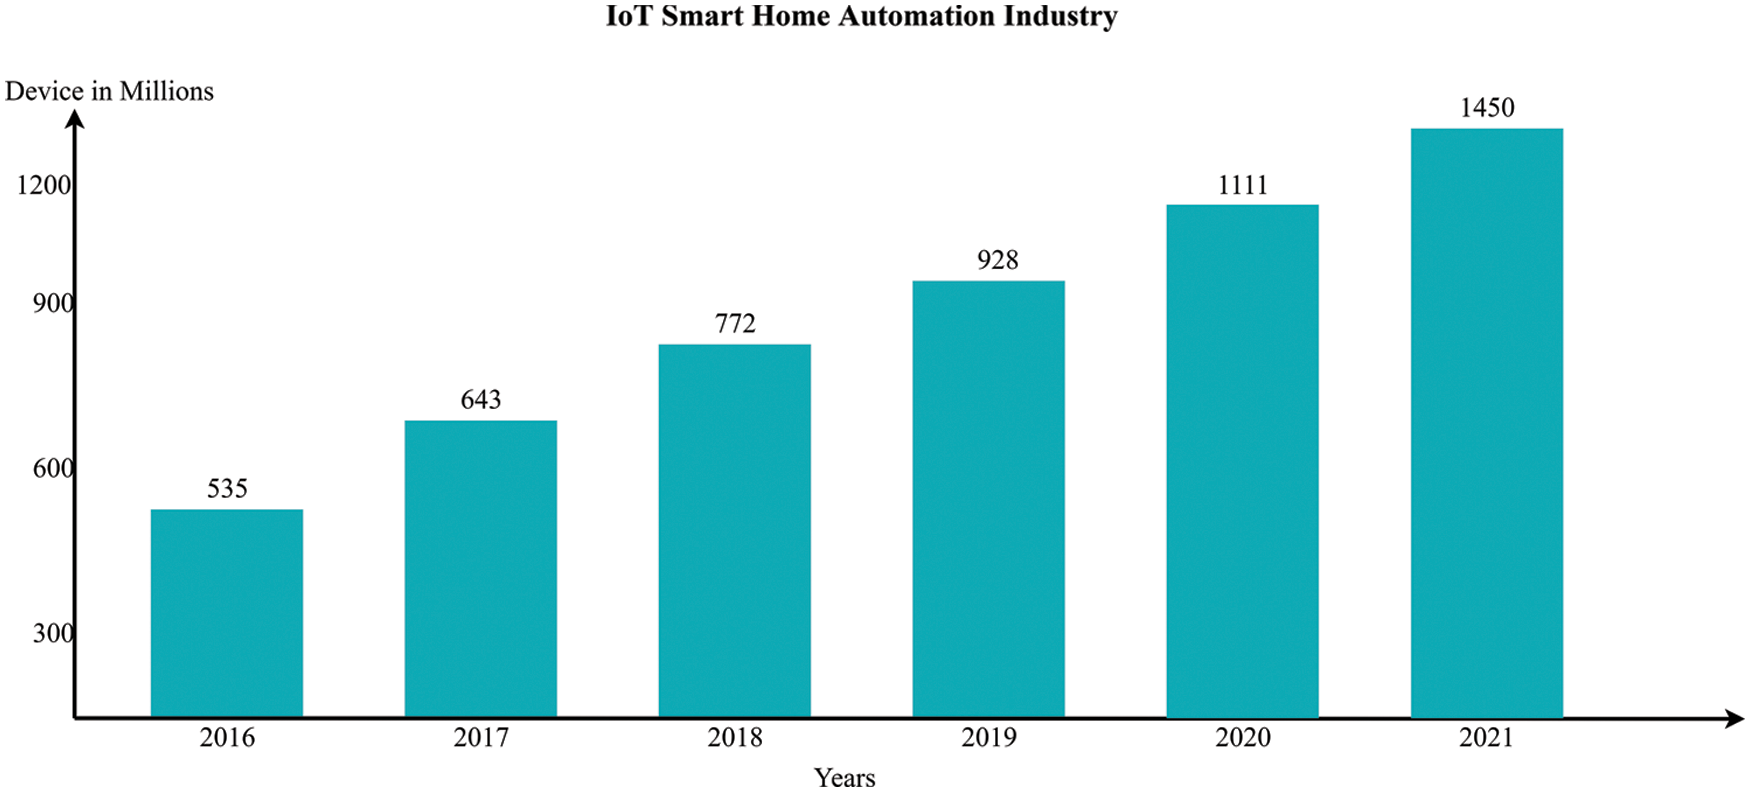
Figure 2: IoT based smart home automation industry sales
The IoT has now become increasingly essential in different commercial fields. The most significant barriers to enterprise adoption and utilization of the IoT idea are security, privacy, price, and regulatory issues [10,11].
In a study involving 1,430 small, medium and by companies, 95% of IoT users see many benefits of the. As a result, 53% of the respondents believe that implementing the IoT concept in business has considerable benefits. Simultaneously, 79% felt that employing IoT allows them to achieve positive outcomes in many work areas. Gartner asserted that based on the usage volume of IoT devices, the IoT concept was most commonly applied in smart buildings until 2017. After 2017, more IoT devices are used in smart homes as compared to other areas. The study by IHS Markit helps to better understand how individual applications reflect IoT devices [12].
In comparison to other applications, the smart home concept records the highest number of installed IoT devices i.e., 822.6 million [1], and the industrial IoT concept (CAGR 23.4%) is anticipated to be the most rapidly growing areas of IoT application by 2021, at 19.6% CAGR for smart houses [13]. The categorisation of IoT devices is important for various reasons. Illegal or unapproved IoT devices, undesirable devices, devices which fail to work as planned, and potential security issues can all be recognized via effective IoT device identification in a specific circumstance or setting. In IoT scenarios, the identification and classification of novel and unfamiliar devices can aid traffic control and network capacity.
Given the foregoing, it is anticipated that an effective categorization model for IoT devices can be created according to the characteristics of the traffic flow generated. A classification model will be built using an ensemble-supervised machine learning method that can assign IoT devices to specified classes based on the value their traffic flow values. This study focuses on individual devices. In rapidly changing, dynamic, and diverse settings like the IoT, this approach is inefficient.
As a result, the research presented in this paper is unique, allowing researchers to identify unknown classes of IoT devices according to the pattern of the network traffic. We aim is to generalize the problem and create a solution that is specific to the IoT ecosystem. IoT devices do not need to be inspected individually to solve problems like managing IoT devices, detecting network anomalies caused by IoT devices, or determining if an unauthorised IoT device is on the network. For this purpose, one would need a classification model that can match previously unidentified devices to generic behavior patterns. Based on the findings, more devices were observed for a longer period of time and more data was gathered, an innovative method of classifying IoT devices was applied, and the proposed classification model produced better results. The resolution towards the aforementioned problems is guided by the study objectives below:
• To identify IoT-related assaults and anomalies in a Smart Home
• To design new ensemble-based hybrid machine learning classifying models namely the LogiXGBoost Classifier, LogiGradientBoost Classifier, LogiAdaBoost Classifier, LogiCatBoost Classifier, LogiLGBoost Classifier, and LogiHistGBoost Classifier for predicting assaults and anomalies in IoT-based Smart Homes in order to preserve privacy and security.
• As far as we are aware, no other comparative study has been conducted based on Logit-Boosted algorithms for the detection of attacks in Smart Home-based IoT Devices.
This section presents a brief summary of prior state-of-the-art machine learning-based strategies for preserving the privacy and security of smart homes using IoT devices.
In this paper, Li et al. [14] propose a method for detecting IoT security. The system’s main functions are carried out through supervised learning, which is utilized to classify harmful traffic and identify different attack types. Furthermore, the authors provide a simple feature selection method that compares the two functions using only a few characteristics. This method allows for the automatic extraction of 29 and 9 features out of 88 features, with the resulting system demonstrating tremendous accuracy rates of 98.7% and 98.99% in classification studies. Even with limited characteristics, this method has been proven to be highly accurate.
For smart houses, Anthi et al. [15] designed a three-layered Intrusion Detection System (IDS). On IoT networks, a three-layer IDS detects a number of common network-based cyber-attacks. When an attack happens, the system performs three key tasks: 1) categorizing and profiling all IoT devices linked to the network, 2) identifying malware on the network, and 3) classifying the type of attack. The system is evaluated using an 8-device smart home testbed. Denial of Service (DoS), (Man-in-the-Middle) MITM/Spoofing, Reconnaissance, and Replay are the four basic network attack categories used to evaluate an IDS design. The system is also put through its paces in four multi-stage assaults with convoluted event sequences. The three basic processes of the system each perform at 96.2%, 90.0%, and 98.0%, accordingly. In this scenario, a network-connected IoT device effectively identifies an attack, and the recommended design instantly differentiates between malicious and benign network traffic.
For IoT networks, a hybrid feature selection engine which only picks the most essential features and a Random Forest method to categorize the normality or abnormality of the traffic is used in the article [16]. IoTID20, a novel IoT anomaly detecting dataset, was used to evaluate the results. The proposed method accurately detects DoS (99.95%), MITM (99.97%), and Scanning (99.96%) attacks.
Flow-based features can be used to identify an IoT device in this study [8] The precision, recall, and F score of a full features dataset, reduced features dataset, and flow-based features dataset are all 100%. We show that the proposed model can accurately categorize IoT devices using our dataset.
Within a small IoT network dataset, Sahu et al. [17] showed the ability of the classifiers in distinguishing harmful behaviors with non-malicious ones. Furthermore, given increasingly large datasets, the classifiers can also differentiate between the two aforementioned behaviors. Experiments have demonstrated that accuracy, detection likelihood, and rate of false alarms have all improved with time. In the aspect of performance, accuracy scored 99.9%, detection likelihood scored 99.8%, and rate of false alarms scored 0%. This paper also shows the way the classifiers enhance performance as the training datasets become greater.
Two machine learning classification models are used in this study [17], of which results are then compared. Neural networks and logistic regression are utilized as classification algorithms. As there are approximately 3.5 lakh datasets, two separate approaches are examined. When using the aforesaid approach, the complete 3.5 million dataset is used; but when using other algorithms, the feature “value” is excluded. In the training set, 75% of the total data is used, whereas 25% is utilized in the testing set. An Artificial Neural Network (ANN) delivers 99.4% precision in the first situation, but the technique mentioned above provides 99.99% precision.
Aivodji et al. [18] introduced IOTFLA, an innovative smart home design integrating combined learning and secure data aggregation, with a focus on security and privacy.
Reference [19] used a set of rules table and manually classified some of the data gathered via conventional smart home IoT, including door and window opening and closing, motor starting and stopping, system connection and interruption, time for conveying every data to label, and finally model classifying, building and training using the Support Vector Machine (SVM) algorithm.
Reference [20–22] presented the initial prediction of an intrusion detection system (IDS), using Extreme Learning Machine and Artificial Immune System for detecting anomalies in the smart home network (AIS-ELM). AIS utilizes clonal algorithm for optimizing the input parameters to improve the identification of abnormal activities, whilst ELM investigates the input parameter. Along with a push notification system, this strategy enables the home network gateway to alert the owner about anomalies occurring in the network and to immediately take necessary measures.
Reference [23,24] constructed a smart home system with the ability to record offline and online attendance as well as detect offenders via an image recognition algorithm. Due to significant shifts in life caused by the pandemic, most previously offline jobs and services are now going online, with rapid digitization in the fields of education, home automation, and security. This may serve as a realization for many emerging fields.
The Alibaba Elastic Compute Service (ECS) has been used for simulating a smart home system in [25–29]. Edge computing technologies were used for the hardware architecture. Methodology wise, a clear classifier was used for distinguishing regular codes from mutated ones. It is usable for detecting mutated codes in the network. The dataset vector was used for categorizing them as either positive or negative; it was found that the Radial Basis Function (RBF)-function SVM algorithm showed the best performance. The study boosted the ability to detect network security issues in IoT systems and extended the application of machine learning.
Majumder et al. constructed a smart home-based IoT security system. A NoIR Pi Camera Module was used to enable a Raspberry Pi to function as a security system for taking movie and photo footages. Motion is detected via the PIR Motion Sensor. With the motion sensor data and photos captured via the NoIR Pi Camera Module, the researchers proposed the projection of security alerts utilizing the facial recognition classification introduced in our method. Users can be alerted of emergencies using this technology. This system can also identify security issues at 95.5% accuracy with 91% precision.
Using a classified DS2oS traffic traces dataset, a comparison is drawn between the performances of an ensemble machine learning model and a classical learning strategy for the detection of attacks and anomalies. The results derived from the anomaly detection can be optimized by merging the most effective models via the AdaBoost ensemble learning as performed by Khare et al. [1]. This study delineates the training process and the various evaluation models and metrics. Reference [30–32] combined the dynamic surface control (DSC) and minimal learning parameter (MLP) utilizing neural network approximators towards creating a smart home adaptive neural controller for ensuring security.
A machine learning model can be performed in a decentralized way by the blockchain utilizing a number of nodes performing certain computations. IoT device user modifications are possible with the usage of our technology in IoT-based smart homes. Singla et al. [33] extracted user activity rules from the devices’ logs using the distributed association rule mining algorithm. Using Ethereum blockchain-based tools, the system’s architecture is delineated and system simulation is carried out.
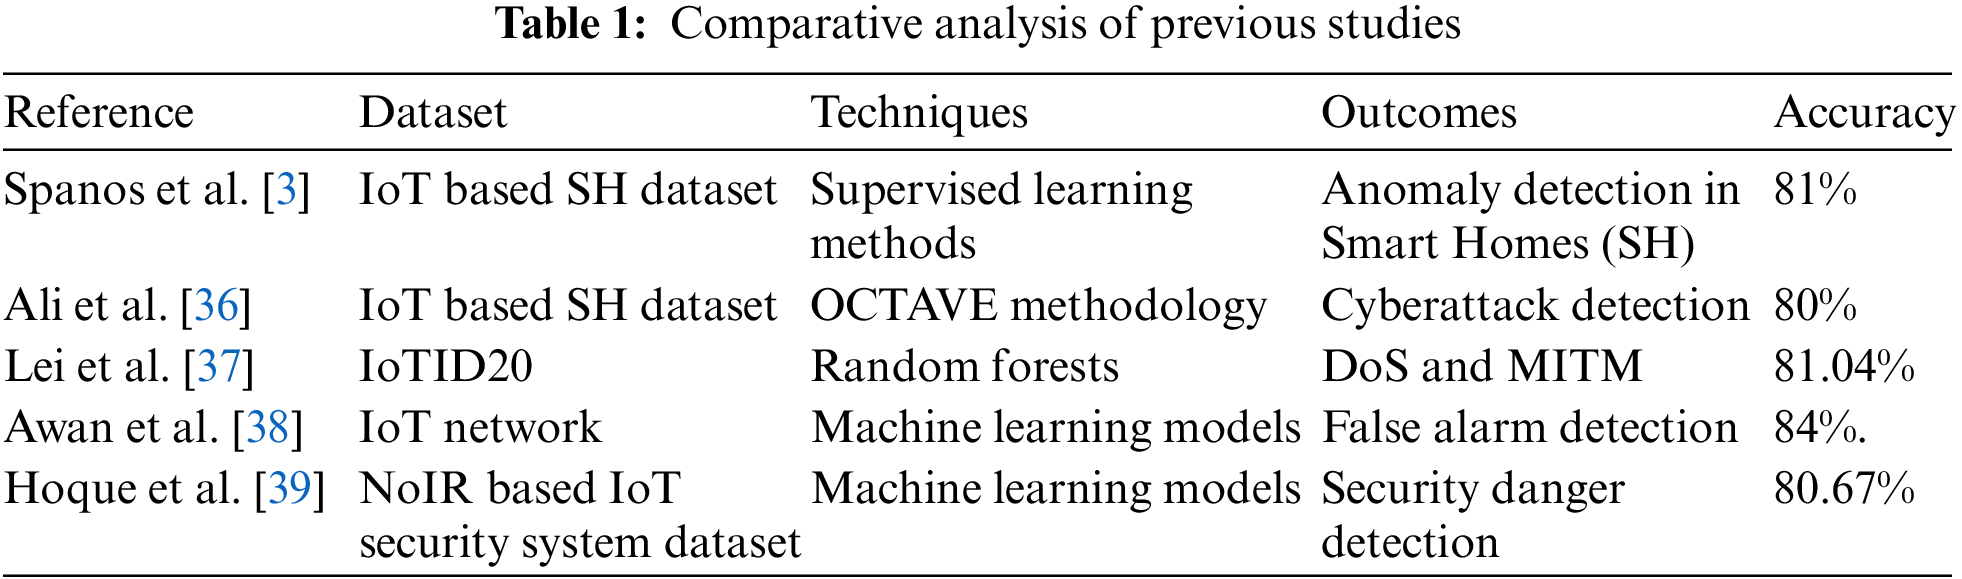
Reference [34] Created a novel smart OPH system with lower intrusion and higher cost effectiveness whilst examining each user’s life cycle. This method utilizes cost effective IoT devices for capturing non-intrusive home-based user and environmental data [35]. It then identifies the user’s day-to-day actions. Ultimately, it quantifies the user’s day-to-day cycles and offers useful advice for healthy living. Tab. 1 presents the comparison between past state-of-the-art works in the aspect of the accuracy of their machine learning classification models:
In this section, a detailed explanation of the dataset, technique, and evaluation measures is presented. Normalization and Scaling of Dataset are the pre-processing techniques used on the raw data obtained. Features extraction from the text data is done by utilizing feature engineering algorithms. Machine learning methods are used for assessing the model’s performance based on the pre-processed data.
Fig. 3 shows the three phases in this study and their respective events. The first phase entails the construction of the research questions and the lab preparation. The dataset contains both primary and secondary data. The second phase entails the classification of the IoT devices. Using the Cu index in the pre-processing step, features design and data adjustment are conducted (entailing null and category values). Following the balancing of the dataset, the third phase entails the construction of the classification model. The ensemble supervised machine learning approach is used for building the model. Measures including confidence matrix, accuracy, True Positive Ratio, False Positive Ratio, F-measure, and others are used for evaluating the model’s performance.
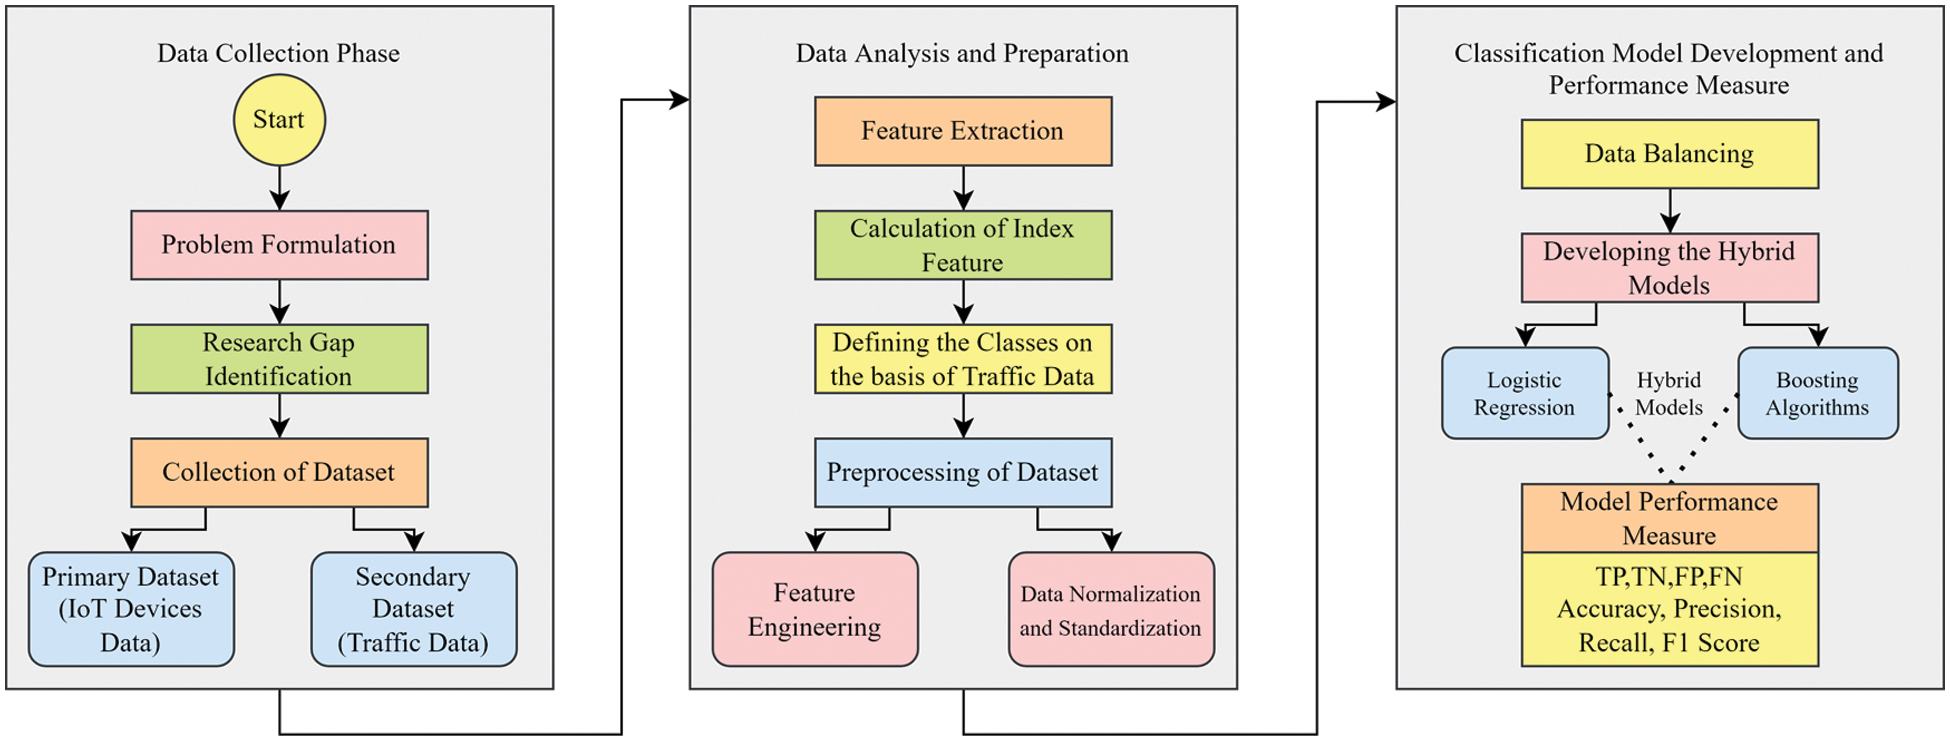
Figure 3: Proposed framework
3.1 Phase 1 (Data Collection Phase)
This phase entails the gathering of data from kaggle.com, an open source site. The dataset contains a number of independent variables and one dependent (outcome) variable. The primary dataset has 103.pcap files inclusive of all network activities. Meanwhile, 144 network traffic files are contained in the secondary dataset as produced by a variety of SHIoT devices, inclusive of 41 files with similar format to that of the primary dataset. This demonstrates the actual network traffic. All the data in the 144 files is representative of the web traffic volume produced for a certain day. Tab. 2 presents a list of the device categories, identifying whether the power supply is primary or secondary.

The variables’ standard deviation as well as minimum and maximum values are identified entailing the quantity of gathered packets, file size, total data gathered, average data transfer rate, and average packet size for every logical component. On top of that is the mean calculation. The aforementioned metrics are representative of the data’s characteristics. Based on the examples, the secondary dataset is shown to possess lower average packet size or higher overall size as compared to the primary dataset. The IoT devices’ datasets and attributes are highly heterogenic and diverse. Tab. 3 presents the properties of the primary data. All the information represents the overall quantity of files, traffic packets, and data bytes gathered within the 24 h. The file size and traffic volume (gathered data) are affected by the network traffic collection method (Wireshark).

In this phase, the raw data is collected. The gathered data is then cleansed by omitting duplicates, null values, and others.
Feature Engineering entails the leveraging of the data from a certain domain with the aim of building learning machine functions. It entails raw data analysis and transformation into machine-learning formats via the extraction of key attributes. This study uses a correlation matrix for determining the variables’ correlations. The construction of the SHIoT device categorization model entails the usage of single traffic filtering and a pcap file built via the device’s MAC address. The device’s IP address given by DHCP (Dynamic Host Configuration Protocol) servers may demonstrate periodic changes therefore making it an unreliable feature for filtering traffic to a single device. Each of the 41 SHIoT devices’ traffic characteristics incorporated in this study undergoes traffic flow monitoring. Traffic flow categorization is conducted by grouping packets with the same source, destination addresses, and communication ports and Transmission Control Protocol (TCP) or User Datagram Protocol (UDP). Based on the packet header’s amassed (statistical) data, traffic flow is observed whilst the analysis level depicts the source and destination communication. Packet-level traffic analysis requires greater processing power and storage size for data storing and analysis. The traffic flow volume and amount of packets sent by Google Chromecast (the device under study) within the 24-h period is found to be correlated.
3.2.2 Calculation of Index Feature
The ability to predict the behavior of IoT devices has been made possible by studies on the communication activities of IoT devices. As SHIoT devices have restricted abilities, the prediction of their behavior is highly probable over a certain period. Very few applications can be used on non-IoT connected devices. Meanwhile, IoT devices only depend on the end-users for communication-related activities. Consequently, SHIoT devices are predictable via the index of IoT device predictability (Cu index) over a certain period. An index (Cu) that approximates 0 becomes even more predictable, with lesser distinction from the amount of data received and delivered. The index feature can be calculated as:
The transformation of raw data to be usable is a key step in data mining. Behavior and pattern-wise, our data is typically partial, mismatched, or inadequate. The Cu index value is utilized for classifying the device based on the variation classification approach’s coefficients. The assumption is that the data is normally distributed. As the Cu index distribution value skews left, the data is hence transformed. Via the Ladder of Powers approach, the researchers found the most suitable data transformation function for constructing a normal distribution.
Normalization is commonly practiced in machine learning data preparation. To achieve consistency, the data must be normalized to a standard scale without any number distortions or information compromise.
3.3 Phase 3 (Classification Model Development)
An obstacle to accurate predictive modelling is when the classifications are not balanced. Machine learning algorithms typically utilize the same number of examples for every class. This leads to inaccuracies in the models, particularly when it involves minorities which is a significant issue as the minorities are more vital and more vulnerable to classification errors as compared to the majority group. Resultantly, the outliers can be eliminated from the sample and the dataset retrieved into line. As a result of this study, more highly refined resampling algorithms have been offered. For instance, a majority of class records can be aggregated under sampling for information preservation purposes via the extraction of records from every cluster. Rather than constructing precise replicas of the minority class data, minute changes can be introduced during the sampling process, thus yielding highly differentiated synthetic samples. Data mining necessitates a dataset that is well-balanced and uniformed. “Outliers” can exist in a dataset. Outliers are data of which values are distinct from those in the entire dataset. The SMOTE technique is used to normalize the outlier so as to manage the imbalanced dataset.
Outliers occur due to misreading, defective devices, or human error. Hence, they must be dropped from the dataset prior to running research or statistical tests. Outliers can result in fractional or incorrect outcomes, thus disrupting the analysis and further processing. Outliers can be eliminated by using the Interquartile Range (IQR) approach in cases where the data boxplot goes beyond the set range. The discrepancy refers to how far apart the IQRs’ upper quartile is from the lower quartile. This study uses the statistical approaches of IQR, Z-Score, and Data Smoothing for identifying outliers. The IQR is calculated using the first quartile (Q1) and third quartile (Q3) of the dataset namely the 25th and 75th percentiles.
3.4 Phase 4 (Hybrid Classification Algorithms)
This depends on a few complementary categorization methods. The conclusion to the classification is according to a single method for solving numerous tasks. The categorization of IoT devices is based on the volume of data sent and received. The sub-sections below present the justification for each model.
This model entails the assembly of the logistic regression model into the XGBoost Classifier for improving the accuracy of both the models. Below is the mathematical calculation of the Logi-XGB Classification model:
P refers to the Logistic Regression’s probability function whilst Y refers to the XGBoost classification model’s output.
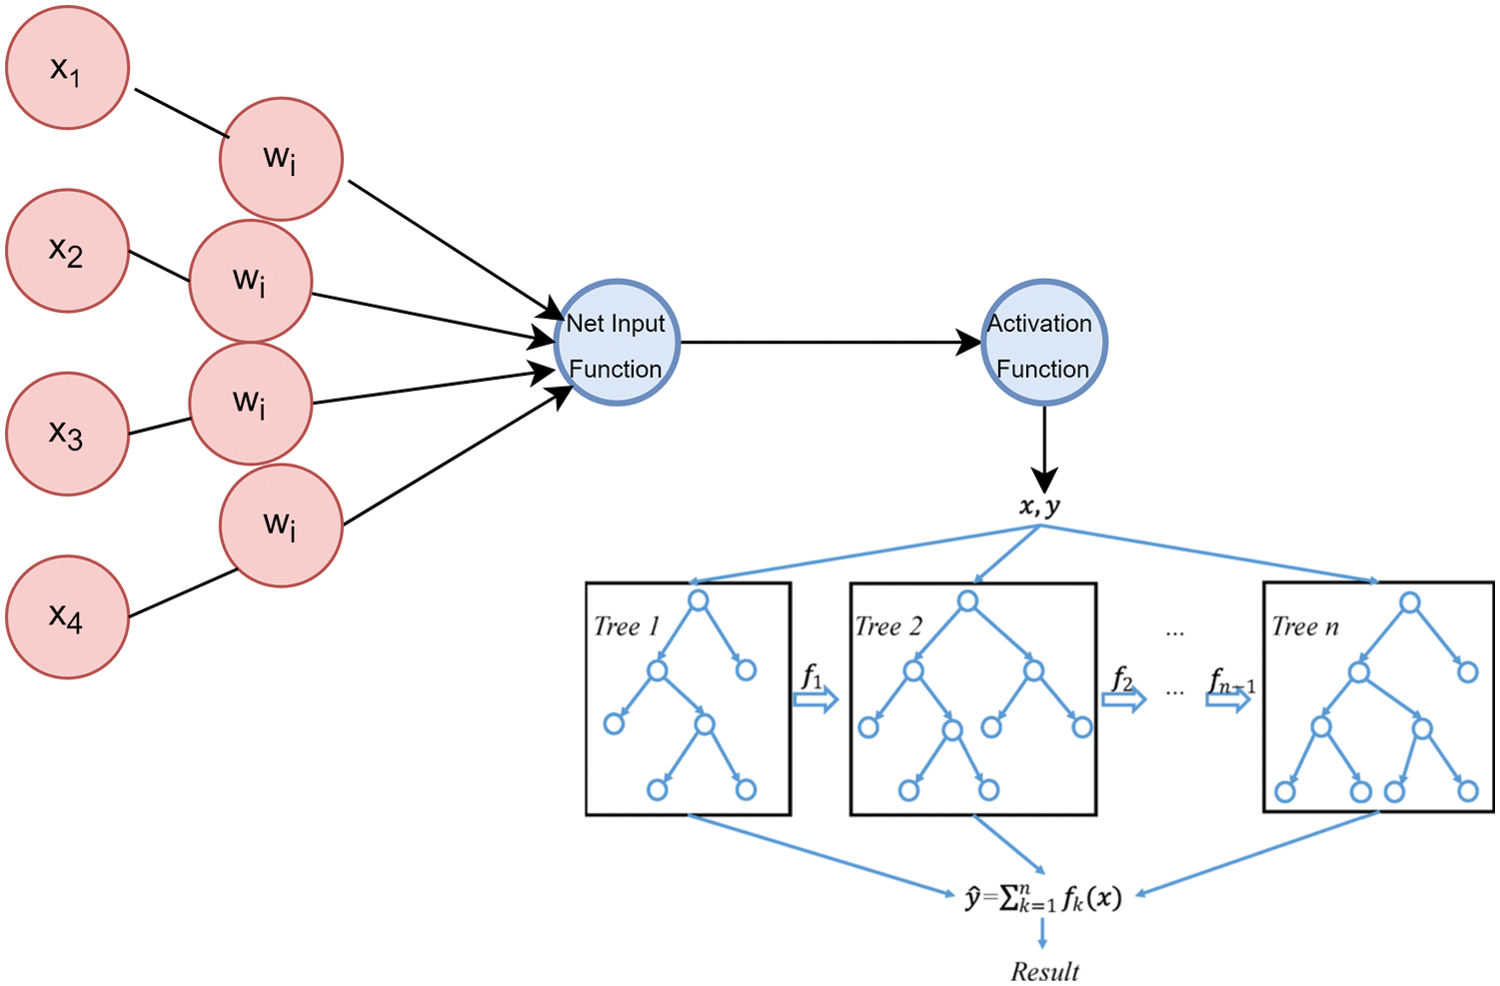
Figure 4: Hybrid classifier (Logi-XGB classification) model
This model entails the assembly of the logistic regression model into the Gradient Boosting Classifier for improving the accuracy of both the models. Below is the mathematical calculation for the Logi-GBC Classification model:
P refers to the Logistic Regression’s probability function whilst
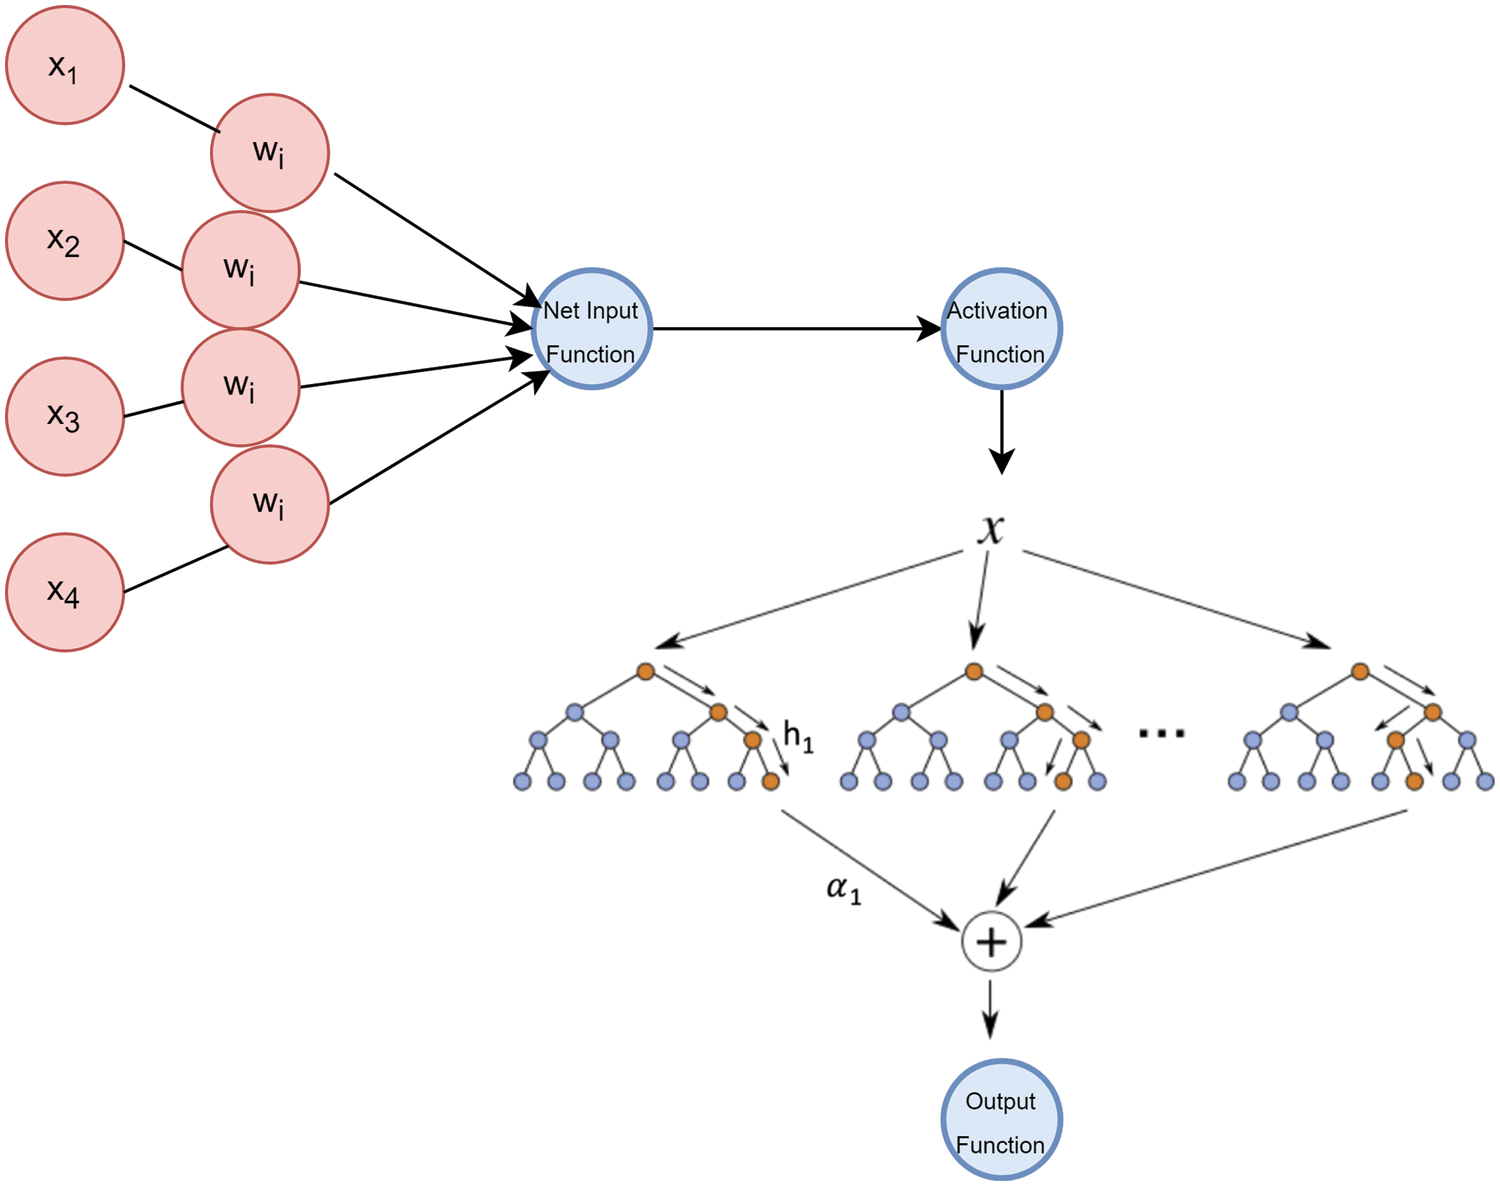
Figure 5: Hybrid classifier (Logi-GBC classification) model
This model entails the assembly of the logistic regression model into the AdaBoost Classifier for improving the accuracy of both the models. Below is the mathematical calculation of the Logi-ABC Classification model:
P refers to the Logistic Regression’s probability function whilst y refers to the ABC classification model’s output.
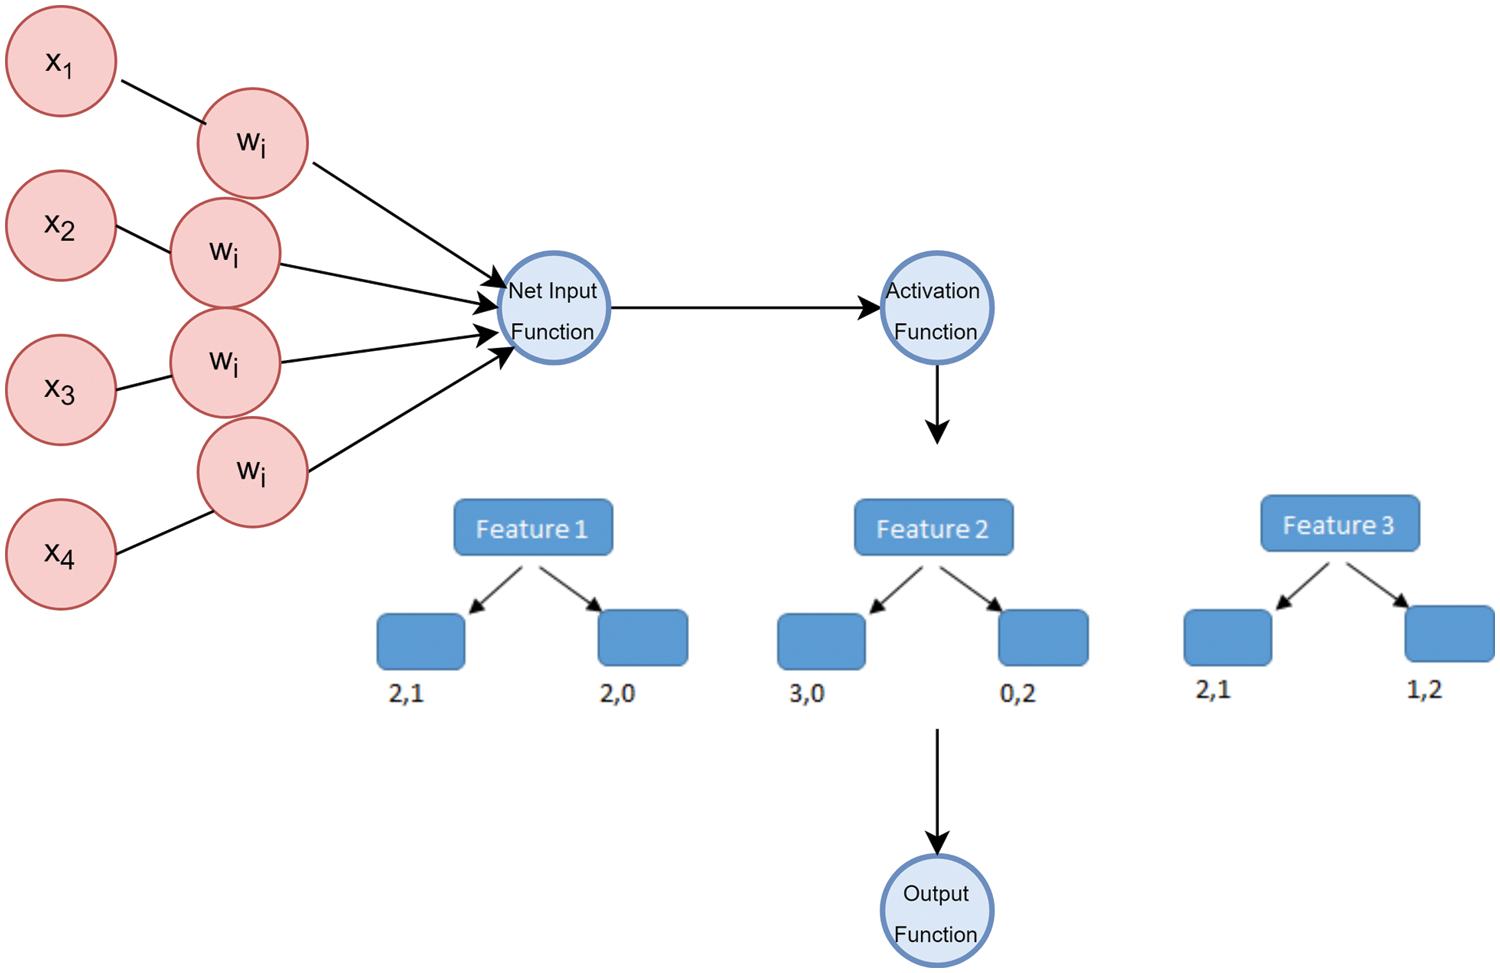
Figure 6: Hybrid classifier (Logi-ABC classification) model
This model entails the assembly of the logistic regression model into the CatBoost Classifier for improving both their accuracies. The following is the mathematical calculation for the Logi-CBC Classification model:
Firstly, the model is initialized as,
For m = 1 to M, the residuals are calculated.
Next, the base leaner is fitted to calculate it along with the pseudo residuals:
Updated Model will be:
P entails the Logistic Regression’s probability function whilst y refers to the CBC classification model’s output.
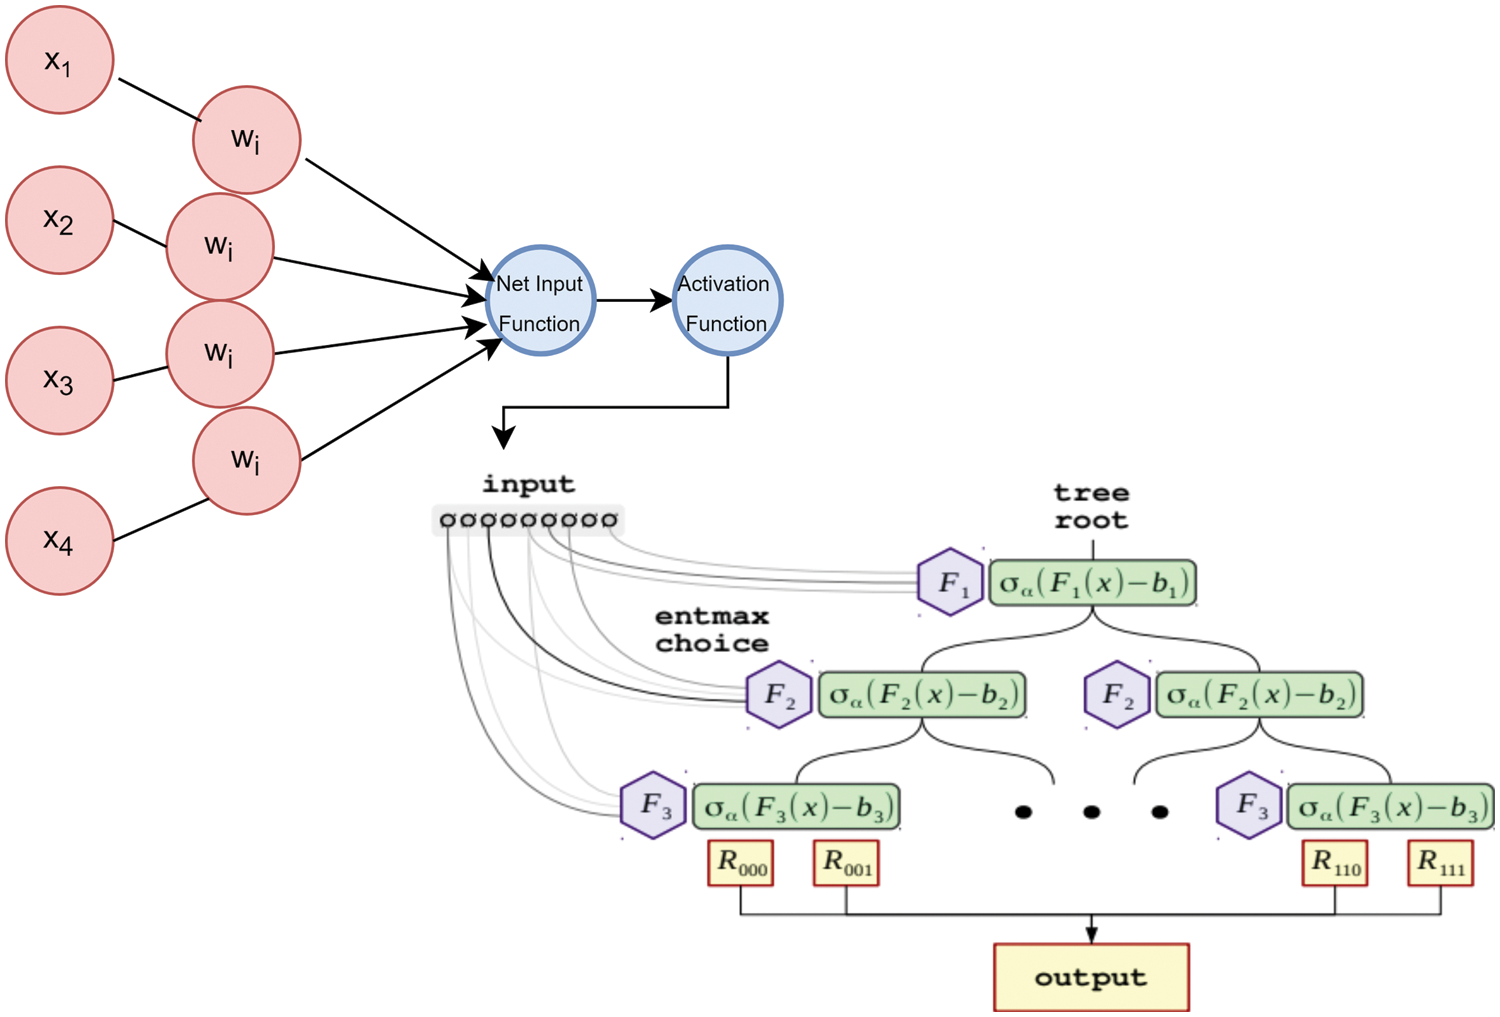
Figure 7: Hybrid classifier (Logi-CBC classification) model
This model entails the assembly of the logistic regression model into the Light-Gradient Boosting Model Classifier for improving both their accuracies. Below is the mathematical calculation of the Logi-LGBM Classification model:
P refers to the Logistic Regression’s probability function whilst y refers to the LGBM classification model’s output.
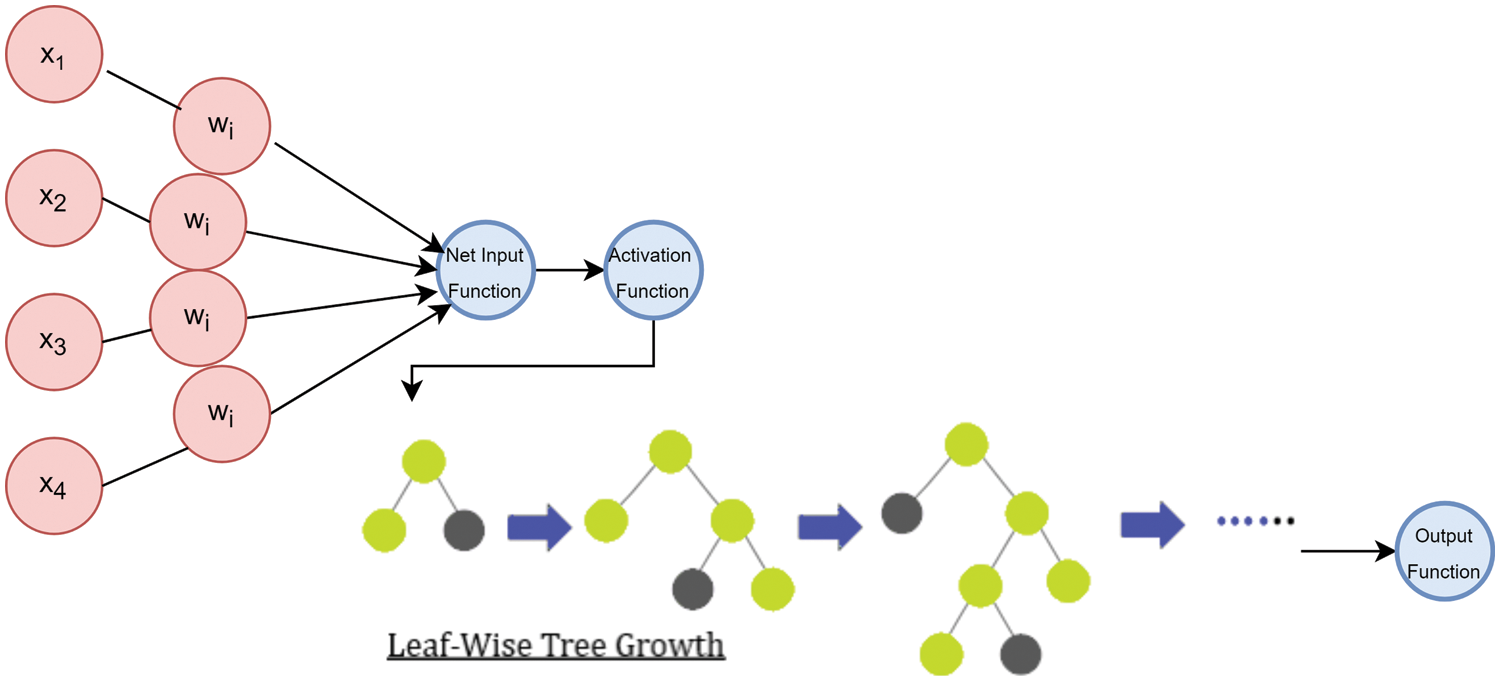
Figure 8: Hybrid classifier (Logi-LGBM classification) model
This model entails the assembly of the logistic regression model into the Histogram Gradient Boosting Classifier for improving both their accuracies. Below is the mathematical calculation for the Logi-HGBC Classification model:
P refers to the Logistic Regression’s probability function whilst y is the HGBC classification model’s output.
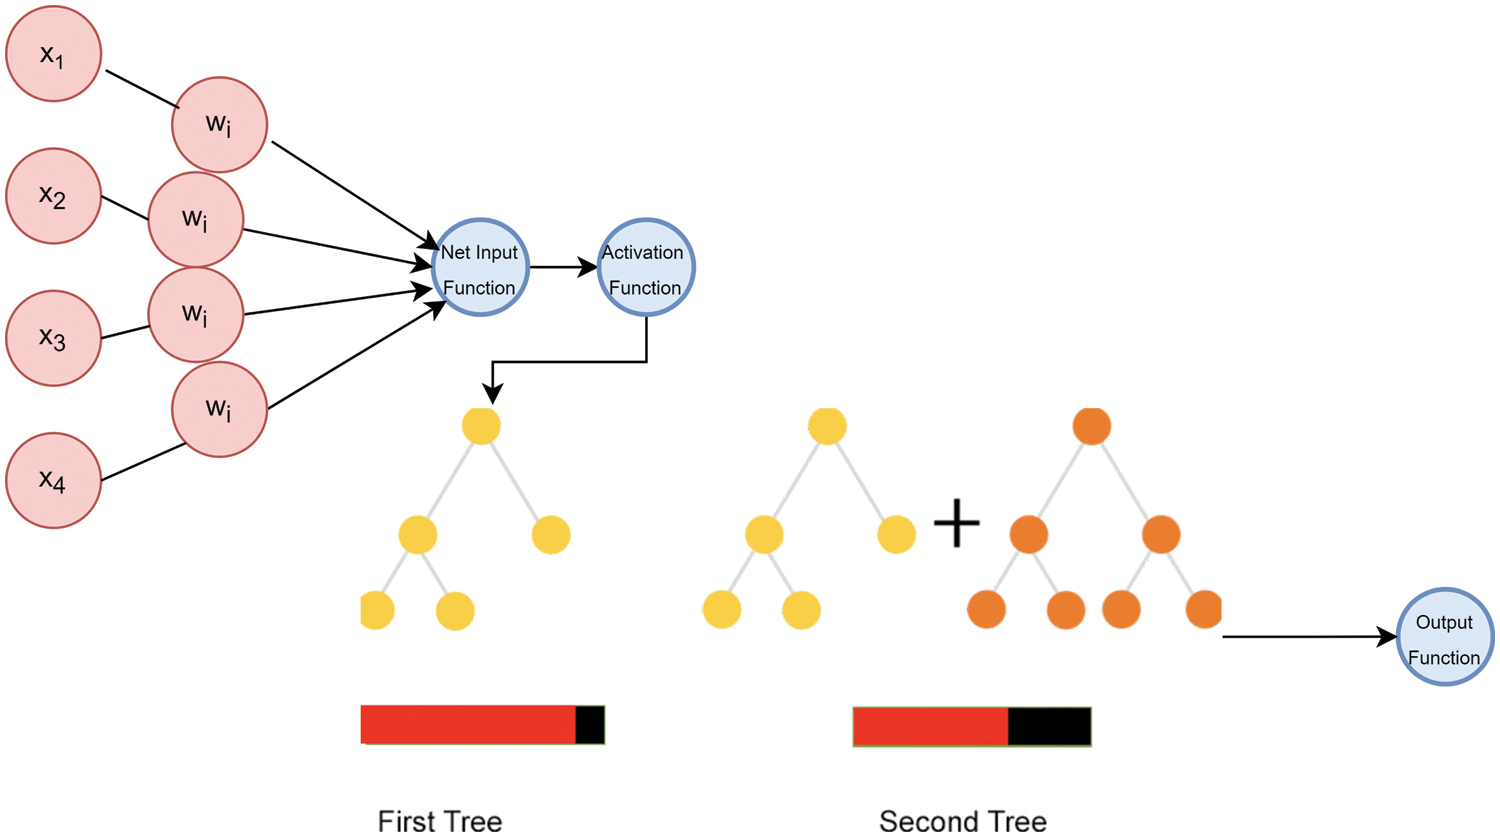
Figure 9: Hybrid classifier (Logi-HGBC classification) model
The accuracy of the system is determined by evaluating the F1 Score and accuracy measures. The confusion matrix indicates whether the clauses have been classified or misclassified. Tab. 3 shows the the metrics used in this study.
The class of a device is ascertained by performing a 10-day analysis of the network flow data. The SHIoT devices’ traffic flow feature vectors are grouped by class. The SHIoT traffic flows generated for a set period is determined by the SHIoT’s characteristics. As indicated above, for the initial dataset, 681,684 feature vectors are grouped into four classes. Fig. 10 shows the class imbalance and balance for the traffic flow classes:
Resultantly, most of the classes in the dataset are under-sampled for developing a classification model. The initial dataset entails each device’s traffic flow. Prior to the model’s creation, it is crucial to stratify the classes to prevent model bias in the classes with the highest number of feature vectors. Following stratification, there are 117,423 feature vectors left which are used to build the classification model. This section shows the log boosted algorithms’ performance via the various performance metrics. Meanwhile, Logi-CBC has a hybrid model accuracy of 82.66%, the greatest in the industry. Logi-LGBM and Logi-HGBC reached an 81.37% accuracy, while Logi-GBC and Logi-XGB each obtained 77.8% and 78.7% accuracy.
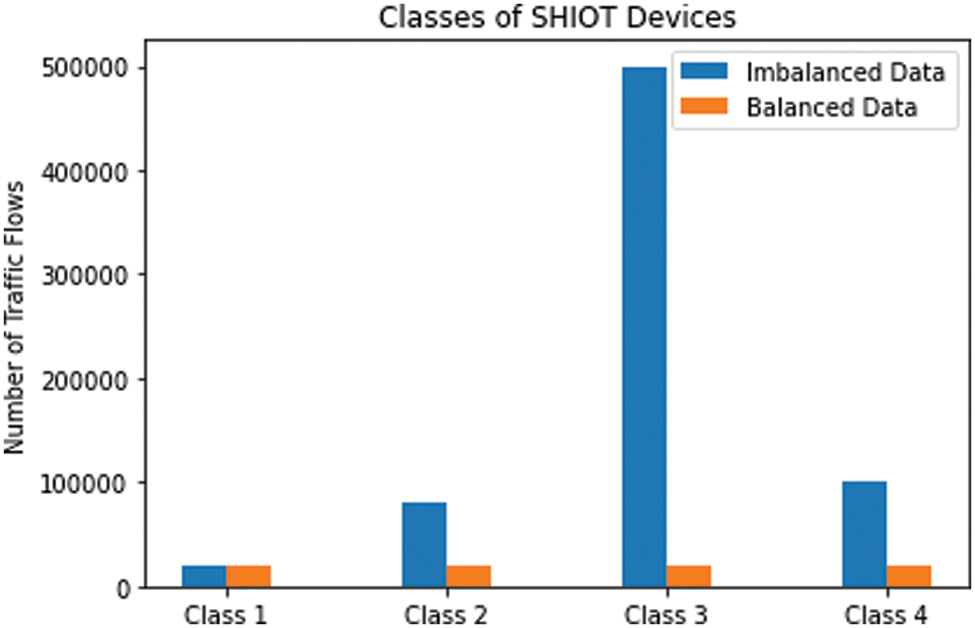
Figure 10: Classes of SHIOT devices
Hybrid Model Logi-XGB
The combination of these two models is for the purpose of increasing their accuracies in a simultaneous manner by utilizing the XGBoost Classifier. The probability function of the logistics regression is fed with the data derived from y by XGB. One independent study on LOGISTIC REGRESSION revealed that 69.2% of the time, this accuracy is raised by the hybrid classifier to 80.2%. Fig. 11 shows the depiction of the hybrid Logi-XGB Classification Model’s performance.
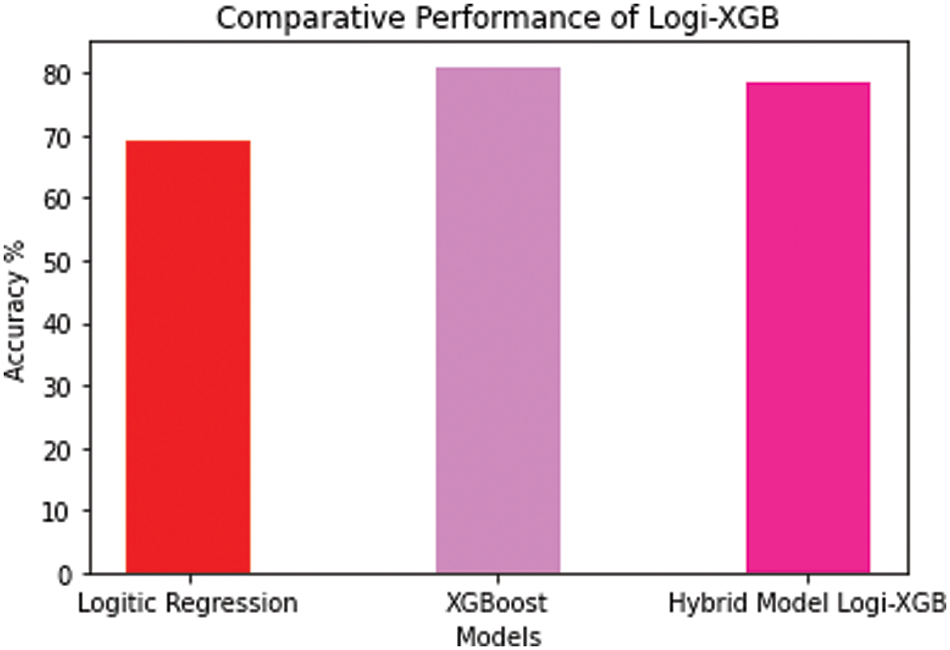
Figure 11: Logi-XGB classification model performance
Fig. 12 illustrates the Logi-XGB Classification Model’s confusion matrix with 19 True Negatives, 2 False Positives, 9 False Negatives and 3 True Positives.
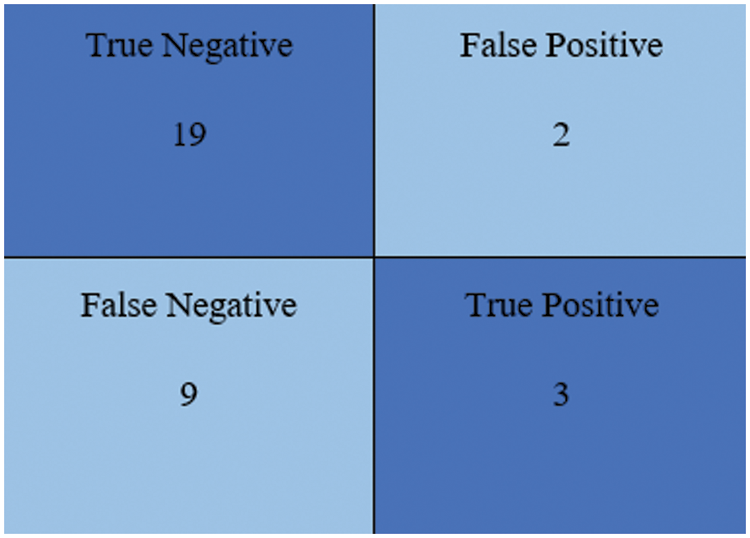
Figure 12: Confusion matrix for the Logi-XGB classification model
Hybrid Model Logi-GBC
It is imperative to combine the logistic regression and gradient boosting classifier models to improve their respective accuracies i.e., how the model is developed following the GBC’s receipt of the y output. Fig. 13 depicts the hybrid Logi-GBC Classification Model’s performance, with 78.7% accuracy.

Figure 13: Logi-GBC classification model performance
Fig. 14 illustrates the Logi-GBC Classification Model’s confusion matrix with 18 True Negatives, 2 False Positives, 9 False Negatives and 7 True Positives.
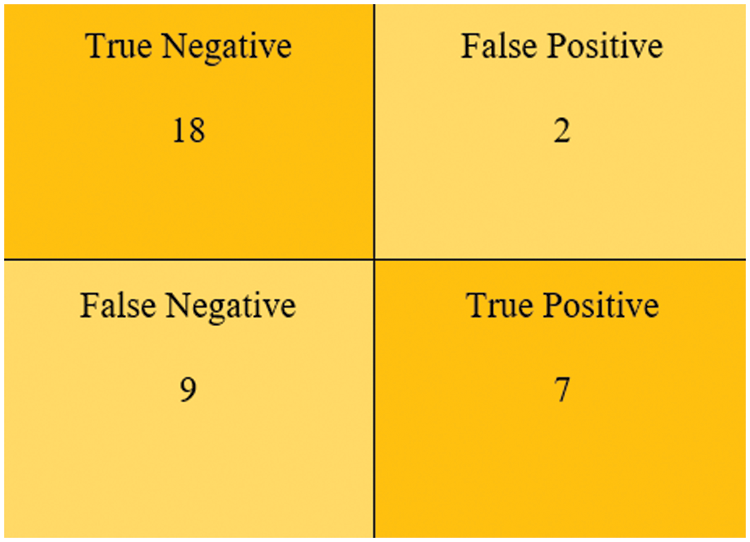
Figure 14: Confusion matrix for the Logi-GBC classification model
Hybrid Model Logi-ABC
The AdaBoost Classifier along with the logistic regression model are used to improve their respective accuracies. It is referred to the logistic regression’s probability. Fig. 15 shows the hybrid Logi-ABC Classification Model’s performance, at an accuracy rate of 80.33%:
Fig. 16 demonstrates the Logi-ABC Classification Model’s confusion matrix with 19 True Negatives, 8 False Positives, 2 False Negatives and 2 True Positives.
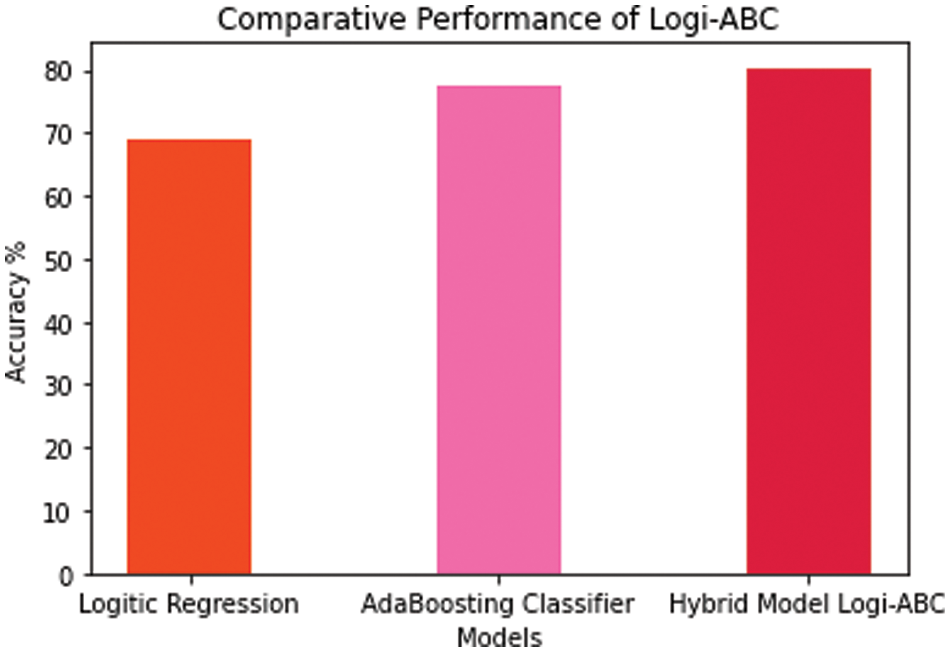
Figure 15: Logi-ABC classification model performance
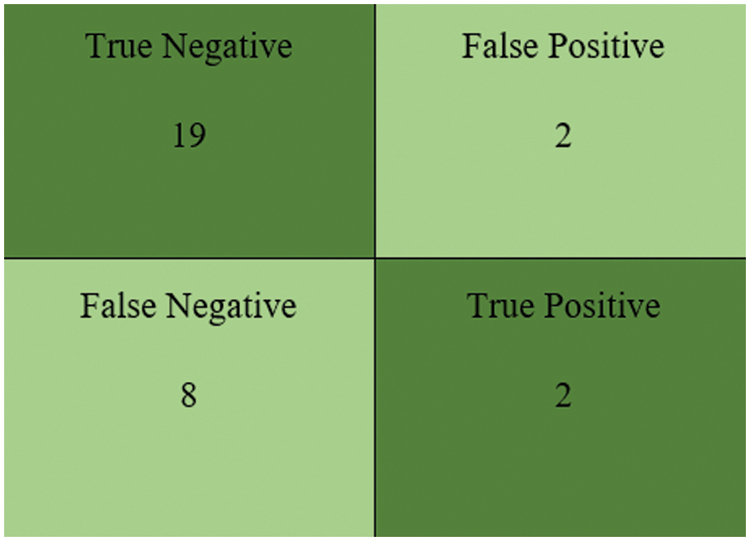
Figure 16: Confusion matrix for the Logi-ABC classification model
Hybrid Model Logi-CBC
Both models’ accuracies are improved by combining the logistic regression model with the CatBoost Classifier. Upon the CBC taking the y output as L(y, F (M-1) (x)), it is deployed to the probability function of the logistic regression to be classified. As the date of this report, the Logi-CBC is identified to have the highest accuracy at 85.66%. Fig. 17 depicts the hybrid Logi-CBC Classification Model:
Fig. 18 depicts the Logi-CBC Classification Model’s confusion matrix with 19 True Negatives, 2 False Positives, 7 False Negatives and 7 True Positives.
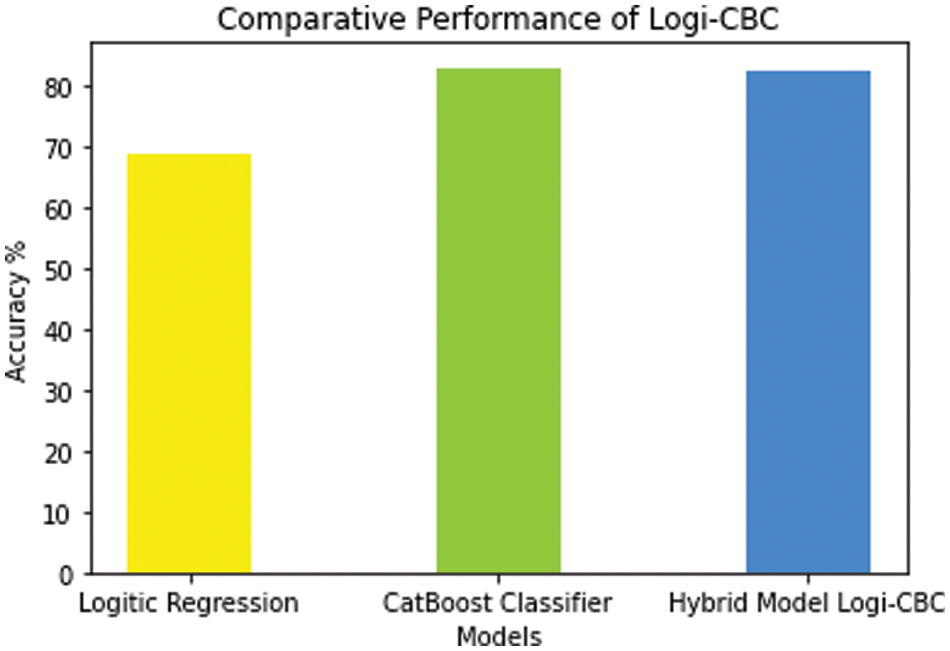
Figure 17: Logi-CBC classification model performance
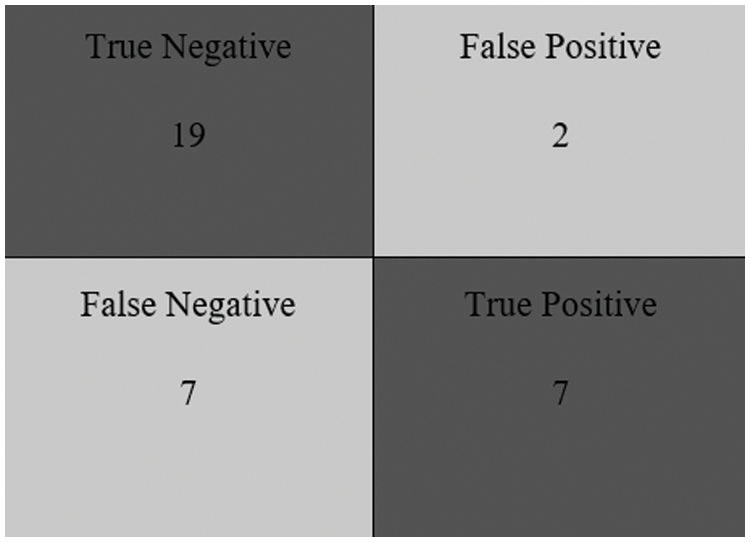
Figure 18: Confusion matrix for the Logi-CBC classification model
Hybrid Model Logi-LGB
Both models’ accuracy can be boosted via their integration. Next, the LGBM utilizes the logistic regression’s likelihood function for classifying the attacks. Fig. 19 depicts the hybrid Logi-LGBM Classification Model’s performance, at 81.37% accuracy rate:
Fig. 20 depicts the Logi-LGB Classification Model’s confusion matrix with 18 True Negatives, 2 False Positives, 2 False Negatives and 7 True Positives.
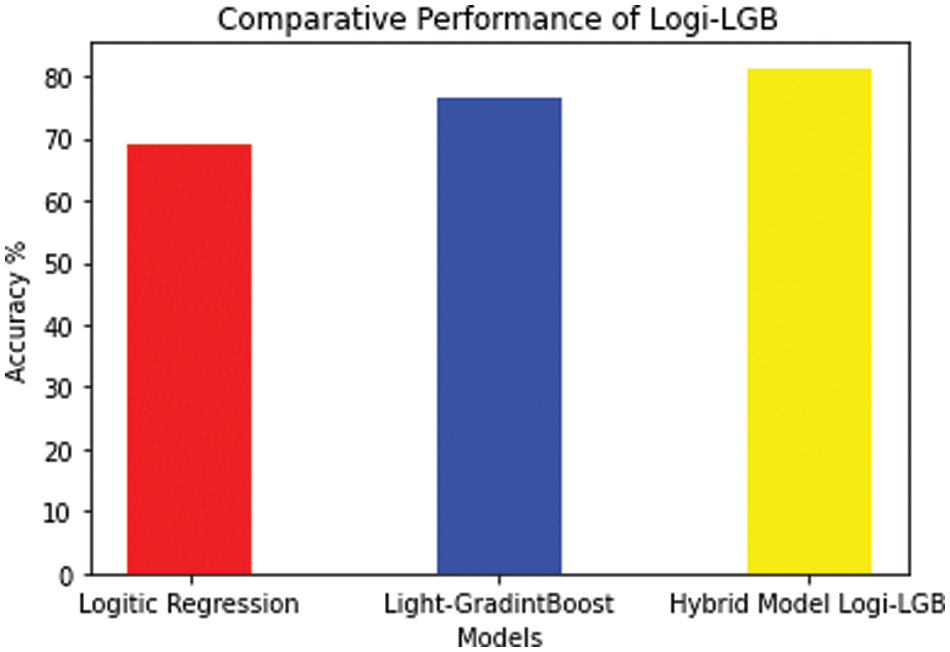
Figure 19: Logi-LGB classification model performance
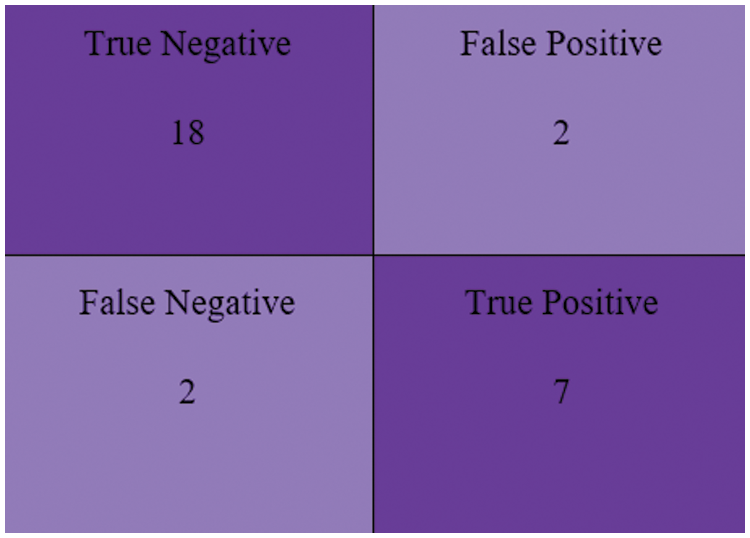
Figure 20: The confusion matrix of Logi-CBC classification model
Hybrid Model Logi-HBC
This model is created by combining the logistic regression model with the Histogram Gradient Boosting Classifier for boosting their respective accuracies. Upon receipt of the logistic regression’s probability function by the HGBC, an evaluation is carried out to determine any changes to the class. Fig. 21 shows the performance of the hybrid Logi-HGBC Classification Model, with an 81.37% accuracy rate.

Figure 21: Logi-HGBC classification model performance
Fig. 22 depicts the Logi-HGBC Classification Model’s confusion matrix with 19 True Negatives, 2 False Positives, 9 False Negatives and 3 True Positives.
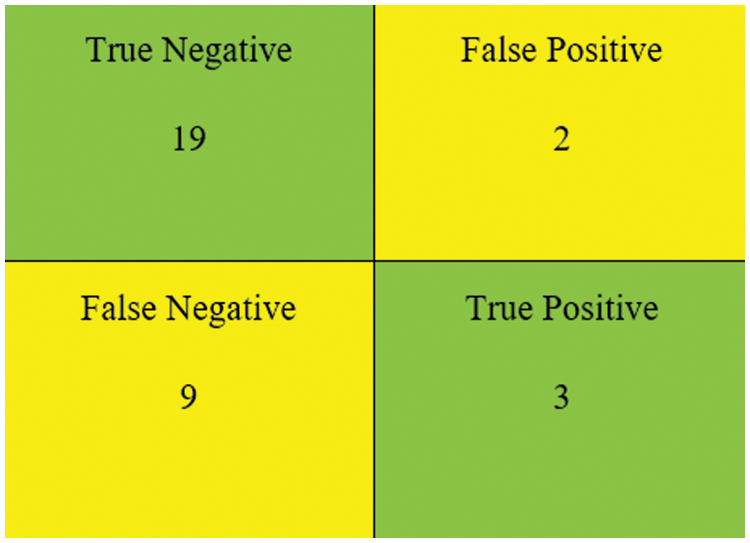
Figure 22: The confusion matrix of Logi-HGBC classification model
Comparative Analysis
Tab. 4 depicts each model’s accuracy percentage. Logi-CBC showed the most accuracy in the hybrid models at 85.66%, followed by Logi-LGBM and Logi-HGBC at 81.37%. Logi-GBC showed poor accuracy at 77.80%, whilst Logi-XGB at 80.20%. Tab. 4 shows the comparative analysis of the proposed models.
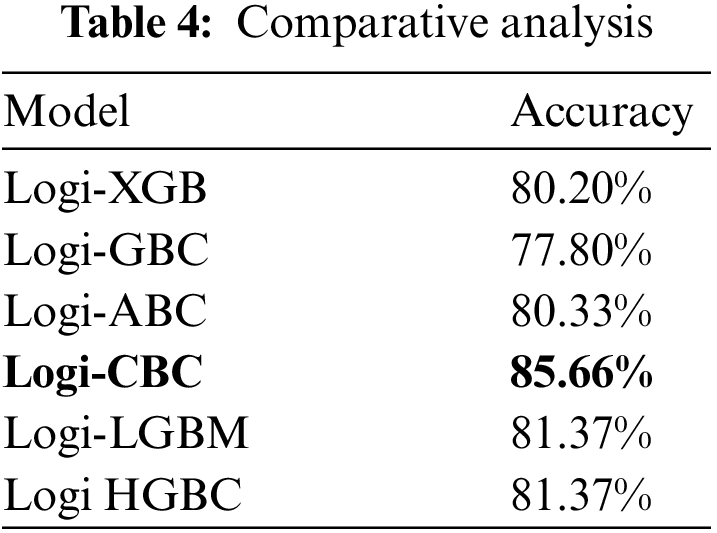
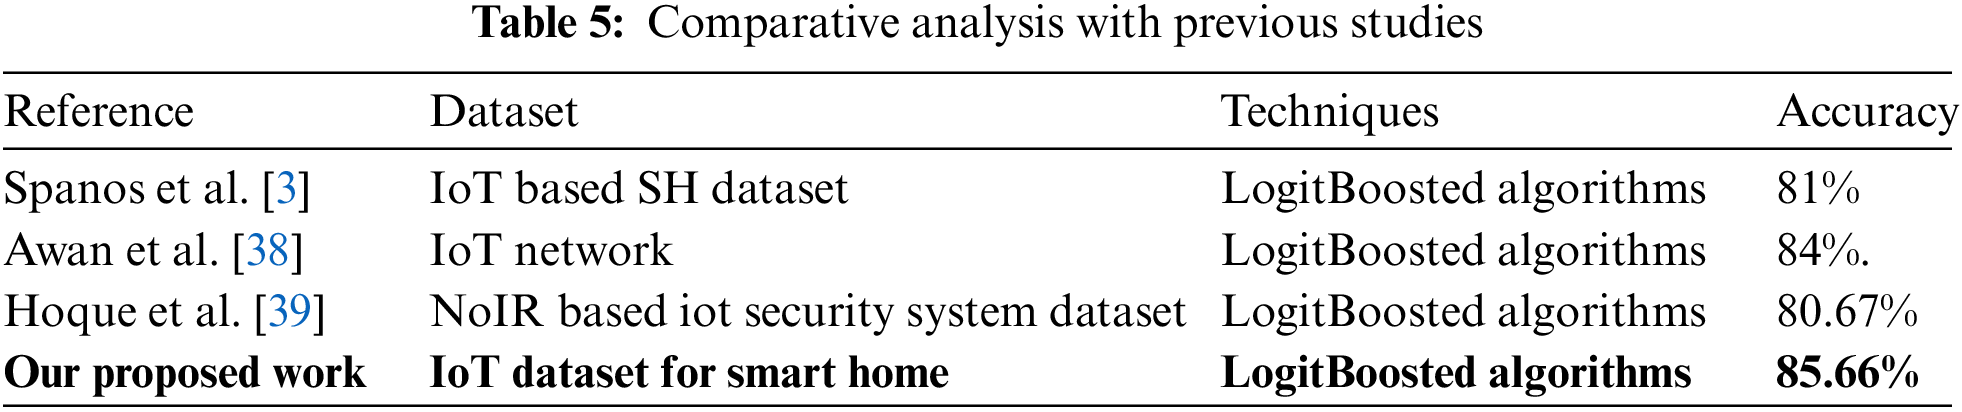
We also ran comparisons between our model and past Logitboosted algorithms utilized in past state-of-the-art models as illustrated in Tab. 5.
According to this study, IoT devices may be tracked via network traffic created by the devices. IoT device categorization in a smart home context is the goal of this study, using traffic ratio coefficient of variation to measure the predictability of IoT device behavior. This research was successful in achieving this goal. According to current scientific thinking, it is possible to classify IoT devices using supervised machine learning methods while also taking into account traffic characteristics created by IoT devices in smart homes, which forms the basis for this project’s research and eventual success. Four distinct devices could be identified by the coefficient of variation ratio between the traffic received and traffic sent. The classification approach for IoT devices was based on defining classes. As a result, the dataset’s majority class was underrepresented before the classification model was built. The traffic flow of a single device was considered in the initial dataset. This step is crucial for avoiding model bias in classes with many feature vectors. There are 117,423 feature vectors in total after the stratification of all the dataset’s feature vectors, which will improve the classification model even further. The performance of the logiboosted algorithms has been shown under this section using numerous metrics. The study found that Logi-CBC had the highest accuracy in the hybrid models, at 82.66%. Logi-LGBM and Logi-HGBC both obtained an accuracy of 81.37% after utilizing this mode. However, Logi-GBC reached 77.8% whilst Logi-XGB achieved 78.7% once this mode was implemented.
According to a study, new and unfamiliar devices and the traffic flow they generate can be effectively classified using boosting methods of machine learning. Additionally, it satisfies the emerging criteria of the IoT. Each device’s traffic profile cannot be known (or would demand large resources) because of the exponential growth in the number of devices. However, it suffices to know the device’s class. If successful, this groundbreaking strategy could open the way for several other activities and research projects in the IoT concept problem space. The findings and conclusions from this research can be used in future studies to detect anomalies in communication networks caused by IoT devices.
In addition, the developed model could possess real-world applications as a software solution that can enhance the capability of current solutions for device and network monitoring and control in an IoT environment. Using this approach, device groups with similar communication patterns can be monitored and managed in the network. It can also forecast the capacity of various types of devices in the future and do other comparable tasks. This type of solution is only applicable in a restricted number of cases. A basis for future studies and real-world applications and services will be built based on the outcomes of this research.
Funding Statement: The author received no specific funding for this study.
Conflicts of Interest: The author declares that they have no conflicts of interest to report regarding the present study.
References
1. S. Khare and M. Totaro, “Ensemble learning for detecting attacks and anomalies in IoT smart home,” in Proc. of 3rd Int. Conf. on Data Intelligence and Security ICDIS 2020, South Parde Island, TX, USA, pp. 56–63, 2020. [Google Scholar]
2. I. Machorro-Cano, G. Alor-Hernandez, M. Paredes-Valverde, L. Regriguez-Mazahua, J. Sanchez-Cervantes et al. “HEMS-IoT: A big data and machine learning-based smart home system for energy saving,” Energies, vol. 13, no. 5, pp. 3133–31682020. [Google Scholar]
3. G. Spanos, K. M. Giannoutakis, K. Votis and D. Tzovaras, “Combining statistical and machine learning techniques in IoT anomaly detection for smart homes,” in IEEE Int. Workshop on Computer Aided Modeling Design of Communication Links and Networks, CAMAD, Limassol, Cyprus, vol. 2019-Septe, pp. 1–6, 2019. [Google Scholar]
4. A. Sivanathan, H. Gharakheili, F. Loi, A. Radford, C. Wijenayake et al., “Classifying IoT devices in smart environments using network traffic characteristics,” IEEE Transactions on Mobile Computing, vol. 18, no. 8, pp. 1745–1759, 2019. [Google Scholar]
5. C. Stolojescu-Crisan, C. Crisan and B. P. Butunoi, “An IoT-based smart home automation system,” Sensors, vol. 21, no. 11, pp. 1–23, 2021. [Google Scholar]
6. H. Yar, A. Imran, Z. Khan, M. Sajjad and Z. Kastratim, “Towards smart home automation using IoT-enabled edge-computing paradigm,” Sensors, vol. 21, no. 14, pp. 4932–4955, 2021. [Google Scholar]
7. S. Mahmud, S. Ahmed and K. Shikder, “A smart home automation and metering system using internet of things (IoT),” in 1st Int. Conf. on Robotics, Electrical and Signal Processing Techniques ICREST 2019, Dhaka, Bangladesh, pp. 451–454, 2019. [Google Scholar]
8. I. Ullah and Q. H. Mahmoud, “Network traffic flow based machine learning technique for IoT device identification,” in 15th Annual IEEE Int. Systems Conf. SysCon 2021, USA, Virtual Conference, 2021. [Google Scholar]
9. A. Rathore, C. Xu, W. Zhu, A. Daiyan, K. Wang et al., “Scanning the voice of your fingerprint with everyday surfaces,” IEEE Transactions on Mobile Computing, vol. 1233, no. c, pp. 1–18, 2021. [Google Scholar]
10. I. Cvitić, D. Peraković, M. Periša and B. Gupta, “Ensemble machine learning approach for classification of IoT devices in smart home,” International Journal of Machine Learning and Cybernetics, vol. 12, no. 11, pp. 3179–3202, 2021. [Google Scholar]
11. A. Zainab, S. S. Refaat and O. Bouhali, “Ensemble-based spam detection in smart home IOT devices time series data using machine learning techniques,” Information, vol. 11, no. 11, pp. 344–359, 2020. [Google Scholar]
12. A. Makkar and N. Kumar, “An efficient deep learning-based scheme for web spam detection in IoT environment,” Future Generation Computer System, vol. 108, pp. 467–487, 2020. [Google Scholar]
13. A. Ibrahim, “Forecasting the early market movement in bitcoin using twitter’s sentiment analysis: An ensemble-based prediction model,” in 2021 IEEE Int. IOT, Electronics and Mechatronics Conf. IEMTRONICS 2021, Toronto, Canada, 2021. [Google Scholar]
14. T. Li, Z. Hong and L. Yu, “Machine learning-based intrusion detection for IoT devices in smart home,” in IEEE Int. Conf. on Control and Automation ICCA, Singapore, Virtual Conference, vol. 2020-Octob, pp. 277–282, 2020. [Google Scholar]
15. E. Anthi, L. Williams, M. Slowinska, G. Theodorakopoulos and P. Burnap, “A aupervised intrusion detection system for smart home IoT devices,” IEEE Internet of Things Journal, vol. 6, no. 5, pp. 9042–9053, 2019. [Google Scholar]
16. P. Maniriho, E. Niyigaba, Z. Bizimana, V. Twiringiyimana, L. J. Mahoro et al., “Anomaly-based intrusion detection approach for IoT networks using machine learning,” in CENIM 2020 Int. Conf. on Computer Engineering, Network, and Intelligent Multimedia, Surabaya, Indonesia, pp. 303–308, 2020. [Google Scholar]
17. N. K. Sahu and I. Mukherjee, “Anomaly detection in IoT network,” in 4th Int. Conf. on Trends in Electronics and Informatics, Tirunelveli, India, pp. 787–794, 2020. [Google Scholar]
18. U. M. Aïvodji, S. Gambs and A. Martin, “IOTFLA: AA secured and privacy-preserving smart home architecture implementing federated learning,” in IEEE Symp. on Security and Privacy Workshops SPW 2019, San Francisco, CA, USA, pp. 175–180, 2019. [Google Scholar]
19. H. T. Hsu, G. J. Jong, J. H. Chen and C. G. Jhe, “Improve IoT security system of smart-home by using support vector machine,” in 4th Int. Conf. on Computing, Communications and Security ICCCS 2019, Rome, Italy, pp. 674–677, 2019. [Google Scholar]
20. E. D. Alalade, “Intrusion detection system in smart home network using artificial immune system and extreme learning machine hybrid approach,” IEEE World Forum Internet Things, WF-IoT 2020, Virtual Forum, pp. 20–21, 2020. [Google Scholar]
21. S. M. He, K. Xie, K. X. Xie, C. Xu and J. Wang, “Interference-aware multisource transmission in multiradio and multichannel wireless network,” IEEE Systems Journal, vol. 13, no. 3, pp. 2507–2518, 2019. [Google Scholar]
22. Y. S. Luo, K. Yang, Q. Tang, J. Zhang and B. Xiong, “A multi-criteria network-aware service composition algorithm in wireless environments,” Computer Communications, vol. 35, no. 15, pp. 1882–1892, 2012. [Google Scholar]
23. V. Pandimurugan, A. Jain and Y. Sinha, “IoT based face recognition for smart applications using machine learning,” in 3rd Int. Conf. on Intelligent Sustainable Systems ICISS 2020, Coimbatore, India, pp. 1263–1266, 2020. [Google Scholar]
24. B. Yin and X. T. Wei, “Communication-efficient data aggregation tree construction for complex queries in IoT applications,” IEEE Internet of Things Journal, vol. 6, no. 2, pp. 3352–3363, 2018. [Google Scholar]
25. S. Hou and X. Huang, “Use of machine learning in detecting network security of edge computing system,” in 4th IEEE Int. Conf. on Big Data Analsis ICBDA 2019, Suzhou, China, pp. 252–256, 2019. [Google Scholar]
26. B. Yin and J. Lu, “A cost-efficient framework for crowdsourced data collection in vehicular networks,” IEEE Internet of Things Journal, vol. 8, no. 17, pp. 13567–13581, 2021. [Google Scholar]
27. D. Cao, B. Zheng, B. Ji, Z. Lei and C. Feng, “A robust distance-based relay selection for message dissemination in vehicular network,” Wireless Networks, vol. 26, no. 3, pp. 1755–1771, 2020. [Google Scholar]
28. Z. Xu, W. Liang, K. C. Li, J. Xu and H. Jin, “A blockchain-based roadside unit-assisted authentication and key agreement protocol for internet of vehicles,” Journal of Parallel and Distributed Computing, vol. 149, pp. 29–39, 2021. [Google Scholar]
29. Z. Xu, X. Li, J. Xu, W. Liang and K. K. R. Choo, “A secure and computationally efficient authentication and key agreement scheme for internet of vehicles,” Computers & Electrical Engineering, vol. 95, pp. 107409, 2021. [Google Scholar]
30. Z. Liu, X. Dong, J. Xue, H. Li and Y. Chen, “Adaptive neural control for a class of pure-feedback nonlinear systems via dynamic surface technique,” IEEE Transactions on Neural Networks and Learning Systems, vol. 27, no. 9, pp. 1969–1975, 2016. [Google Scholar]
31. X. R. Zhang, X. Chen, W. Sun and X. Z. He, “Vehicle re-identification model based on optimized densenet121 with joint loss,” Computers, Materials & Continua, vol. 67, no. 3, pp. 3933–3948, 2021. [Google Scholar]
32. W. Sun, G. C. Zhang, X. R. Zhang, X. Zhang and N. N. Ge, “Fine-grained vehicle type classification using lightweight convolutional neural network with feature optimization and joint learning strategy,” Multimedia Tools and Applications, vol. 80, no. 20, pp. 30803–30816, 2021. [Google Scholar]
33. K. Singla, J. Bose and S. Katariya, “Machine learning for secure device personalization using blockchain,” in Int. Conf. on Advances in Computing, Communications and Informatics, ICACCI 2018, Bangalore, India, pp. 67–73, 2018. [Google Scholar]
34. M. Nakamura, “Improving health and quality of life in one-person households using IoT and machine learning,” in IEEE 17th Int. Conf. on Software Engineering Research, Management and Applications, Honolulum HI, USA, pp. 1–1, 2019. [Google Scholar]
35. Z. F. Liao, J. B. Liang and C. C. Feng, “Mobile relay deployment in multihop relay networks,” Computer Communications, vol. 112, no. 1, pp. 14–21, 2017. [Google Scholar]
36. B. Ali and A. I. Awad, “Cyber and physical security vulnerability assessment for IoT-based smart homes,” Sensors, vol. 18, no. 3, pp. 1–17, 2018. [Google Scholar]
37. X. Lei, G. H. Tu, C. Y. Li, T. Xie and M. Zhang, “SecWIR: Securing smart home IoT communications via wi-fi routers with embedded intelligence,” in 18th ACM Int. Conf. on Mobile Systems, Applications, and Services MobiSys 2020, Toronot, Canada, pp. 260–272, 2020. [Google Scholar]
38. N. Awan, S. Khan, M. Rahmani, M. Tahir, N. MD et al., “Machine learning-enabled power scheduling in IoT-based smart cities,” Computers, Materials and Continua, vol. 67, no. 2, pp. 2449–2462, 2021. [Google Scholar]
39. M. A. Hoque and C. Davidson, “Design and implementation of an IoT-based smart home security system,” International Journal of Networked and Distributed Computing, vol. 7, no. 2, pp. 85–92, 2019. [Google Scholar]
Cite This Article
 Copyright © 2023 The Author(s). Published by Tech Science Press.
This work is licensed under a Creative Commons Attribution 4.0 International License , which permits unrestricted use, distribution, and reproduction in any medium, provided the original work is properly cited.
 Downloads
 Citation Tools