
 Submit a Paper
 Propose a Special lssue
 Open Access
ARTICLE
Profiling Astronomical Objects Using Unsupervised Learning Approach
1 Center of Excellence in AI and Emerging Technologies, School of Information Technology, Mae Fah Luang University, Chiang Rai, 57100, Thailand
2 Department of Computer Science, Aberystwyth University, Aberystwyth, Ceredigion, UK
* Corresponding Author: Tossapon Boongoen. Email:
Computers, Materials & Continua 2023, 74(1), 1641-1655. https://doi.org/10.32604/cmc.2023.026739
Received 04 January 2022; Accepted 26 April 2022; Issue published 22 September 2022
 View Full Text
 Download PDF
Abstract
Attempts to determine characters of astronomical objects have been one of major and vibrant activities in both astronomy and data science fields. Instead of a manual inspection, various automated systems are invented to satisfy the need, including the classification of light curve profiles. A specific Kaggle competition, namely Photometric LSST Astronomical Time-Series Classification Challenge (PLAsTiCC), is launched to gather new ideas of tackling the abovementioned task using the data set collected from the Large Synoptic Survey Telescope (LSST) project. Almost all proposed methods fall into the supervised family with a common aim to categorize each object into one of pre-defined types. As this challenge focuses on developing a predictive model that is robust to classifying unseen data, those previous attempts similarly encounter the lack of discriminate features, since distribution of training and actual test datasets are largely different. As a result, well-known classification algorithms prove to be sub-optimal, while more complicated feature extraction techniques may help to slightly boost the predictive performance. Given such a burden, this research is set to explore an unsupervised alternative to the difficult quest, where common classifiers fail to reach the 50% accuracy mark. A clustering technique is exploited to transform the space of training data, from which a more accurate classifier can be built. In addition to a single clustering framework that provides a comparable accuracy to the front runners of supervised learning, a multiple-clustering alternative is also introduced with improved performance. In fact, it is able to yield a higher accuracy rate of 58.32% from 51.36% that is obtained using a simple clustering. For this difficult problem, it is rather good considering for those achieved by well-known models like support vector machine (SVM) with 51.80% and Naïve Bayes (NB) with only 2.92%.Keywords
Nowadays, big data streams seen in various fields have become an important and very challenge issue for data collection and analysis technology to catch up with large volume and mostly unstructured data, from which new and useful insights may be disclosed [1–3]. Astronomy is one of these domains where the practice of artificial intelligence, machine learning in particular, helps to automate as well as improve the quality of a knowledge discovery process. In general, the community of astronomers and data scientists strive to characterize objects observed in a wide-area sky survey like LSST such that their behaviors and impacts toward the earth can be accurately predicted [4]. Of course, it has proven to be an effective alternative to a human manual process to confirm a huge collection of new sources daily, e.g., the identification of extragalactic objects in the optical-infrared survey [5]. Also, the application of the state-of-the-art method like deep learning has been reported in the recent literature [6].
Given applications of machine learning techniques to different domain problems [7–9], some of these have also been exploited to determine insights from raw astronomical data. And specific to the case of light curve data analysis, they have exhibited a potential of classifying transients [10] and variable stars [11]. These methods are based on different feature extraction approaches such as template fitting [12], parametric model fitting [13], wavelet fitting [10], and statistical analysis of time series [11]. Having obtained target features extracted from light curves, a machine learning model can be developed. Along this line of research, Lochner et al. [10] compare a set of classification techniques for supernova classification, including SVM, NB, KNN (k-nearest neighbors), ANN (artificial neural networks), and RF (random forest), with the latter providing the best result. Khan et al. [4] also introduce a classification approach to categorize objects into pre-defined classes based on features generated from light curve profiles collected over time. The final model proposed in this work is a combination of RF [14] and SMOTE (Synthetic Minority Over-Sampling Technique) [15], to overcome the problem of class imbalance. Similarly, Chuntama et al. [16] develop the high-performance classification model to determine the type of astronomical objects using RF and ANN. In addition, these models have also been investigated by D’lsanto et al. [17] for the classification of transient objects, which are extracted from the CRTS (Catalina Real Time Transient Survey).
Another significant attempt to boost the magnitude and quality of machine learning techniques to the analysis of light curves is the PLAsTiCC. It is an open challenge hosted on Kaggle platform (https://www.kaggle.com) with the task of classifying simulated photometric light curves for the range of astronomical objects [18]. This data collection is generated as a preparation for actual observations that will be received from LSST surveys, based on detection of photon flux measurements specific to each object by time series. This component has become the light curve such that each object possesses different photons in six passbands that are in the length of infrared, optical and ultraviolet. For the challenge, many models have been proposed with good performance, with the best being reported by Boone [19]. However, almost all these belong to the family of supervised learning and are greatly subjected to a repetitive trial-and-error cycle of feature extraction, data augmentation and model modification [20]. In fact, domain knowledge proves to be crucial here as characteristics of training set that is published to all competitors is largely dissimilar to that of the unseen test set. This is recently discussed by Sangjan et al. [21], in which many classification methods perform well for only a few object classes. Yet, it might be possible to gain a robust alternative using an unsupervised approach that has been missing from the literature at large.
Provided progresses mentioned above, it is the goal of this research to investigate and propose the application of unsupervised learning framework to identify types of objects in the PLAsTiCC collection. Several past studies have moved to this direction, including the exploitation of cluster analysis to surrogate radio-frequency based scene descriptors that are achieved from DRAO (Dominion Radio Astrophysical Observatory) into normal and novel events [22]. Besides, Astorga et al. [23] make use of VADE (Deep Variational Embedding) to cluster astronomical transient candidates. A similar work introduced by Reis et al. [24] confirms the benefit of data clustering for the next generation of sky survey with which a huge amount of data will be witnessed. In that, only a tiny bit would correspond to rare cases or interesting incidents. As such, candidates are initially clustered into groups of similar profiles before an anomaly detection algorithm is deployed to spot uncommon or unusual objects. At last, a combination of supervised and unsupervised learning methods is also brought forward such that classifiers can be built to accommodate cluster-specific predictions [25–27]. In addition to the improved quality of prediction, both time and space complexity to train a model may well be reduced.
The current study follows the path of unsupervised learning approach to analyze the PLAsTiCC data set, with two different variations a cluster-assisted prediction model: single and multiple clustering, respectively. The contributions presented within this paper can be summarized below in three folds.
1) Two new unsupervised methods to classify astronomical objects based on the PLAsTiCC data are proposed. Both strive to find a collection of cluster centers or centroids that well represent their neighboring contexts and the class or object type commonly seen in each cluster. An initial model of single clustering is developed using classical techniques of k-means and agglomerative hierarchical clustering, with the optimal number of clusters being identified by internal validity indices. Note that, the resulting classification model is rather like KNN (k = 1), where a large training space is decreased to a small set of centroids. The second variation is actually an extension to the former, where the reference set of cluster centers is acquired from multiple clustertings, each with a number of clusters randomly selected from a pre-specified range. These are novel and have not been covered in the current literature, especially for the study related to the PLAsTiCC challenge.
2) In addition to the multiple-clustering model, the use of ensemble clustering [28] is examined here to ensure the quality of cluster centroids, in terms of both clustering accuracy and the diversity between data clusters [29]. This discussion provides a unique empirical study that not only leads to a higher accuracy, but also a bridge to advancement made in a related subject.
3) This paper also includes predictive performance of both basic supervised and unsupervised methods on the PLAsTiCC data, which provides insights and background for researchers who which to investigate and develop novel concepts in the future.
The rest of this paper is organized as follows. Section 2 presents details of background as well as materials exploited in this work, followed by the proposed method in Section 3. The experimental design and results are reported in Section 4, with further investigation and discussion being included in Section 5. Lastly, the paper is concluded in Section 6 with the identification of possible future works.
This section explains the methodology of current research, including data source and collection, data preprocessing, model development and evaluation, respectively. It is to set the scene for proposed methods, experimental results and discussion given in the following sections. To begin with, the original data is obtained from the Kaggle platform, which organizes the PLAsTiCC competition. At first, the training dataset has been simulated to model light curves of a variety of transients and periodic objects [30]. Details of classes and their distributions in both training and unseen test sets are illustrated in Tab. 1. These two sets consist of 7,848 and 3,479,801 samples, where only the former will be employed to create a model, which predict classes of those in the latter.
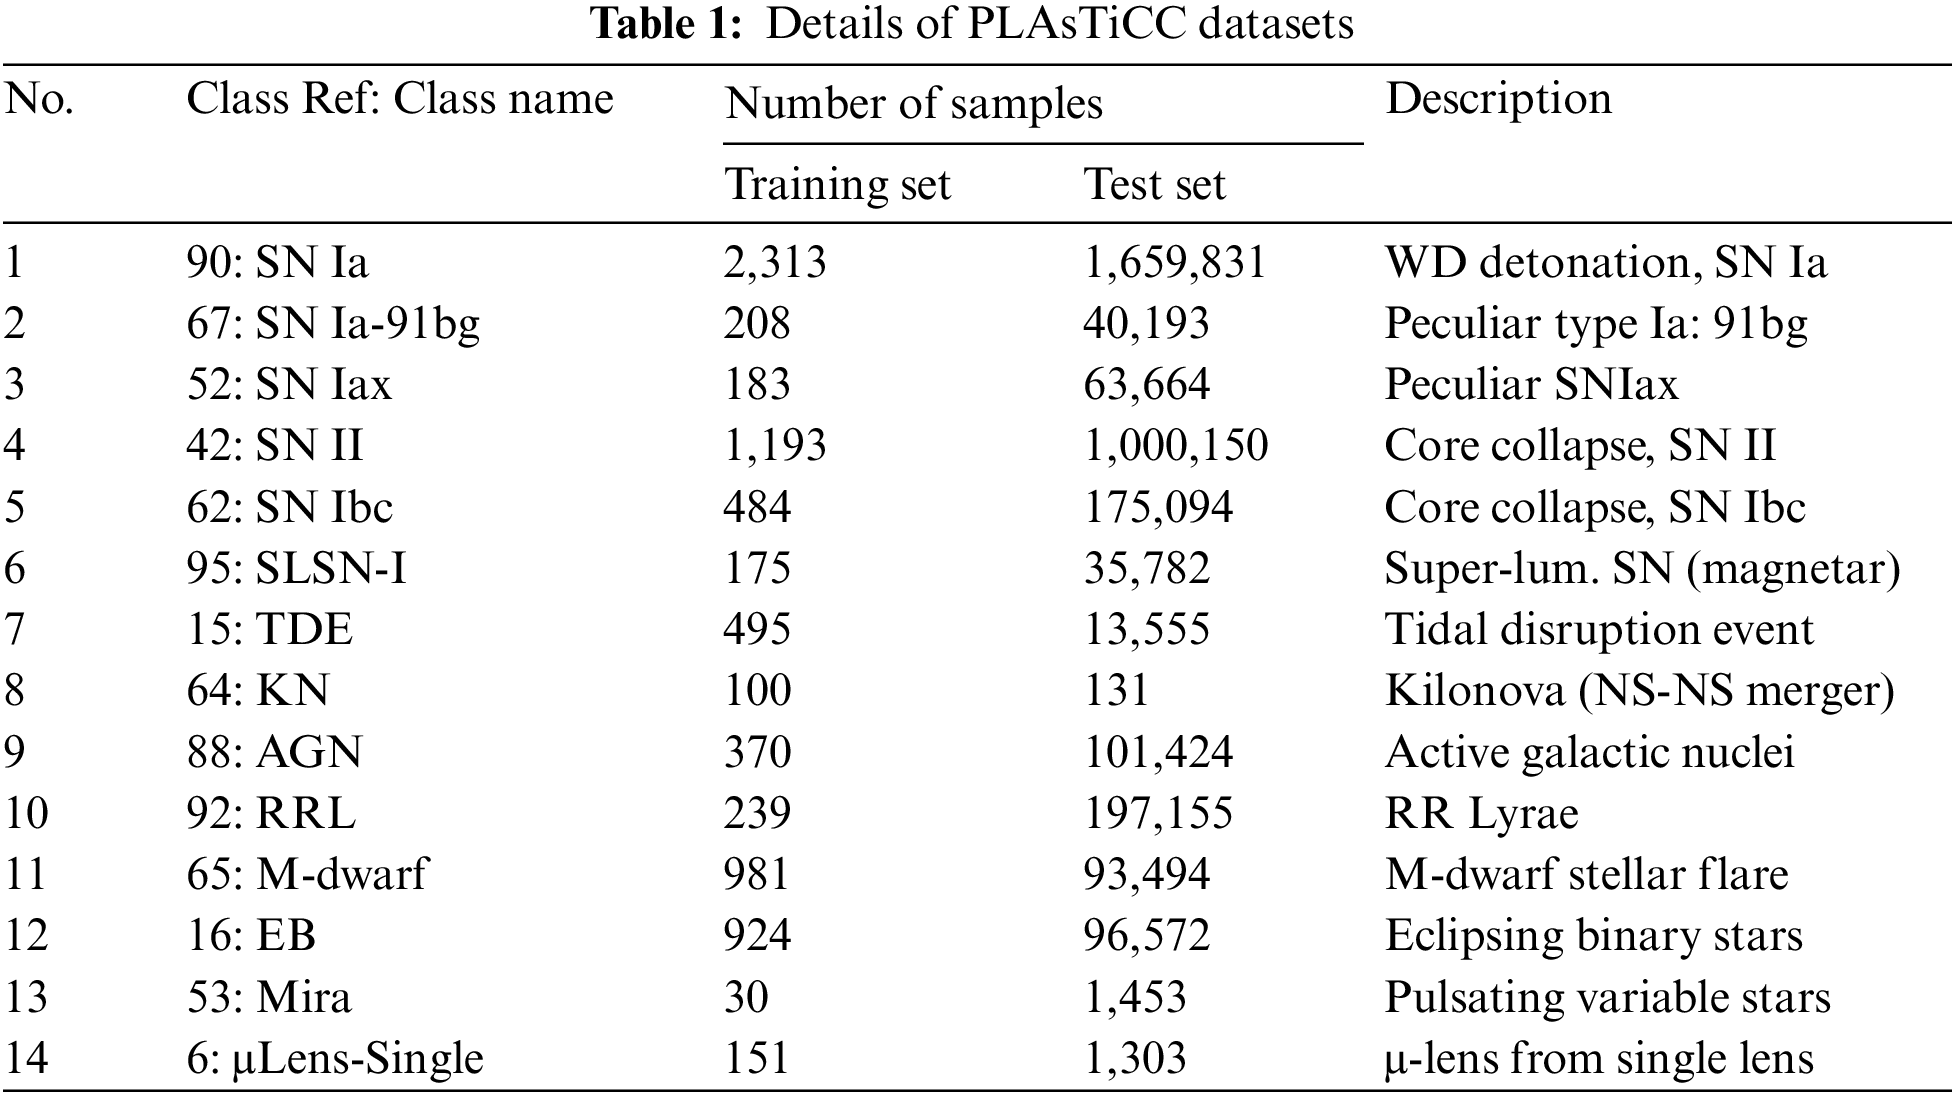
One of the obvious properties seen with these sets with 14 different object classes is the imbalance problem among class-specific samples, which is about 30 to 2,313 between classes 53 and 90. This exhibits the worst case found in training data. Of course, it may consequently degrade the effectiveness of a supervised learning model, but not the focus of this study. Also, data augmentation and manual selection of informative features that are usually employed in previous works are not exercised herein. Instead, a generalized and simple data preprocessing is pursued to exhibit the baseline of model evaluation. The following steps are performed to prepare data for next phases of model development and assessment.
1. Initially, the SALT2 (Spectral Adaptive Light-curve Template 2) package [31] that has been a common choice of feature extractor [4,10,20] is particularly used to deliver an initial collection of features. Note that the sncosmo implementation (https://sncosmo.readthedocs.io/en/stable/index.html) of SALT2 is used in this work. Based on the study of [19], time series of data specific to 4 signal bands are fit to the default SALT2 models. Each band fitting produces five parameters of z, t0, x0, x1 and c; where z denotes the supernova redshift, t0 is-time of peak flux, x0 corresponds to amplitude of the supernova, x1 represents the stretch of the supernova, and c exhibits the colour of the supernova, respectively. This provides a basic set of 20 features, which may contain some not appropriate for training a model.
2. As such, based on the training set alone, top fifteen of these are selected for the model development given their correlation scores with class information. To be exact, five features with low correlation scores between −0.05 to 0.05 are excluded. Note that, this step is not conducted with the test set as not to bias the trained model with information regarding unseen test cases.
3. Specific to the test set, step 1 is repeated to extract an initial feature set, in which only those specified in step 2 is actually included in the target test set. This is to set samples in both training and test sets to be represented by the same feature space.
4. It is noteworthy that feature values in both training and test sets might not well be in the unified domain, thus requiring normalization. In this study, the simple max-min scaler is used to transform an original feature value
where
After the process of data preprocessing, a classification model can be developed using any common supervised learning techniques. Fig. 1 depicts the whole framework of model development on the left, class prediction of unseen test data in the middle, and the model evaluation on the right. Note that the Test and Evaluation sets shown here stand for test samples with only feature information in the former, and their corresponding classes in the latter. The accuracy rate used to reflect model quality is defined in Eq. (2).
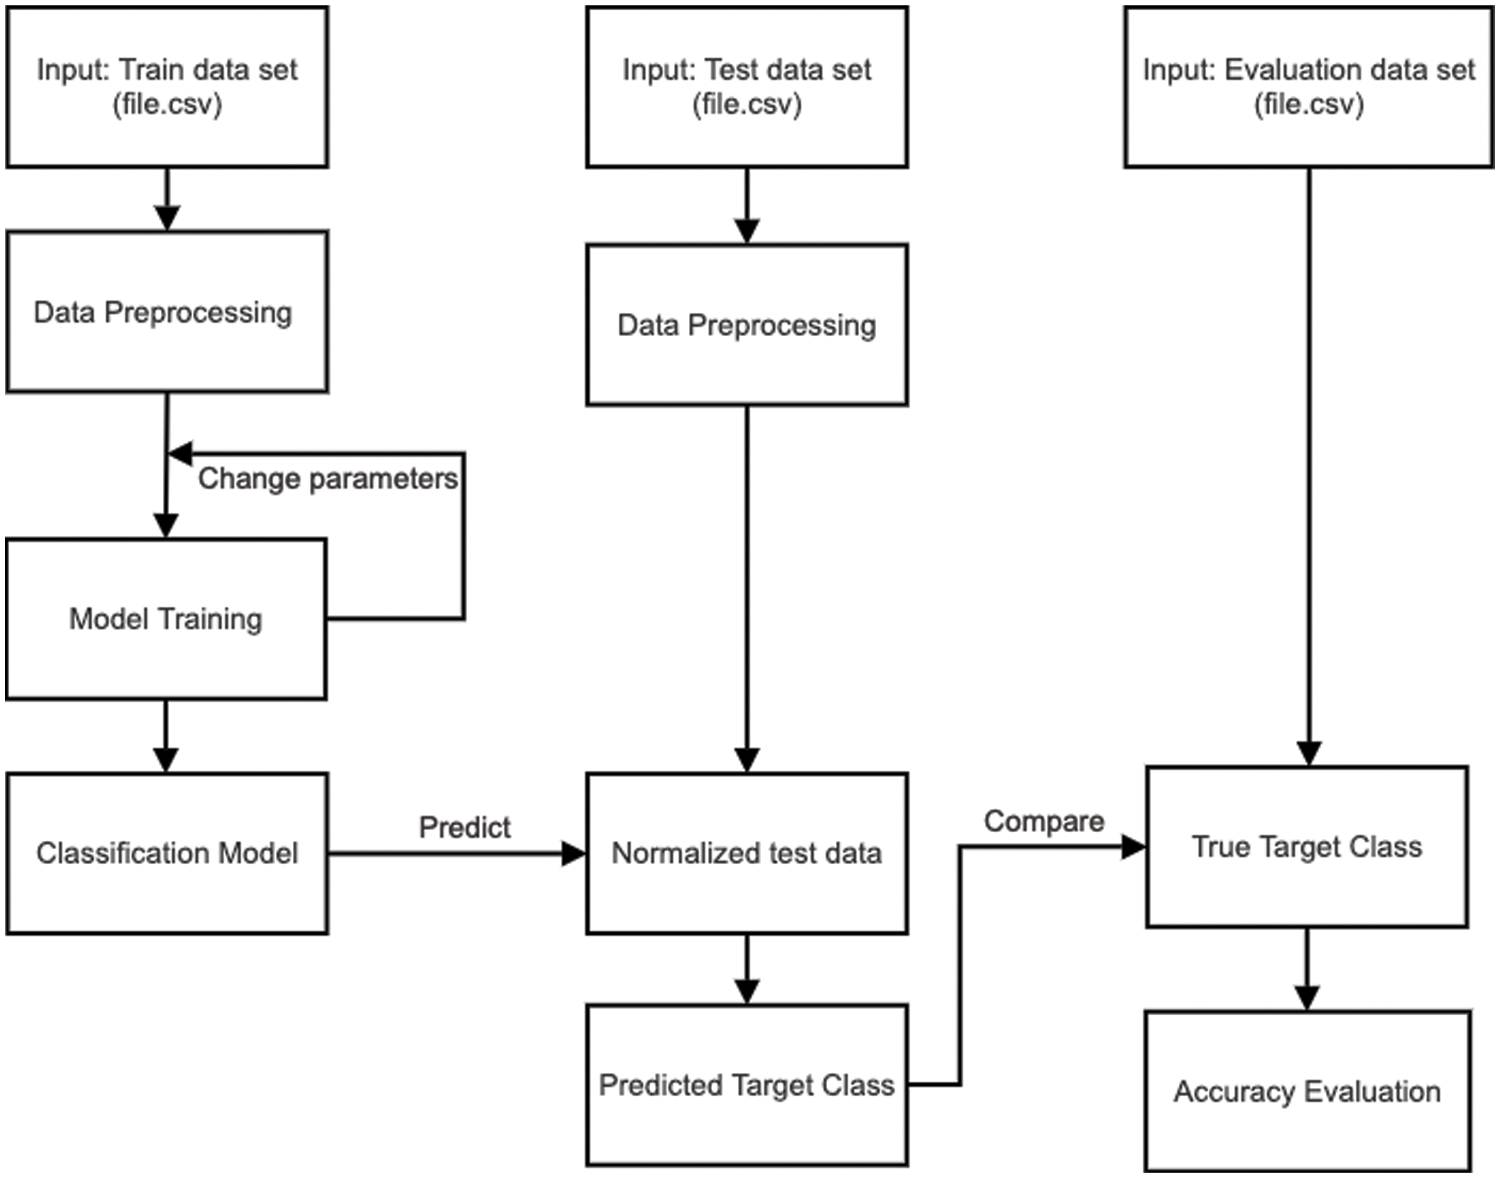
Figure 1: General framework of model development and evaluation
The proposed clustering based prediction model follows most of the stages exhibited in Fig. 1, but there are additional steps asserted in the part of model development. In particular to Fig. 2, the optimal number of clusters or K of the training set is examined such that the following clustering phase will generate these K clusters, using k-means and agglomerative hierarchical clustering algorithms. As a result, the collection of K centroids
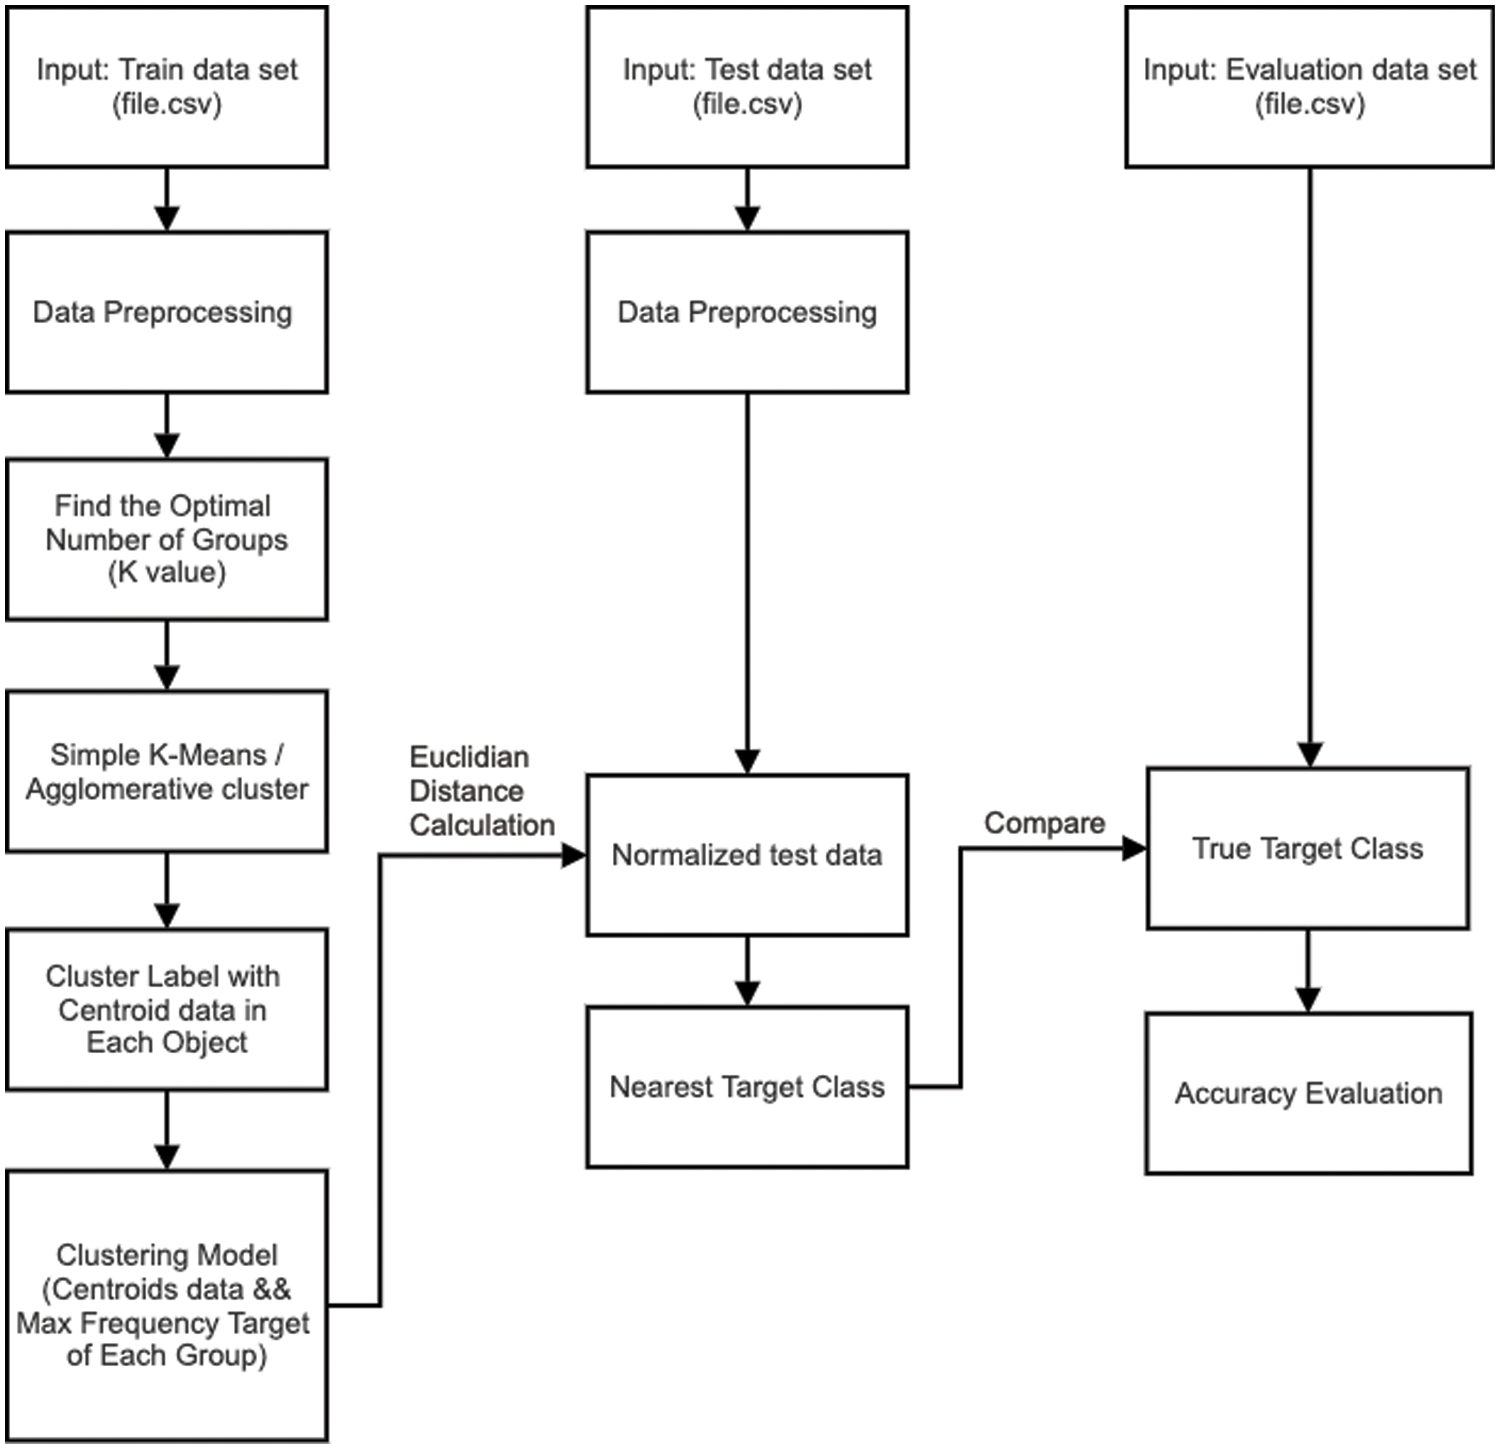
Figure 2: A framework for clustering-based model development and evaluation
As an extension to the basic single clustering approach, the next model makes a good use of bigger centroid set, which is built from repeatedly clustering the training set using different algorithm variables. Specific to the present work, clusterings are allocated with different numbers of clusters that are arbitrarily chosen from a pre-defined range. This is motivated by the progress in ensemble clustering [28,29] where the utilization of multiple clustering results is able to deliver a more accurate analysis. Hence, the reference set of centroids is expanded to
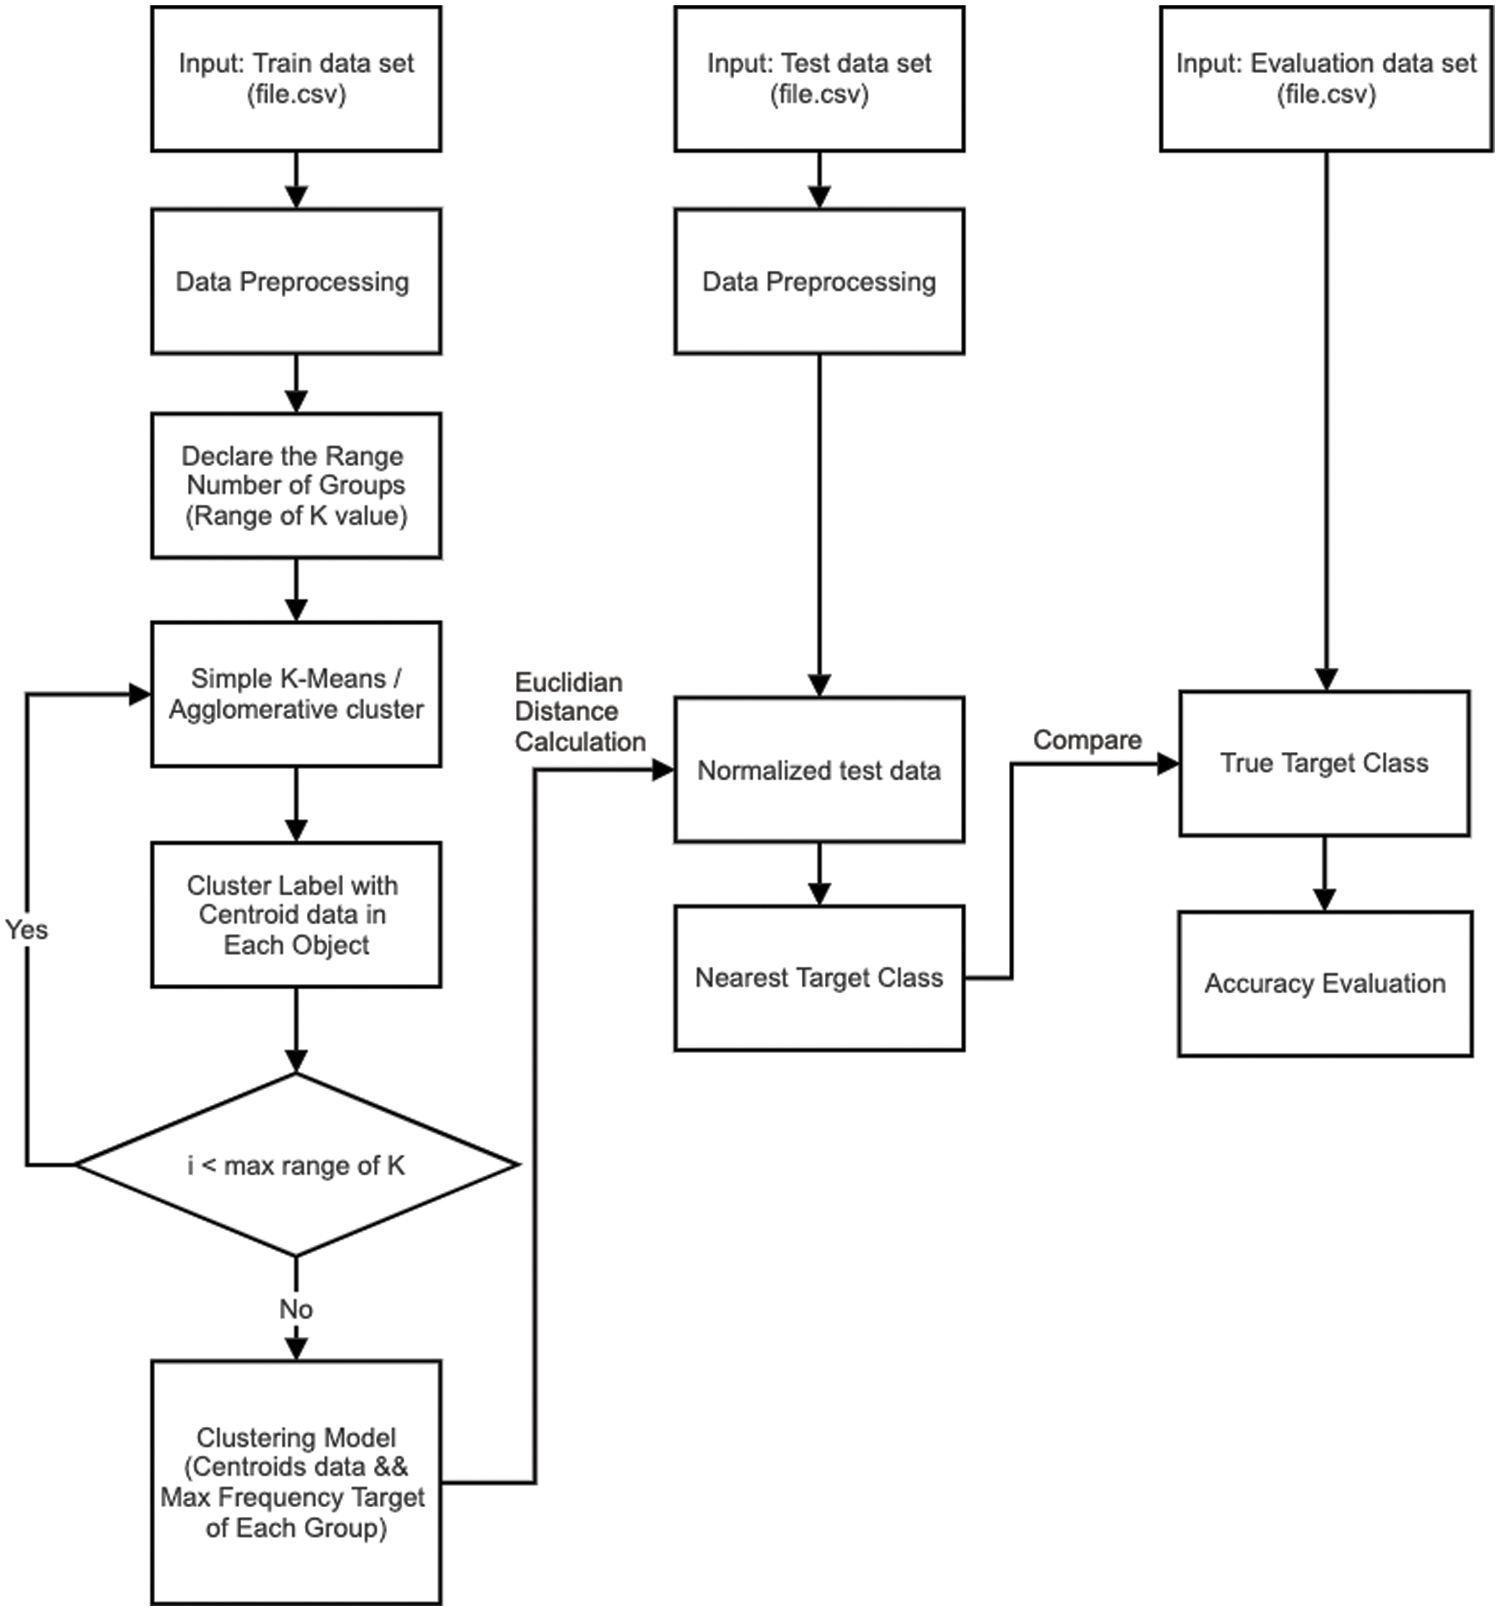
Figure 3: A framework for multiple-clustering based model development and evaluation
Having elaborated the material and proposed methods in previous sections, it is to continue with actual experiments and the evaluation on an unseen test set. This section is divided into two parts, with the first reporting results achieved by different supervised models and the proposed single-clustering counterpart. After that, the second part illustrates findings with the multiple-clustering method, with various parameter settings. Further investigation will be emphasized in the discussion section.
4.1 Experiment with Supervised Models and Single-Clustering Prediction
To obtain a rigorous set of results, the following design has been laid out for this initial part, which aims to compare the predictive performance of common supervised algorithms and the single-clustering model. In particular, the following five classifiers are exploited here. Note that these models are selected for the experiment based on the recent studies [4,10,14,19], in which they are common choices to analyze light curve data. Besides, this also allows a link between the current work and the literature to be established. Also, their Python implementations provided in the scikit-learn package (https://scikit-learn.org) is employed to set up this experiment and the next.
• KNN with the number of nearest neighbors being set to 1, 3 and 5,
• C4.5 (decision tree) with the maximum depth of 3,
• NB with the Gaussian kernel function,
• SVM with the Radial kernel function, and
• RF with C4.5 as base classifiers and the ensemble size of 40. This can be regarded as the representative of an ensemble classifier, while others are basic classification models.
As for the clustering counterpart, two techniques are largely employed, k-means and agglomerative hierarchical clustering. The latter is investigated with three inter-cluster distance measures, single linkage, complete linkage and average linkage, respectively. Note that these model choices are picked up here to initially demonstrate the potential of proposed methods, while a more complex alternative like ensemble clustering [26,28] can be a good area to explore further in the future work. Similar to the case of Random Forest, the result of k-means is achieved as an average across multiple trials, which is set to 30 in this paper. Also, for these clustering models, they are generated using the optimal number of clusters or K that can be found by the following procedure.
To get a stable evaluation outcome, the agglomerative hierarchical clustering with the single-linkage metric is exploited to cluster the training set multiple times, each of which is with a specific number of clusters from the range {2, 30}. Having got the results, they are assessed against two internal validity indices of SSE (Sum of Squared Error) and Silhouette. Fig. 4 provides the corresponding illustrations of these measures along the aforementioned range. As lower SSE and higher and Silhouette scores are preferred, the optimal K of 15 seems to be appropriate as it presents the highest Silhouette between the range of 12 to 18, which is in the close proximity of the actual class number of 14. Besides, there is no significant decline of SSE after this point, thus the result would not miss a major cluster structure appearing as clusters get smaller.
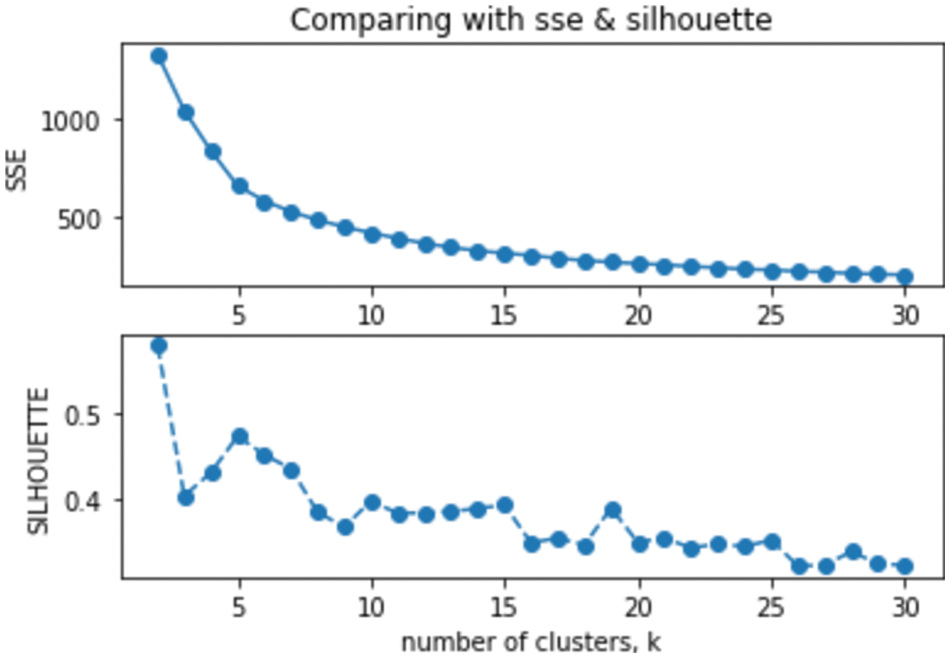
Figure 4: Identification of the optimal K value by comparing validity scores across possible values
Provided these parameter settings, all investigated models are created using the training set and then evaluated against the unseen test set, with their accuracy rates being reported in Tab. 2. Based in the accuracies of KNN variations that reach the maximum of 28.61%, it can be initially point out that the problem at hand is a difficult one. In other words, there are only a handful of training samples that are reliable to predict test cases. Yet, all the features included in this study might not be equally informative since the classifier that takes all features into account like NB fails to perform altogether. As such, a method that exploits features selectively like a decision tree acquires the highest accuracy rate of 52.63%, which is in par with a more complex competitor of SVM. Despite the rise of diversity within RF, random subsets of the original feature space usually leads to less accurate models. Based on 30 trials, this ensemble classifier achieves only around 40.75%, with the corresponding SD (standard deviation) of 3.11.
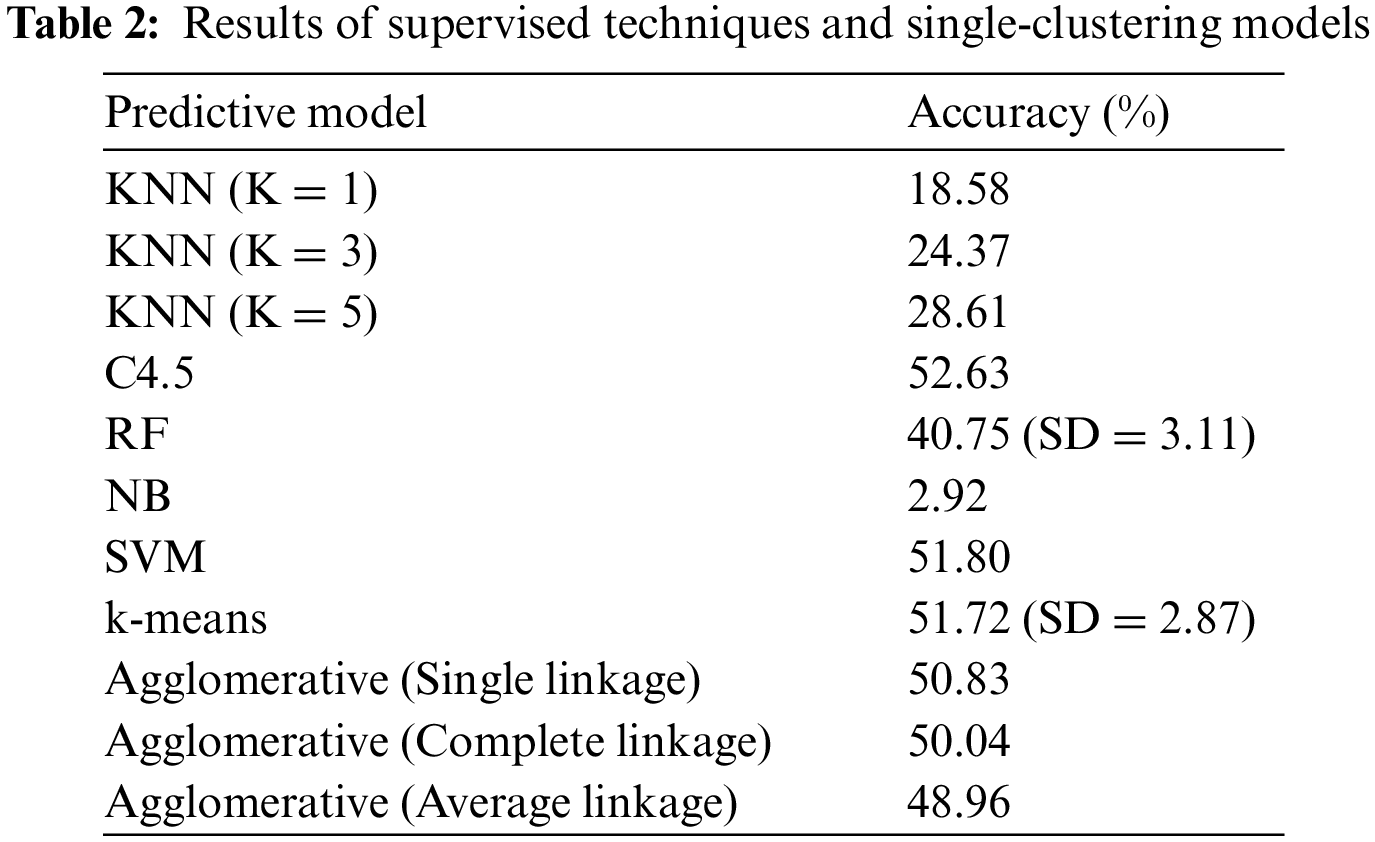
According to this table, four single-clustering alternatives exhibit a potential for the prediction task, with k-means having the highest accuracy rate of 51.72% and SD of 2.87. This is in par with the two best classifiers, i.e., SVM and C4.5. In addition, agglomerative hierarchical clustering techniques are also competitive, with the single-linkage metric leading the group. These observations suggest that the proposed clustering based prediction is able to provide a robust solution for classifying largely unseen light curves. Nonetheless, the underlying cluster reference is subjected to only a single data partition whose quality can be uncertain at times. As a result, it may be better to explore the use of multiple clusterings, which will be discussed next.
4.2 Experiment with Multiple-Clustering Model
This section continues the experimentation with another new framework proposed in this paper. It is to investigate the predictive performance of multiple-clustering based prediction models, each of which uses one of those four single clustering techniques reported in the last section. Specific to the clustering process, the number of clusters is randomly selected from the range
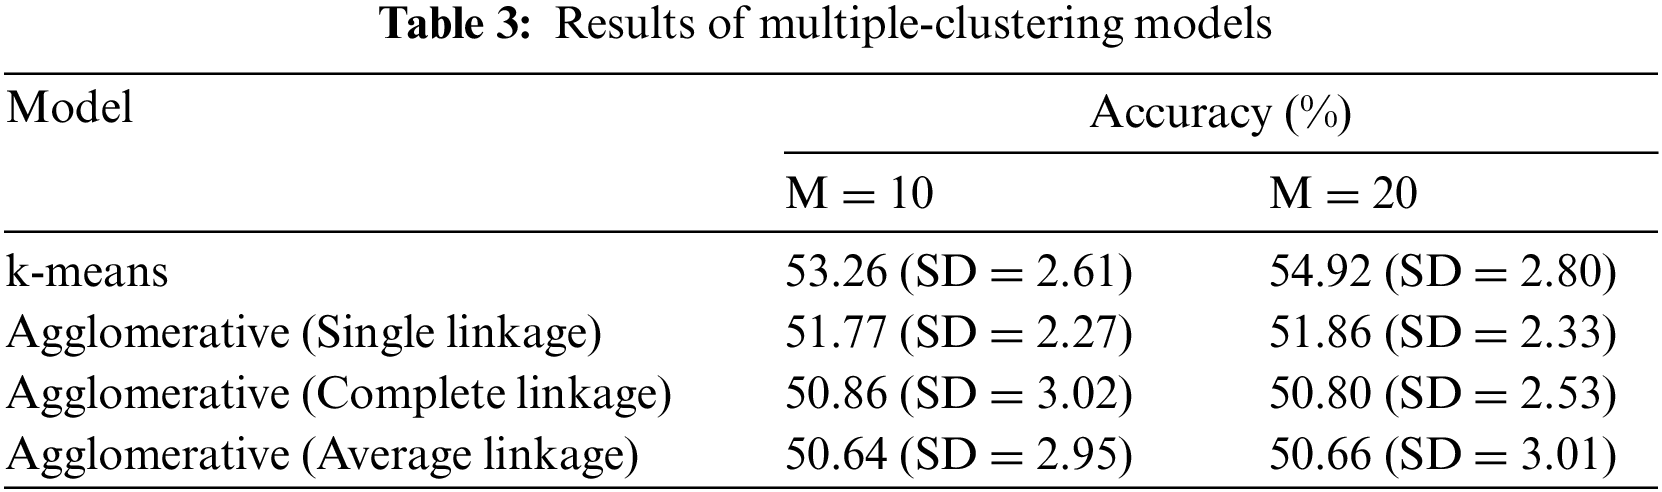
In accordance with this table, these methods consistently perform better than their single-clustering baselines, across parameter settings. Specifically, the multiple-clustering model that makes use of k-means as a base clustering technique reaches a higher accuracy rate of 54.92%, which is now better than the best supervised classifier reported in Tab. 3. Comparing to this improvement with
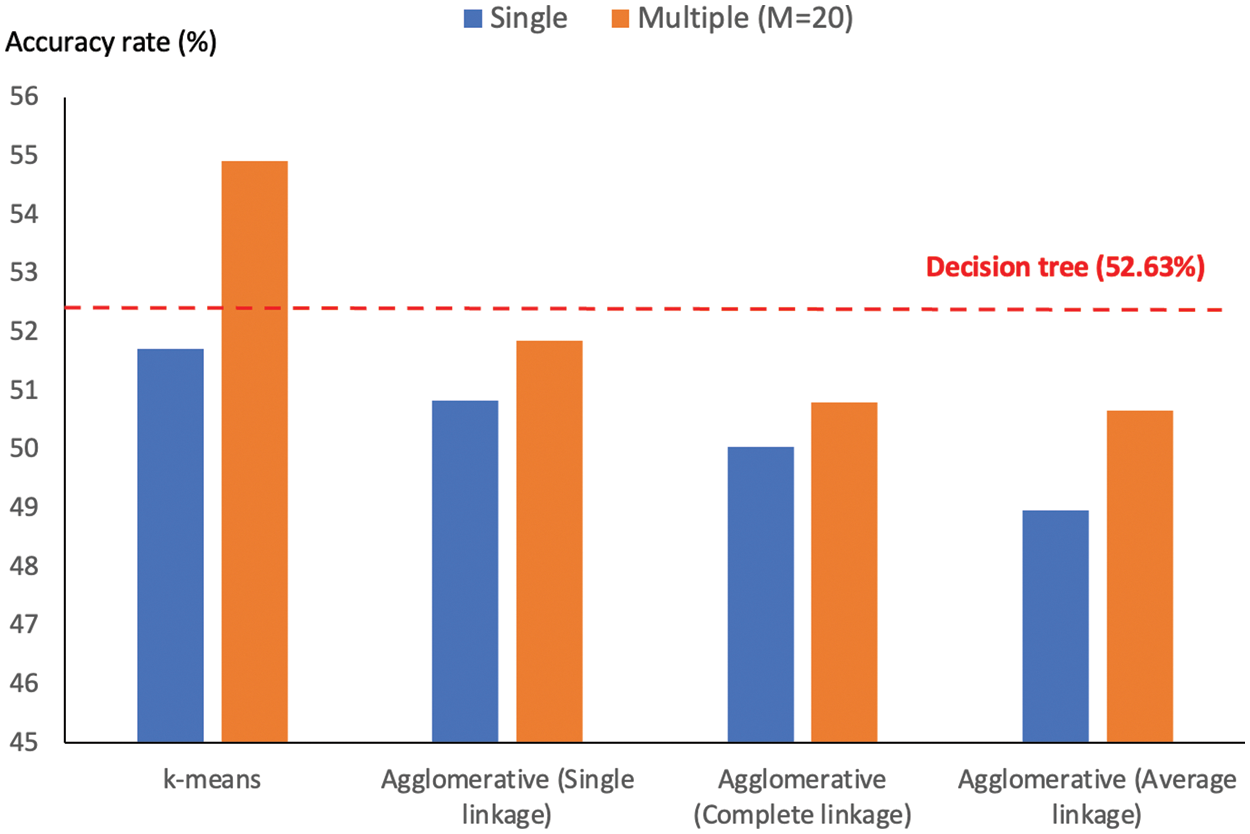
Figure 5: Comparison of accuracy rates obtained by multiple-and single-clustering based models
In addition to the comparison of averaged accuracy rates among methods, it is recommended to make use of the significant interval and better-worse statistics to draw a confident conclusion [28,29]. Specific to this assessment, four models are included, C4.5 or decision tree, SVM, single-clustering (with k-means) and multiple-clusterings (with k-means and M = 20). Based on the original work [28], the confidence level is set to 95%, while other technical details are not elaborated here due to the space limit. Fig. 6 reports the better-worse statistics, which is summarized across 30 trials of proposed models. It is shown that the new multiple-clustering model performs significantly better than its single-clustering alternative and the other two best classification techniques. From this achievement, there are a few issues to be discussed, such as parameter analysis and another way to further boost the predictive performance.
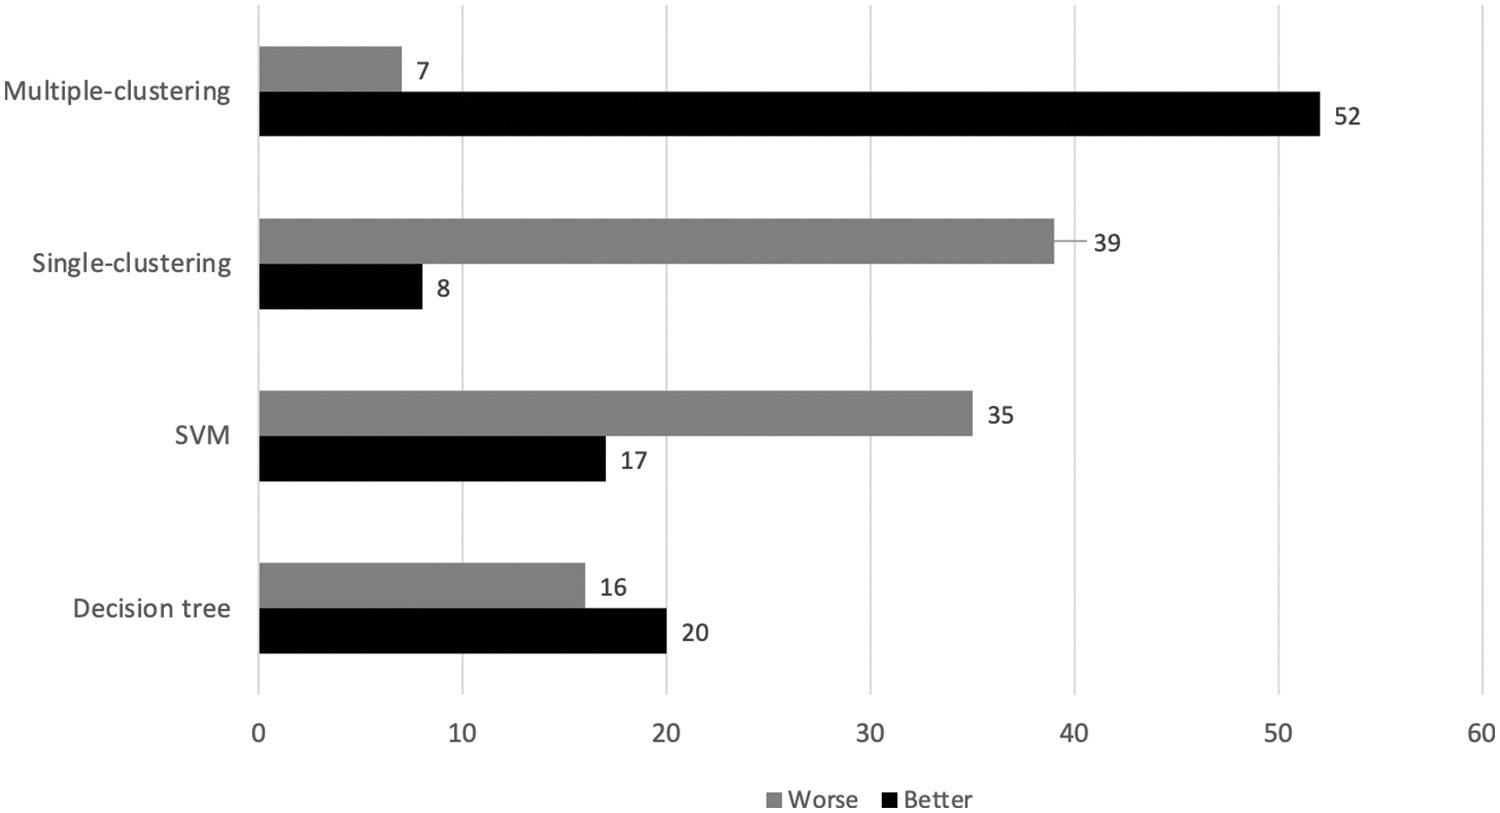
Figure 6: Better-worse statistics evaluated between the proposed models and two best classifiers
From the previous section, the proposed prediction model based on multiple clusterings appears to be effective for the classification task. This section will further explore issues that influence the predictive quality, especially for the case of k-means. The decision not to pursue additional analyses with those agglomerative methods is pretty much on the marginal improvement presented in Tab. 3 and Fig. 5. One of the core variables to be examined is the size of multiple clusterings or
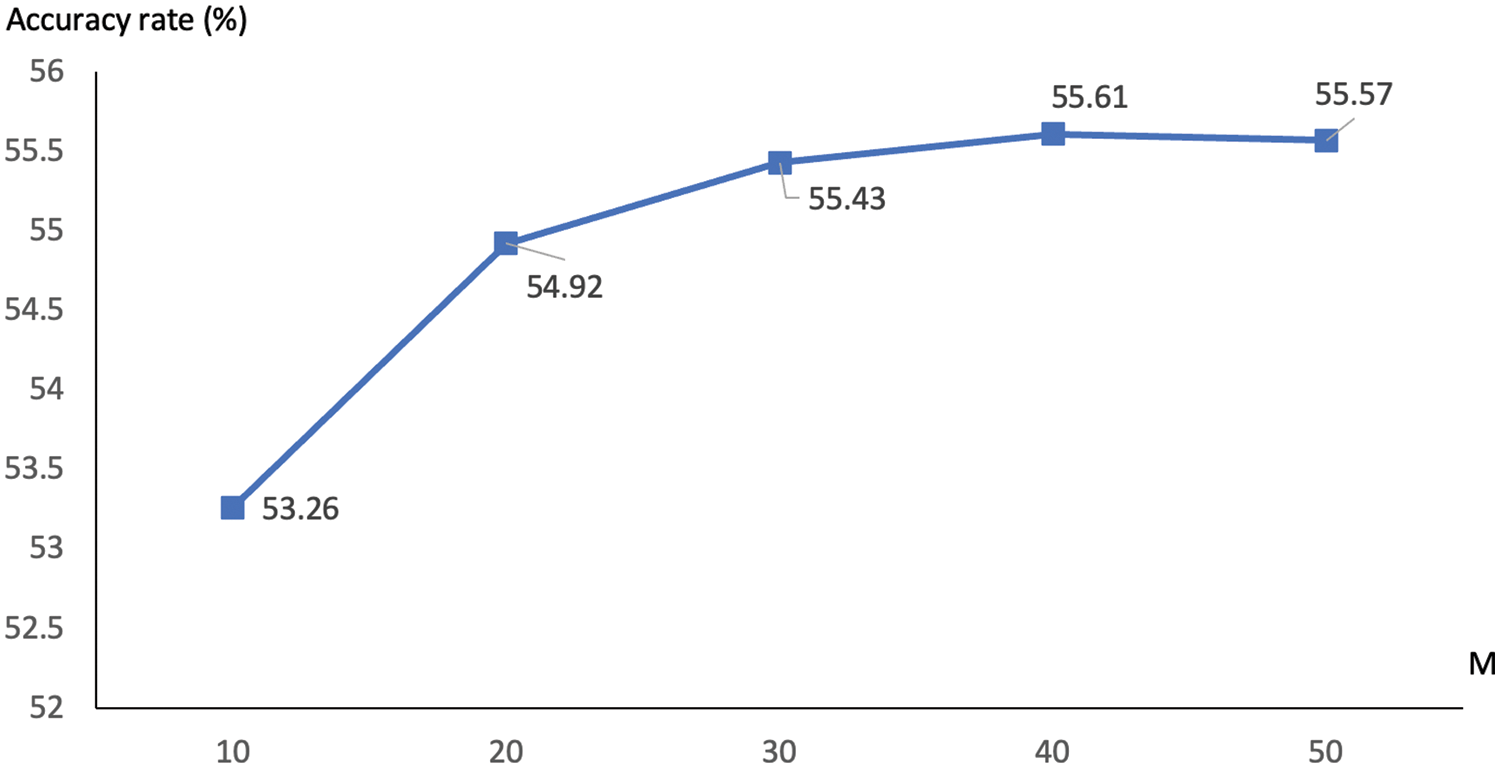
Figure 7: Comparison of accuracy rates with different values of
It can be seen in this figure that a bigger set of multiple k-means clusterings often leads to a better accuracy measure, with the highest rate of 55.61% being seen with
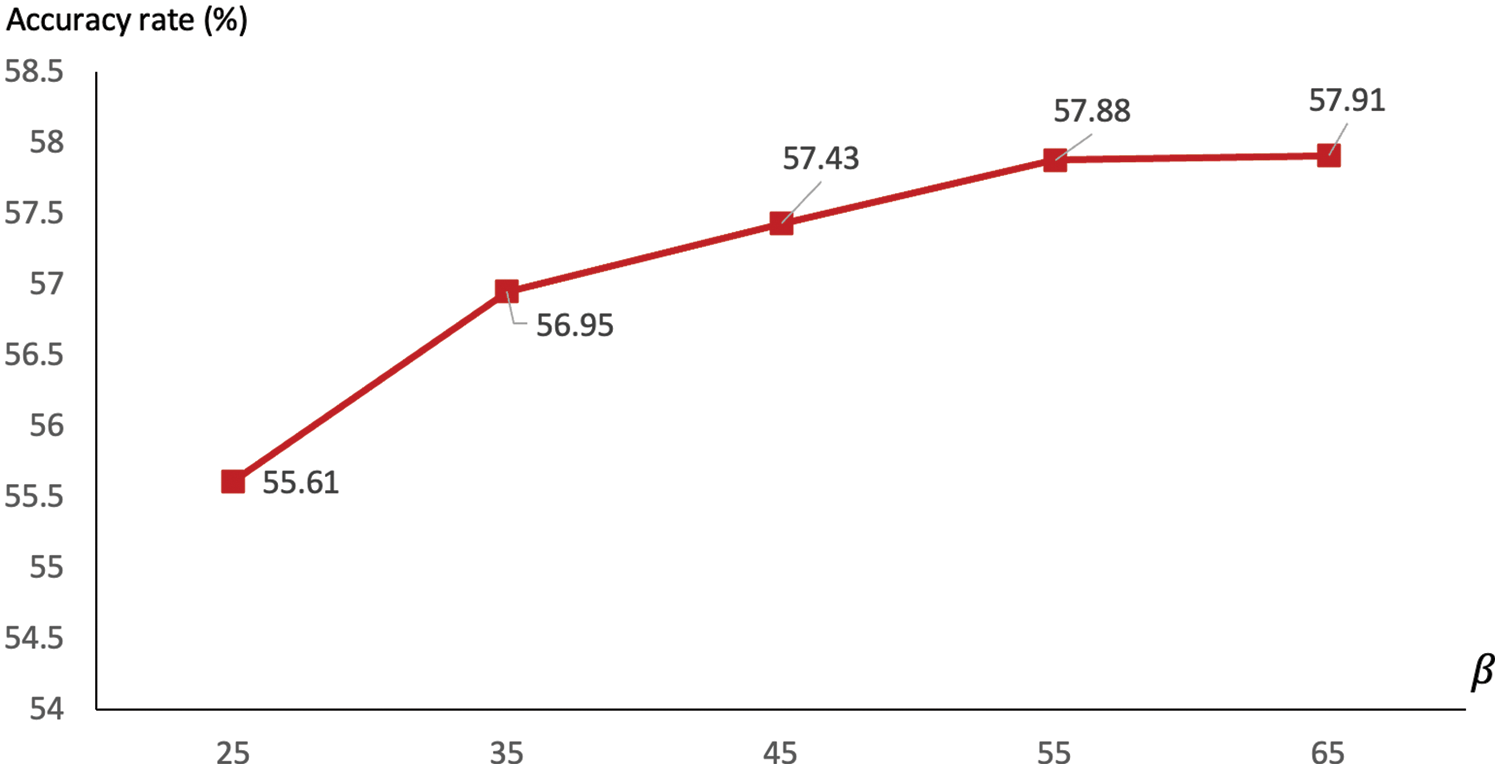
Figure 8: Comparison of accuracy rates with different values of
One final issue to be discussed is the diversity of clusterings in the model, which has not been determined thus far. More and more clustering results obtained from k-means are simple stacked up to form the final pool of referencing clusters. It is common that some of these may be overlapping thus lacking one good character of an ensemble or multiple clusterings, differences among partitions. This particular topic is the focus of the diversity-driven framework for cluster ensemble generation [29]. As such, this concept is included in the current research to ensure the diversity between results of k-means clustering. The previous experiment is repeated with the target size
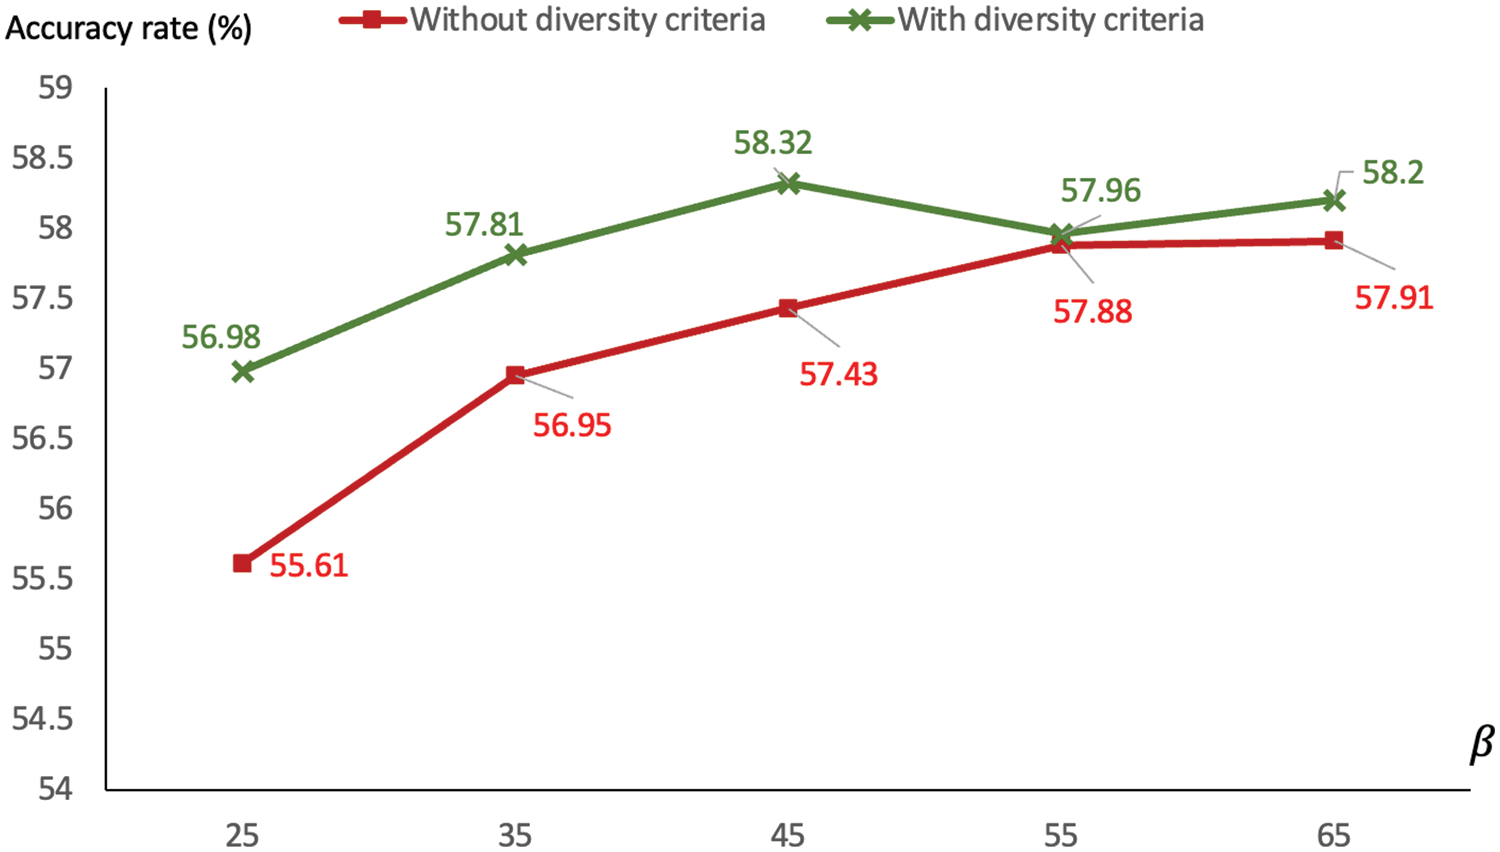
Figure 9: Comparison of accuracies using the diversity-driven generation of multiple clusterings
This paper has presented a novel approach to classifying astronomical objects based on their light curve profiles, which is the part of PLAsTiCC competition. It is observed that data distribution in training set is only partially overlaps that of the test set, hence making many well-known classification techniques like SVM and NB sub-optimal. In addition, this is considered to be a difficult task since the sample-based learning method of KNN fails to achieve an accuracy rate above 30%. To obtain a more robust prediction, an unsupervised approach appears to be a realistic candidate. With this, the current study proposed two classification models based on single clustering and multiple clusterings, respectively. It is novel for this sort of task and has been missing from the literature. Two clustering algorithms are exploited, k-means and agglomerative hierarchical clustering, with the former proves to be more accurate. In particular, the performance of single-clustering variation is in par with the best supervised classifiers, while the multiple-clustering alternative lift the accuracy rate up by 2%–3%. In addition, parameter analysis has also been included to visualize relations between predictive performance and hyper parameters of number of multiple clusterings (
Despite this achievement, there are several issues leading to a worthwhile future work. At first, it is to assess the proposed techniques with more datasets in order to draw a timely conclusion for practical uses. With respect to modeling of ensemble clustering, other choices of generation strategies and ensemble summarization schemes can be another good research to conduct. In addition, other aspects of the underlying feature space may well be addressed, for instance, the treatment of missing values [32] and discretization of a feature domain [33]. Finally, an introduction of fuzzy sets and vocabularies is able to support the explainability of reasoning process [34]. This final remark draws a great deal of attention provided the emerging trend of explainable artificial intelligence (AI) for modern applications.
Acknowledgement: This research work is part of MSc study at Mae Fah Luang University.
Funding Statement: This work is funded by the Security Big Data Fusion Project (Office of the Ministry of Higher Education, Science, Research and Innovation). The corresponding author is the project PI.
Conflicts of Interest: There is no conflicts of interest to report regarding the present study.
References
1. R. F. Mansour, S. Al-Otaibi, A. Al-Rasheed, H. Aljuaid, I. V. Pustokhina et al., “An optimal big data analytics with concept drift detection on high-dimensional streaming data,” Computers, Materials & Continua, vol. 68, no. 3, pp. 2843–2858, 2021. [Google Scholar]
2. A. Mahmoud, M. Y. Shams, O. M. Elzeki and N. A. Awad, “Using semantic web technologies to improve the extract transform load model,” Computers, Materials & Continua, vol. 68, no. 2, pp. 2711–2726, 2021. [Google Scholar]
3. J. Li, J. Cheng, N. Xiong, L. Zhan and Y. Zhang, “A distributed privacy preservation approach for big data in public health emergencies using smart contract and SGX,” Computers, Materials & Continua, vol. 65, no. 1, pp. 723–741, 2020. [Google Scholar]
4. A. M. Khan, M. U. Akram, S. G. Khawaja and A. S. Khan, “A machine learning technique to classify LSST observed astronomical objects based on photometric data,” in Proc. of Swiss Conf. on Data Science, Bern, Switzerland, pp. 46–50, 2019. [Google Scholar]
5. V. Khramtsov and V. Akhmetov, “Machine-learning identification of extragalactic objects in the optical-infrared all-sky surveys,” in Proc. of IEEE Int. Scientific and Technical Conf. on Computer Sciences and Information Technologies, Lviv, Ukraine, pp. 72–75, 2018. [Google Scholar]
6. A. Mahabal, F. Gieseke, A. Pai, S. G. Djorgovski, A. J. Drake et al., “Deep-learnt classification of light curves,” in Proc. of IEEE Symp. Series on Computational Intelligence, Honolulu, HI, USA, pp. 1–8, 2017. [Google Scholar]
7. A. Urso, A. Fiannaca, M. L. Rosa, V. Rav and R. Rizzo, “Data mining: Classification and prediction,” Encyclopedia of Bioinformatics and Computational Biology, vol. 1, pp. 384–402, 2019. [Google Scholar]
8. D. A. Adeniyi, Z. Wei and Y. Yongquan, “Automated web usage data mining and recommendation system using K-Nearest Neighbor (KNN) classification method,” Applied Computing and Informatics, vol. 12, no. 1, pp. 90–108, 2016. [Google Scholar]
9. Y. Sato, K. Izui, T. Yamada and S. Nishiwaki, “Data mining based on clustering and association rule analysis for knowledge discovery in multiobjective topology optimization,” Expert Systems with Applications, vol. 119, no. 1, pp. 247–261, 2019. [Google Scholar]
10. M. Lochner, J. D. McEwen, H. V. Peiris, O. Lahav and M. K. Winter, “Photometric supernova classification with machine learning,” Astrophysical Journal Supplement Series, vol. 225, no. 2, pp. 1–14, 2016. [Google Scholar]
11. J. W. Richards, D. L. Starr, N. R. Butler, J. S. Bloom, J. M. Brewer et al., “On machine-learned classification of variable stars with sparse and noisy time-series data,” Astrophysical Journal, vol. 733, no. 1, pp. 1–20, 2011. [Google Scholar]
12. J. Guy, P. Astier, S. Baumont, D. Hardin, R. Pain et al., “SALT2: Using distant supernovae to improve the use of type Ia supernovae as distance indicators,” Astronomy and Astrophysics, vol. 466, no. 1, pp. 11–21, 2007. [Google Scholar]
13. S. Gonzalez-Gaitan, N. Tominaga, J. Molina, L. Galbany, F. Bufano et al., “The rise-time of Type II supernovae,” Monthly Notices of the Royal Astronomical Society, vol. 451, no. 2, pp. 2212–2229, 2015. [Google Scholar]
14. L. Breiman, “Random forests,” Machine Learning, vol. 45, no. 11, pp. 5–32, 2001. [Google Scholar]
15. N. V. Chawla, W. B. Kevin, O. H. Lawrence and W. P. Kegelmeyer, “SMOTE: Synthetic minority over-sampling technique,” Journal of Artificial Intelligence Research, vol. 16, pp. 321–357, 2002. [Google Scholar]
16. T. Chuntama, P. Techa-Angkoon, C. Suwannajak, B. Panyangam and N. Tanakul, “Multiclass classification of astronomical objects in the galaxy M81 using machine learning techniques,” in Proc. of Int. Conf. on Computer Science and Engineering, Bangkok, Thailand, pp. 1–6, 2020. [Google Scholar]
17. A. D’Isanto, S. Cavuoti, M. Brescia, C. Donalek, G. Longo et al., “An analysis of feature relevance in the classification of astronomical transients with machine learning methods,” Monthly Notices of the Royal Astronomical Society, vol. 457, no. 3, pp. 3119–3132, 2016. [Google Scholar]
18. The PLAsTiCC team, T. Allam Jr, A. Bahmanyar, R. Biswas, M. Dai et al., “The photometric LSST astronomical time-series classification challenge (PLAsTiCCData set,” arXiv:1810.00001, 2018. [Google Scholar]
19. K. Boone, “Avocado: Photometric classification of astronomical transients with gaussian process augmentation,” Astronomical Journal, vol. 158, no. 6, pp. 1–19, 2019. [Google Scholar]
20. T. Gabruseva, S. Zlobin and P. Wang, “Photometric light curves classification with machine learning,” Journal of Astronomical Instrumentation, vol. 9, no. 1, pp. 1–14, 2020. [Google Scholar]
21. T. Sangjan, T. Boongoen, N. Iam-on and J. Mullaney, “Classification of astronomical objects using light curve profile,” in Proc. of IEEE Eurasia Conf. on IOT, Communication and Engineering, Yunlin, Taiwan, pp. 494–497, 2019. [Google Scholar]
22. S. Harrison, R. Coles, T. Robishaw and D. Del Rizzo, “RFI novelty detection using machine learning techniques,” in Proc. of RFI Workshop-Coexisting with Radio Frequency Interference, Toulouse, France, pp. 1–6, 2019. [Google Scholar]
23. N. Astorga, P. Huijse, P. A. Estevez and F. Forster, “Clustering of astronomical transient candidates using deep variational embedding,” in Proc. of Int. Joint Conf. on Neural Networks, Rio de Janeiro, Brazil, pp. 1–8, 2018. [Google Scholar]
24. I. Reis, M. Rotman, D. Poznanski, J. X. Prochaska and L. Wolf, “Effectively using unsupervised machine learning in next generation astronomical surveys,” arXiv:1911.06823, 2019. [Google Scholar]
25. H. Teimoorinia, J. J. Kavelaars, S. Gwyn, D. Durand, K. Rolston et al., “Assessment of astronomical images using combined machine learning models,” arXiv:2003.01785, 2020. [Google Scholar]
26. T. Boongoen, N. Iam-On and J. Mullaney, “Providing contexts for classification of transients in a wide-area sky survey: An application of noise-induced cluster ensemble,” Journal of King Saud University-Computer and Information Sciences, vol. 8, pp. 2790, 2021. http://dx.doi.org/10.1016/j.jksuci.2021.06.019. [Google Scholar]
27. L. Nanglae, N. Iam-On, T. Boongoen, K. Kaewchay and J. Mullaney, “Determining patterns of student graduation using a bi-level learning framework,” Bulletin of Electrical Engineering and Informatics, vol. 10, no. 4, pp. 2201–2211, 2021. [Google Scholar]
28. P. Panwong, T. Boongoen and N. Iam-On, “Improving consensus clustering with noise-induced ensemble generation,” Expert Systems with Applications, vol. 146, pp. 113–138, 2020. [Google Scholar]
29. N. Iam-On and T. Boongoen, “Diversity-driven generation of link-based cluster ensemble and application to data classification,” Expert Systems with Applications, vol. 42, no. 21, pp. 8259–8273, 2015. [Google Scholar]
30. R. Kessler, G. Narayan, A. Avelino, E. Bachelet, R. Biswas et al., “Models and simulations for the photometric LSST astronomical time series classification challenge (PLAsTiCC),” Publications of the Astronomical Society of the Pacific, vol. 131, no. 094501, pp. 1–35, 2019. [Google Scholar]
31. G. Taylor, C. Lidman, B. E. Tucker, D. Brout, S. R. Hinton et al., “A revised SALT2 surface for fitting Type Ia supernova light curves,” Monthly Notices of the Royal Astronomical Society, vol. 504, no. 3, pp. 4111–4122, 2021. [Google Scholar]
32. M. Pattanodom, N. Iam-On and T. Boongoen, “Hybrid imputation framework for data clustering using ensemble method,” in Proc. of Asian Conf. on Information Systems, Krabi, Thailand, pp. 86–91, 2016. [Google Scholar]
33. K. Sriwanna, T. Boongoen and N. Iam-On, “Graph clustering-based discretization of splitting and merging methods (graphs and graphm),” Human-centric Computing & Information Sciences, vol. 7, no. 1, pp. 1–39, 2017. [Google Scholar]
34. X. Fu, T. Boongoen and Q. Shen, “Evidence directed generation of plausible crime scenarios with identity resolution,” Applied Artificial Intelligence, vol. 24, no. 4, pp. 253–276, 2010. [Google Scholar]
Cite This Article
 Copyright © 2023 The Author(s). Published by Tech Science Press.
This work is licensed under a Creative Commons Attribution 4.0 International License , which permits unrestricted use, distribution, and reproduction in any medium, provided the original work is properly cited.
 Downloads
 Citation Tools