
 Submit a Paper
 Propose a Special lssue
 Open Access
ARTICLE
GRU-based Buzzer Ensemble for Abnormal Detection in Industrial Control Systems
1 Interdisciplinary Program of Information Security, Chonnam National University, Gwangju, 61186, Korea
2 Major in Computer Engineering, Chonnam National University, Yeosu, 59626, Korea
3 School of Business Administration, Chonnam National University, Gwangju, 61186, Korea
4 Department of Electronic Commerce, Chonnam National University, Yeosu, 59626, Korea
* Corresponding Author: Yong-Min Kim. Email:
Computers, Materials & Continua 2023, 74(1), 1749-1763. https://doi.org/10.32604/cmc.2023.026708
Received 02 January 2022; Accepted 23 February 2022; Issue published 22 September 2022
 View Full Text
 Download PDF
Abstract
Recently, Industrial Control Systems (ICSs) have been changing from a closed environment to an open environment because of the expansion of digital transformation, smart factories, and Industrial Internet of Things (IIoT). Since security accidents that occur in ICSs can cause national confusion and human casualties, research on detecting abnormalities by using normal operation data learning is being actively conducted. The single technique proposed by existing studies does not detect abnormalities well or provide satisfactory results. In this paper, we propose a GRU-based Buzzer Ensemble for Abnormal Detection (GBE-AD) model for detecting anomalies in industrial control systems to ensure rapid response and process availability. The newly proposed ensemble model of the buzzer method resolves False Negatives (FNs) by complementing the limited range that can be detected in a single model because of the internal models composing GBE-AD. Because the internal models remain suppressed for False Positives (FPs), GBE-AD provides better generalization. In addition, we generated mean prediction error data in GBE-AD and inferred abnormal processes using soft and hard clustering. We confirmed that the detection model's Time-series Aware Precision (TaP) suppressed FPs at 97.67%. The final performance was 94.04% in an experiment using an HIL-based Augmented ICS (HAI) Security Dataset (ver.21.03) among public datasets.Keywords
In the past, industrial control systems were protected by whitelist-based detection [1,2], separation-based technologies [3] and fault diagnosis prediction [4] in closed environments. But recent industrial control systems are being converted to open environments with the expansion of digital transformation, smart factories, and IIoT. As the industrial control system transforms itself into an environment that can operate and control itself, research on Operational Technology (OT) security using artificial intelligence technology is under way.
Abnormal processes in industrial control systems can occur in various ways, such as from cyberattacks (e.g., malicious code infection, control logic changes), hardware and software errors, operator errors, and environmental factors. In particular, if the control logic of the safety system is changed, that may lead to facility destruction, operation interruption, and even casualties. In case of attack by bypassing the IT system (e.g., Ukraine power grid hack, Triton Attack), the OT system must be able to detect it. Therefore, it is necessary to detect abnormal processes by using learning operation data that occurs between processes.
In the abnormal detection studies [5–13] using various deep learning models and detection techniques based on operation data, the most important consideration is how to detect new and unknown attacks. However, if an abnormal process is detected based on the prediction error of a deep learning model trained on normal operation data, it is directly related to the cost of response, such as on-site due diligence and process interruption, so the problem of FPs must be addressed. One must also be able to identify the physical location of a detected anomaly.
In this paper, we propose a GRU-based Buzzer Ensemble for Abnormal Detection (GBE-AD) model with suppressed FPs and infer the abnormal process by means of soft and hard clustering from the mean prediction error (MPE) generated from the built model. The first step in detecting anomalies is to build a Gated Recurrent Units (GRU) [14] prediction model by means of training data consisting of only normal data. In the second step, the time step (window size) of the time-series data is set differently, and the training data is shuffled to create a model similar to the first built model. This is defined by the internal model of GBE-AD. Each internal model has a threshold for suppressing FPs, and the internal models are complementary to FNs. Finally, the prediction error data collected from the detection model is generated, and the detailed process of the abnormal data is inferred by means of fuzzy c-means and k-means clustering.
Suggestions contributed are:
■ We propose a GBE-AD model with suppressed FPs using GRU.
■ We derived the detailed process points of the abnormal process from the MPE data collected from the predictive model.
■ We confirmed that FPs were suppressed in TaP 97.67% of the detection model, and the final performance was 94.04%. In addition, by clustering the MPE data, we could infer the detailed process of the abnormal data.
2.1 HIL-based Augmented ICS (HAI) Security Dataset
The ICS public dataset is being published for industrial control system security research. Among them, the HAI dataset used in this paper was constructed to facilitate synchronization between components and data collection by means of OPC-UA (Open Platform Communications-Unified Architecture) and Hardware-in-the-loop (HIL) simulation. In addition, it is a very reliable dataset, because it includes various stealth attacks and labels them by means of information generated using automated attack tools [15].
As shown in Fig. 1, The HAI 21.03 dataset uses normal data collected for 352 h of 78 data points in a testbed consisting of a boiler, turbine, water treatment process, and HIL simulator as training data, and includes 50 attack scenarios for 112 h. Abnormal data is used as test data [16].
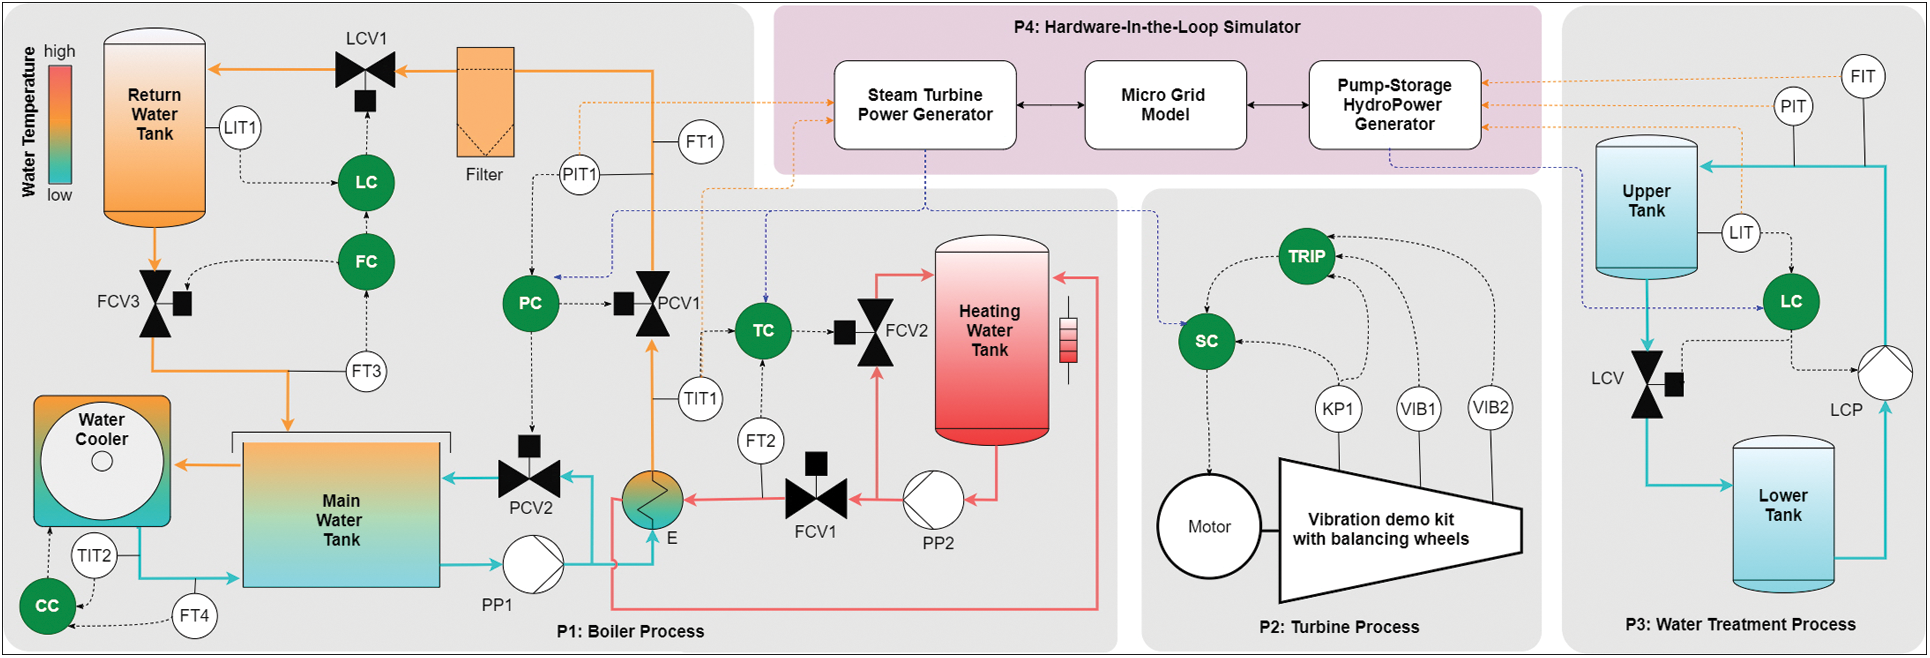
Figure 1: Process control architecture of HAI Testbed
2.2 Approaches to Detecting Abnormalities in ICSs
Detecting abnormalities by means of operation data learning aims to protect the level 0 ∼ 1 area of the Purdue Model [17] that has actuators, sensors, and controllers. Threat modeling can be defined as outliers of sensors and actuators, injected network traffic, and damage to control systems [18].
Continuous monitoring is required to ensure the data integrity and deterministic output of the ICS process. However, as the complexity of industrial control systems increases and attacks become more precise, creating a knowledge-based model using domain knowledge cannot resolve the problem. For detecting new abnormalities of industrial control systems, a deep learning-based approach has been studied, as shown in Tab. 1.
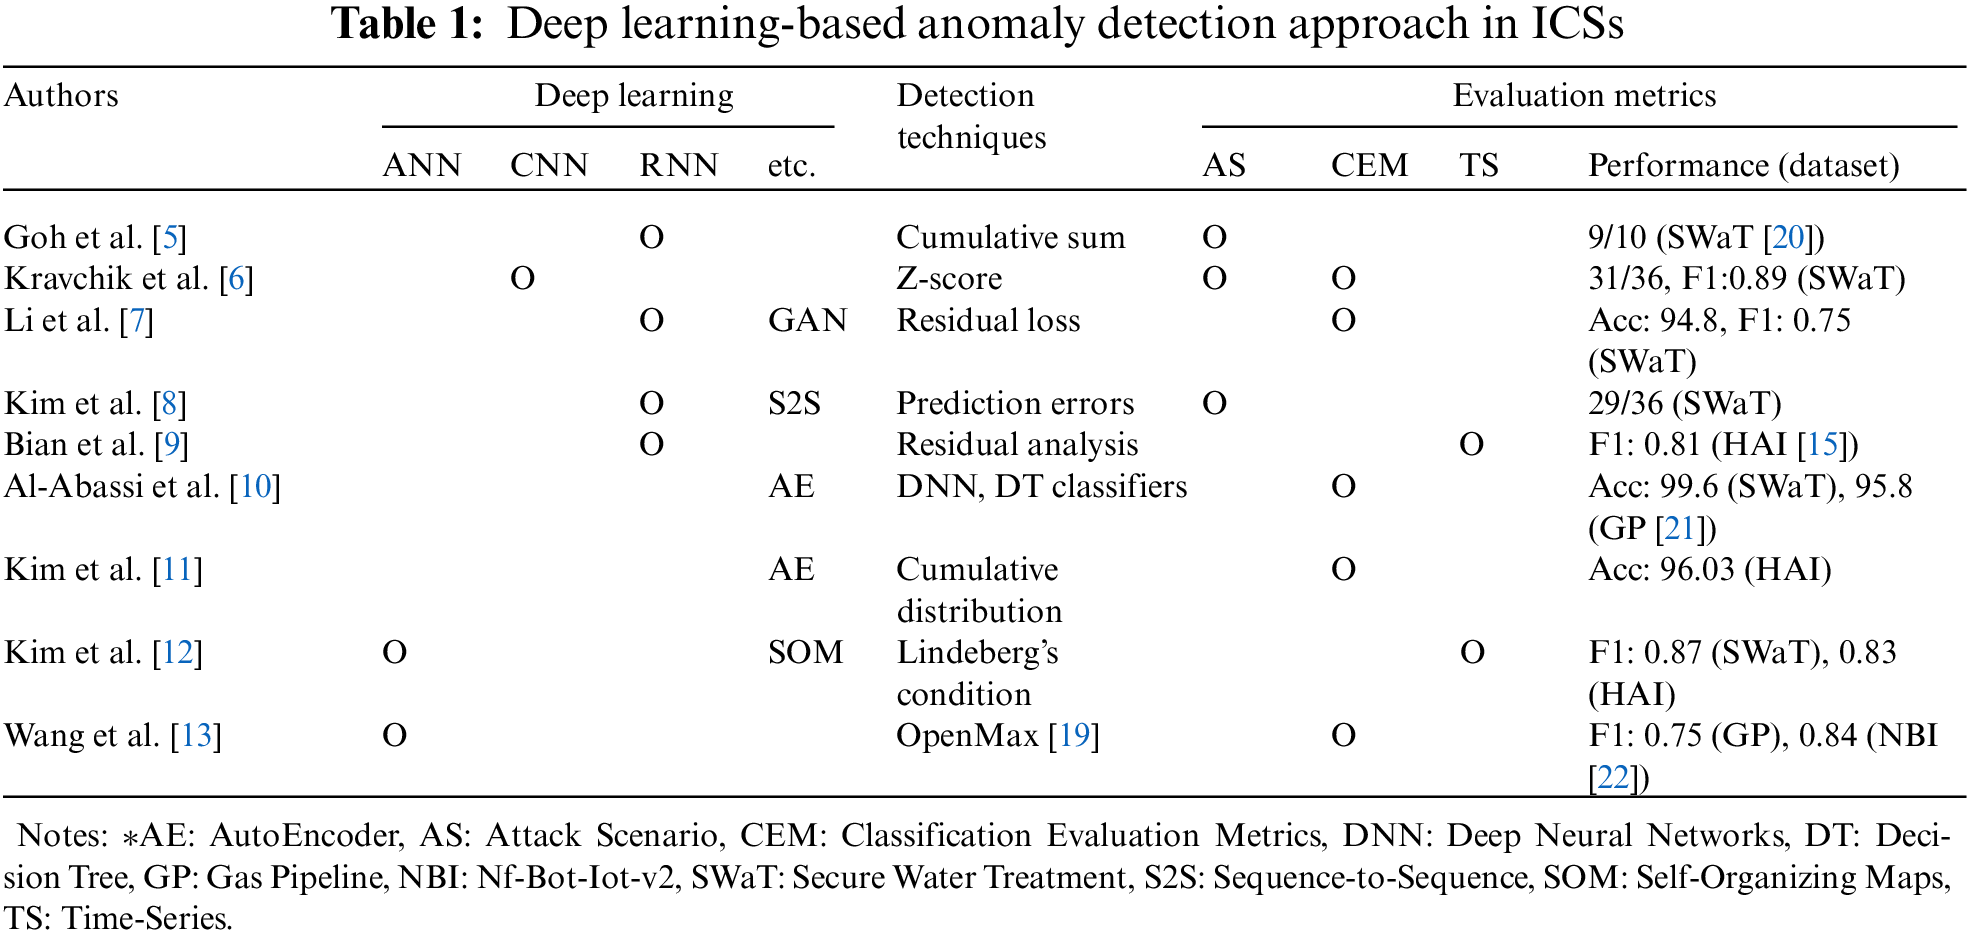
In most studies using deep learning, abnormalities were detected by means of the threshold-based results of residual analysis and prediction error techniques [5–6,8,9,11,12]. In addition, abnormal data that does not belong to the normal data group was detected with each technique, such as reconstruction error using GAN (Generative Adversarial Networks) discriminator, classification by decision tree, and unknown class classification using open set recognition [7,10,13]. Each study uses different evaluation indicators, such as attack scenarios, classification evaluation metrics, and time-series evaluation metrics to represent the research results.
Considerations for detecting abnormalities of industrial control systems:
■ In order for a model to be used in various industrial control systems, it must compare the difference between the actual value and the predicted value by predicting with a multivariate regression model based on unsupervised learning.
■ Because a single model may not detect anomalies well, it needs to be improved.
■ The performance of the detection model should be measured using a time-series-based evaluation considering the process environment.
■ When deciding whether to update the detection model, one must restore the result data related to detecting abnormalities as data that can be analyzed.
■ When detecting anomalies for the entire process, one must reduce the problem of response costs.
3 Proposed GRU-based Buzzer Ensemble Scheme for Abnormal Detection
In this section, we propose a GBE-AD to detect abnormal processes by learning operation data of industrial control systems. Since a single model using deep learning learns and analyzes data by means of a single technique, it does not detect anomalies well. In addition, the most important point in anomaly detection is to minimize detection errors (FPs, FNs). As shown in Fig. 2, the proposed model learns the same data from various perspectives, so that comprehensive conclusions can be drawn.
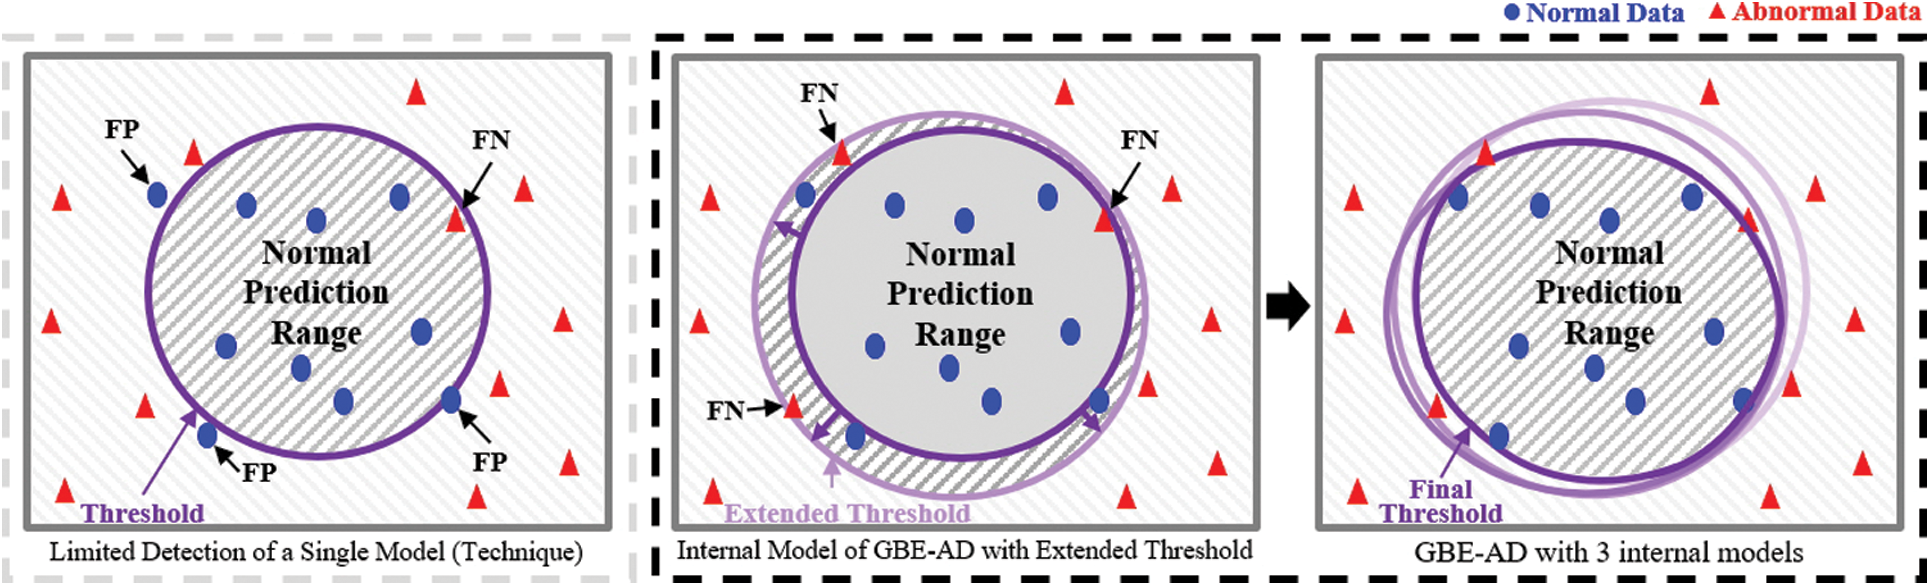
Figure 2: Comparison of detecting abnormalities by means of a single model and the proposed model
The use of a single model may include abnormal data in the prediction range or normal data outside the prediction range. Even if the trained model distinguishes the data well, there is a high possibility of overfitting; so normal data is included by extending the prediction range by setting the threshold high. By calculating a new prediction range in multiple internal models with the same learning rate, we found the abnormal data to be out of the prediction range.
The prediction error of the actual value in the model prediction value is
Extended Threshold (ET) is set to a value slightly higher than
Thus,
This section is divided into four subsections:
■ Data Preprocessing includes the process of scaling operation data and then converting it into time-series data.
■ In the model tuning process, we describe how to select the optimal hyperparameter and create an internal model that composes GBE-AD.
■ Describes the buzzer method ensemble technique of the proposed model.
■ When abnormal process is detected, the internal model of GBE-AD generates mean prediction error data and infers the abnormal detailed processes.
Data Preprocessing required for training is very important. Operation data generated in industrial processes is the result of the operation of industrial facilities. It has deterministic properties, and its physical state changes over time. Therefore, it is appropriate to interpret it in the form of time-series data according to the operating environment.
Since the data must be converted to time-series data, it may interfere with learning if it is not numeric data. The features required for learning use the points of the process. null, not a number, and missing values of data are handled because all data generated in a normal operating environment must be quantified. Because the scale is different for each point of the operational data, one must prevent the learning model from having bias. Min-Max Normalization is used for data scaling as follows, and the original data can be restored by means of simple calculations.
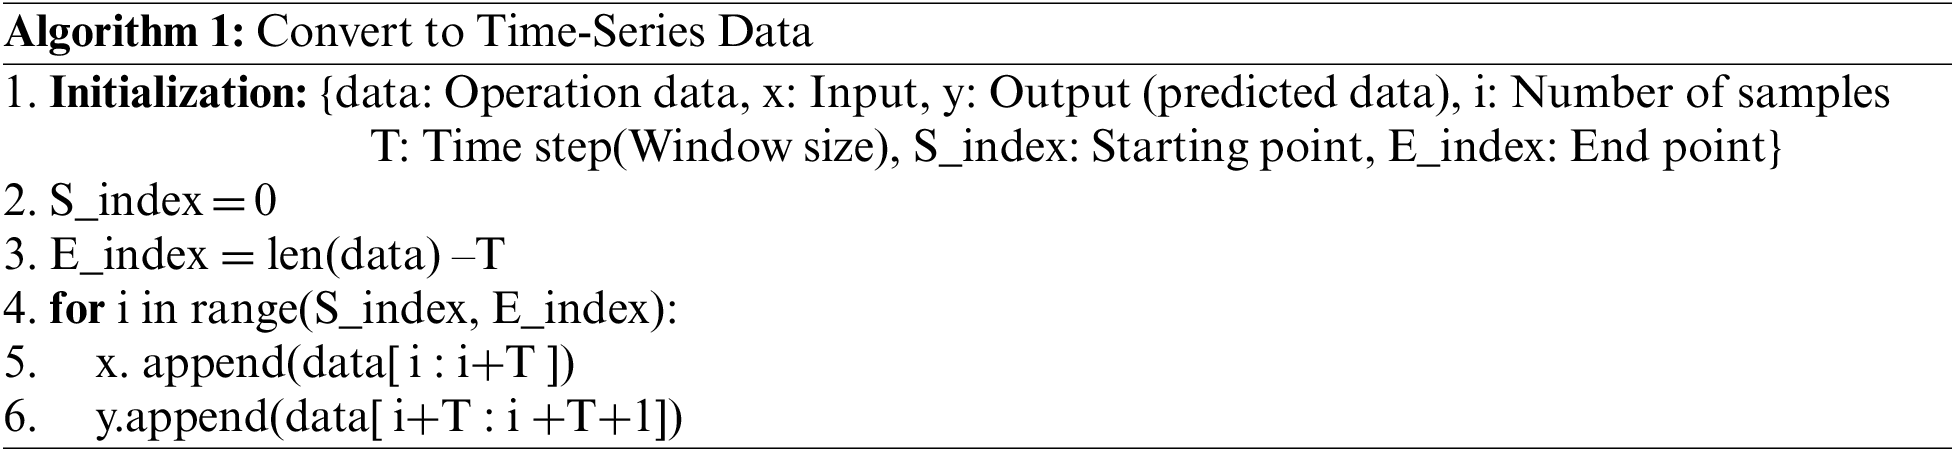
The scaled data is converted into time-series data to complete the data preprocessing. The conversion process is shown in Algorithm 1.
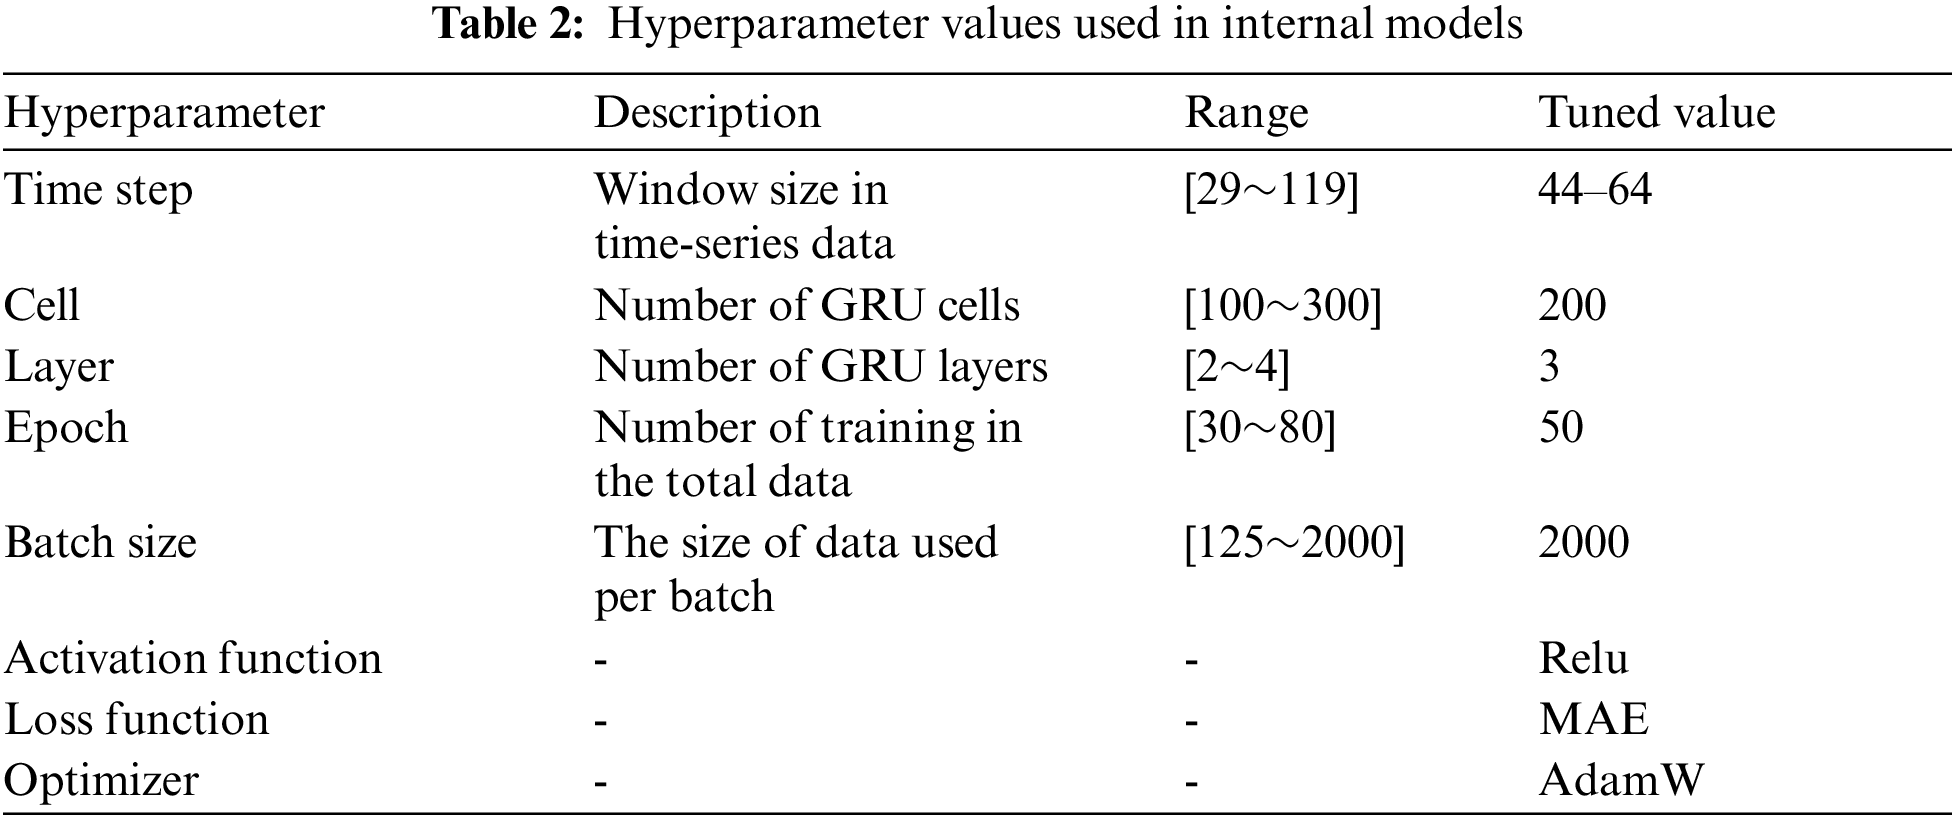
3.2 Tuning of the Internal Model
After completing data preprocessing for training, the model trains and predicts using stacked-GRU. The model generated here is defined as the internal model of GBE-AD, and is tuned for optimization. The hyperparameters used for tuning determine the time step of time-series data, the number of cells and layers, epoch, and batch size [23]. We used grid search for the optimization, as shown in Tab. 2.
In addition, we created the final model by removing unnecessary features from the tuned full model. Since the internal model was created using all points as features, we removed unnecessary features by means of Backward Elimination. An internal model with unnecessary features removed is shown in Fig. 3.
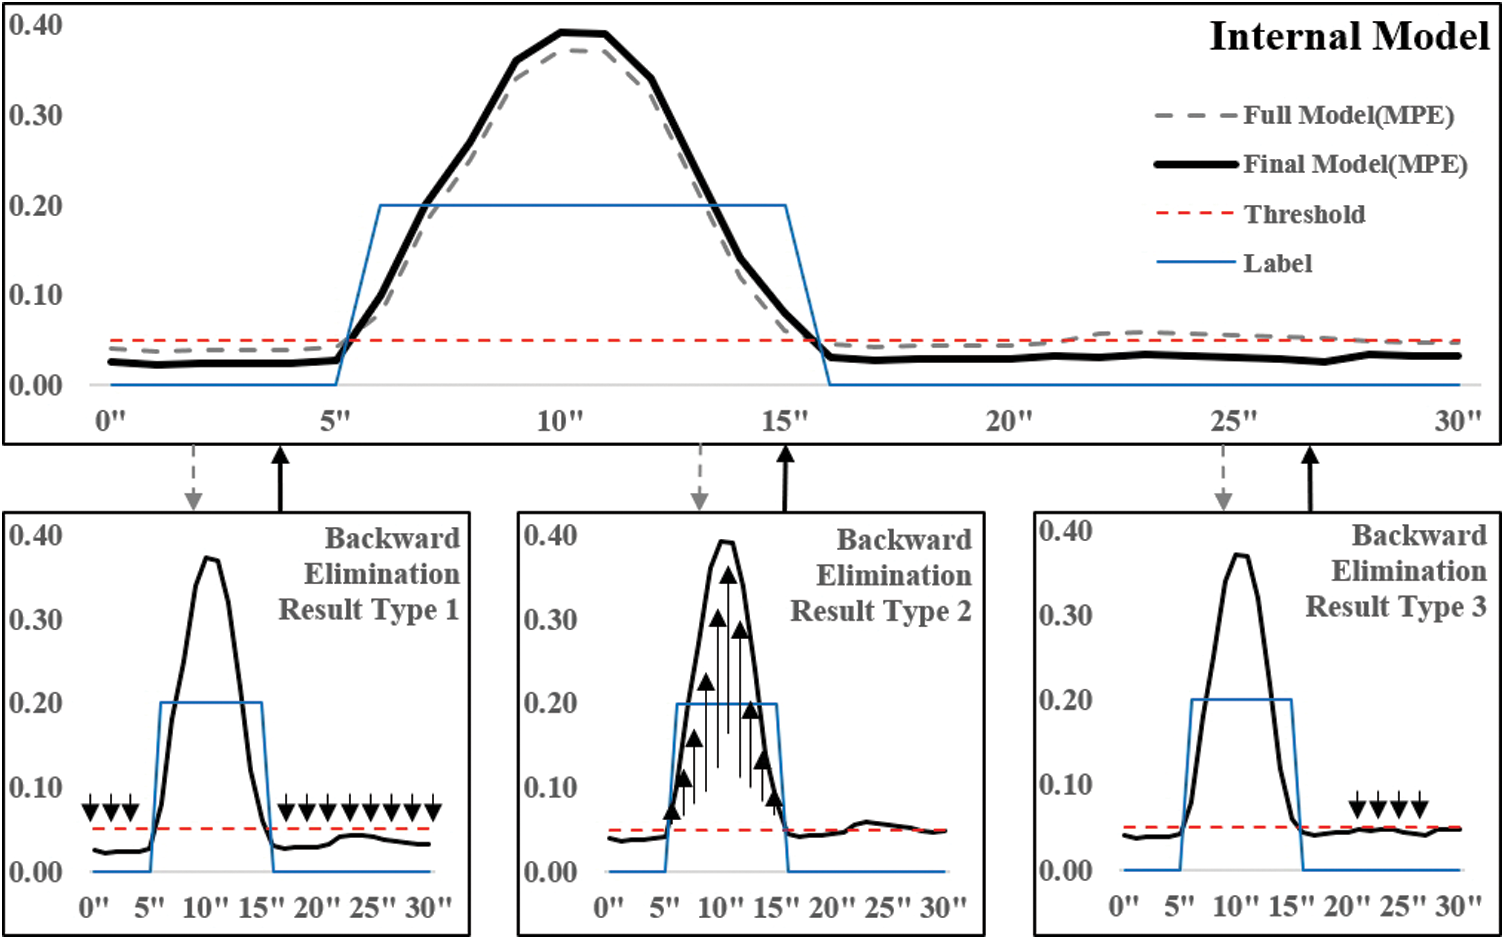
Figure 3: Model optimization using feature selection (backward elimination)
A label value of “0.00” is in the normal range, and “0.20” is in the abnormal range. There are three types of model optimization results using Backward Elimination:
■ Type 1 evaluation lowers the MPE for normal data.
■ Type 2 evaluation increases the MPE for abnormal data.
■ Type 3 evaluation lowers the MPE range of normal data identified as anomalies.
The structure and operation process of the proposed GBE-AD model are shown in Fig. 4. It combines multiple internal models. Even if each internal model has different results (abnormal or normal), it is reliable enough because FPs are suppressed by setting the threshold high. Reliable internal models solve the FNs problem by complementing each other.
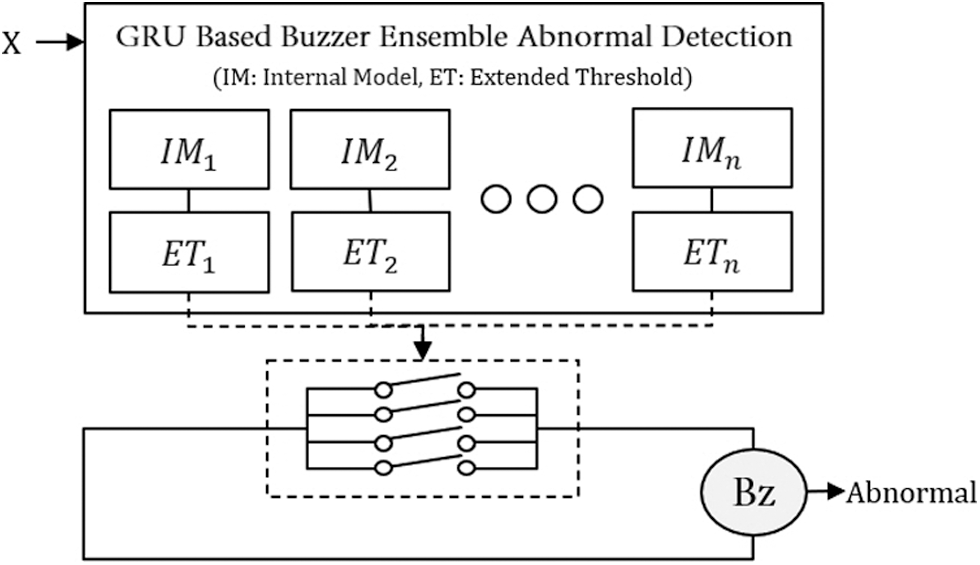
Figure 4: Operational process of the proposed GBE-AD model
The hyperparameters of the internal models differ only in time-step and data shuffle, and the rest are the same as in Tab. 2. Each internal model shuffled the normal data used for learning, so that the learning participation rate was the same. Data shuffle outputs different results within a similar range, because each model interprets the same data from a different point of view. By changing the size of the time step, we induced the prediction value to vary slightly.
Input X expressed as time-series data ‘X’, point (feature) ‘P’, number of points ‘k’, current time ‘t’, and time-step size ‘w’ is as follows:
The data preprocessed with the size of time step for each internal model is input to each internal model, and the mean absolute error of each point is output:
Then, if the output
When abnormal data occurs in the process, it affects for a certain period according to the task sequence, so a range-based performance evaluation is required [24]. We evaluated the performance using TaPR (Time-Series Aware Precision and Recall) [25], which added a score for the ambiguous detection range in which the system does not operate normally during the recovery period of the control system.
3.4 Inferring Abnormal Processes
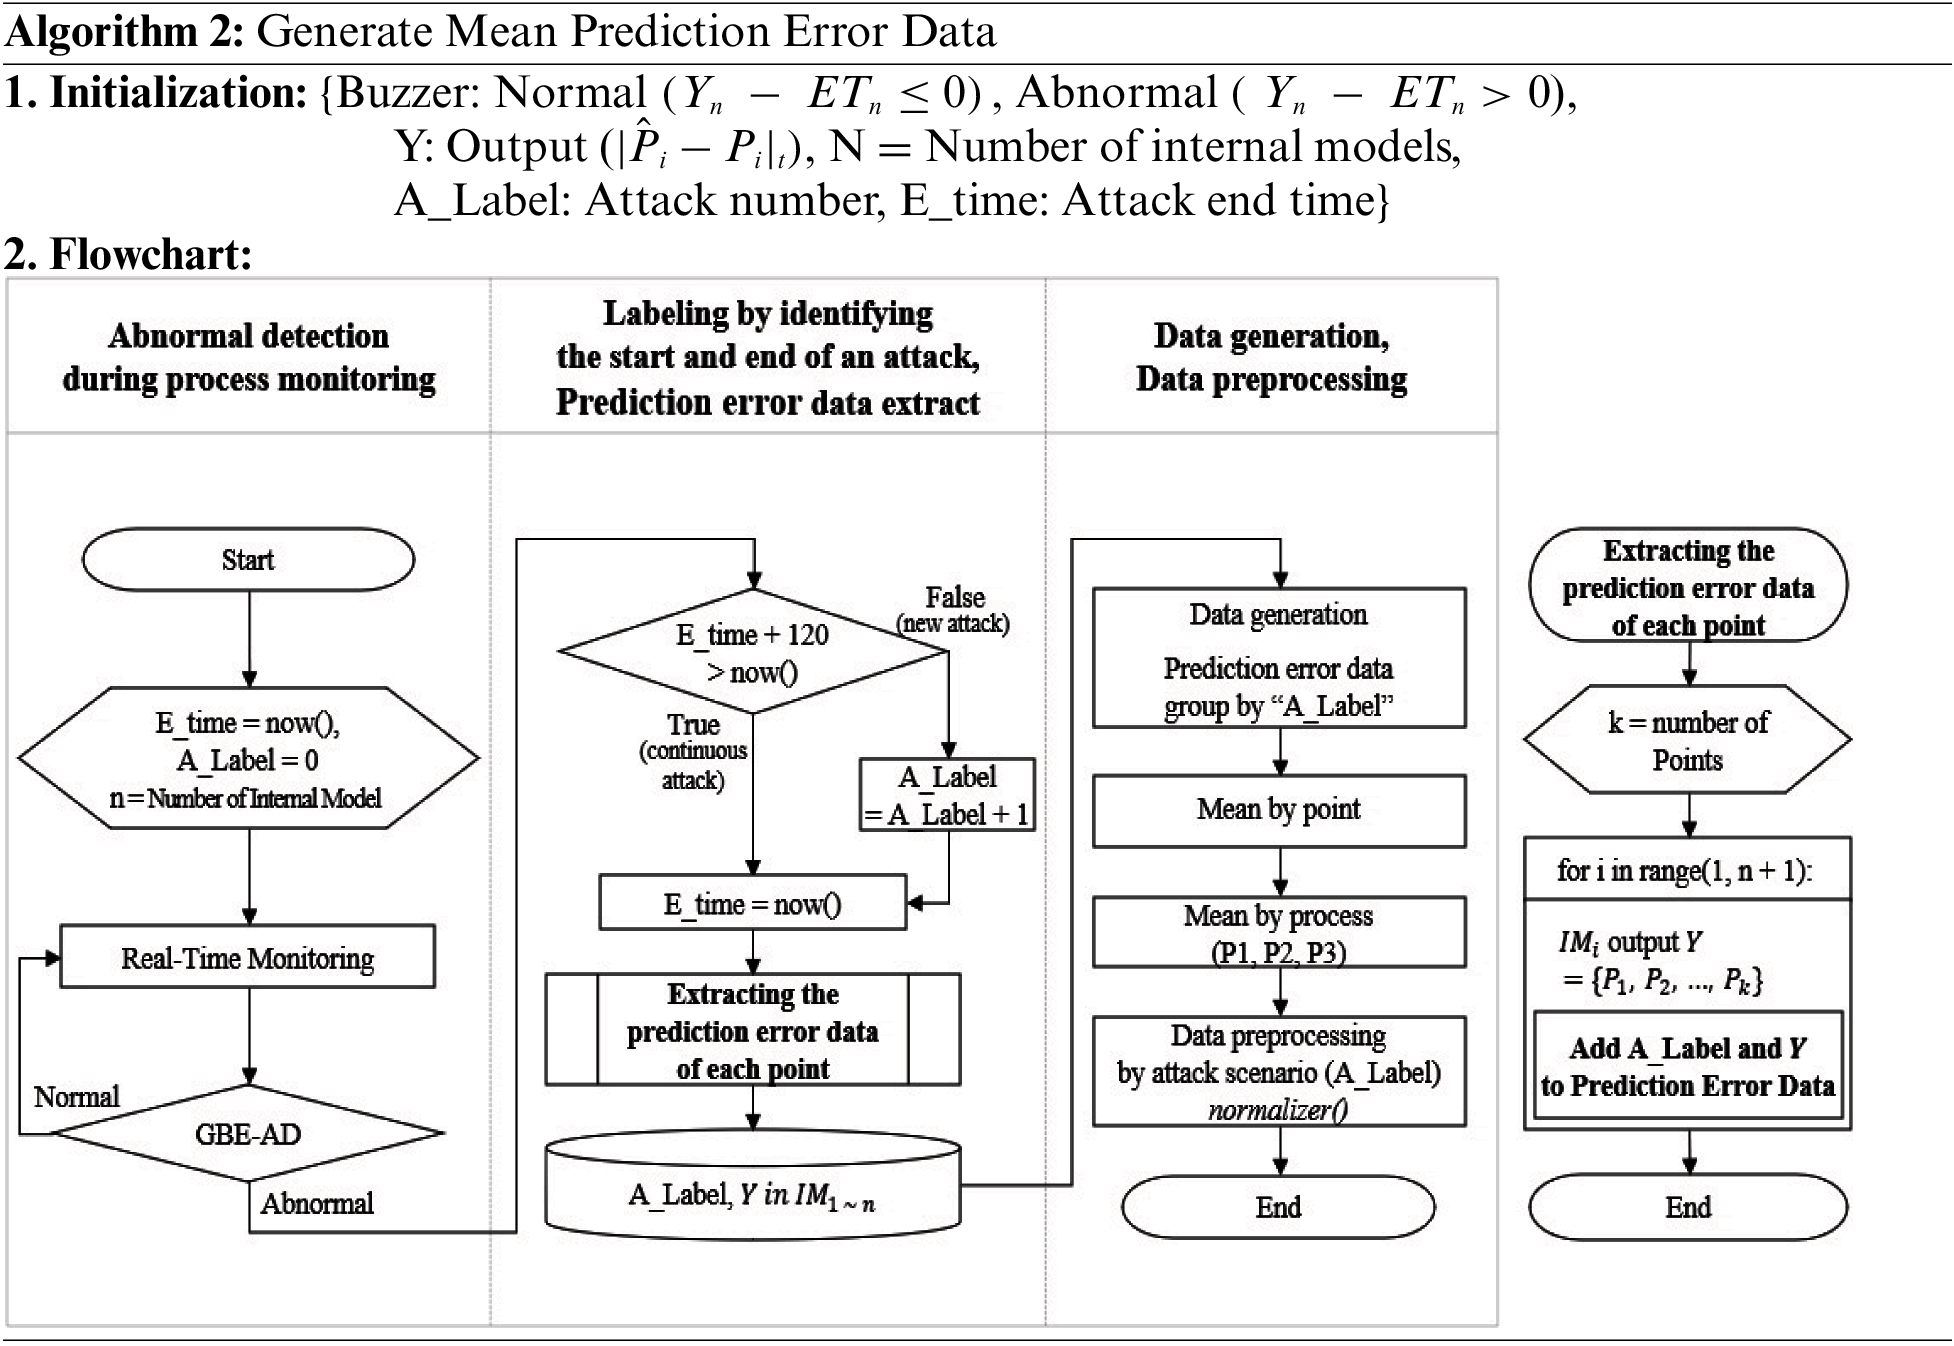
In order to infer the abnormal process, the prediction error data of the detecting abnormalities period is generated in the GBE-AD model. The most important point in this part is to identify the end time of the attack and extract prediction errors for the same attack. Then, the prediction error data for each process is averaged. Since the level of attack difficulty is different for each attack scenario, data preprocessing is calculated as the L2 norm for each process based on the attack scenario.
The order of generating mean prediction error data is shown in Algorithm 2.
■ When the test data is input to the GBE-AD model, the prediction error data detected as anomalies is extracted.
■ The classification of attack scenarios is labeled based on the value of adding 120 s (twice the time step) to the last detection time for each attack.
■ Data is generated by calculating the mean prediction error for each point based on each attack scenario.
■ The mean prediction error for each process is extracted from the generated data and pre-processed using Normalizer() in Scikit-learn.
Finally, in order to derive the abnormal process, the target processes are labeled and the optimal K value is calculated by means of clustering to infer the abnormal process. We used fuzzy c-means and k-means clustering to compare soft and hard clustering.
The experiment consists of the order of detecting abnormalities in the industrial control system and inferring processes.
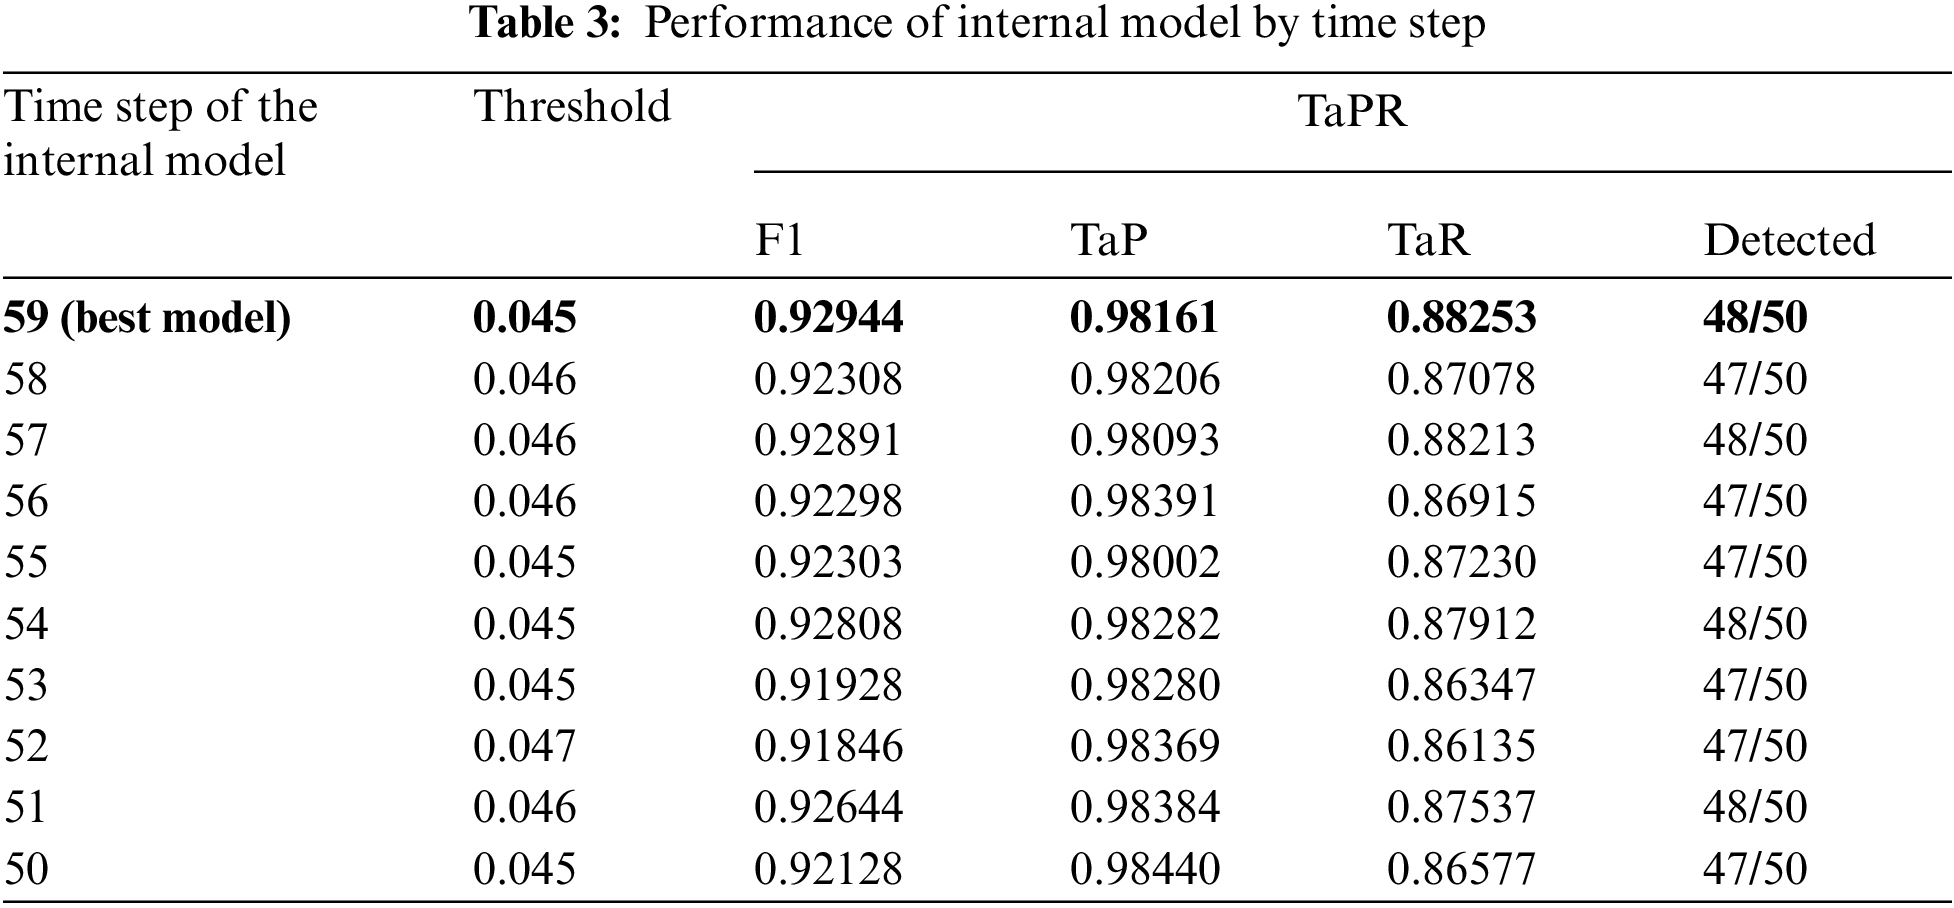
We trained an internal model that constructs GBE-AD based on HAI version 21.03. We used normal data collected over 352 h for training and 112 h of data containing 50 attacks for testing. As shown in Tab. 3, we measured the performance of each internal model. The best internal model had a time step of 59; when the threshold was 0.045, no FPs occurred in the normal interval (TaP: 98.161%). The TaPR f1-score is 92.944%, detecting 48 out of 50 attacks.
Then, we looked at the change in GBE-AD detection rate with each internal model added. When we measured the performance by adding the internal model with the time step reduced by 1 from the best-performing internal model, the final performance was 94.039% as shown in Tab. 4. It was appropriate to use 10 internal models.
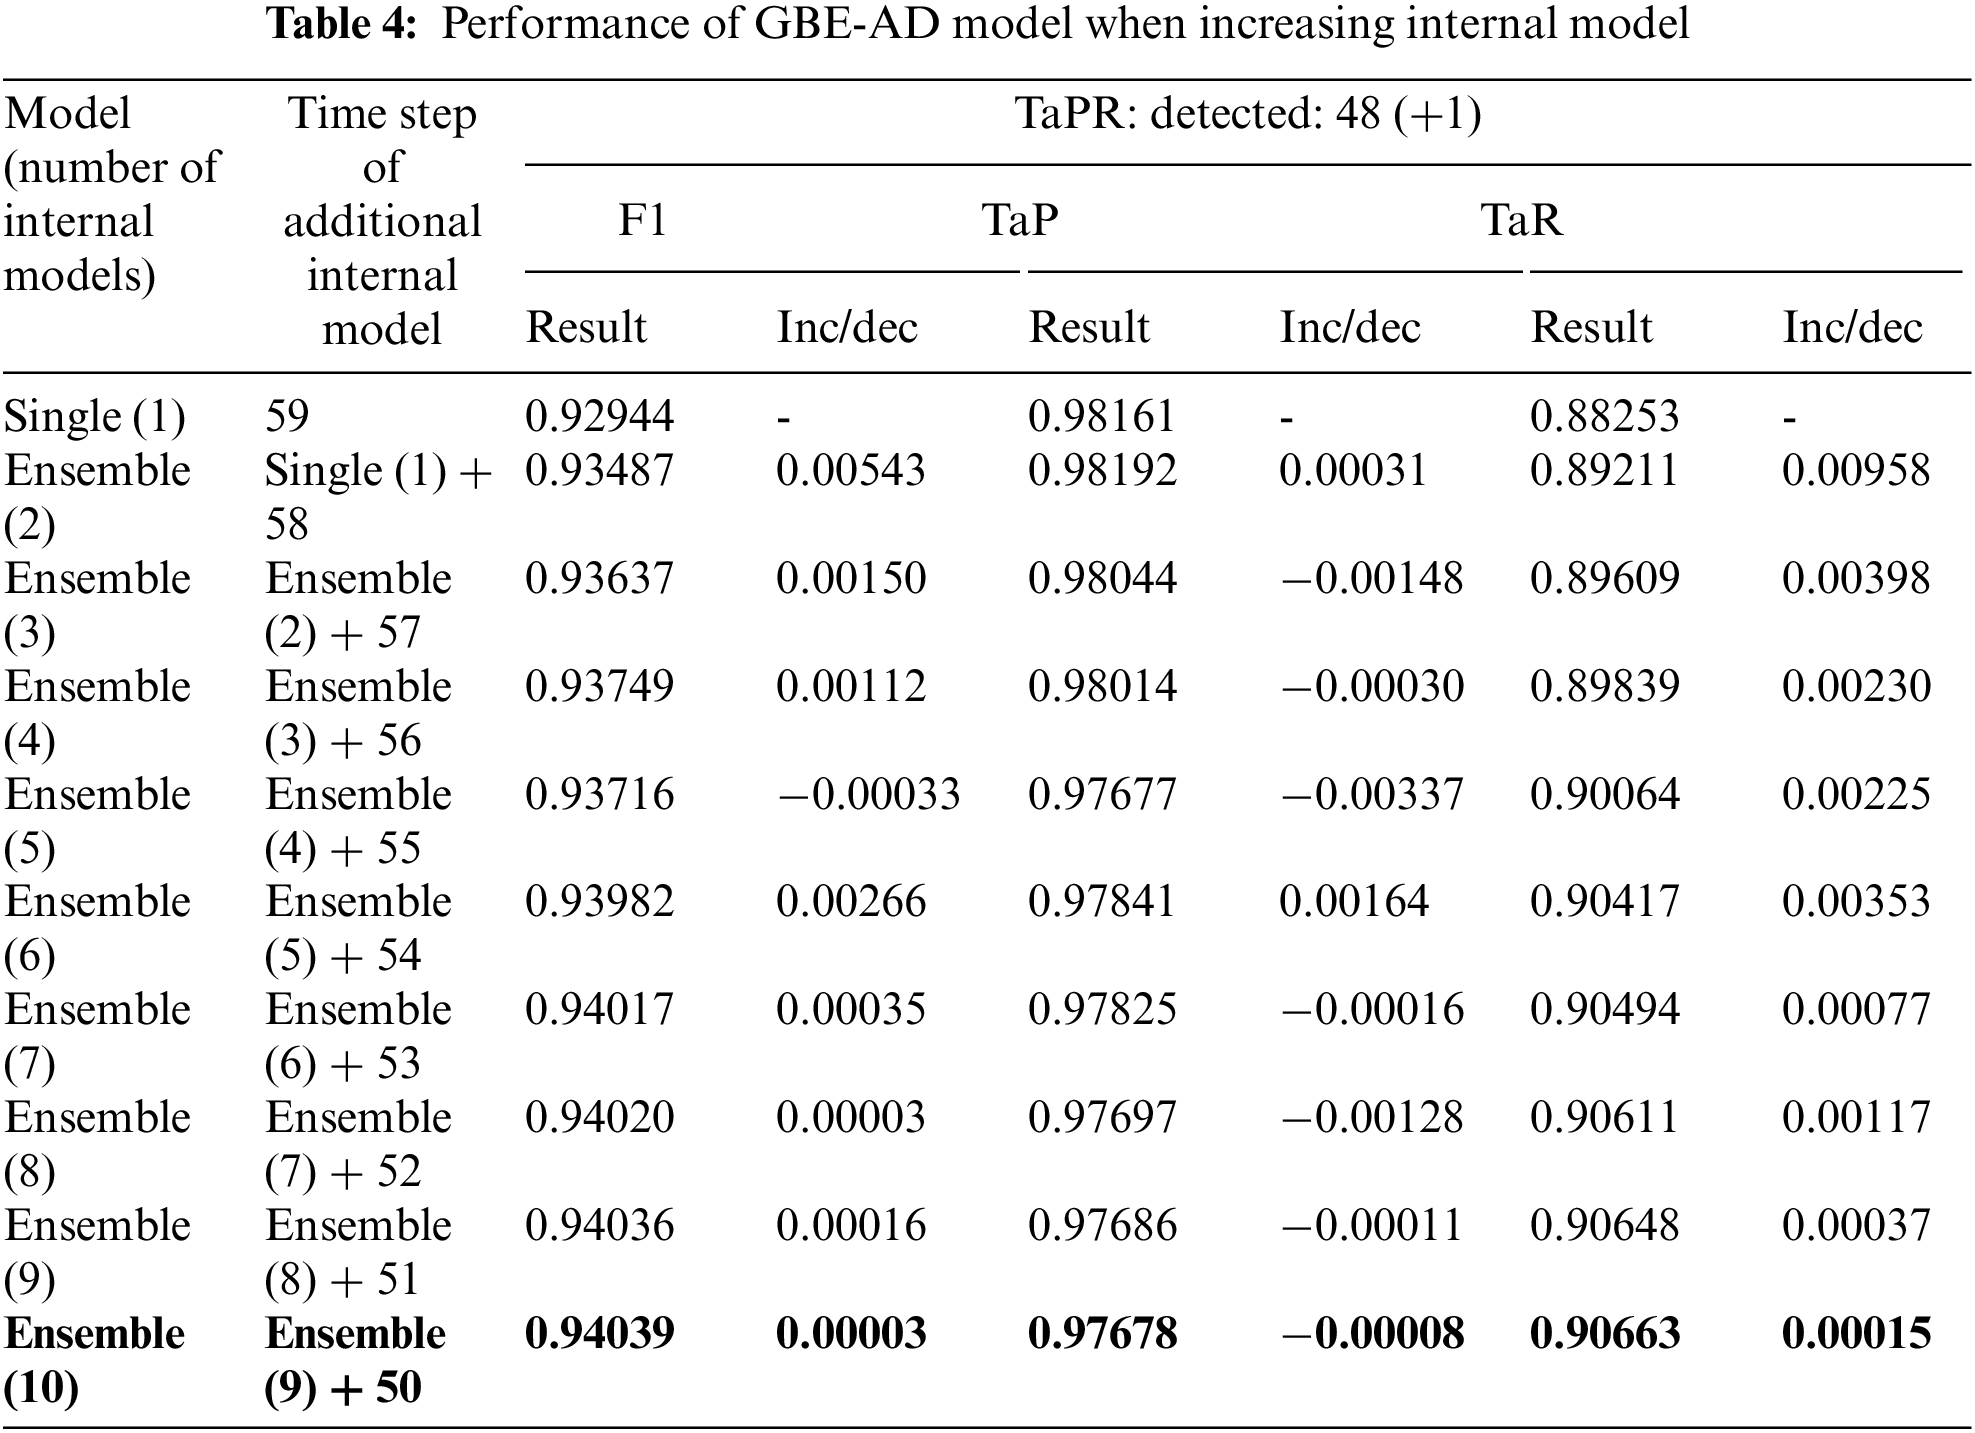
Fig. 5 shows the anomaly detection results of the GBE-AD model on the test data. In TaPR's performance evaluation, attack scenarios 10 and 25 were undetected, but attack scenario 25 was partially detected in the internal model. Since the GBE-AD model keeps FPs suppressed, the anomaly detection results are reliable; so 49 out of 50 attack scenarios were detected.
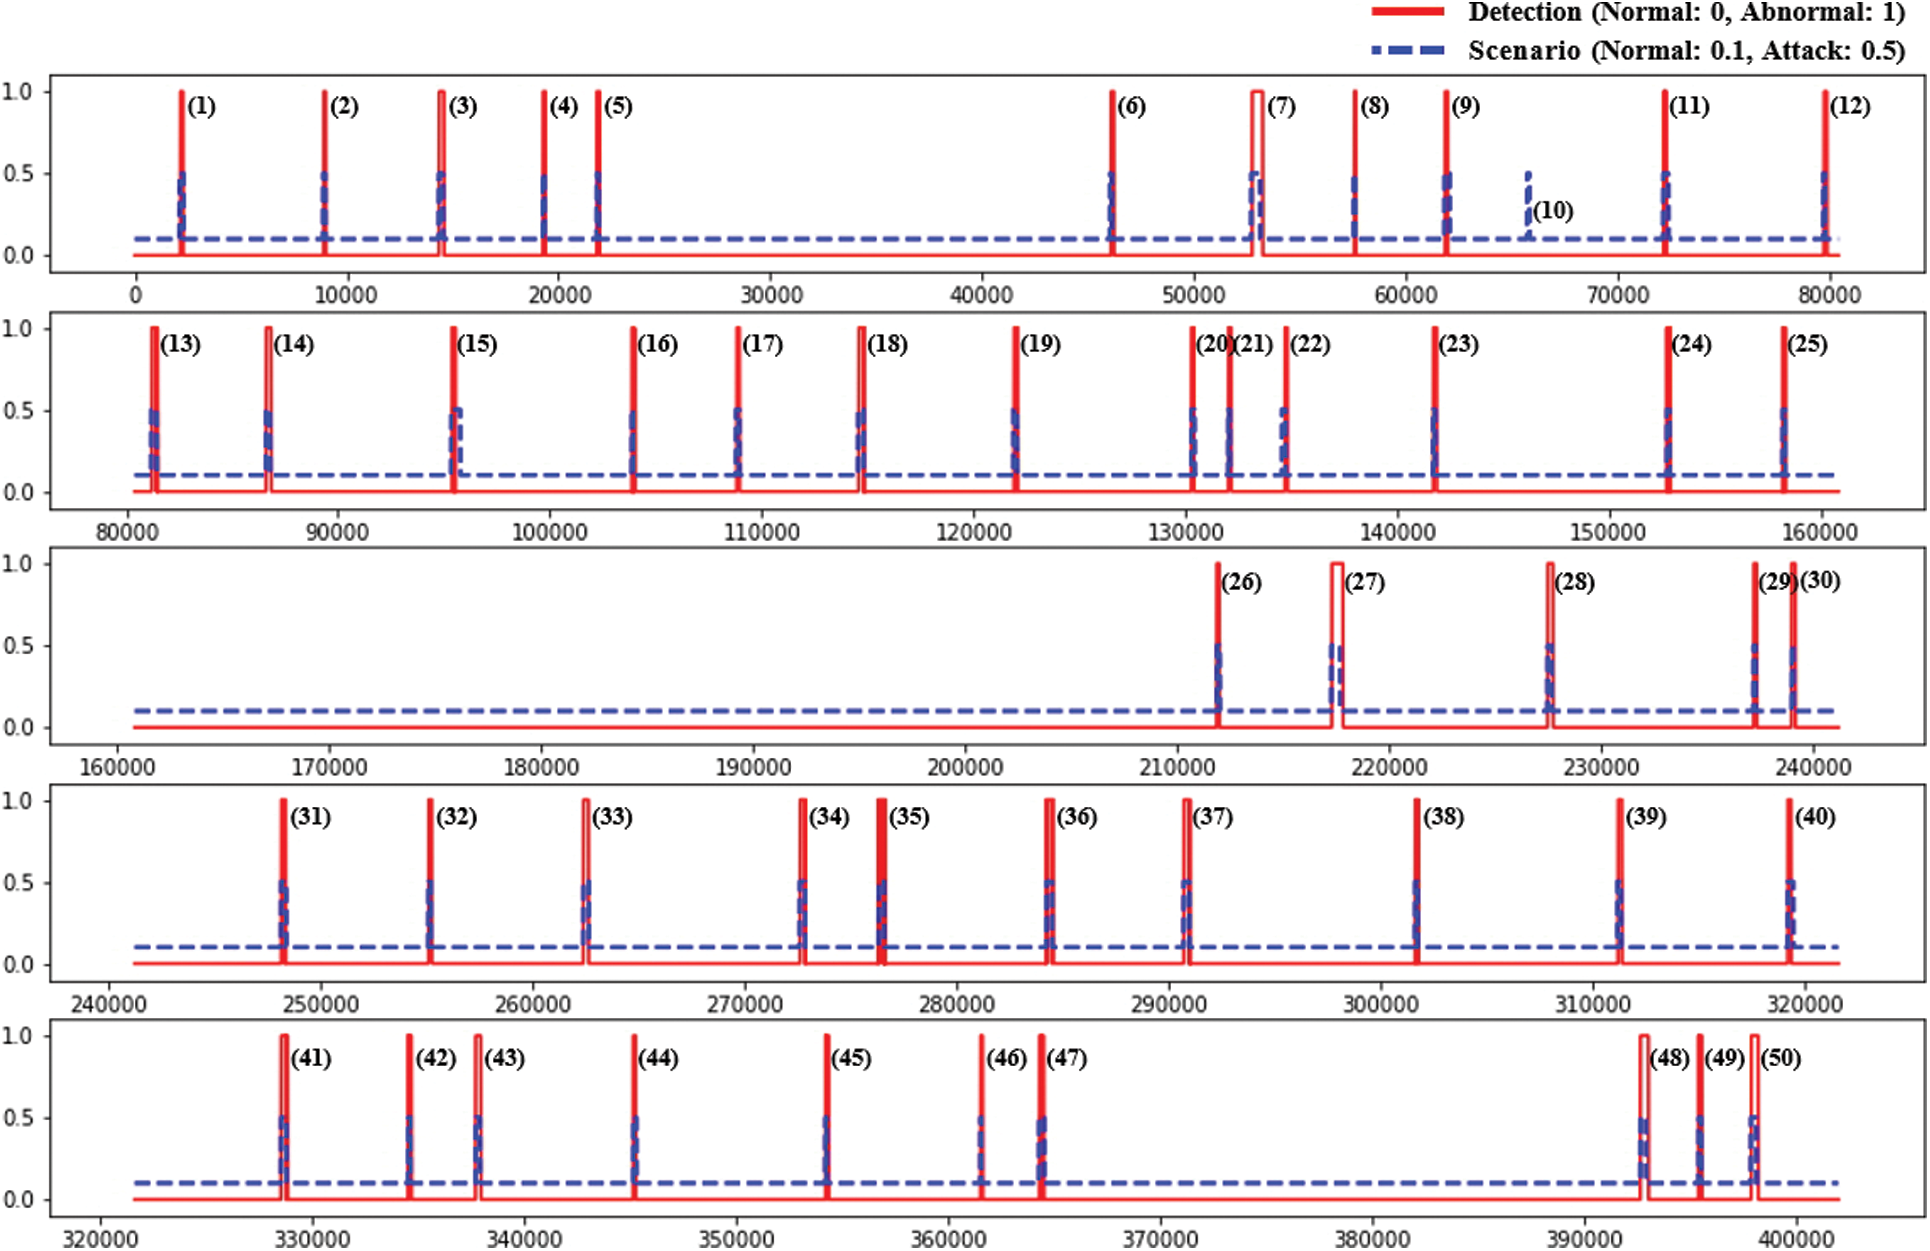
Figure 5: Detection results of the GBE-AD model
4.2 Inferring Abnormal Processes
Based on the 49 attack scenarios detected by GBE-AD, we generated mean prediction error data of each internal model. The Target process was labeled as follows:
■ Single attack: P1 (Boiler) = 1, P2 (Turbine) = 2, P3 (Water-Treatment) = 3
■ Multi attack: P1 + P2 = 4, P1 + P3 = 5, P2 + P3 = 6
We inferred abnormal processes using the fuzzy c-means clustering algorithm of soft clustering and the k-means clustering algorithm of hard clustering. For the number of clusters, we tested the range of 3 to 6 using the number of processes as the minimum value and the number of types of attack scenarios as the maximum value. fuzzy c-means clustering is a soft clustering method; so we set the number of clusters (K) to 3, and tested k-means clustering by increasing the number of clusters to 6 to check whether multiple attacks can be distinguished. As shown in Fig. 6 and Tab. 5, we obtained good results when there were 3 clusters for fuzzy c-means clustering and 3–4 for k-means clustering.
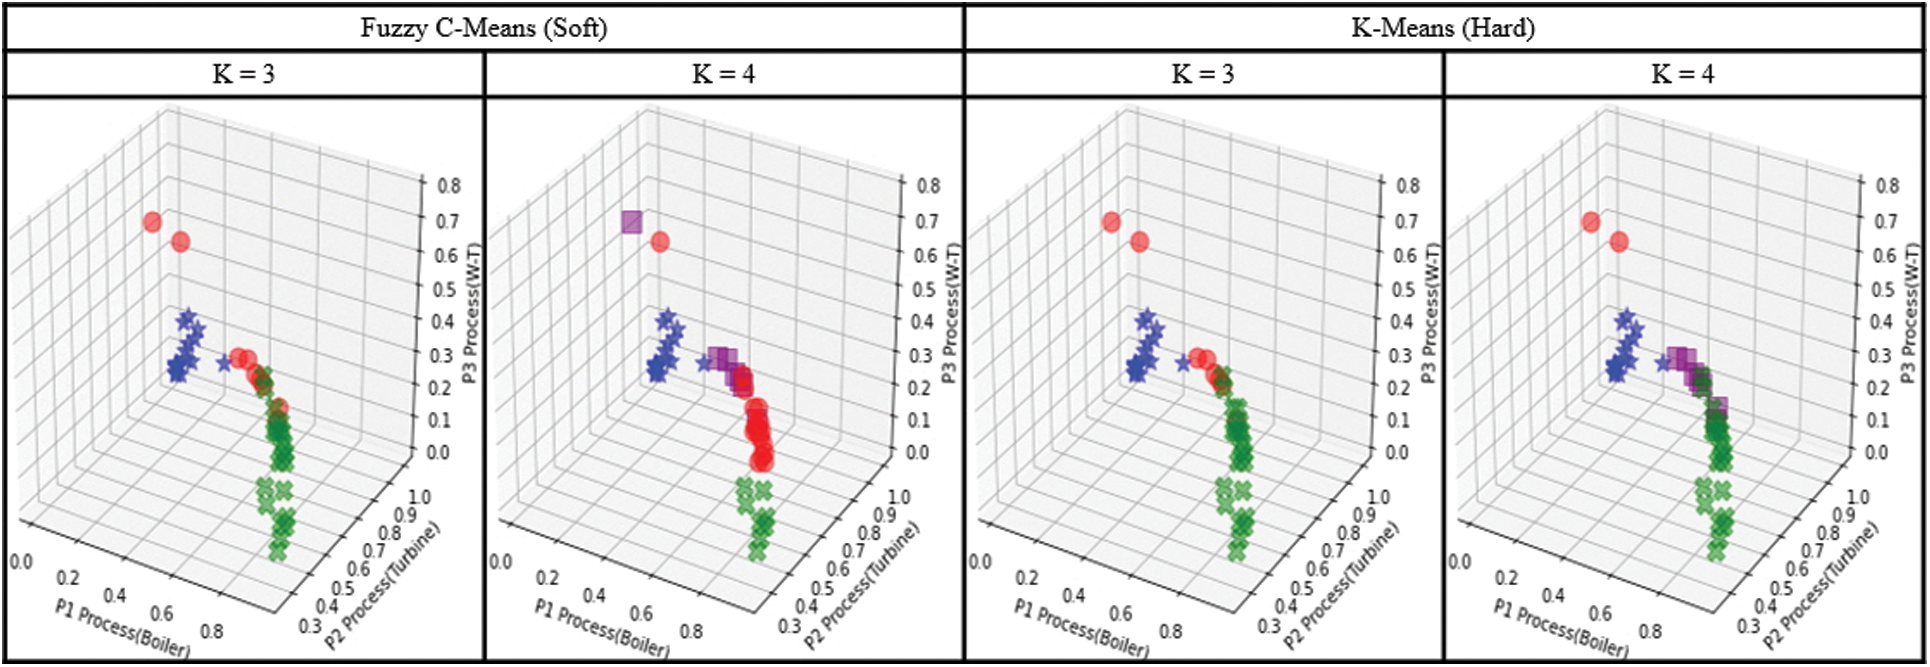
Figure 6: Comparison of clustering methods for abnormal process inference (soft vs. hard)
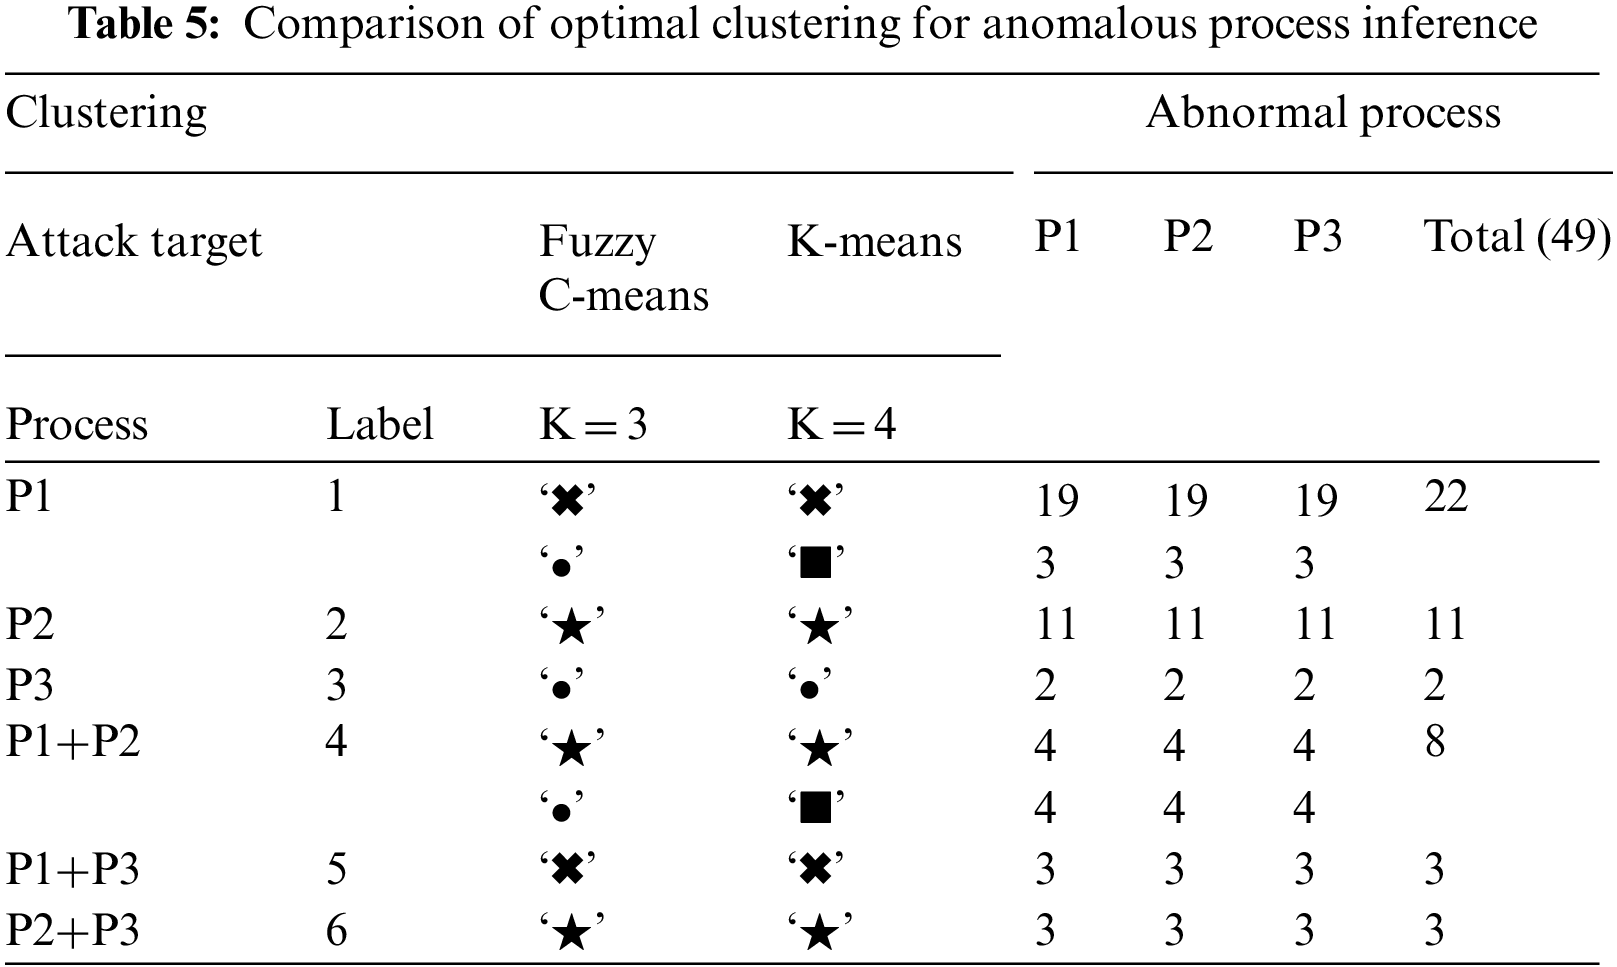
The aggregate results of each clustering in Tab. 5 are as follows:
■ Fuzzy C-Means: ‘✖': {P1, P1+P3}, ‘★': {P2, P1+P2, P2+P3}, ‘●': {P1, P3, P1+P2}
■ K-Means: ‘✖': {P1, P1+P3}, ‘▪': {P1, P1+P2}, ‘★': {P2, P1+P2, P2+P3}, ‘●': {P3}
Fuzzy c-means ‘●’ clusters the cases where the P3 process is attacked. but includes some other processes (P1, P1+P2). Each clustering method accurately derived the target process of a single attack scenario. For multiple attack scenarios, two or more target processes could not be grouped separately, but some of the attacked processes could be inferred.
We evaluated the detection of abnormalities by adding internal models that make up the GBE-AD model one by one. In the process of recovering to normal after attack, TaP decreased by 97.678%, but TaR (Time-series Aware Recall) increased to 90.663% relatively, and FPs did not occur. The GBE-AD model composed of 10 internal models is similar to the increase rate of the previous model, so it is most effective to configure GBE-AD with 10 internal models.
In 50 attack scenarios, attack 10 was not detected by the GBE-AD model; so only 49 attacks were detected. In the internal models constituting GEB-AD, attack 10 was similar to the normal process, so no one was able to detect it. If only the points of a specific process are learned or a technique that can detect subtle differences is added to the internal model, undetected attacks will be detectable.
When compared using soft and hard clustering in an experiment to infer an anomalous process, the target process of a single attack scenario was mostly derived. Since the P1 and P2 processes are synchronized with each other, we confirmed that the prediction error is large in the connected process because of the change in the value of the target point. In addition, since the attack scenario targeting P3 has fewer attacks than did other attacks, only a part of the compound attack could be inferred.
Only some processes were inferred even if the number of clusters was increased in an experiment that derived anomalous processes in multiple attack scenarios, for the following reasons:
■ Since the number of points used in each process is different, the prediction error of each process is affected.
■ The number of attack scenarios is insufficient, and the attack scenarios are unbalanced for each target process.
■ Various attack scenarios should be created to take into account the difficulty and impact and severity of the attack on the process.
We proposed the GBE-AD model by learning operation data to detect abnormal processes because security incidents occurring in industrial control systems can affect the real world. Most of the existing studies have focused on proposing strategies and techniques to detect new attacks. However, FPs and FNs used for detection evaluation affect each other's performance. Abnormal detection should consider FP and FN simultaneously. In this paper, we solved the FNs problem by combining internal models after suppressing the FPs problem of each internal model constituting GEB-AD. The proposed ensemble model suppressed FPs. Thus, a complementary approach to FNs is possible even when combined with other internal models. The buzzer ensemble technique can improve the abnormal detection limit of a single model or technique. In addition, the model may be able to infer abnormal processes by generating prediction error data in GBE-AD. In a further study, the limitations on the abnormal process inference will be advanced by combining data expansion and domain knowledge of the industrial control system.
Acknowledgement: This work was supported by Institute of Information & communications Technology Planning & Evaluation (IITP) grant funded by Korea government Ministry of Science, ICT (MSIT) (No. 2019-0-01343, convergence security core talent training business).
Funding Statement: The authors received no specific funding for this study.
Conflicts of Interest: The authors declare that they have no conflicts of interest to report regarding the present study.
References
1. H. Yoo, J. -H. Yun and T. Shon, “Whitelist-based anomaly detection for industrial control system security,” The Journal of Korean Institute of Communications and Information Sciences, vol. 38B, no. 8, pp. 641–653, 2013. [Google Scholar]
2. S. Fujita, K. Sawada, S. Shin and S. Hosokawa, “Model verification and exhaustive testing for whitelist function of industrial control system,” in IECON 2019-45th Annual Conf. of the IEEE Industrial Electronics Society, Lisbon, Portugal, pp. 5874–5879, 2019. [Google Scholar]
3. X. Pan, H. Li, X. Li, L. Xu and Y. Sun, “PLC protection system based on verification separation,” Computers, Materials & Continua, vol. 71, no. 1, pp. 2401–2417, 2022. [Google Scholar]
4. R. Surendran, O. I. Khalaf and C. A. T. Romero, “Deep learning based intelligent industrial fault diagnosis model,” Computers, Materials & Continua, vol. 70, no. 3, pp. 6323–6338, 2022. [Google Scholar]
5. J. Goh, S. Adepu, M. Tan and Z. S. Lee, “Anomaly detection in cyber physical systems using recurrent neural networks,” in 2017 IEEE 18th Int. Symp. on High Assurance Systems Engineering (HASE), Singapore, pp. 140–145, 2017. [Google Scholar]
6. M. Kravchik and A. Shabtai, “Detecting cyber attacks in industrial control systems using convolutional neural networks,” in CPS-SPC ‘18: Proc. of the 2018 Workshop on Cyber-Physical Systems Security and Privacy, Toronto, ON, Canada, pp. 72–83, 2018. [Google Scholar]
7. D. Li, D. Chen, J. Goh and S. -K. Ng, “Anomaly detection with generative adversarial networks for multivariate time series,” arXiv preprint arXiv:1809.04758v3, 2019. [Google Scholar]
8. J. Kim, J. -H. Yun and H. -C. Kim, “Anomaly detection for industrial control systems using sequence-to-sequence neural networks,” arXiv preprint arXiv:1911.04831, 2019. [Google Scholar]
9. X. Bian, “Detecting anomalies in time-series data using unsupervised learning and analysis on infrequent signatures,” Journal of Institute of Korean Electrical and Electronics Engineers, vol. 24, no. 4, pp. 1011–1016, 2020. [Google Scholar]
10. A. Al-Abassi, H. Karimipour, A. Dehghantanha and R. M. Parizi, “An ensemble deep learning-based cyber-attack detection in industrial control system, ” IEEE Access, vol. 8, pp. 83965–83973, 2020. [Google Scholar]
11. D. Kim, C. Hwang and T. Lee, “Stacked-autoencoder based anomaly detection with industrial control system,” Software Engineering, Artificial Intelligence, Networking and Parallel/Distributed Computing (SNPD), vol. 951, pp. 181–191, 2021. [Google Scholar]
12. Y. G. Kim, J. -H. Yun, S. Han, H. -C. Kim and S. S. Woo. “Revitalizing self-organizing map: Anomaly detection using forecasting error patterns,” in ICT Systems Security and Privacy Protection. SEC 2021. IFIP Advances in Information and Communication Technology, vol. 625, pp. 382–397, 2021. [Google Scholar]
13. C. Wang, B. Wang, Y. Sun, Y. Wei, K. Wang et al., “Intrusion detection for industrial control systems based on open set artificial neural network,” Security and Communication Networks, vol. 2021, pp. 1–14, 2021. [Google Scholar]
14. K. Cho, B. van Merrienboer, C. Gulcehre, F. Bougares, H. Schwenk et al., “Learning phrase representations using rnn encoder-decoder for statistical machine translation,” in Proc. of the Empirical Methods in Natural Language Processing (EMNLP 2014), Doha, Qatar, pp. 1724–1734, 2014. [Google Scholar]
15. H. -K. Shin, W. Lee, J. -H. Yun and H. -C. Kim, “HAI 1.0: HIL-based augmented ICS security dataset,” in CSET'20: Workshop on Cyber Security Experimentation and Test, 2020. [Google Scholar]
16. H. -K. Shin, W. Lee, J. -H. Yun and B. -G. Min, “Two ICS security datasets and anomaly detection contest on the HIL-based augmented ICS testbed,” in CSET'21: Workshop on Cyber Security Experimentation and Test, pp. 36–40, 2021. [Google Scholar]
17. T. J. Williams, “The purdue enterprise reference architecture,” Computers in Industry, vol. 24, no. 2–3, pp. 141–158, 1994. [Google Scholar]
18. Y. Luo, Y. Xiao, L. Cheng, G. Peng and D. Yao, “Deep learning-based anomaly detection in cyber-physical systems: Progress and opportunities,” ACM Computer. Surveys, vol. 54, no. 5, pp. 1–36, 2021. [Google Scholar]
19. A. Bendale and T. E. Boult, “Towards open set deep networks,” in Proc. of the 2016 IEEE Conf. on Computer Vision and Pattern Recognition (CVPR), Las Vegas, NV, USA, pp. 1563–1572, 2016. [Google Scholar]
20. Secure Water Treatment (SWaTOctober 2021. [Online]. Available: http://itrust.sutd.edu.sg/research/testbeds/secure-water-treatment-swat/. [Google Scholar]
21. Industrial Control System (ICS) Cyber Attack Datasets, October 2021. [Online]. Available: https://sites.google.com/a/uah.edu/tommy-morris-uah/ics-data-sets. [Google Scholar]
22. M. Sarhan, S. Layeghy, N. Moustafa and M. Portmann, “Towards a standard feature set of NIDS datasets,” https://arxiv.org/abs/2101.11315v2, 2021. [Google Scholar]
23. H. -S. Kim and Y. -M. Kim, “Abnormal detection for industrial control systems using ensemble recurrent neural networks model,” Journal of the Korea Institute of Information Security & Cryptology, vol. 31, no. 3, pp. 401–410, 2021. [Google Scholar]
24. N. Tatbul, T. -J. Lee, S. Zdonik, M. Alam and J. Gottschlich, “Precision and recall for time series,” Advances in Neural Information Processing Systems, vol. 31, pp. 1920–1930, 2018. [Google Scholar]
25. W. -S. Hwang, J. -H. Yun, J. Kim and H. Kim, “Time-series aware precision and recall for anomaly detection: Considering variety of detection result and addressing ambiguous labeling,” in CIKM'19: Proc. of the 28th ACM Int. Conf. on Information and Knowledge Management, Beijing, China, pp. 2241–2244, 2019. [Google Scholar]
Cite This Article
 Copyright © 2023 The Author(s). Published by Tech Science Press.
This work is licensed under a Creative Commons Attribution 4.0 International License , which permits unrestricted use, distribution, and reproduction in any medium, provided the original work is properly cited.
 Downloads
 Citation Tools