
 Submit a Paper
 Propose a Special lssue
 Open Access
ARTICLE
Stress Detector Supported Galvanic Skin Response System with IoT and LabVIEW GUI
1 Lovely Professional University, Punjab, 144411, India
2 Department of Electronics & Communication Engineering, University of Petroleum and Energy Studies, 248001, India
3 Faculty of Computing and Information Technology, King Abdulaziz University, Jeddah, 37848, Saudi Arabia
4 Universidad Europea del Atlántico, Santander, 39011, Spain
5 Universidad Internacional Iberoamericana, Campeche, C.P, Mexico
* Corresponding Author: Divya Anand. Email:
Computers, Materials & Continua 2023, 74(1), 1217-1233. https://doi.org/10.32604/cmc.2023.023894
Received 25 September 2021; Accepted 26 November 2021; Issue published 22 September 2022
 View Full Text
 Download PDF
Abstract
Stress is now a serious disease that exists due to changes in working life and food ecosystems around the world. In general, it is difficult for a person to know if they are under stress. According to previous research, temperature, heart rate variability (HRV), humidity, and blood pressure are used to assess stress levels with the use of instruments. With the development of sensor technology and wireless connectivity, people around the world are adopting and using smart devices. In this study, a bio signal detection device with Internet of Things (IoT) capability with a galvanic skin reaction (GSR) sensor is proposed and built for real-time stress monitoring. The proposed device is based on an Arduino controller and Bluetooth communication. To evaluate the performance of the system, physical stress is created on 10 different participants with three distinct tasks namely reading, visualizing the timer clock, and watching videos. MATLAB analysis is performed for identifying the three different levels of stress and obtaining the threshold values as if the person GSR voltage i.e., relaxed for <1.75 volts; Normal: between 1.75 and 1.44 volts and stressed: >1.44 volts. In addition, LabVIEW is used as a data acquisition system, and a Blueterm mobile application is also used to view the sensor reading received from the device through Bluetooth communication.Keywords
Hans Selye has coined the term “stress” and he claims that stress is “the non-specific response of the body to any demand for change” [1] Stress can provoke fear and anxiety, and long-term stress can increase the risk of heart disease and mental problems like depression [2]. Hence, stress management is an essential element for human health. Moreover, individuals and medical practitioners cannot maintain track of variations in stress levels for a longer time. Technologies that sense stress automatically can become a strong tool that encourages people to modify their behavior, lifestyle and to maintain balance stress. Technology such as sensors can be used for obtaining an objective measurement of stress levels. Stress detection is implemented with distinct techniques and approaches. These techniques and approaches utilize the following inputs namely: physiological signal, behavioral manifestation, emotional manifestation, physical features, and facial expression, etc [3]. In physical features, the stress is identified through facial expression identification techniques. On other hand in behavioral manifestation, video-dependent feature extraction is implemented. Stress is detected with distinct factors of the body like temperature, heart rate, blood pressure, and humidity. The temperature of the body is employed to identify the stress status of a person and the normal temperature of an individual is 36°C–37°C [4]. The following value guides the condition of an individual depending upon temperature. If the body temperature is less than 26°C, then the person is highly stressed. If the body temperature is between 26°C–29°C, then the person is slightly stressed [5]. If the body temperature is above 350C, then the person is relaxed. HRV assists to identify the stress of an individual. HRV varies for every individual depending upon health status. The following HRV value suggests the health condition of an individual, if HRV > 50 then the individual is healthy, if HRV = 14-25 then the individual is a bit stressed, and if HRV = 2-15 then the individual is under hypertense [6]. The skin temperature identifies an individual’s exact stress through GSR and the electrodes of GSR obtain the sweat of the person [7]. The sensor data obtained is utilized for identifying the stress level. If the sensor data consist of maximum GSR peaks, then the person is highly stressed and if the GSR peaks are minimum then the person is in a relaxed state. The stress leads to high blood pressure, the range for identifying the stress is determined through diastolic pressure (<130) and systolic pressure (<100). Therefore, a system is required for monitoring the stress levels continually for some weeks or months.
A technique is proposed in this study to identify stress with GSR sensor where it is interfaced with Arduino and Bluetooth and further processed using LABVIEW and MATLAB. GSR utilizes two electrodes that were implanted on its fingers for sensing the stress [8]. The system transmits the information to a computer coordinator through Bluetooth and provides different data to a coordinator at the same time. The contributions of the study are as follows:
• An IoT-compatible bio signal acquisition device is implemented to monitor stress with GSR.
• The developed system is implemented in real-time by creating physical stress on 10 different participants with three different tasks, namely reading, watching the stopwatch, and watching videos.
• The threshold values are identified through MATLAB analysis and if the person GSR voltage is 1.75 volts (relaxed), 1.44 volts-1.75 volts (normal), > 1.44 volts (stressed).
The organization of the study is as follows: Section 2 covers the literature review; Section 3 covers proposed architecture; Section 4 covers the component description that is utilized in developing the proposed system; Section 5 covers methodology; Section 6 covers the experimental setup and results.
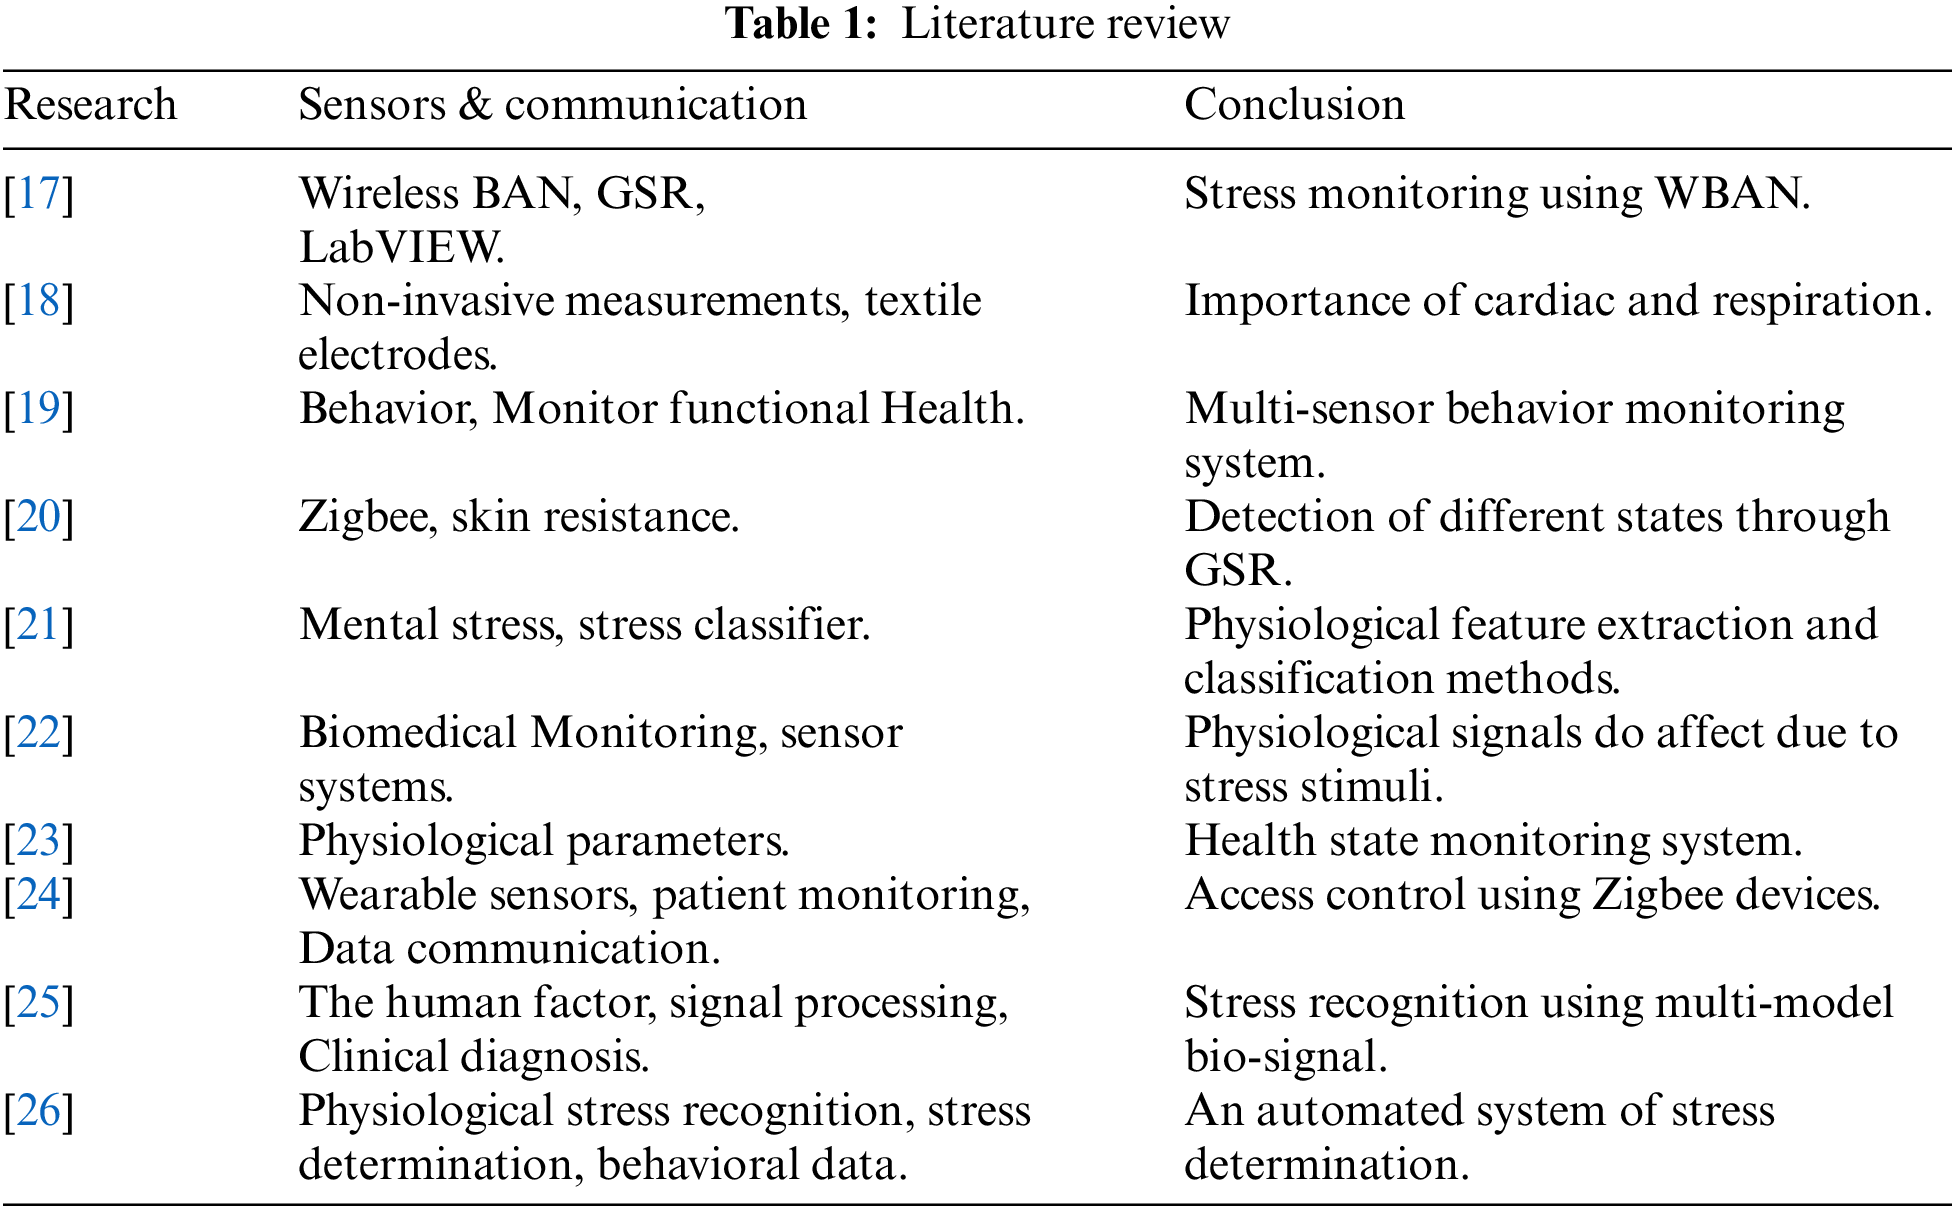
A system is proposed with a GSR order for measuring stress. Moreover, a mechanism implemented with a similar algorithm with ZigBee communication for sending data through the various levels of stress tests [1]. Eye-gaze tracking device pupil diameter (PD) is proposed for recording the data of an individual’s eyes and PD changes assures the reliability, temperature, and ambient light levels and all subjects for ongoing experimentation eye gaze tracking system [2]. Proposed a system for the acquisition of signals that can be controlled via LABVIEW. It enables basic data acquisition, application. NI-DAQmx programming interface, data acquisition devices [3]. In this study, a method is implemented with two distinct stress detection for evaluating the stress based on signal amplitude and they are represented as ‘’Threshold relaxation ‘’ and ‘’ Threshold stress ‘’ [4]. An automatic stress detection system is implemented in real-time through physiological signals gathered from wearable devices and to extract necessary information from the physiological signals the modality-specific artifact removal and feature extraction are employed [7]. A cognitive stress-level detection system (Detect Stress) is designed for evaluating the stress levels of an individual obtained through data through a smartphone and wireless physical activity tracker (FITBIT) [8]. Electroencephalography (EEG) sensor is integrated into this study for detecting the stress of students and EEG signal is pre-processed with Hilbert-Huang Transform (HHT) to eliminate the artifacts [9]. A smart wristband is designed and developed for classifying the stress in older people by analyzing Electrodermal activity (EDA), Blood Volume Pulse (BVP), Inter Beat Intervals (IBI), photoplethysmogram (PPG) signal obtained in the wrist band [10]. In order of enhancing stress detection performance with HRV and GSR, a distinct set of features are proposed. Local maxima and minima (LMM) feature obtained from HRV and voting and similarity-based fusion (VSBF) from GSR sensor [11]. To validate the stress, a detection model is implemented with cortisol as a stress bio maker and the model utilizes GSR and PPG sensors for validating the stress level [12]. A flexible conductive strip is designed and implemented to implement GSR based system to evaluate the monitoring level of GSR as a part of smart e-healthcare [13]. The research aims to discover individual characteristics that indicate the presence of stress and to link these characteristics with data from biometric signals. To identify these qualities, on the one hand, emotional/psychological evaluations are collected through predefined questionnaires, and, on the other hand, characteristics are obtained from bio-signals that are recorded with wireless sensors [14]. The aim is to develop a psychological stress detection technique based on physiological parameters that can be entered in wearable vital signs monitor Electrodermal Activity EDA, ECG, and Skin Temperature (ST) [15]. A method is proposed to reconstruct skin galvanic response peaks recorded by a wrist-worn device using compressed sensing and a random measurement matrix was used in the reconstruction phase [16]. A detailed review is also presented in the Tab. 1, where it presents the findings and conclusion of previous studies detailed. The review is in the Tab. 1 concludes that the wearable devices with the GSR sensor are a possible methodology for implementing a system to identify the stress of an individual. Moreover, an automated system is suggested to be implemented for detecting the stress level.
Generally, it is challenging to find the stress of an individual through the face emotions because the emotions of the face deliver false results related to stress identification. With the advancement in sensor and communication technology, they are a wide extension of building an automated system for detecting the stress level of an individual. In this, we proposed a GSR sensor-based system for detecting the stress automatically and communicating it to the individual personal device through a Bluetooth connection. The proposed system is represented in Fig. 1. Here the GSR sensor measures the electrical conductivity of the skin. The conductive voltage through GSR goes to the Arduino. Arduino converts the analog signal to the digital signal and then further data is sent to the data acquisition system. The threshold value is preset for the system through MATLAB by experimenting on 15 individuals. Here the MATLAB experiment reveals that the three different individual states namely: stress, relax, and moderate. This threshold data as a digital output is transmitted to the Mobile app receiver through a Bluetooth transmitter. The threshold detection of an individual is communicated to the Blueterm mobile app through Bluetooth.
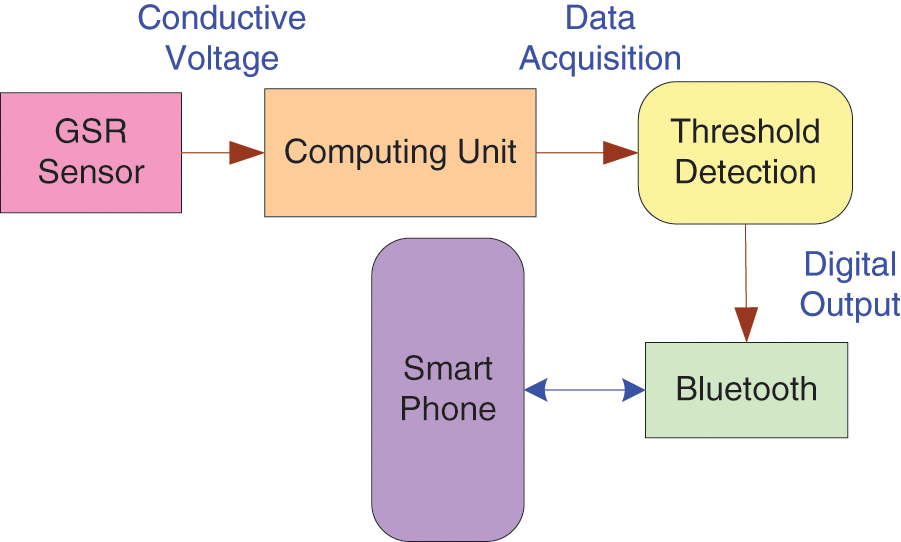
Figure 1: Proposed system for stress detector
In this section, we will discuss the distinct components that are utilized for detecting stress. The components employed in this study are GSR Sensor, liquid crystal display (LCD), Arduino microcontroller, and Bluetooth module. The GSR sensor is used to detect the electrical conductivity of the skin to determine stress levels. The Bluetooth device is used for wireless communication due to its low power consumption and ability to connect to both the master and slave nodes. The information gathered is delivered to a smartphone app, which is convenient and portable. A GSR sensor enables us to monitor sweat activity connected to emotional excitement. We use the electrical characteristics of the skin to measure the GSR. In particular, how the resistance varies with the activity of sweat glands, i.e., greater activity in sweat glands, greater suddenness, and hence less resilience to the skin.
The most common measure of conductance is a GSR signal, not resistance. Conductance is measured in Siemens and is the inverse of resistance (leading = 1/resistance). The skin’s behavior makes it easier to perceive the signal since the bigger the sweat gland’s activity, the more skin behavior. In the HC-05 Bluetooth SPP (Serial Port Protocol) module (Fig. 2), a transparent wireless serial assembly is utilized for easy installation. The Bluetooth interface has been completely approved with the 2.4 GHz radio, 3 Mbps modulation baseband, and Bluetooth v2.0 + EDR transceiver (Enhanced Knowledge Rate). The Bluetooth module’s hardware specs call for a sensitivity of −80 dBm. RF transmits the power of up to + 4 dBm, 1.8 V low-power operation, 3.3 V 5 V I/O, Port Input Output Control, and UART interface with configurable baud rate.
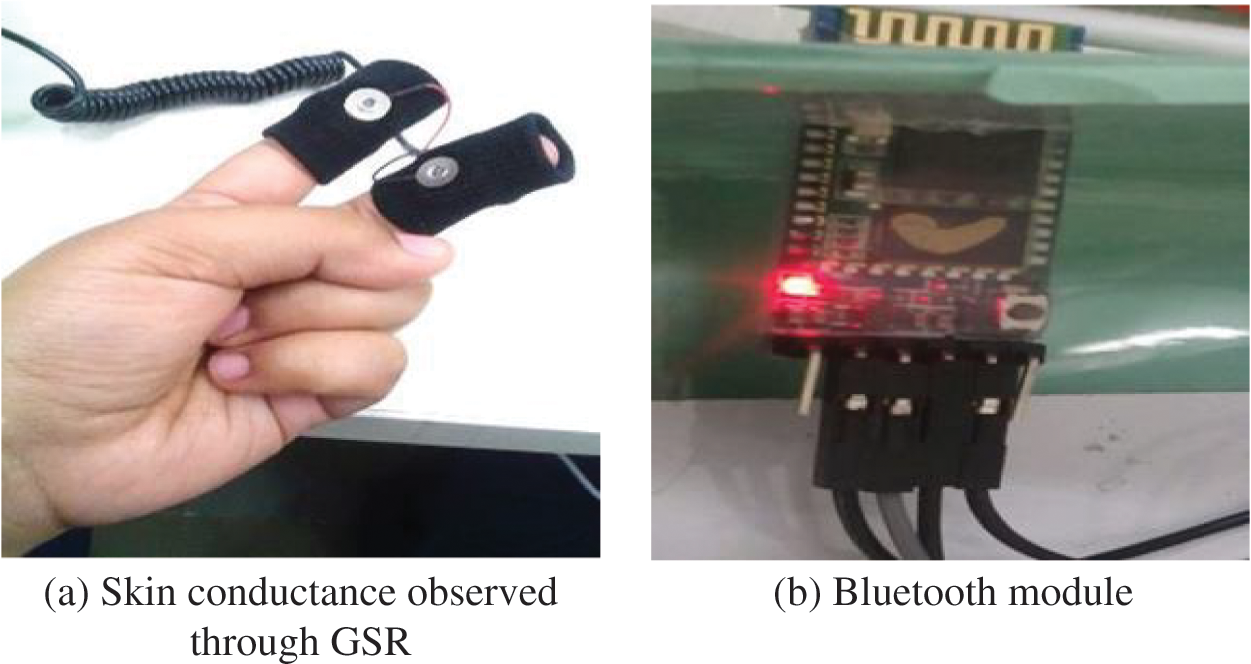
Figure 2: Skin conductance observed through GSR and bluetooth module
A proteus simulation is implemented following the integration of the components (Fig. 3). The Proteus simulation is used during hardware development to evaluate the performance of the produced device by simulating it in a virtual environment. The computer unit in the proteus simulation is an Arduino Uno with an ATMega 328P controller. Pins ‘2’, ‘3’, ‘4’, ‘5’, ‘6’, ‘11’, and ‘12’ are used to connect a Liquid Crystal Display to an Arduino Uno. The GSR sensor’s signal pin is linked to the Arduino Uno’s A0 pin. The Bluetooth TxD pin is linked to the Arduino Uno’s Rx pin (Pin ‘0’), while the Bluetooth RxD pin is attached to the Tx pin (Pin ‘1’). The buzzer is linked to the Arduino Uno’s Pin ‘7.’ The signal generated by the GSR sensor is sent to the Bluetooth module during the simulation.
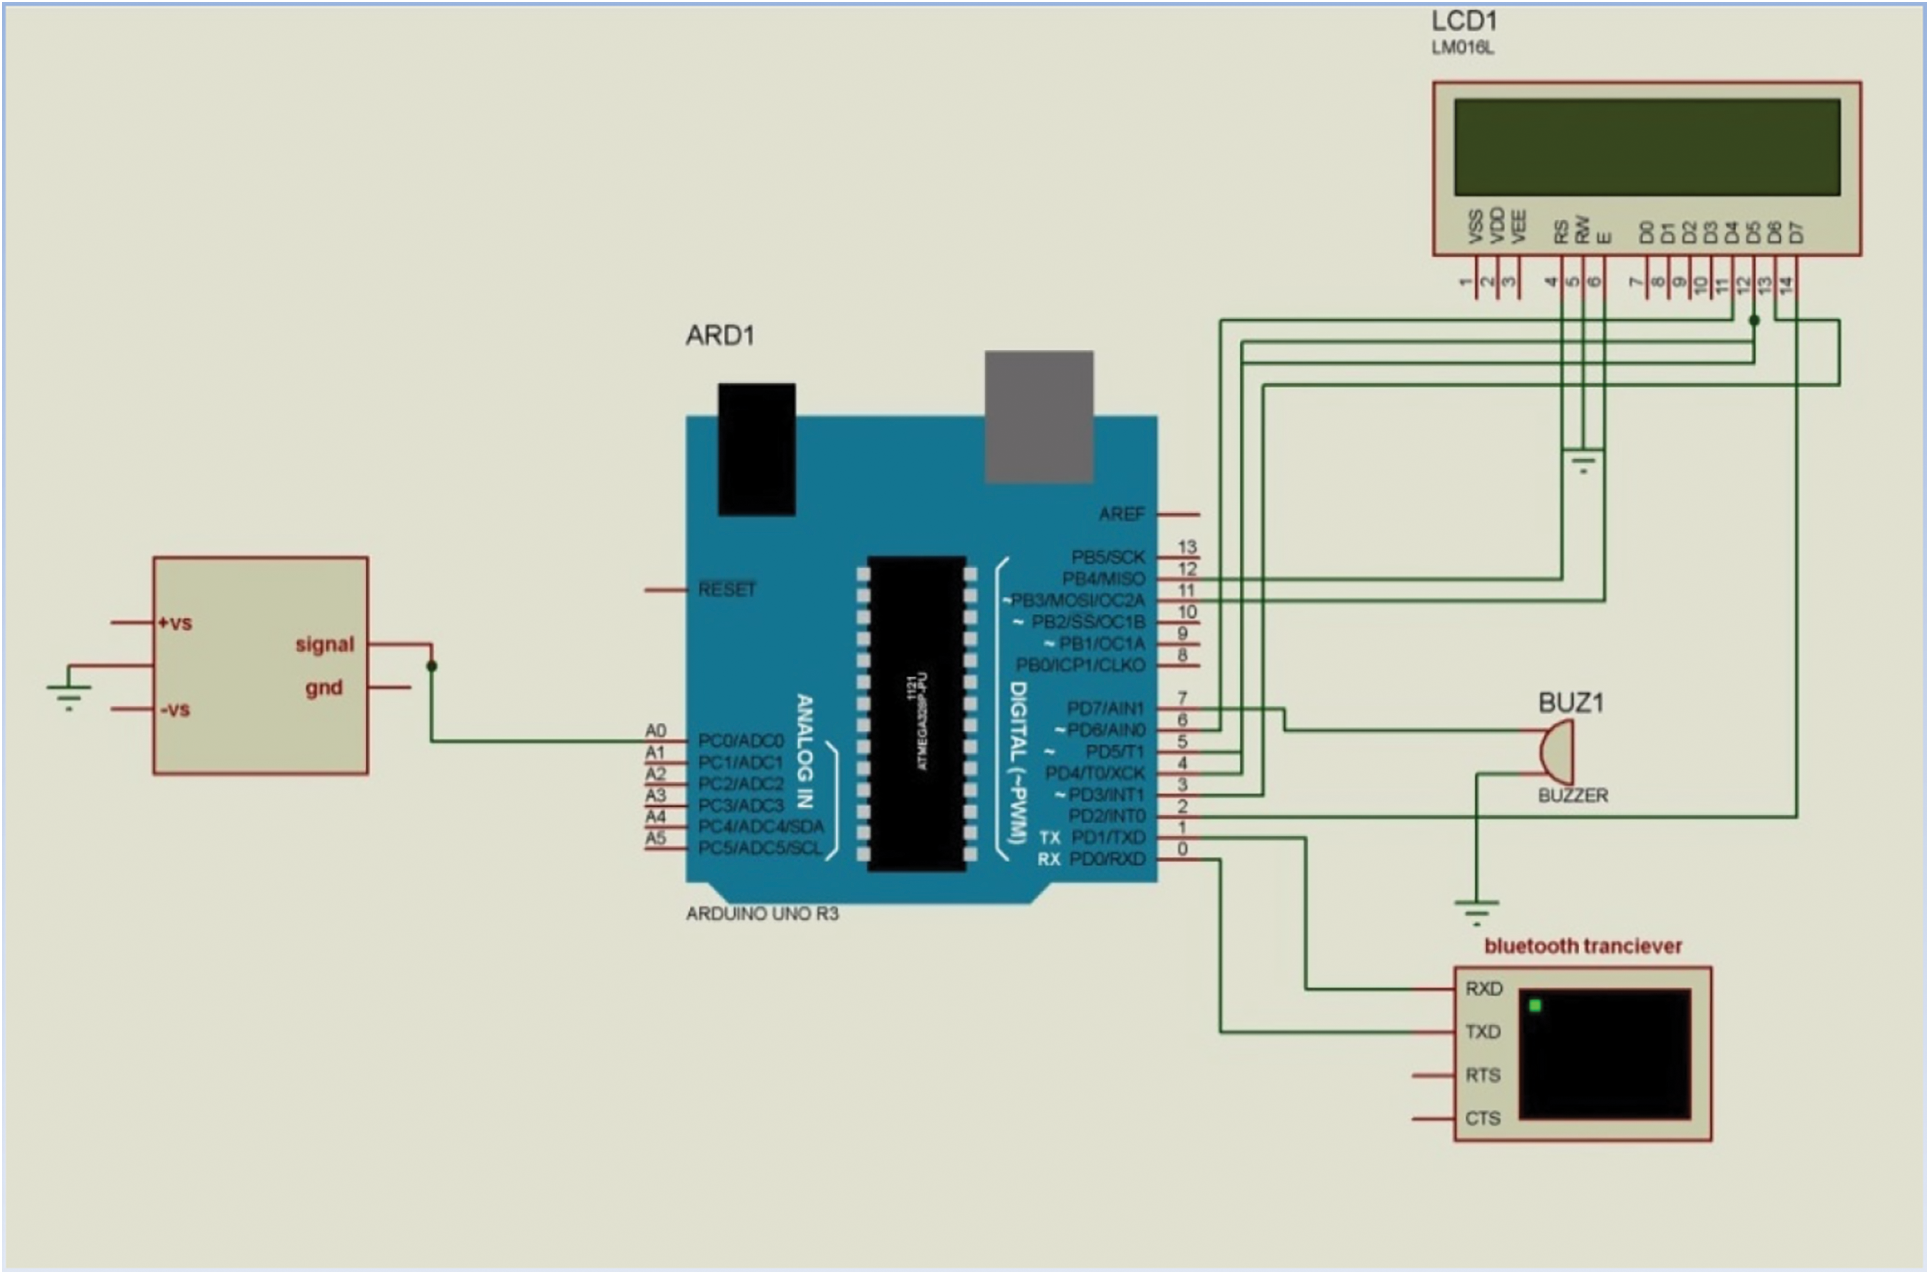
Figure 3: Proteus simulation
In this section, we discuss the methodology that is utilized for implementing the GSR sensor-based system. The system methodology illustrated in Fig. 4 explains the flow of the process. The six different stages that are involved in the proposed methodology are illustrated as follows: Electrodes, Conductive voltage, Acquisition System, processing, and threshold parameter. Finger electrodes attached to the skin conductive voltage fed to the microcontroller acquisition system produce and the ADC converter output values using the digital output after processing by using parameters like visual stimuli. Based used to set the threshold is process is attached to the threshold detected by the installation, the conductive voltage stress is displayed on the display unit.
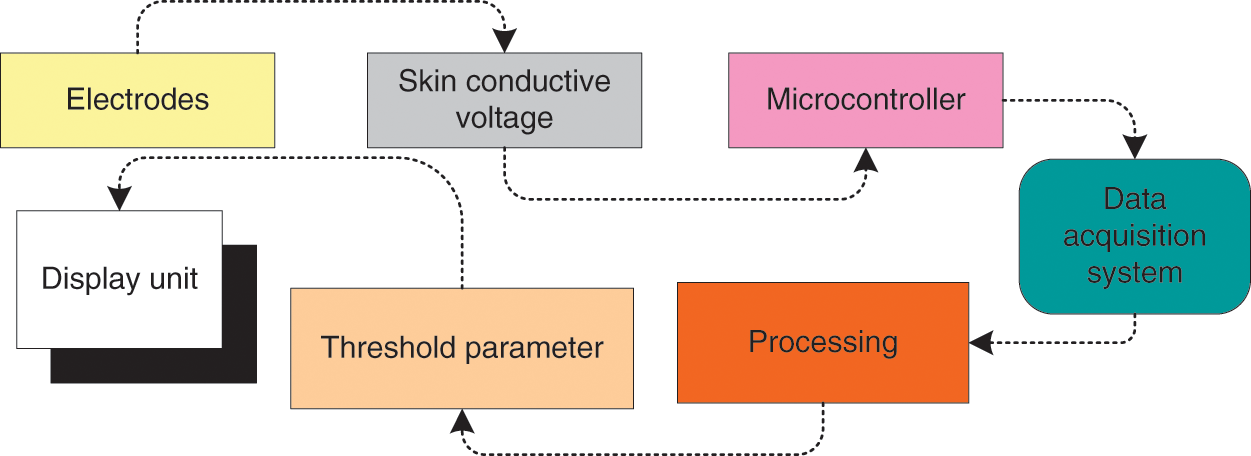
Figure 4: System methodology
Here the integration of electrodes of the GSR sensor and microcontroller establishes the stress monitoring hardware prototype and it is shown in Fig. 5. The stress of an individual is evaluated with a GSR sensor is processed with the assistance of Ohm’s law. In ohm’s law, the voltage is directly proportional to the resistance, the resistance will increase because the voltage will increase. During this context, the stress on the individual’s skin condition, the conduction of sweat multiplies, and resistance decrease. The hardware prototype is accomplished by connecting the GSR sensor a kind of analog sensor to the analog pins of the microcontroller and digital pins of LCD to the digital pins of the microcontroller. This whole system works on a 5 V power supply. Here, supply is given through a power bank to make it portable.
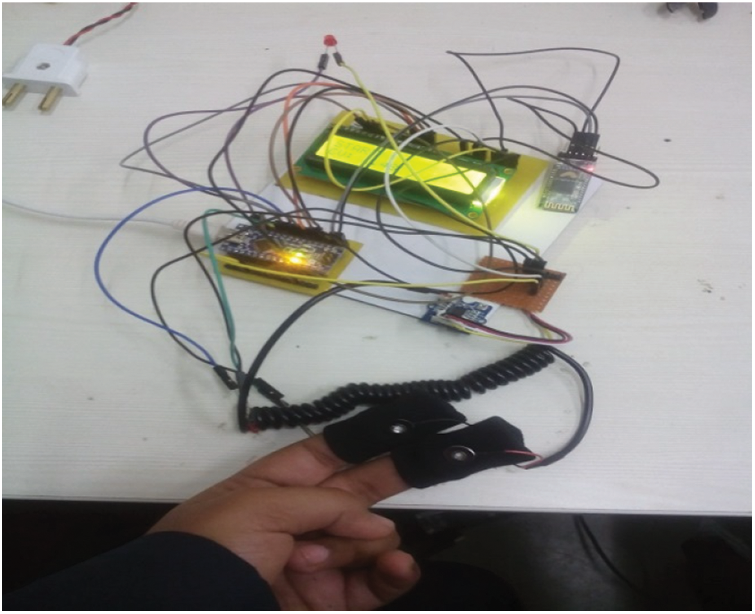
Figure 5: Hardware attached to an individual
A data acquisition system software package and a variety of hardware or management of the world to live within the physical characteristics of a thing that may permit. LabVIEW is employed as a data acquisition system. LabVIEW is an interface with Arduino IDE for acquiring the data as shown in Fig. 6. The following are features that are present in the front panel of LabVIEW: VISA Resource-To select the COM Port; Connection type(USB/Serial)-To select the communication channel; Analog Input pin(0)-To select the Input pin type; Conductive voltage-It represents the voltage indicator; Baud Rate(115200): To set the Baud rate; Board Type(Uno): To select the Board type; Stop: To stop the recording process; Conductive voltage waveform: To indicate the real-time data plotting and Table: To store the real-time data.

Figure 6: Data acquisition system in LABVIEW
Coordinate axis range of the parameter information on the Associate Degree provides estimates of the distribution of the minimum space. Lead either calculable or information such as historical method data is supported. A bar graph of the distribution of numerical knowledge is a graphical example. The threshold level for identifying the difference of stress is obtained through the histogram technique. The study reveals that during stress, the body continues in the nourishment alert state resulting in an accumulated electric skin phenomenon which can be monitored by a phenomenon detector for skin electrical phenomena to gain knowledge about electrical phenomena. The phenomenon detector is just employed for grounds-truth purposes as a partner in the nursing external detector. A component of the phenomenon detector activities took place for each session for five minutes, wherever the participants wear and rest. For each session, this component of the activity offers basic readings (i.e., skin behavior). We are tendencies to compute the difference between common baseline readings in the activity section and thus the average readings of the phenomena during the specific activities to live variations in stress level for each meeting.
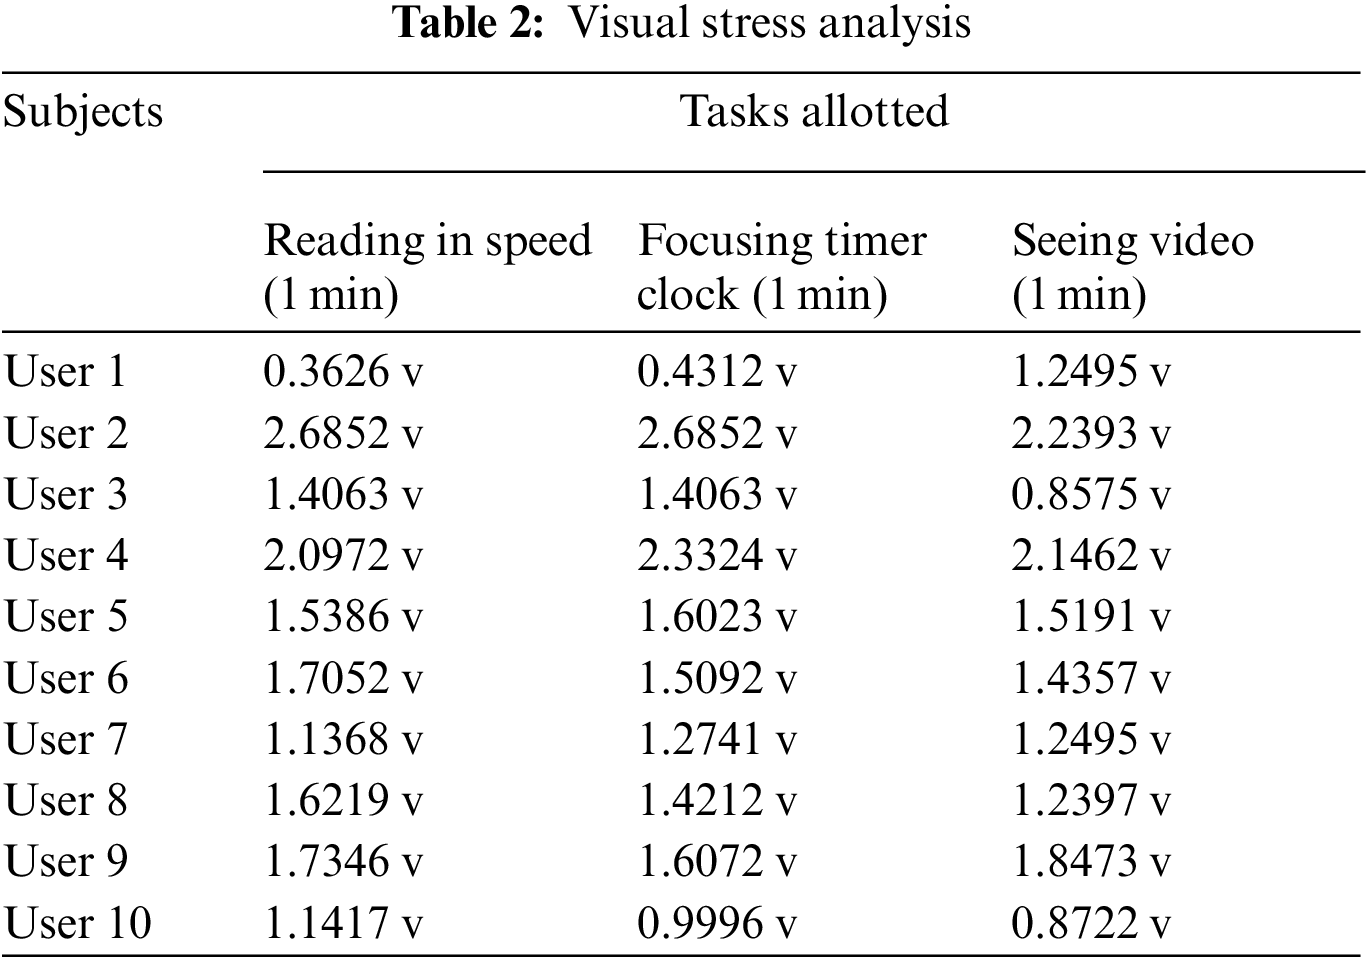
In this section, we present the real-time implementation of a stress monitoring device for sensing the stress with a GSR sensor and LabVIEW GUI. The data obtained on the data acquisition system i.e., LabVIEW is utilized for specifying the threshold values to determine the level of stress. In this study, the physical stress is created on 10 participants by allotting them three distinct activities namely reading in speed, focusing on the timer clock, and watching videos. The average of these tasks was calculated which is then used to take out the maximum and minimum values. Further, the threshold limit value is specified by the histogram detection methodology for the number of subjects and the number of dimensions between MATLAB. The histogram of four distinct professions is based on the techniques displayed in the conductive voltage field as calculated.
6.1 Analysis of Stress Monitoring Device
A stress Monitoring Device is used to monitor the stress level of the person. The final prototype of the device is illustrated in Fig. 7. The real-time data is obtained by attaching the electrodes on the two fingers of a person to the microcontroller. The microcontroller then compares the obtained value from the value set as a threshold, the threshold value is set by doing the comparative study of the 15–20 participants. Thus, based on the threshold value, it displays three conditions that are stressed, relaxed, and moderate condition. The conductive voltage generated is displayed on the LCD. Also, the Bluetooth device that is interfaced with the microcontroller receives the data and transmits it to the Android App that is Blueterm on the receiver side.

Figure 7: Stress monitoring device
Now the device is attached to the 10 participants for evaluating the performance of the system. As discussed earlier in this section, the three distinct tasks are allotted to 10 participants to realize physical stress. The average of these tasks was calculated which is then used to take out the maximum and minimum values. The average value is illustrated in the Tab. 2. Accuracy level can be increased by increasing either the number of inputs or by increasing the number of participants. Here, in this project number of participants is increased.
Moreover, we have presented the graphical representation of three participants based on three different tasks like reading analysis. Figs. 8a–8c, presents the analysis of user ‘1’ for three different tasks. In the graph the horizontal (category) on the x-axis and the vertical(value) on the y-axis for the single user1 for reading analysis. The variation of the graph indicates the level of stress.

Figure 8: Reading, timer clock, and video analysis of USER 1
Figs. 9a–9c, presents the analysis of user ‘2’ for three different tasks. In the graph the horizontal (category) on the x-axis and the vertical(value) on the y-axis for the single user1 for reading analysis. The variation of the graph indicates the level of stress.

Figure 9: Reading, timer clock, and video analysis of USER 2
Figs. 10a–10c presents the analysis of user ‘3’ for three different tasks. In the graph the horizontal (category) on the x-axis and the vertical(value) on the y-axis for the single user1 for reading analysis. The variation of the graph indicates the level of stress.
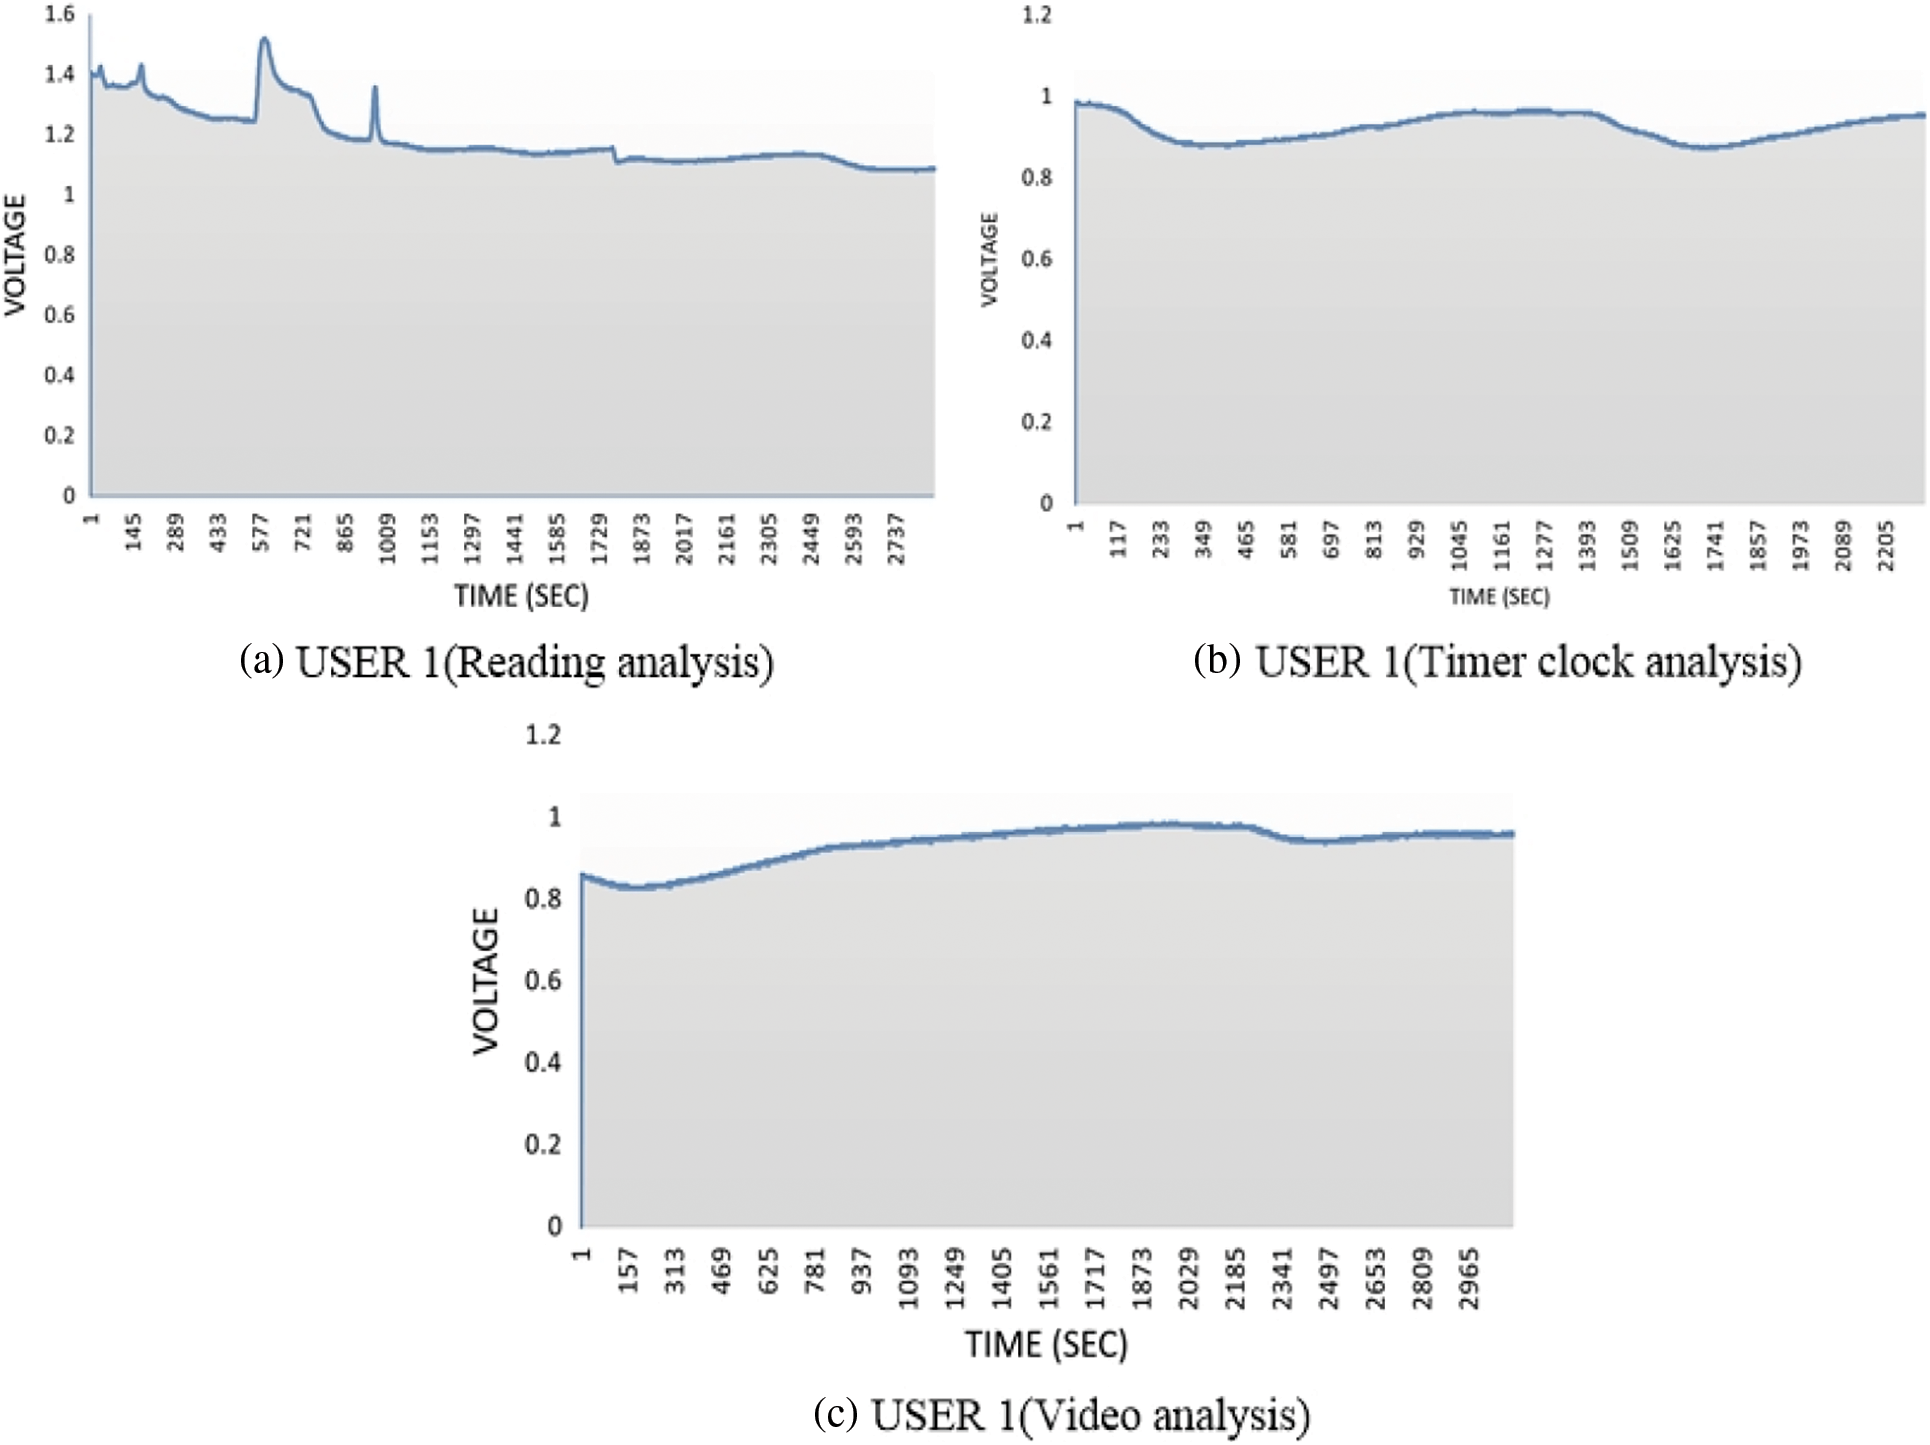
Figure 10: Reading, timer clock, and video analysis of USER 3
6.2 Threshold Value for Stress Detection
The following steps are followed for confirming the threshold level. The threshold level is taken between several samples on the x-axis and the number of conductive voltages on the y-axis in volts; the level of accuracy of the values in the graph depends on the enlargement of the graph; the histogram shown in Fig. 11 used to represent the average values of the samples that are between two participants; participants were given the visual stimuli task. Each person was allotted one min for three tasks. Then the average of these tasks was calculated which is then used to take out the maximum and minimum values. The threshold level evaluation is performed between the two participants with different cases.
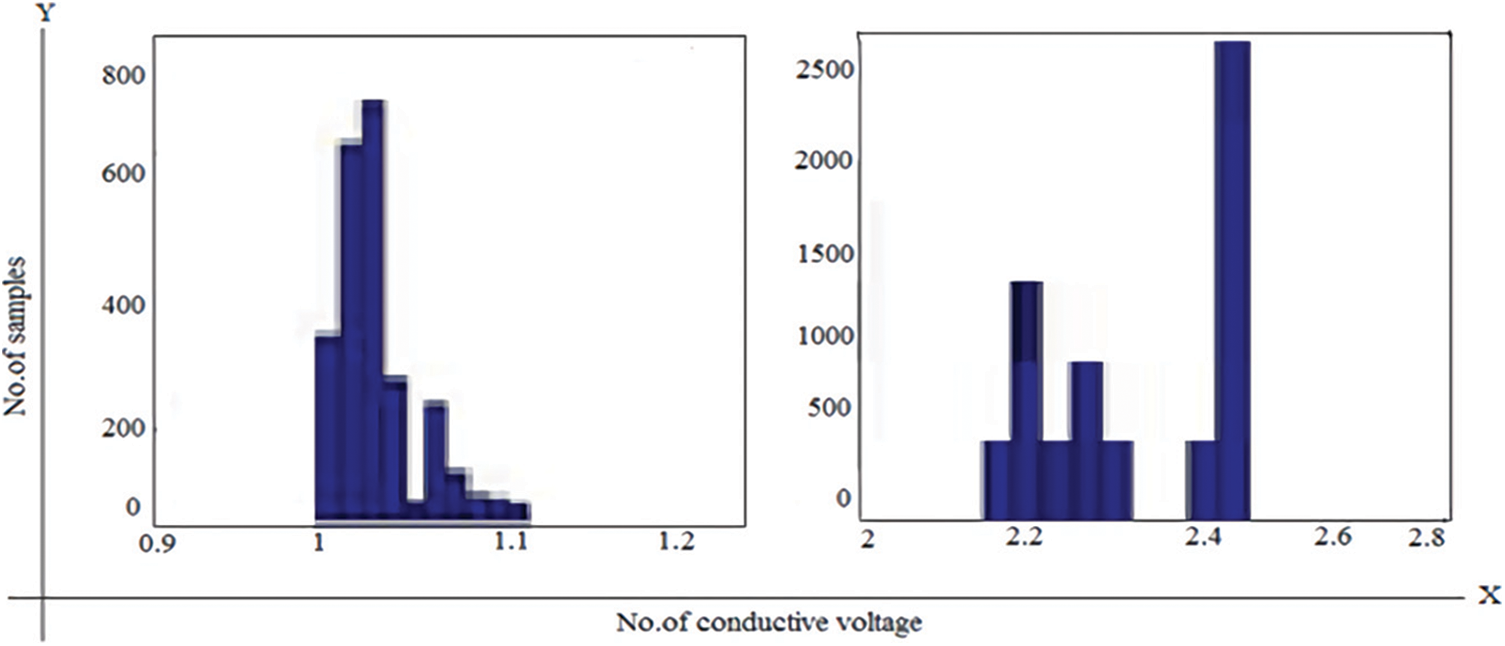
Figure 11: Graph of the first case with two participants
Fig. 11 illustrates that the highest conductive voltage of the first participant is 1.2 v, and the minimum conductivity voltage is 0.9 v. The maximum taping voltage of the second participant is 2.8 volt and the minimum taping voltage range in this figure is 0.9 volt and below. Fig. 12 illustrates that in the first participant there is a maximum conductive tension of 1, 4 volts and a minimum conductive tensity of 1.25 volts. The highest conductive voltage of the second participant is 2.4 volts and the minimum conductive voltage is 2.1 volts. Fig. 13 illustrates that the range for maximum conductive voltage is 1.2 volts and for the first participant the range for minimum conductive voltage is 0.9 volts. The greatest conductive voltage in the second participant is 1.72 volt, and the minimum conductive voltage is 1.64 volt.
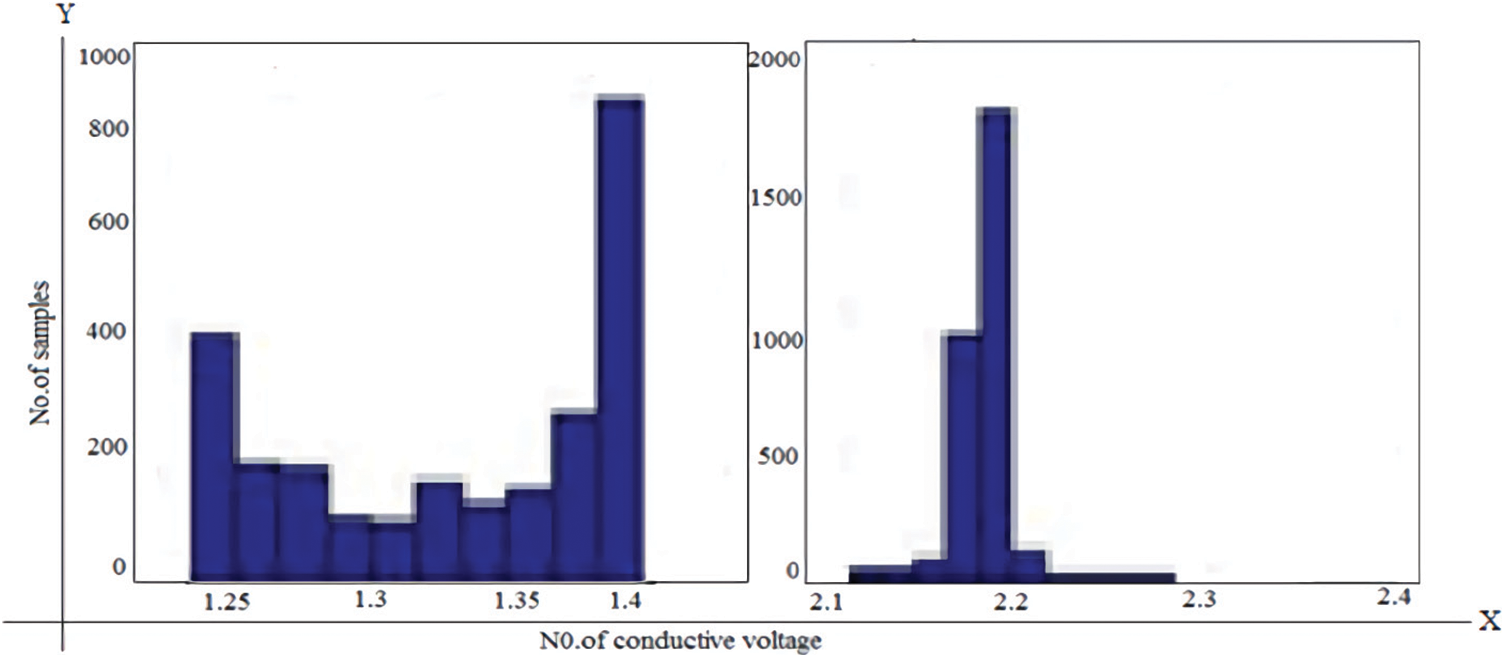
Figure 12: Graph of the second case with two participants

Figure 13: Graph of the third case with two participants
Fig. 14 illustrates that the maximum voltage for the first competitor is 1.6 v, the lowest voltage for the first competitor is 1.5 v. The highest conductive voltage of the second participant in this figure is 1.25 volts, and the minimum conductive voltage is 1.21 volts.

Figure 14: Graph of the fourth case with two participants
Fig. 15 illustrates the maximum conductive voltage of the first participant is 1.7 volts and the conductive voltage of the first participant is 1.5 volts. The highest conductive voltage in the second participant is 1.7 volts and the minimum conductive voltage range is 1.3 volts and lower.

Figure 15: Graph of the fifth case with two participants
From all the cases it is concluded that the conductive voltage of the first participant is maximized by 1.8 volts and the conductivity is minimized by 1.7 volts. The highest conductive voltage varies from 1.7 volts to 1.3 volts in this figure in the second participant. It has been decided that the maximum conductive voltage ranges from 1.75 volts and above and the minimum conductive voltage ranges from 1.44 volts. Based on these values the person’s GSR voltage can be categorized as Relaxed: <1.75 volts; Normal: between 1.75 and 1.44 volts and stressed: >1.44 volts.
The Blueterm App is solely placing a Serial Terminal for your automaton Phone or pill. It provides several of the fundamental options you have got come back to expect from a typical Serial Terminal on a laptop. the massive distinction is that it’s on your phone or pill, which it’s designed specifically to figure with Bluetooth to Serial devices. The real-time sensor values from the stress monitoring device are visualized on the blue term app through Bluetooth communication and it is shown in Fig. 16.
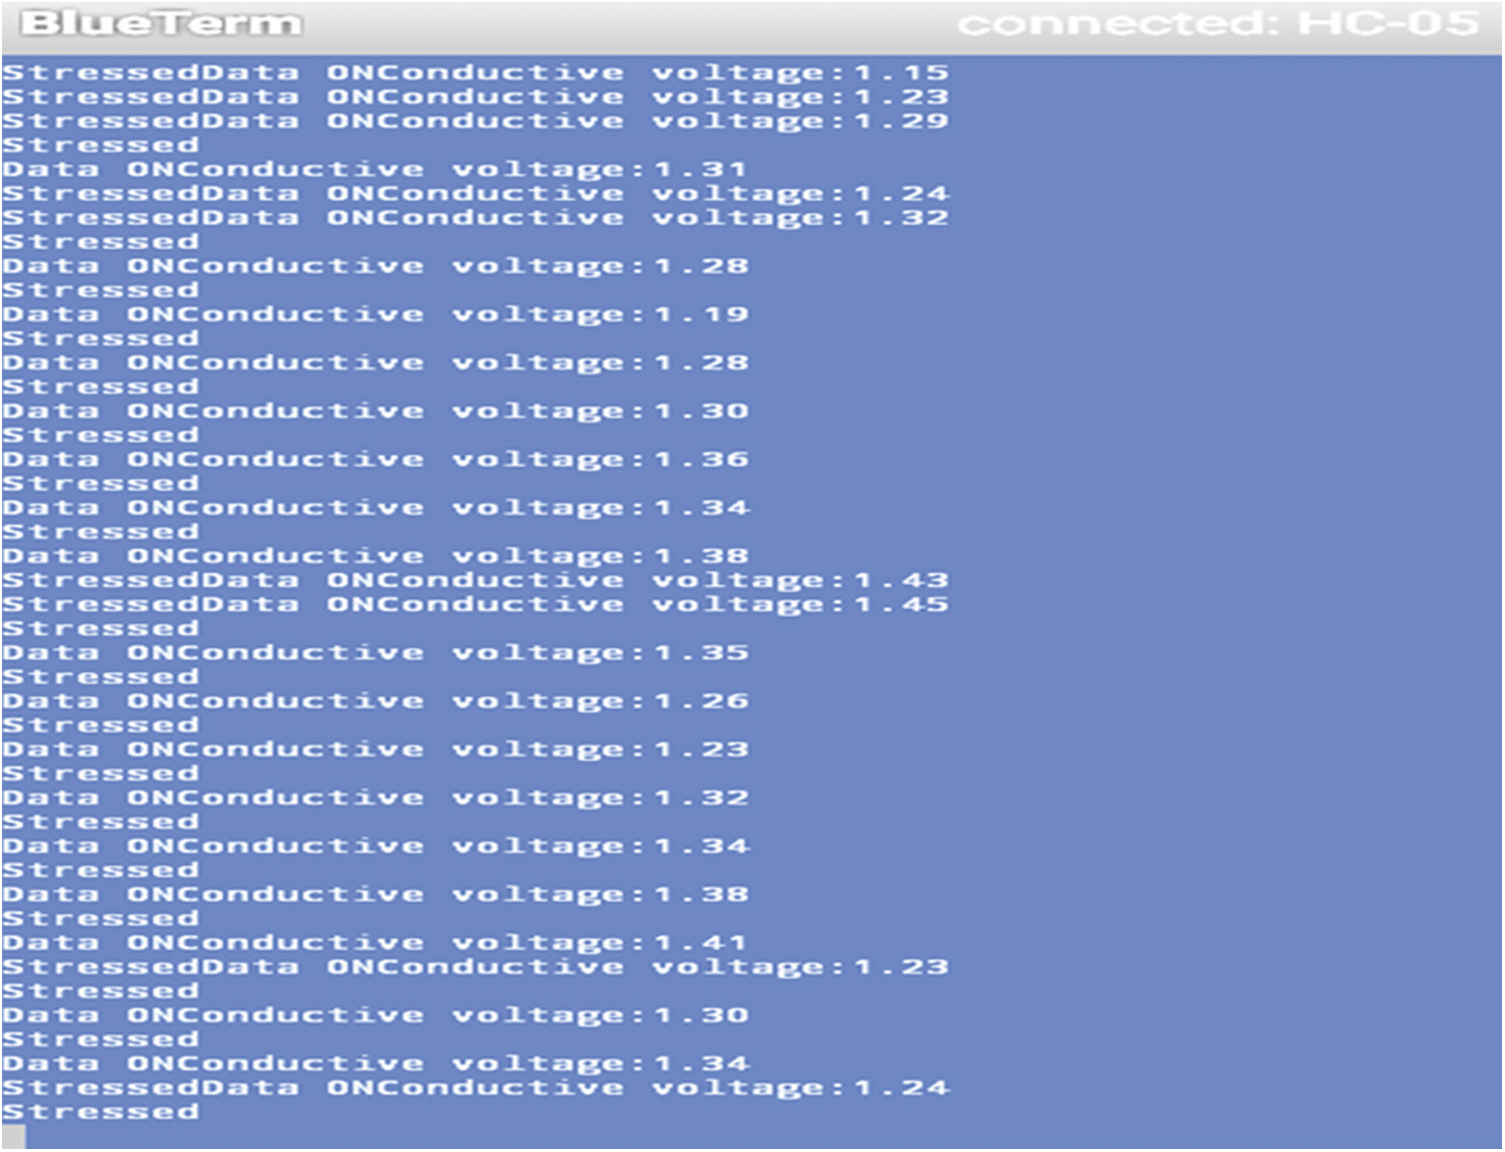
Figure 16: Blueterm android app
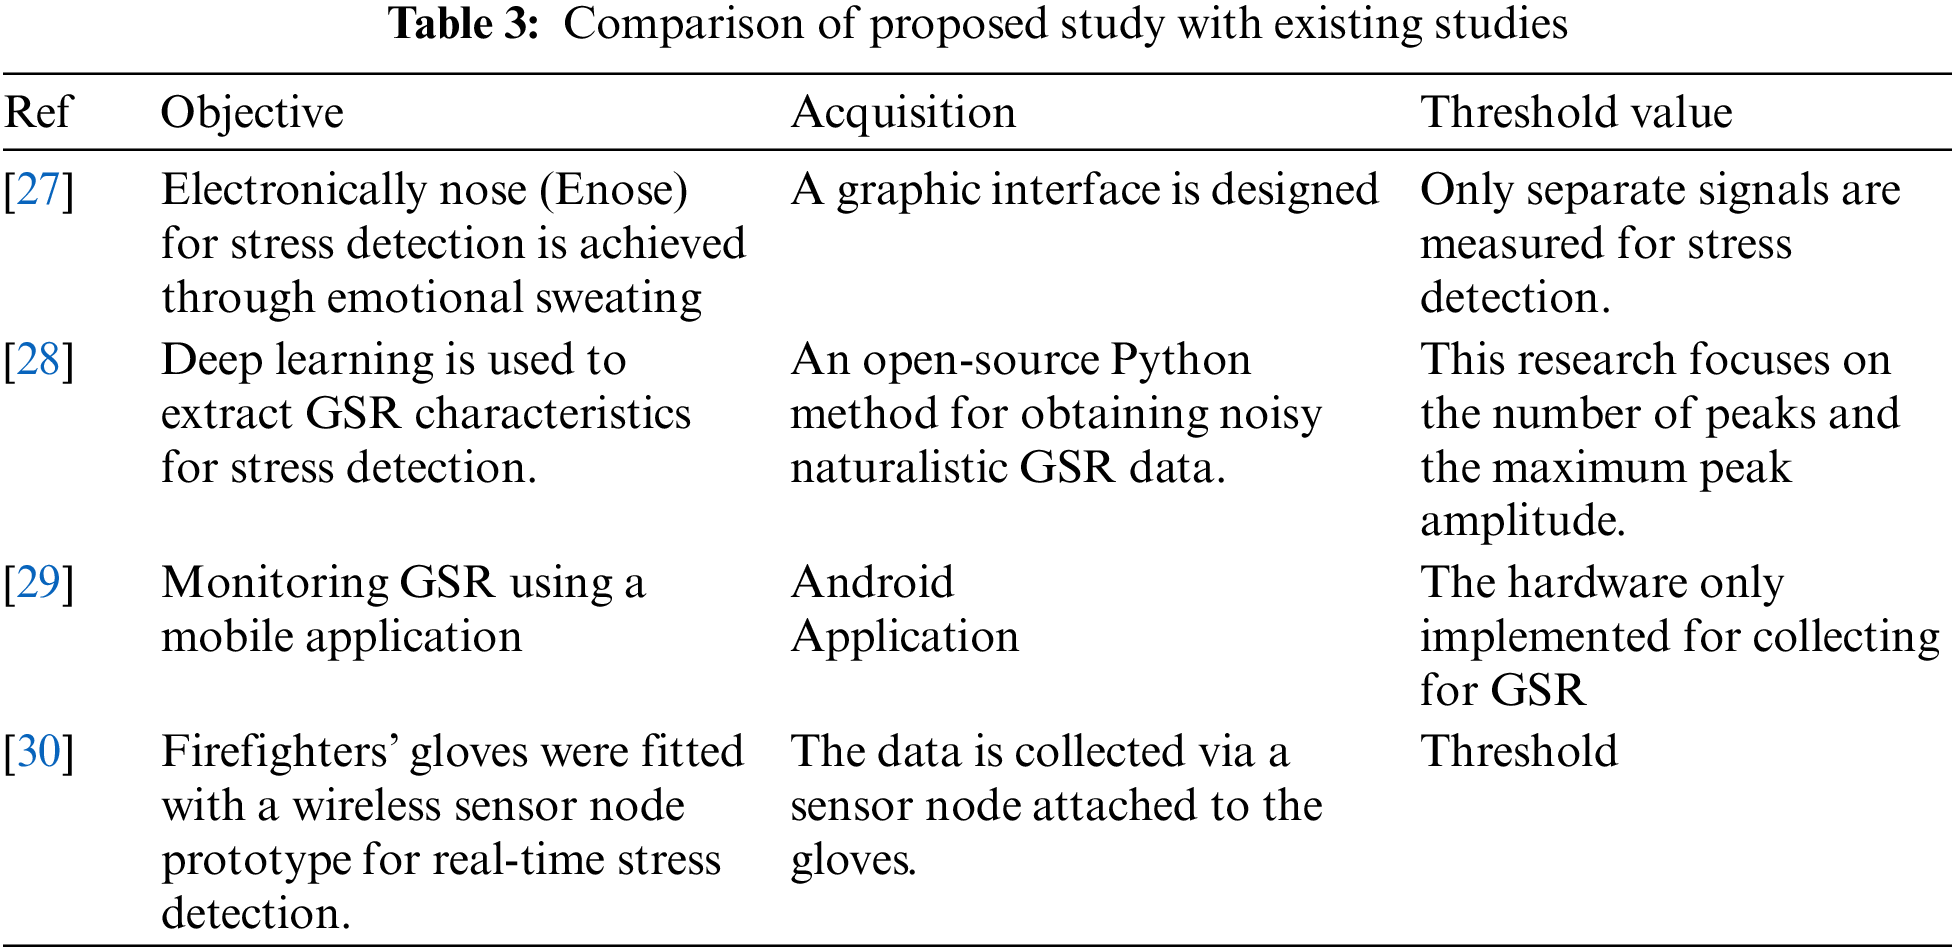
Tab. 3 provides a comparative analysis to address suggested study advances vs. previous studies for stress detection. The main focus of previous research was the integration of stress monitoring devices. Using a wireless hardware-enabled device, a limited investigation found threshold values for identifying stress levels. Suggested research uses Bluetooth and Wi-Fi to identify IoT-enabled stressors. To determine the threshold value, a specific hardware implementation is used. Experiments with three activities were carried out on different consumers in the process of determining the threshold value. The three voltage state threshold values are determined using MATLAB analysis. Furthermore, the proposed system logs sensor data on the cloud server through Wi-Fi.
Stress monitoring is a significant task for analyzing the stress levels of an individual for reducing the risk of obtaining many more diseases due to stress. Generally, the stress can be identified with distinct inputs namely: physiological signal, behavioral manifestation, emotional manifestation, physical features, and facial expression. Moreover, other factors like temperature, HRV, humidity, and blood pressure. In this study, we have considered the humidity factor for identifying the stress of an individual. In this study, an IoT-enabled bio-signal acquisition device is developed and implemented with an Arduino controller, GSR sensor, and Bluetooth for monitoring the stress of an individual in real-time. LabVIEW is employed as a data logger for logging the sensor data of the device. The performance of the developed system is evaluated by creating physical stress on the 10 participants by allotting three distinct tasks namely reading, visualizing the timer clock, and watching videos. Moreover, the graphical representation of the stress level of the three individuals is presented in this study based on three distinct tasks. MATLAB analysis is performed for identifying the threshold value of three different states and the following are the threshold value that is obtained as Relaxed: <1.75 volts; Normal: between 1.75 and 1.44 volts and stressed: >1.44 volt. Blueterm application is utilized for visualizing the sensor data of the device over the mobile through Bluetooth communication.
Acknowledgement: This project was funded by the Deanship of Scientific Research (DSR), King Abdulaziz University, Jeddah, under Grant No. (D-136-611-1443). The authors, therefore, gratefully acknowledge DSR technical and financial support.
Funding Statement: This project was funded by the Deanship of Scientific Research (DSR), King Abdulaziz University, Jeddah, under Grant No. (D-136-611-1443). The authors, therefore, gratefully acknowledge DSR technical and financial support.
Conflicts of Interest: The authors declare that they have no conflicts of interest to report regarding the present study.
References
1. M. V. Villarejo, B. G. Zapirain and A. M. Zorrilla, “A stress sensor based on galvanic skin response (GSR) controlled by ZigBee,” Sensors, vol. 12, pp. 6075–6101, 2012. [Google Scholar]
2. J. Zhai and A. Barreto, “Stress detection in computer users based on digital signal processing of noninvasive physiological variables,” in Proc. of the 2006 Int. Conf. of the IEEE Engineering in Medicine and Biology Society, New York, NY, USA, pp. 1355–1358, 2006. [Google Scholar]
3. S. A. Lowe and G. ÓLaighin, “Monitoring human health behaviour in one’s living environment: A technological review,” Medical Engineering & Physics, vol. 36, pp. 147–168, 2014. [Google Scholar]
4. P. Ren, A. Barreto, J. Huang, Y. Gao, F. R. Ortega et al., “Off-line and on-line stress detection through processing of the pupil diameter signal,” Annals of Biomedical Engineering, vol. 42, pp. 162–176, 2014. [Google Scholar]
5. N. Widanti, B. Sumanto, P. Rosa and M. F. Miftahudin, “Stress level detection using heart rate, blood pressure, and GSR and stress therapy by utilizing infrared,” in Proc. of the 2015 Int. Conf. on Industrial Instrumentation and Control (ICIC), Pune, India, pp. 275–279, 2015. [Google Scholar]
6. F. T. Sun, C. Kuo, H. T. Cheng, S. Buthpitiya, P. Collins et al., “Activity-aware mental stress detection using physiological sensors,” in Proc. of the Int. Conf. on Mobile Computing, Applications, and Services, Santa Clara, CA, USA, pp. 282–301, 2010. [Google Scholar]
7. Y. S. Can, N. Chalabianloo, D. Ekiz and C. Ersoy, “Continuous stress detection using wearable sensors in real life: Algorithmic programming contest case study,” Sensors 2019, vol. 19, pp. 1849, 2019. [Google Scholar]
8. B. Padmaja, V. V. R. Prasad, K. V. N. Sunitha, N. C. S. Reddy and C. H. Anil, “DetectStress: A novel stress detection system based on smartphone and wireless physical activity tracker,” in Proc. of the First Int. Conf. on Artificial Intelligence and Cognitive Computing, Singapore, pp. 67–80, 2019. [Google Scholar]
9. V. Vanitha and P. Krishnan, “Real time stress detection system based on EEG signals,” An International Journal of Medical Sciences, pp. 71–75, 2016. https://krishi.icar.gov.in/jspui/handle/123456789/47716. [Google Scholar]
10. R. K. Nath and H. Thapliyal, “Smart wristband-based stress detection framework for older adults with cortisol as stress biomarker,” IEEE Transactions on Consumer Electronics, vol. 67, pp. 30–39, 2021. [Google Scholar]
11. S. A. Khowaja, A. G. Prabono, F. Setiawan, B. N. Yahya and S. L. Lee, “Toward soft real-time stress detection using wrist-worn devices for human workspaces,” Soft Computing, vol. 25, pp. 2793–2820, 2021. [Google Scholar]
12. R. K. Nath, H. Thapliyal and A. Caban-Holt, “Validating physiological stress detection model using cortisol as stress bio marker,” in Proc. of the 2020 IEEE Int. Conf. on Consumer Electronics (ICCE), Las Vegas, NV, USA, pp. 1–5, 2020. [Google Scholar]
13. P. P. Ray, D. Dash and D. De, “Analysis and monitoring of IoT-assisted human physiological galvanic skin response factor for smart e-healthcare,” Sensor Review, vol. 39, no. 4, pp. 525–541, 2019. [Google Scholar]
14. C. Goumopoulos and E. Menti, “Stress detection in seniors using biosensors and psychometric tests,” Procedia Computer Science, vol. 152, pp. 18–27, 2019. [Google Scholar]
15. A. S. Anusha, J. Jose, S. P. Preejith, J. Jayaraj and S. Mohanasankar, “Physiological signal based work stress detection using unobtrusive sensors,” Biomedical Physics & Engineering Express, vol. 4, no. 6, pp. 065001, 2018. [Google Scholar]
16. G. Iadarola, A. Poli and S. Spinsante, “Reconstruction of galvanic skin response peaks via sparse representation,” in Proc. of 2021 IEEE Int. Instrumentation and Measurement Technology Conf. (I2MTC), Glasgow, Scotland, pp. 1–6, 2021. [Google Scholar]
17. F. T. Sun, C. Kuo, H. T. Cheng, S. Buthpitiya, P. Collins et al., “Activity-aware mental stress detection using physiological sensors,” in Proc. of the Int. Conf. on Mobile Computing, Applications, and Services, Osaka, Japan, pp. 282–301, 2010. [Google Scholar]
18. J. Sengupta, N. Baviskar and S. Shukla, “Biosignal acquisition system for stress monitoring,” in Proc. of the Int. Conf. on Advances in Information Technology and Mobile Communication, Bangalore, India, pp. 451–458, 2012. [Google Scholar]
19. M. Sysoev, A. Kos and M. Pogačnik, “Noninvasive stress recognition considering the current activity,” Personal Ubiquitous Computing, vol. 19, pp. 1045–1052, 2015. [Google Scholar]
20. E. Krupinski and B. I. Reiner, “Real-time occupational stress and fatigue measurement in medical imaging practice,” Journal of Digital Imaging, vol. 25, pp. 319–324, 2012. [Google Scholar]
21. A. Dosinas, M. Vaitkūnas and J. Daunoras, “Measurement of human physiological parameters in the systems of active clothing and wearable technologies,” Elektron. ir Elektrotechnika, vol. 71, pp. 77–82, 2006. [Google Scholar]
22. F. Seoane, I. Mohino-Herranz, J. Ferreira, L. Alvarez, R. Buendia et al., “Wearable biomedical measurement systems for assessment of mental stress of combatants in real time,” Sensors, vol. 14, pp. 7120–7141, 2014. [Google Scholar]
23. S. Nayak, M. K. Soni and D. Bansal, “Filtering techniques for ECG signal processing,” International Journal of Engineering and Applied Sciences, vol. 2, pp. 671–679, 2012. [Google Scholar]
24. T. Salafi and J. C. Y. Kah, “Design of unobtrusive wearable mental stress monitoring device using physiological sensor,” in Proc. of the 7th WACBE World Congress on Bioengineering 2015, Singapore, pp. 11–14, 2015. [Google Scholar]
25. J. Y. Jung and J. W. Lee, “ZigBee device access control and reliable data transmission in ZigBee based health monitoring system,” in Proc. of the 2008 10th Int. Conf. on Advanced Communication Technology, Gangwon, Korea (Southpp. 795–797, 2008. [Google Scholar]
26. G. Wu, G. Liu and M. Hao, “The analysis of emotion recognition from GSR based on PSO,” in Proc. of the 2010 Int. Symp. on Intelligence Information Processing and Trusted Computing, Huanggang, China, pp. 360–363, 2010. [Google Scholar]
27. C. M. Durán-Acevedo, J. K. Carrillo-Gómez and C. A. Albarracín-Rojas, “Electronic devices for stress detection in academic contexts during confinement because of the covid-19 pandemic,” Electronics, vol. 10, pp. 1–23, 2021. [Google Scholar]
28. S. A. H. Aqajari, E. K. Naeini, M. A. Mehrabadi, S. Labbaf, A. M. Rahmani et al., “GSR analysis for stress: Development and validation of an open source tool for noisy naturalistic GSR data,” arXiv Preprint arXiv, 2020. [Google Scholar]
29. R. F. Navea, P. J. Buenvenida and C. D. Cruz, “Stress detection using galvanic skin response: An android application,” Journal of Physics: Conference Series, pp. 1372, 2019. [Google Scholar]
30. J. V. Raj and T. V. Sarath, “An IoT based real-time stress detection system for fire-fighters,” in Proc. of the 2019 Int. Conf. on Intelligent Computing and Control Systems (ICCS), Madurai, India, pp. 354–360, 2019. [Google Scholar]
Cite This Article
 Copyright © 2023 The Author(s). Published by Tech Science Press.
This work is licensed under a Creative Commons Attribution 4.0 International License , which permits unrestricted use, distribution, and reproduction in any medium, provided the original work is properly cited.
 Downloads
 Citation Tools