
 Submit a Paper
 Propose a Special lssue
 Open Access
ARTICLE
An Improved Hybrid Indoor Positioning Algorithm via QPSO and MLP Signal Weighting
1 Department of Physics, Faculty of Science, Universiti Putra Malaysia, UPM Serdang, 43400, Malaysia
2 Department of Electrical Engineering, Abasyn University, Khyber-Pakhtunkhwa, Pakistan
* Corresponding Author: Edgar Scavino. Email:
Computers, Materials & Continua 2023, 74(1), 379-397. https://doi.org/10.32604/cmc.2023.023824
Received 24 September 2021; Accepted 22 June 2022; Issue published 22 September 2022
 View Full Text
 Download PDF
Abstract
Accurate location or positioning of people and self-driven devices in large indoor environments has become an important necessity The application of increasingly automated self-operating moving transportation units, in large indoor spaces demands a precise knowledge of their positions. Technologies like WiFi and Bluetooth, despite their low-cost and availability, are sensitive to signal noise and fading effects. For these reasons, a hybrid approach, which uses two different signal sources, has proven to be more resilient and accurate for the positioning determination in indoor environments. Hence, this paper proposes an improved hybrid technique to implement a fingerprinting based indoor positioning, using Received Signal Strength information from available Wireless Local Area Network access points, together with the Wireless Sensor Networks technology. Six signals were recorded on a regular grid of anchor points, covering the research space. An optimization was performed by relative signal weighting, to minimize the average positioning error over the research space. The optimization process was conducted using a standard Quantum Particle Swarm Optimization, while the position error estimate for all given sets of weighted signals was performed using a Multilayer Perceptron (MLP) neural network. Compared to our previous research works, the MLP architecture was improved to three hidden layers and its learning parameters were finely tuned. These experimental results led to the 20% reduction of the positioning error when a suitable set of signal weights was calculated in the optimization process. Our final achieved value of 0.725 m of the location incertitude shows a sensible improvement compared to our previous results.Keywords
In recent years, the fast development of wireless technologies and their ubiquitous applications [1–3] have drawn lots of attention for both outdoor and indoor localization tracking implementations [4–8]. As far as outdoor applications are concerned, the most known and popular technology is the satellite based Global Position System or GPS, which offers uncountable services in the domain of tourism, navigation, military, etc [9]. However, because of the satellite origin of the GPS signals, this technology does not perform well in urban canyons, near trees, tall walls and in case of bad weather, due to the weakness of the received signals. GPS can become completely useless in indoor and underground environments. Consequently, it becomes an unreliable and ineffective way in situations where precise indoor localization is required [10].
In order to overcome these limitations, wireless technologies are being widely implemented for indoor positioning purposes. These techniques include Radio Frequency IDentification (RFID), [11,12], Wireless Local Area Networks (WLAN) [13–15], Bluetooth [16], Wireless Sensor Networks (WSN) [17–19], which are widely available and inexpensive both in terms of access points and reception devices. Thanks to the expansion of free WiFi networks and the diffusion of smartphones, location-based services have been expanding with many benefits, primarily because no additional hardware is needed for the reception of the already available signals. Hence, it is conceivable to utilize the existing WLAN infrastructure for the purpose of indoor location tracking.
In order to determine the position of a mobile reception unit in an indoor environment, the most common approach is based on the Received Signal Strength (RSS) and the pattern matching of multiple WLAN sources [20]. Other methods, based on the angle-of-arrival and the time-of-arrival depend on measurements which require additional hardware and consequently are less common and not considered in this study [21,22].
Nevertheless, even indoor environments can provide challenging scenarios when using RSS based techniques for localization purposes. The propagation of WLAN and WiFi signals is affected by fading effects and noise [23,24], because of reflection by static structures, moving people and possibly autonomous trolleys. Keeping in view these challenges, several hybrid indoor positioning systems have been proposed [25–27] in order to achieve an improved positioning accuracy, by using the advantages and abilities of multiple technologies. In this study, we collected and utilized the real signals of existing WLAN and WSN access points. Our indoor localization approach adopted the fingerprinting matching process from both WLAN and WSN signals as the basic scheme of location determination.
A pattern matching approach is classified as a deterministic algorithm [28], however the spatial distributions of the signal intensities require the implementation of non-linear methods, such as neural networks and heuristic optimization techniques. Though the signal strength could locally be approximated as spatially linear, this behavior becomes untenable in the whole research area [29]. On top of this, an Artificial Neural Network (ANN) approach guarantees robustness against noise and interference, which are among major factors affecting the accuracy of indoor positioning systems.
In view of all these considerations, this paper contributions are listed as follows:
• To develop an optimization algorithm by investigating the relative importance of wireless signals in the Multilayer Perceptron neural network.
• To introduce a heuristic approach for the determination of the weighting of the wireless signals. With this fact in mind, a Quantum Particle Swarm Optimization (QPSO) algorithm was integrated into the positioning neural network application.
• To improve the accuracy of the localization system by investigating the importance of signal weighting based on information of largest gradient of signal intensities variation. The achieved relative importance of the signals RSSI values will be considered for a future extension of this work.
This study is organized in four parts. The first section gives a brief introduction of the research area and related work. The second presents in more detail the approach and techniques which we used in this research. Particular attention was given to the QPSO optimization process and to the improvement of the MLP, which was used in our previously published works. The third part of this paper presents the results of this study, with references to the optimization of the MLP and the performance of our proposed QPSO algorithm. The final achievement of our optimization process is presented and compared with previous results both from literature and from the authors’ own research. Finally, the conclusions of this work are briefly discussed and projects and ideas for future research are introduced.
WiFi technology has been one of most promising solutions for indoor positioning system. However, a major drawback of utilizing single WiFi sources consists of the deviation of signals in the spatial space because of human presence and infrastructures. To mitigate such issues, WiFi positioning systems have been proposed to cooperate with other wireless technologies, such as magnetic field, inertial measurement unit and WSN.
Chen et al. [30] proposed a hybrid inertial measurement and WiFi positioning system. The data of acceleration and angular velocity from accelerometer sensor embedded in the smartphone are to estimate user walking steps and heading direction. A multidimensional dynamic time warping–weighted least square algorithm is used to fuse the WiFi spatial intensities based on fingerprint measurement and the one from accelerometer to improve the positioning accuracy.
Li et al. [31] also utilize the Inertial Measurement Unit (IMU) measurement to combine with WiFi technology. They proposed a robustly constrained Kalman filter algorithm to track the user location to improved previous techniques based on traditional Kalman filter algorithm.
Chen et al. [32] integrates multiple sensors including, IMU, magnetometer and WLAN RSSI indicator to improve the accuracy of the positioning system. Chen proposed a Euclidean matching algorithm to estimate the location based on WiFi signal. A different version of Kalman filter algorithm, namely the Robust Extended Kalman filter algorithm was used to estimate the location based on IMU sensor. Additionally, enhanced dynamic time warping algorithm is used to match the magnetic fingerprint location based on magnetometer measurement. Although multiple sensor systems improve the accuracy of the positioning system, the computation requires user mobile processing power to obtain the location information which might not be feasible for real-time localization.
Luo et al. [33] proposed a joint WSN-WiFi solution for improving indoor positioning estimation. The work considers the communication of signals from one sensor node to another sensor node as well as between the sensor nodes to the receiver to help locating the user. The detection algorithm considers grid-based search in order to detect the location of the user. However, the computation cost increases as the search location increase due to increment in the number of grids to be considered. Khan et al. [29] also proposed WSN-WiFi technique based on grid search which considers the floor tiles spacing. The technique estimates the location of the user to be within the respective boundaries of the specific tile location, based on an appropriately trained neural network.
This work implements a hybrid approach by means of both WSN and WiFi technologies in order to improve the accuracy of the positioning system. The application of WSN-WiFi does not require computation on user’s mobiles and it is capable of a real-time location estimation process. We utilize a new algorithm based on standard QPSO optimization and we integrate this with the MLP neural network in order to improve the accuracy of the localization system. The detailed method, which aims to find a set of appropriate signal weighing, is introduced in the next section.
Due to their widespread deployments and access points availability, WLAN-based and WSN-based technologies are gaining interest in the domain of indoor localization and positioning services. For these purposes, information data from WLAN and WSN sources are becoming more and more relevant to refine and improve the accuracy in indoor environments [13,17], whereas GPS signals become unreliable and non-existent. In this work, our goal consists of implementing a refinement of previous research, again by using a hybrid indoor positioning system in which both signals from available WLAN access points and WSN based technologies are considered.
Nevertheless, we tackled the possibility of further improvements and optimization of our previously published results [29,34]. WLAN or WSN technologies separately suffer a set of limitations, mainly related to the fading, reflection and lack of stability of signals. Thus, for example, a WiFi-based technology can provide sufficient stability with respect to WSN, while the latter become more relevant as far as fading effects are taken into consideration [35]. Moreover, the short range of WSN signal may locally constitute an advantage in positioning accuracy due to the steeper spatial gradient of the signal intensity. By taking into account both signals, a hybrid approach becomes more effective in improving the accuracy in the domain of indoor localization and positioning.
Preliminary inspection of the collected data confirmed the lack of linearity of signal intensities with respect to the relative positions inside the research area. This aspect reinforced the need to process the data by means of a machine learning approach. On top of this aspect, experimental observations on the data which was collected for this project showed that locally some signals presented spatial irregularities, especially in the corners of the research space [29]. Among the possible reasons, some considerations were discussed, like signal fading due to the distance from the opposite access points, or the instability of some signals. For these reasons, and the shortcomings of each technology when taken separately, we took the approach of weighting the available signals, with the aim of improving the indoor positioning accuracy. With six signals and 96 anchor points available, the search space of an optimal set of weights was impossible without heuristic computing. Such sort of high dimensional optimization procedure was implemented by an approach based on a standard QPSO technique.
In order to address the subject of an accurate indoor positioning system, the initial raw data collection, as well as data analysis are significant for location fingerprinting. This study investigates a collection of data which were measured as RSSI values based on an IEEE 802.11b/g wireless card. For experimental RSS data collection, the main basement level of the Faculty of Engineering and Built Environment at the Universiti Kebangsaan Malaysia (UKM), was used [35]. The RSS signals from the available access points within the area were collected and recorded. While the research area was regular in shape and did not present any obstacles, the boundaries were quite irregular, with presence of research laboratories, furnished offices, lecture halls, structural pillars as well as of people occasionally crossing the area.
The research area and the schedule of the data acquisition were purposely chosen in order to reproduce normal conditions of a typical working day. This way, disturbances on the signals and their stability, as they were received and measured, would be taken into account. A regular grid of anchor points was selected in order to encompass the available free space in the building ground floor, and working hours were used, regardless of people and materials transiting the experimental area. A sketch of the research area with boundary details and the position of the grid of anchor points are shown in Fig. 1.
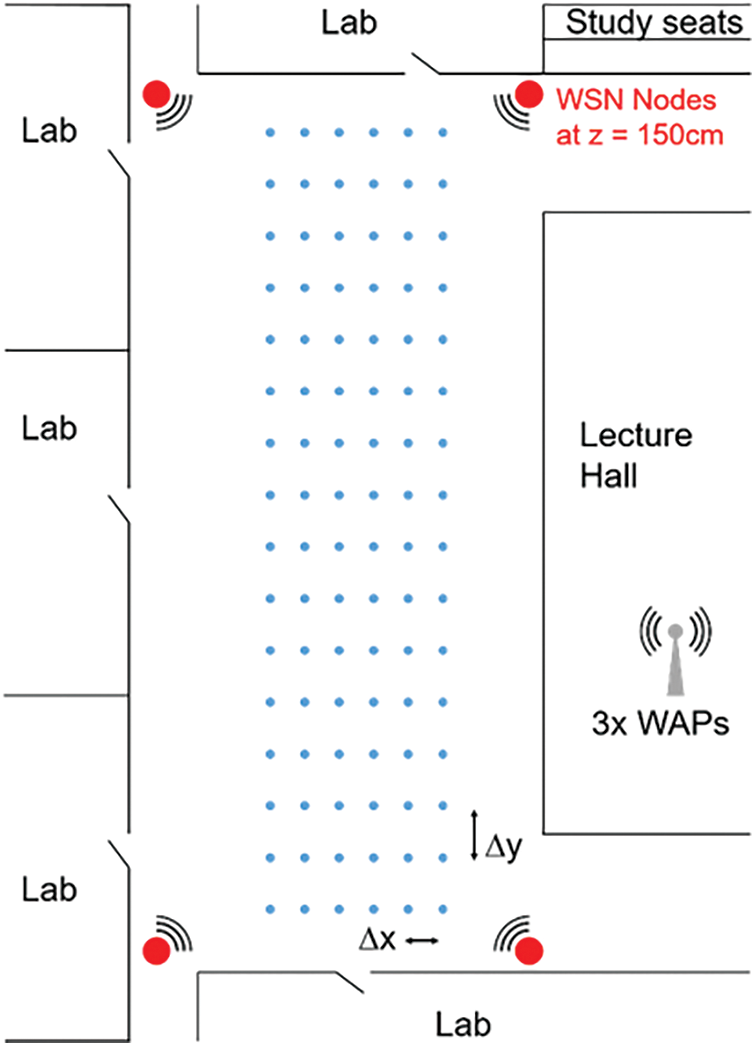
Figure 1: The sketch of the research area, with depiction of irregular boundaries, signal sources and the grid of anchor points where signal intensities were recorded. Out of the four WSN access points, only three could be used while one was faulty and did not provide meaningful data
For experimental RSS data collection, we selected a regular grid of 96 anchor points for the creation of the fingerprinting database and its implementation, in an array of 6 × 16 points. These numbers resulted from the chosen horizontal and vertical separation between anchor points, respectively 1 and 1.5 m in the directions parallel to the main walls. The height of each anchor points was strictly kept at the value of 1 m, in order to avoid variations of the locally measured signal intensities and to remove the height as a possible sensitive variable. The effects of an altitude variation were previously investigated and reported in [36].
A Lenovo G580 laptop computer with a core i5 processor and Windows 7 operating system was used as a measurement setup. Furthermore, for the collection of RSS data samples, an Atheros AR9285 on-board wireless adaptor, based on 802.11n) was added. For the collection and analysis of RSS data samples, an “inSSIDer” open WiFi Scanner software was used. Some adaptations were executed in the inSSIDer software, in order to create the log files of the measured RSS signals, with respect to visible MAC address and the time stamp.
In each of the 96 anchor points, the signal intensities from three available WiFi and the four installed WSN signal sources were recoded simultaneously 300 times for one minute, i.e., every 0.2 s. However, only three signals from the WSN were considered for the database, as it was immediately clear that one of the WSN access points was faulty and provided random, unreliable values. The average of each set of 300 values was used to build the signal intensity database. The stability of all six available signals was checked through the standard deviation of each set, which was satisfactorily within the 5% of the average value for all anchor points.
The acquired data were organized and saved in a matrix of 96 × 6 elements, in which the signals intensities from each source would occupy a column of the matrix. In columns 1–3 the WiFi data were recorded, while in columns 4–6 the WSN data would take place. For the consistency of this research and its practical applications, it was fundamental to take note of the identification and position of each source. While the philosophy of this work would not be affected, any practical implementation of the proposed research would be rendered useless by any variation of the sources, as the signal intensities at each anchor point would depend on the access points locations.
The procedural scheme of the proposed optimization algorithm is based on a number of fundamental sections. First, data from hybrid sources were acquired and stored using fingerprinting and RSS principles, without any particular preprocessing. Data were recorded on an as-is basis without any analysis and without suggestions of further need of more anchor points.
The second step consisted of the creation of a mathematical model capable of reproducing the behavior of the measured signal intensities along the 2D space of the experimental area. Due to the features of the signal intensities, a Multilayer Perceptron (MLP) neural network was developed and trained, in consideration of its capabilities to make models and to classify inherently non-linear data. Through the MLP modelling of the 2D behavior of each signal, the reduction of positioning errors on selected test points was supposedly achieved.
Finally, an optimization algorithm was developed in order to address the main subject of this research, i.e., to investigate the possibility that an improved positioning accuracy can be achieved through the MLP by an appropriate weighting of the raw signal intensities. When taking in consideration the number of signals and anchor points altogether, it is clear that a heuristic approach to this optimization process is required. A QPSO algorithm was chosen, due to its features of rapid convergence to global optimal solution and its relative ease of programming, when compared to other available optimization algorithms [37]. The scheme of the overall procedure is shown in Fig. 2.
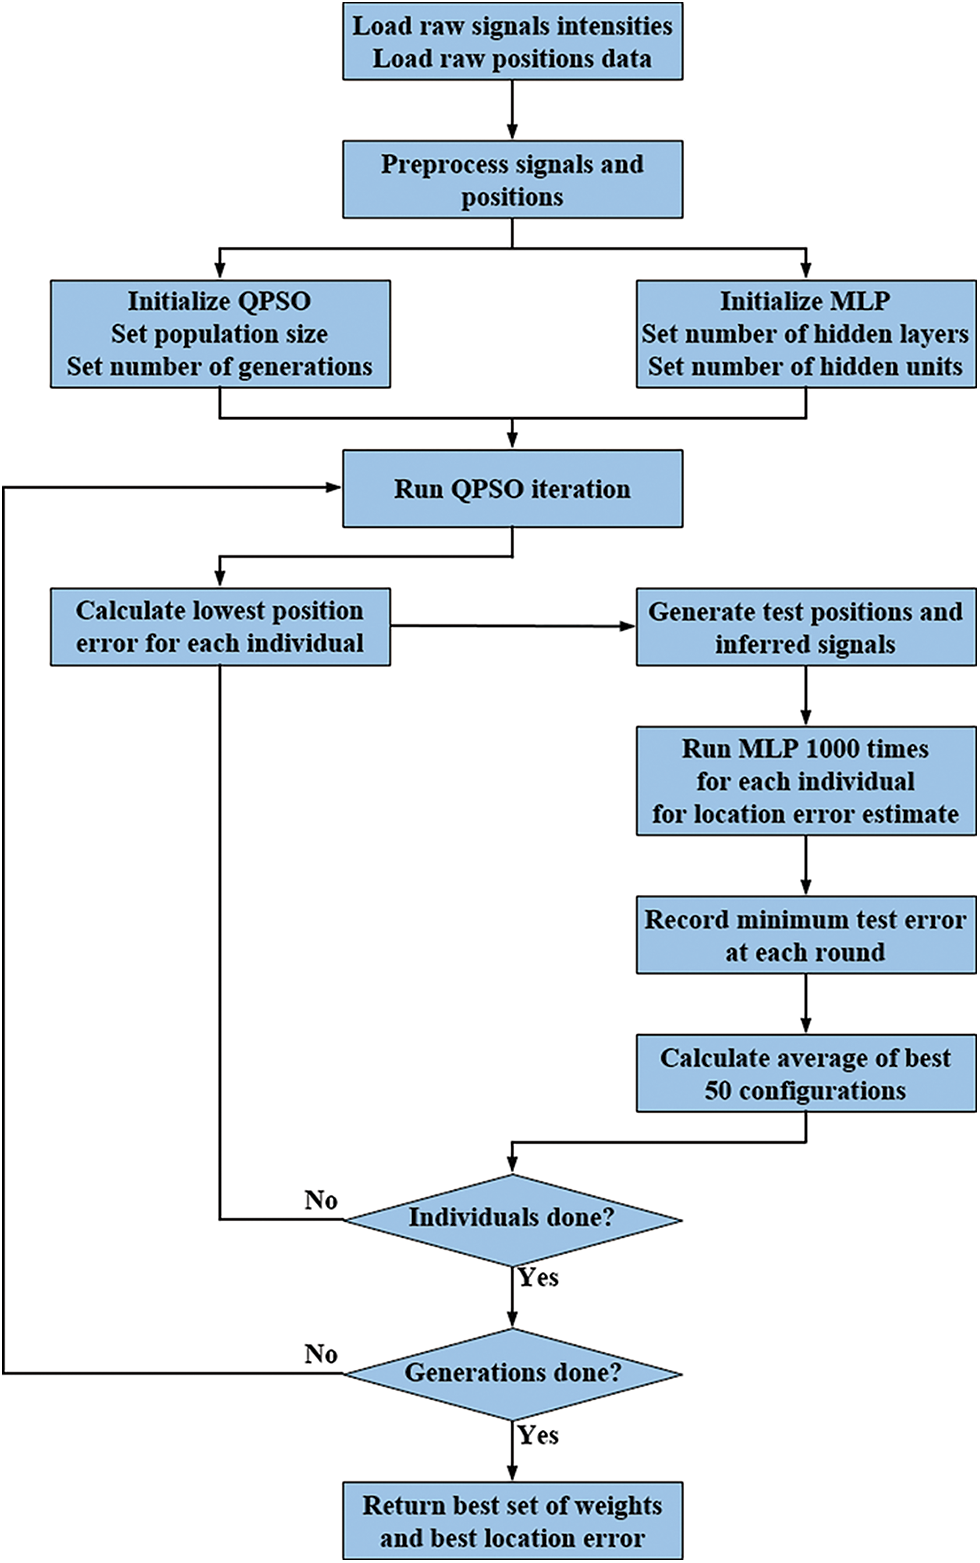
Figure 2: The flow chart of the overall proposed algorithm of the research methodology
3.3 QPSO Optimization Algorithm
The role of the QPSO in the data analysis of this research consists in searching for an appropriate set of weights for the raw signal intensities and to feed the weighted values to the MLP. Like any machine learning based optimization algorithm, the determination of optimal values is heuristically performed across a multidimensional search space. In this work there are six signal intensity values, consequently the search space becomes hexadimensional.
The QPSO algorithm [38,39] is an evolution of the standard PSO optimization process [40], which was introduced in 1995. In the PSO optimization process, a population of candidate solutions is first created within a multidimensional search space. Every candidate solution
where
The QPSO algorithm, first introduced in 2004, is inspired by the Quantum Mechanics concept that every particle is associated to a wave, and the fact that, in principle, the quantum waves cover all the search space. The classical laws of motion in Eqs. (1) and (2) need to be modified under the consideration that the candidate solutions
being N the size of the population. The second attractor
where
The parameter
where
The algorithm is usually repeated a pre-defined number of times. Considering its nature, in which the positions are evaluated by linear combination of vectors, the applicability is naturally taken into consideration when the search space is a subset of a multidimensional set of real numbers
For each set of weights
3.4 MLP Based Localization Error Determination
An Artificial Neural Network [41] approach is justified by the consideration that the signal variations along the research area are strongly non-linear and basically unpredictable a-priori, due to their complexity. Because of their learning and adaptative capabilities, ANN are widely employed in the field of indoor positioning, especially in combination with fingerprinting techniques. A commonly used ANN architecture is the simple feedforward-backpropagation MLP approach, which makes use of non-linear filtering functions, followed by a momentum improved gradient-descent reduction of the regression error.
The ultimate goal of any MLP training consists of reducing the error computed on the mismatch between the MLP output and an expected target, in a supervised learning procedure. In order to achieve this goal, input data are split into two sets, namely the training and testing data. Both sets consist of a list of {input vector–expected target} pairs, but only the former is used for training, while the latter is a form of control on the quality of the training, in terms of the verification of the network generalization vs. memorization capabilities.
In this research work, the set of six relatively weighted RSS signals
for
where
The training data is used in the standard feedforward-backpropagation learning process with the goal of finding an appropriate set of weight matrixes
In this work, all 96 experimental points were retained as training data, each consisting of a set of six signals and two spatial coordinates. The testing data were created as a list of 20 points of coordinates
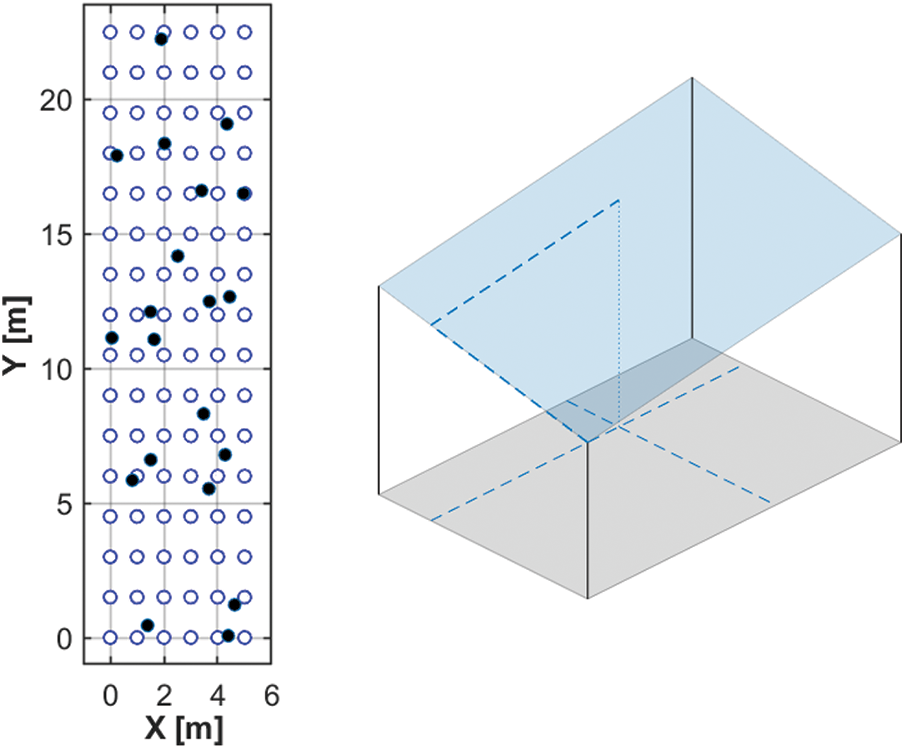
Figure 3: (left) The layout of the anchor points (blue circles) and the test points in random positions (black dots) within the experimental area. (right) The bilinear interpolation procedure used to infer test signal values. The 2D interpolated value is obtained by adding the multiplied RSS signal in each corner with the opposite area fraction
The first step of the feedforward phase of the training algorithm consists in multiplying the vector of signals and subsequently filtering the result, thus obtaining the first hidden layer
In this expression
Depending on the number of hidden layers, the process is repeated iteratively for each hidden layer
The backpropagation phase consists in the correction of each term of the weight matrixes, with value proportional to the partial gradient of the training error
However, the hidden layers are not actually modified, but the calculation of these variations is necessary to evaluate the correction on the weights, which is obtained by:
The correction values thus achieved are multiplied by a constant
In this work we applied a refinement of the standard backpropagation process, which includes the so-called adaptative momentum technique, or “adam” [42,43]. This procedure alters the values of the learning rate
The equations for the update of first and second momenta are:
and the weights are updated according to the expression:
In this research work, the positioning algorithm was built with the purpose of matching a set of RSS signal weights to the minimum error for indoor localization. The goal is to find an optimum set of weights for which the average distances between the measured and the inferred positions of the testing data are reduced. In order to achieve this goal, a standard QPSO algorithm was designed with the parameters shown in Tab. 1. The algorithm for the proposed technique was developed in Matlab and run on a Windows-based 2.6 GHz Core i7 laptop.
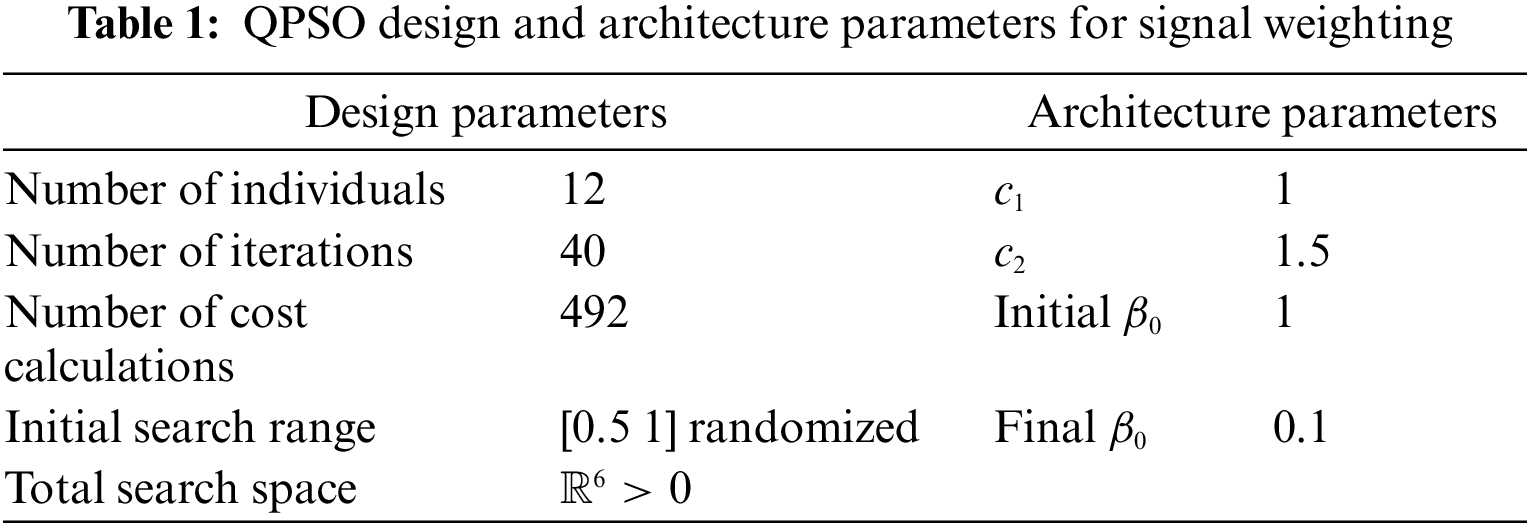
The QPSO algorithm, like any other heuristic optimization process, is supposed to improve the search results by increasing the size of the population and the number of generations. However, for this work, each cost calculation took an average of 250 s; thus, the values reported in Tab. 1 were accepted as a good compromise between computing time and quality of the QPSO optimization capabilities. In this work, each QPSO individual consists of a vector of six signal weights
The outcome of MLP is typically heavily depending on the initial random set of training weights
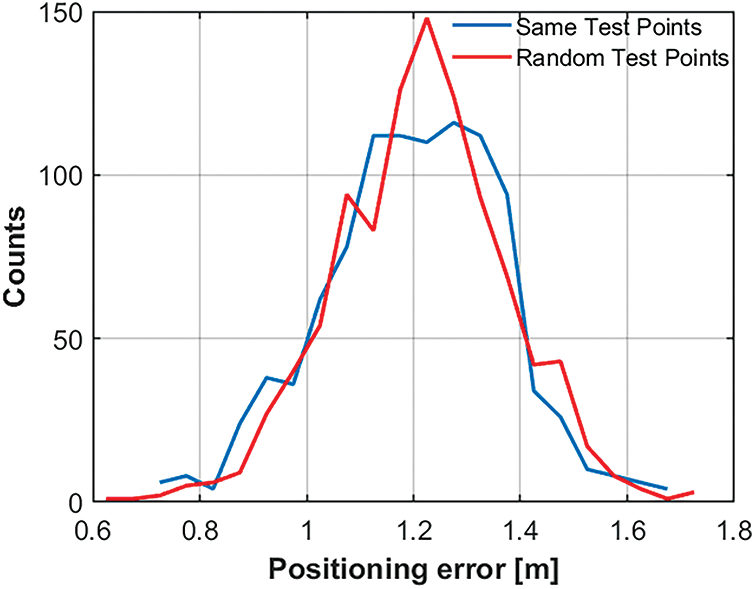
Figure 4: The results of 1000 MLP runs with random initial weights. The blue line was obtained with the same set of 20 initial test points, while the red line was obtained by randomly selecting 20 test points at the beginning of each run. No meaningful difference is observed
Both in these validation runs and in the actual QPSO optimization algorithm, the MLP was run 1000 times in order to achieve the best performances, i.e., to identify a suitable set of weights
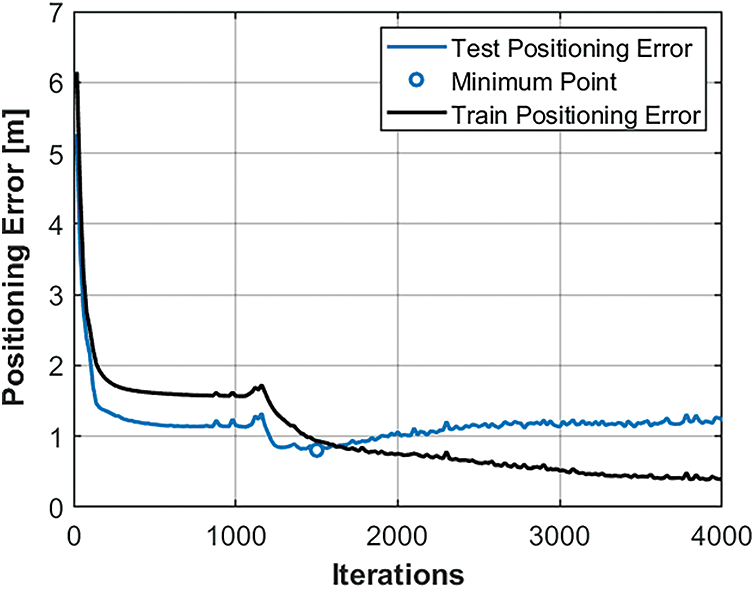
Figure 5: The profiles of the positioning error relative to the training and testing data in a typical MLP run. The minimum value in the testing profile was identified and returned as the positioning error for the run
The cost value for each QPSO individual was finally evaluated as the average of the best 50 out of the 1000 MLP runs, which would correspond to a fortunate initial random choice of the
After the definition of the optimization procedure, by means of a QPSO algorithm, and the technique for the calculation of the localization error, by means of a standard MLP with an adaptative backpropagation process, the next step of this research consisted in the determination of the most suitable MLP architecture. In general, several parameters can be identified in order to achieve an effective process of optimization with the QPSO algorithm and a quick training process with the MLP. For the QPSO part, it was decided to stay with the standard parameters found in literature, namely those reported in Tab. 1.
Multilayer Perceptron neural networks are subject to several parameters which greatly affect the training accuracy and the computing time. In order to fine-tune the MLP used in this research, several dry runs were performed before launching the whole optimization process, which would include many hundred million training iterations. The number of hidden layers plays an important role in terms of the generalization capabilities of the MLP. Consequently, the described process of taking the best 50 out of 1000 runs and inspecting the final positioning error was applied for MLPs with up to five hidden layers. In each case, the same number of twenty units in the layers was considered and the original, unweighted set of signals for training was used in this stage. A few tests were performed with different numbers of hidden units in each layer, looking again for the lowest averaged error on random sets of test points. Settling for 18 hidden units in each layer. As shown in Fig. 6 and reported in Tab. 2, the best starting configuration for the overall optimization algorithm was achieved with a MLP network including three hidden layers. At the same time, a number of standard parameters for a satisfactory MLP training were defined and reported in Tab. 2.
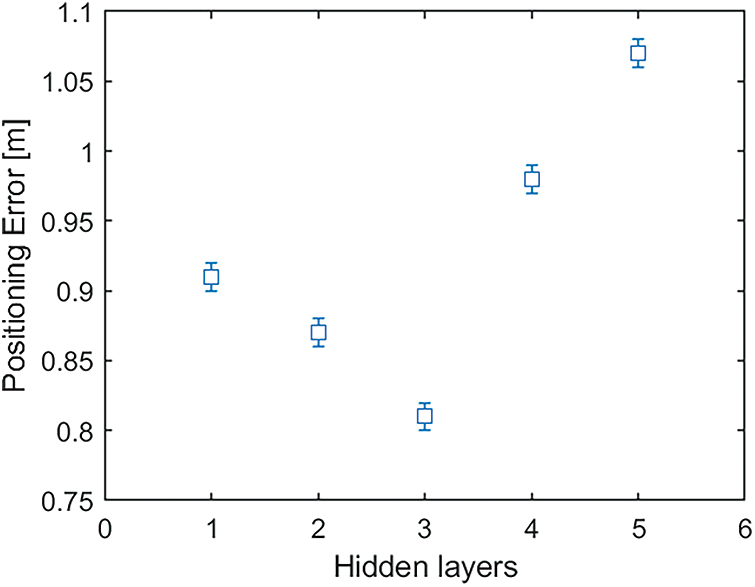
Figure 6: The performance of the MLP training vs. the number of hidden layers. Three hidden layers were chosen for the overall QPSO optimization algorithms as this architecture shows the best results in terms of initial positioning accuracy
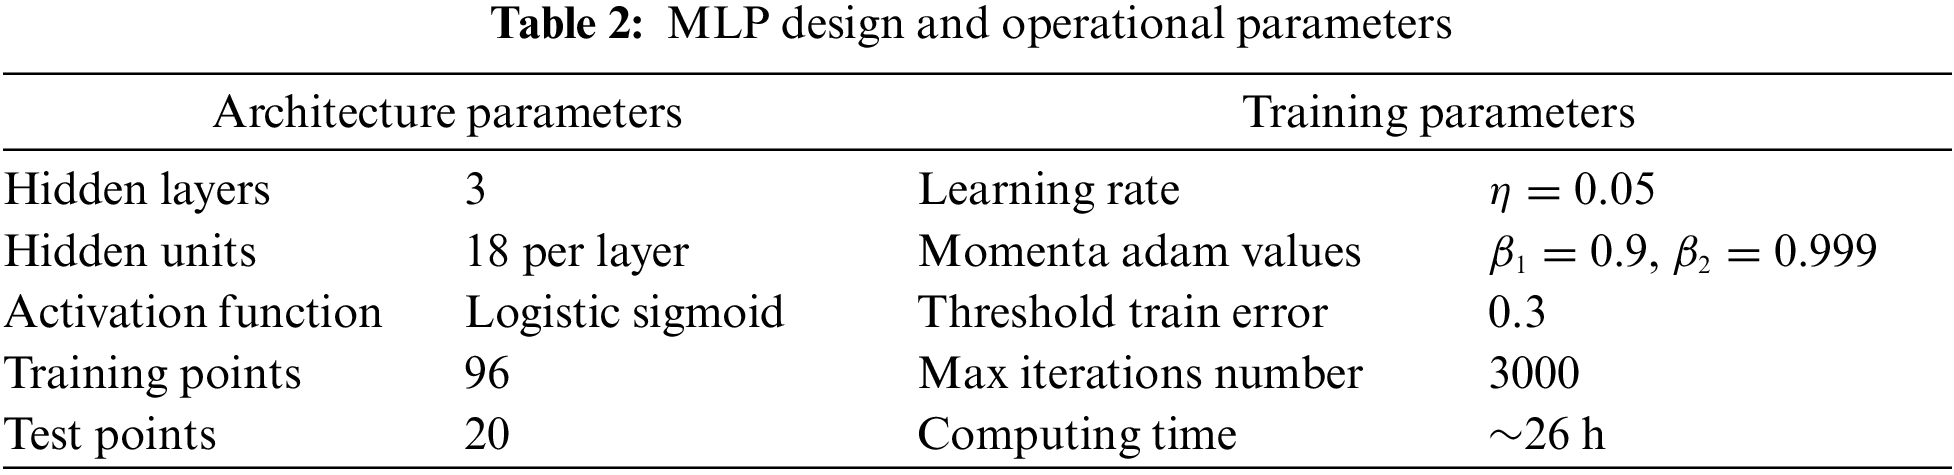
The values of the learning rates and momentum coefficients, as well as the maximum number of iterations and the threshold for the MLP training error were determined by performing many runs, by visual inspection of profiles as in Fig. 5 and by measuring the computing time of sets of 1000 runs. The threshold training error
The QPSO optimization procedure was repeated for a total of 40 generations, each producing a new population of 12 vectors of 6 signal weights. Thanks to the QPSO own nature, the global best individual, i.e., the vector of signal weights producing the lowest positioning error, was recorded at every stage of the algorithm. Each individual weights vector
where the actual position values
where the average was calculated across the 20 test points.
For each QPSO generation, the best vector of signal weights was recorded as an integral part of the optimization algorithm. Among the 12 individuals, the global best was retained and recorded as being the partial performance of the optimization procedure. The value of the resulting positioning error as a function of the QPSO iteration number is shown in Fig. 7.
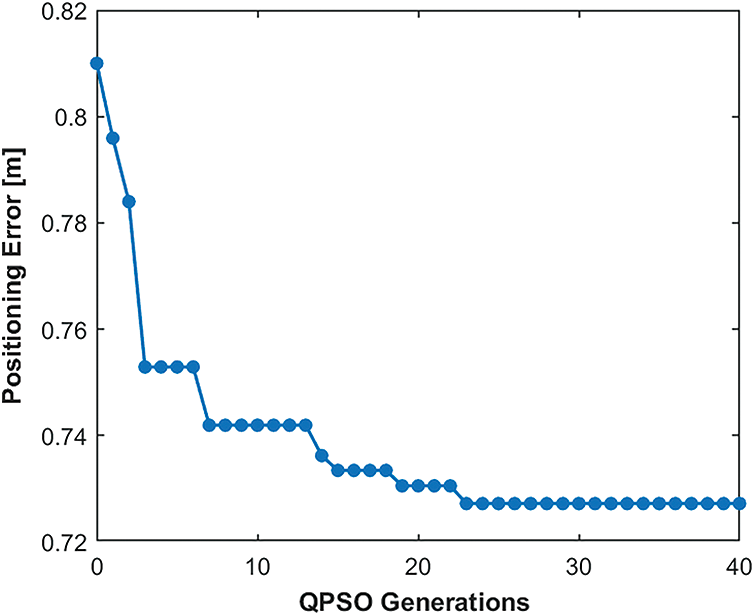
Figure 7: The overall performance of the QPSO algorithm in terms of the positioning error reduction. The final value of 0.725 m was achieved by heuristically searching for appropriate values of the weights of the experimental signals
The initial value of 0.81 m matches the positioning error found for three hidden layers in the tune-up stage of this process, as shown in Fig. 6. The optimization algorithm immediately produced a sharp decrease of the positioning error in the very few initial QPSO generations. The overall behavior of the positioning error, as reported in in Fig. 7, shows that, after a steep decrease, no further improvement is achieved in the second half of the optimization process.
The set of six signal weights
These values were rescaled so that the highest weight was set to be equal to 1, for ease of comparison. Several further rounds of 1000 iterations were performed in order to verify the consistency of the achieved results, and each time the MLP provided a positioning error on the test data very close to the QPSO final value. As expected, the rescaling of the signal weights would not alter the final MLP output, as the first weight matrix of the MLP would adapt, during training, to the relative proportions of the signals. The lowest value of the positioning error, achieved by considering the test population, equals to 0.725 m. By inspecting the final values of the signal weights in Eq. (18), it is remarkable how signal #6 is significantly more relevant with respect to the others, as its weight is higher by a factor of two or more. The investigation of this discrepancy goes beyond the scope of this paper; however, the precision of the proposed optimization process was evaluated by taking into consideration the signal weights which corresponded to the 10 overall lowest positioning errors which were recorded after the last QPSO generation. Each set of six weights was rescaled with respect to its highest value, which was in all cases signal #6. The results are shown in Fig. 8.
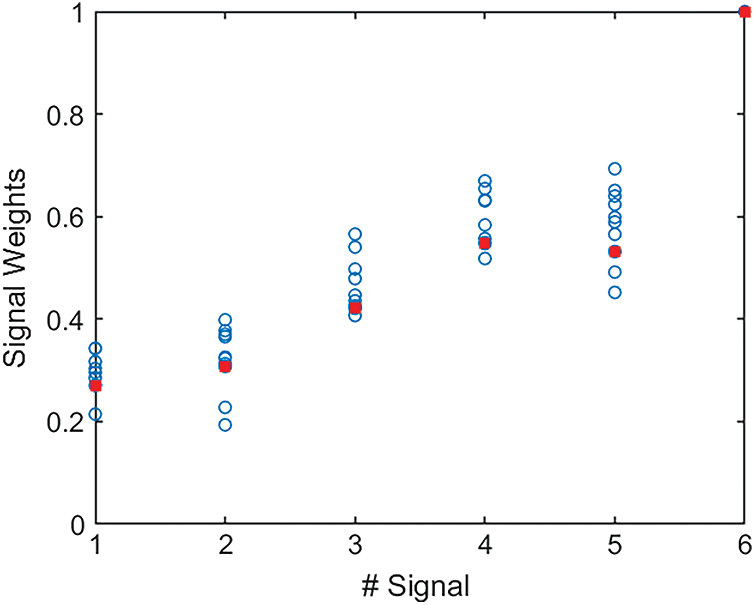
Figure 8: The weights of the six signals corresponding to the lowest 10 values of the positioning errors of the test population. In red, the overall best signal weights are highlighted. In this graph, the positioning error range is [0.725–0.744]
It can be observed that the distribution of the values for each signal weight is fairly contained within a limited range, rather than being spread all over the QPSO search space and beyond. In all cases, signal #6 is by far the most relevant in the role of indoor positioning by RSS and fingerprinting technique and consequently all values were rescaled with respect to this signal. In general, the weights of signals 4–6, which are coming from the WSN sources, are proportionally higher with respect to the signals 1–3 which are generated by the WiFi sources. The reason of this behavior might be linked to the fact that WSN signals are shorter ranged than WiFi signals and consequently produce a larger spatial intensity gradient. It is possible that this feature generates a higher positioning accuracy, and it should be considered as a subject of further investigation.
The Cumulative Distribution Function (CDF) is represented in Fig. 9, for three scenarios of optimally trained neural networks. The graphs were obtained by including all the positioning errors of the 20 test points separately for the 50 best MLP runs out of 1000. Each distribution includes the positioning error of 1000 test points, showing occasional values around 20 cm or above 3 m. However, the results reported in this work are evaluated on the averages of the 1000 experimental data. The increase from one to three hidden layers for unweighted signals provided a marginal improvement, which was anyway retained in building the architecture of the MLP for the QPSO optimization. On the other hand, the effects of the signals weighting are outstanding when the optimal values, reported in Eq. (18), are considered. An improvement of approximately 30% in the positioning accuracy, for equivalent percentiles of the CDF, is observed on the weighted signals with respect to the raw ones, with the same three-layer MLP architecture.
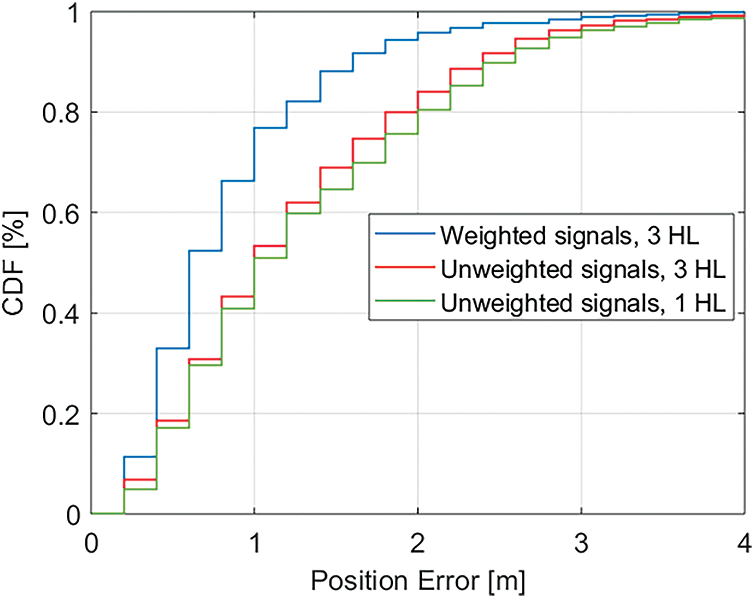
Figure 9: The CDF distribution for three different scenarios. A comparison is presented between the results with unweighted signals with 1 hidden layer, three hidden layers and the final configuration with three hidden layers and the best signal weights
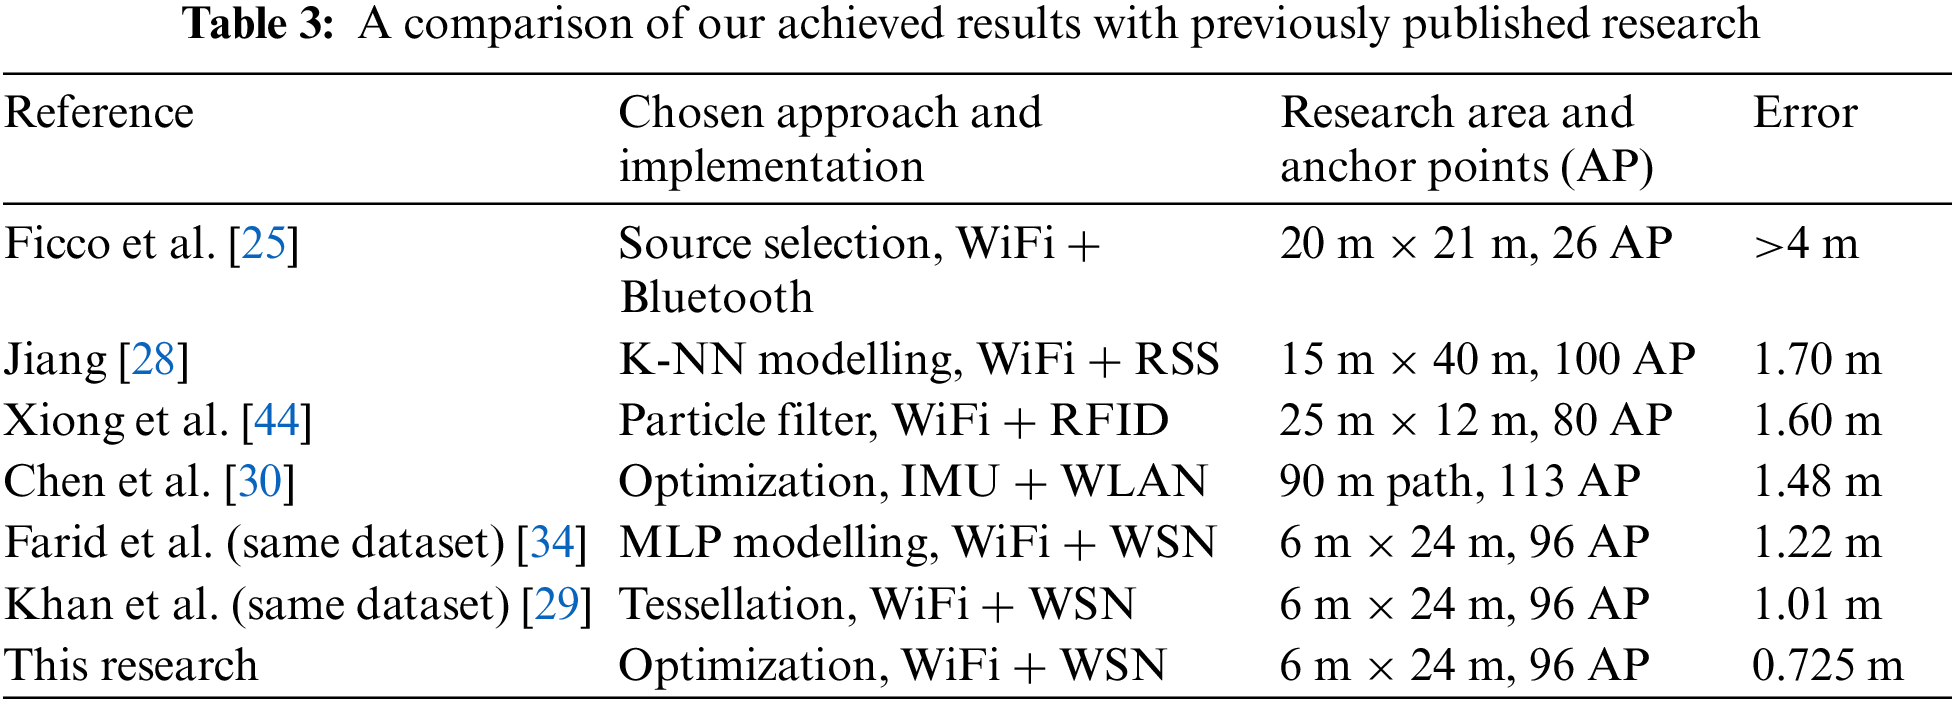
A comparison of the results achieved in this research with a selection of relevant previously published location average errors is presented in Tab. 3. Our previous work, based on the same raw data, is included together with other benchmark results available in literature, showing a remarkable reduction in the positioning incertitude.
This paper illustrates a QPSO optimization algorithm for an indoor positioning system based on hybrid raw RSS signals. The proposed system is centered on the strength and intensity of the received signals obtained from a set of locations used for experiments. The idea of achieving an enhanced localization accuracy by successfully explored by implementing the concept of weighting of the received signals. A Multilayer Perceptron neural network was developed in order to predict a heuristically optimum positioning error for each QPSO individual. An accurate choice of MLP parameters was preliminarily studied as a further improvement of the performance of the overall algorithm. As a noteworthy particular, a three hidden layers MLP architecture was identified as an optimal starting point with the positioning accuracy in mind. The QPSO optimization results of the proposed system provided a final set of weights to be applied to the raw input signals in order to minimize the positioning error of our algorithm. In particular, a comparison was drawn with our previously published results on the same set of data. Our final achieved localization accuracy was 0.725 m, which constitutes an improvement of at least 20% with respect to our previous results on the same dataset.
On top of these algorithmic achieved results, our hybrid indoor positioning approach provides advantages in term of decreased cost, easy access to RSS signals and easy expandability to large areas, in order to further test the performance and robustness of the overall procedure.
As future work, the positioning accuracy might be investigated by changing the size of the experimental area as well as changing the distances between anchor points. Computing time being a sensible limiting factor of this research, the QPSO approach in terms of total number of individuals can be improved with the availability of more powerful hardware.
The relative importance of the RSS signals was established by the fairly compact distributions of the weights of each signal. This observation will surely be considered as a starting point for further investigation, as little analysis was performed on the spatial distribution of the signals.
Acknowledgement: The authors wish to thank Assoc. Prof. Ir. Dr. Rosdiadee Nordin and Prof. Dr. Mahamod Ismail of UKM for helping in the organization of data collection in public areas of the Faculty of Engineering.
Funding Statement: The authors received no specific funding for this study.
Conflicts of Interest: The authors declare that they have no conflicts of interest to report regarding the present study.
References
1. G. D. Bonde, P. U. Barwal, S. R. Pal and S. I. Khan, “Finding indoor position of person using WiFi & smartphone: A survey,” IJIRST International Journal for Innovative Research in Science & Technology, vol. 1, no. 8, pp. 202–207, 2015. [Google Scholar]
2. H. S. Maghdid, I. A. Lami, K. Z. Ghafoor and J. Lloret, “Seamless outdoors-indoors localization solutions on smartphones: Implementation and challenges,” ACM Computing Surveys, vol. 48, no. 4, pp. 1–34, 2016. [Google Scholar]
3. Q. Tian, Z. Salcic, K. I. -K. Wang and Y. Pan, “A hybrid indoor localization and navigation system with map matching for pedestrians using smartphones,” Sensors, vol. l, no. 12, pp. 30759–30783, 2015. [Google Scholar]
4. F. Saleem and S. Wyne, “WLAN-based indoor localization using neural networks,” Journal of Electrical Engineering, vol. 67, no. 4, pp. 299–306, 2016. [Google Scholar]
5. M. A. Abd Rahman, M. K. Karim and C. E. Bundak, “Weighted local access point based on fine matching k-nearest neighbor algorithm for indoor positioning system,” in Proc. 2019 AEIT Int. Annual Conf., Florence, Italy, pp. 1–5, 2019. [Google Scholar]
6. F. Zafari, A. Gkelias and K. K. Leung, “A survey of indoor localization systems and technologies,” IEEE Communications Surveys & Tutorials, vol. 21, no. 3, pp. 2568–2599, 2019. [Google Scholar]
7. A. K. Abed and I. Abdel-Qader, “Access point selection using particle swarm optimization in indoor positioning systems,” in Proc. NAECON, 2018-IEEE National Aerospace and Electronics Conf., Dayton, OH, USA, pp. 403–410, 2018. [Google Scholar]
8. F. Xu, X. Hu, S. Luo and J. Shang, “An efficient indoor WiFi positioning method using virtual location of AP,” ISPRS International Journal of Geo-Information, vol. 9, no. 4, pp. 261, 2020. [Google Scholar]
9. M. A. Forin-Wiart, P. Hubert, P. Sirguey and M. L. Poulle, “Performance and accuracy of lightweight and low-cost GPS data loggers according to antenna positions, fix intervals, habitats and animal movements,” PLOS ONE, vol. 10, no. 6, pp. 1–21, 2015. [Google Scholar]
10. S. Yeh, W. Hsu, W. Lin and Y. Wu, “Study on an indoor positioning system using Earth’s magnetic field,” IEEE Transactions on Instrumentation and Measurement, vol. 69, no. 3, pp. 865–872, 2020. [Google Scholar]
11. Y. Tao, L. Wu, J. Sidén and G. Wang, “Monte Carlo-based indoor RFID positioning with dual-antenna joint rectification,” Electronics, vol. 10, no. 13, pp. 1548, 2021. [Google Scholar]
12. M. Scherhäufl, B. Rudic, A. Stelzer and M. Pichler-Scheder, “A blind calibration method for phase-of-arrival-based localization of passive UHF RFID transponders,” IEEE Transactions on Instrumentation and Measurement, vol. 68, no. 1, pp. 261–268, 2019. [Google Scholar]
13. J. Zhou, Y. Ke, K. Yu and D. Tian, “A solution of high-precision WLAN positioning based on TDOA and PTP,” MATEC Web of Conferences, vol. 61, no. 3, pp. 7018, 2016. [Google Scholar]
14. I. H. Alshami, N. A. Ahmad, S. Sahibuddin and F. Firdaus, “Adaptive indoor positioning model based on WLAN-fingerprinting for dynamic and multi-floor environments,” Sensors, vol. 17, no. 8, pp. 1789–1807, 2017. [Google Scholar]
15. K. T. Fang, C. T. Lee and L. Sun, “An improved hierarchical WLAN positioning method based on apriori knowledge,” Electronics, vol. 8, no. 5, pp. 475, 2019. [Google Scholar]
16. A. Genco, “Three step Bluetooth positioning,” in LoCA'05: Proc. of the First Int. Conf. on Location-and Context-Awareness, Oberpfaffenhofen, Germany, pp. 52–62, 2005. [Google Scholar]
17. J. Chen, S. Wang, M. Ouyang, Y. Xuan and K. C. Li, “Iterative positioning algorithm for indoor node based on distance correction in WSNs,” Sensors, vol. 19, no. 22, pp. 4871, 2019. [Google Scholar]
18. M. A. Benatia, M. Sahnoun and D. Baudry, “Multi-objective WSN deployment using genetic algorithms under cost, coverage, and connectivity constraints,” Wireless Personal Communications, vol. 94, no. 4, pp. 2739–2768, 2017. [Google Scholar]
19. T. Li, W. Yan, L. Ping and P. Fang, “A WSN positioning algorithm based on 3D discrete chaotic mapping,” EURASIP Journal on Wireless Communications and Networking, vol. 126, no. 1, pp. 1323, 2019. [Google Scholar]
20. A. Abed and I. Abdel-Qader, “RSS-fingerprint dimensionality reduction for multiple service set identifier-based indoor positioning systems,” Applied Sciences, vol. 9, no. 15, pp. 3137, 2019. [Google Scholar]
21. P. Deng and P. Z. Fan, “An AOA assisted TOA positioning system,” in Proc. Int. Conf. on Communication Technology, Beijing, China, vol. 2, pp. 1501–1504, 2000. [Google Scholar]
22. A. De Gante and M. Siller, “A survey of hybrid schemes for location estimation in wireless sensor networks,” Procedia Technology, vol. 7, pp. 377–383, 2013. [Google Scholar]
23. H. Arai, “Antennas in access points of WLAN/WiFi,” in Handbook of Antenna Technologies, In: Z. Chen, D. Liu, H. Nakano, X. Qing and T. Zwick (Eds.Singapore: Springer, pp. 2579–2588, 2016. [Google Scholar]
24. R. A. E. Younis Ali, A. Babiker and A. N. Mustafa, “Performance analysis of WiFi network,” IOSR Journal of Electronics and Communication Engineering, vol. 10, no. 2, pp. 67–76, 2015. [Google Scholar]
25. M. Ficco, F. Palmieri and A. Castiglione, “Hybrid indoor and outdoor location services for new generation mobile terminals,” Personal and Ubiquitous Computing, vol. 18, no. 2, pp. 271–285, 2014. [Google Scholar]
26. J. Rapinski and S. Cellmer, “Analysis of range based indoor positioning techniques for personal communication networks,” Mobile Networks Applications, vol. 21, no. 3, pp. 539–549, 2016. [Google Scholar]
27. S. Monica and F. Bergenti, “Hybrid indoor localization using WiFi and UWB technologies,” Electronics, vol. 8, no. 1, pp. 334–347, 2019. [Google Scholar]
28. L. Jiang, “A WLAN fingerprinting based indoor localization technique,” M.S. thesis, Dept. Computer Science, University of Nebraska, NE, 2012. [Google Scholar]
29. I. U. Khan, T. Ali, Z. Farid, E. Scavino and M. A. Abdul Rahman, “An improved hybrid indoor positioning system based on surface tessellation artificial neural network,” Measurement and Control, vol. 53, no. 9–10, pp. 1968–1977, 2020. [Google Scholar]
30. J. Chen, G. Ou, A. Peng, L. Zheng and J. Shi, “An INS/WiFi indoor localization system based on the weighted least squares,” Sensors, vol. 18, no. 5, pp. 1458–1476, 2018. [Google Scholar]
31. Z. Li, L. Zhao, C. Qin and Y. Wang, “WiFi/PDR integrated navigation with robustly constrained Kalman filter,” Measurement Science and Technology, vol. 31, no. 8, pp. 84002, 2020. [Google Scholar]
32. J. Chen, S. Song and H. Yu, “An indoor multi-source fusion positioning approach based on PDR/MM/WiFi,” AEU International Journal of Electronics Communications, vol. 135, pp. 153733, 2021. [Google Scholar]
33. J. Luo, Z. Zhang, C. Liu and H. Luo, “Reliable and cooperative target tracking based on WSN and WiFi in indoor wireless networks,” IEEE Access, vol. 6, pp. 24846–24855, 2018. [Google Scholar]
34. Z. Farid, I. U. Khan, E. Scavino and M. A. Abd Rahman, “A WLAN fingerprinting based indoor localization technique via artificial neural network,” IJCSNS International Journal of Computer Science and Network Security, vol. 19, no. 7, pp. 157–165, 2019. [Google Scholar]
35. Z. Farid, “Higher accuracy hybrid wireless indoor localization using machine learning,” Ph.D. dissertation, Universiti Kebangsaan Malaysia, 2016. [Google Scholar]
36. Z. Farid, R. Nordin, M. Ismail and N. F. Abdullah, “Hybrid indoor-based WLAN-WSN localization scheme for improving accuracy based on artificial neural network,” Mobile Information Systems, vol. 2016, pp. 1–11, 2016. [Google Scholar]
37. P. Y. Xiao, J. Peng and G. Zhou, “An improved QPSO algorithm based on social learning and Lévy flights,” Systems Science & Control Engineering, vol. 6, no. 3, pp. 364–373, 2018. [Google Scholar]
38. J. Sun, B. Feng and W. Xu, “Particle swarm optimization with particles having quantum behaviour,” in Proc. of the 2004 Congress on Evolutionary Computation, Portland OR, USA, pp. 325–331, 2004. [Google Scholar]
39. A. S. Bhatia, M. K. Saggi and S. Zheng, “QPSO-CD: Quantum-behaved particle swarm optimization algorithm with Cauchy distribution,” Quantum Information Processing, vol. 19, no. 10, pp. 345, 2020. [Google Scholar]
40. M. Clerc and J. Kennedy, “The particle swarm–explosion, stability, and convergence in a multidimensional complex space,” IEEE Transactions on Evolutionary Computation, vol. 6, no. 1, pp. 58–73, 2002. [Google Scholar]
41. S. Russell and P. Norvig, Artificial Intelligence–A Modern Approach, 4th ed., New Jersey, USA: Pearson Prentice Hall, 2020. [Google Scholar]
42. D. P. Kingma and J. L. Ba, “Adam: A method for stochastic optimization,” in Proc. Int. Conf. on Learning Representations (ICLR), San Diego, CA, USA, pp. 1–13, 2015. [Google Scholar]
43. R. Zaheer and S. Humera, “A study of the optimization algorithms in deep learning,” in Proc. Int. Conf. on Inventive Systems and Control (ICISC 2019), Seoul, Korea, pp. 536–539, 2019. [Google Scholar]
44. Z. Xiong, Z. Y. Song, A. Scalera, E. Ferrera, F. Sottile et al., “Hybrid WSN and RFID indoor positioning and tracking system,” EURASIP Journal on Embedded Systems, vol. 1, no. 1, pp. 1–13, 2013. [Google Scholar]
Cite This Article
 Copyright © 2023 The Author(s). Published by Tech Science Press.
This work is licensed under a Creative Commons Attribution 4.0 International License , which permits unrestricted use, distribution, and reproduction in any medium, provided the original work is properly cited.
 Downloads
 Citation Tools