| Computers, Materials & Continua DOI:10.32604/cmc.2022.031135 |  |
| Article |
A Deep Learning Model for EEG-Based Lie Detection Test Using Spatial and Temporal Aspects
Department of Computer Sciences, College of Computer and Information Sciences, Princess Nourah Bint Abdulrahman University, P.O. Box 84428, Riyadh, 11671, Saudi Arabia
*Corresponding Author: Hanan Ahmed Hosni Mahmoud. Email: hahosni@pnu.edu.sa
Received: 11 April 2022; Accepted: 07 June 2022
Abstract: Lie detection test is highly significant task due to its impact on criminology and society. Computerized lie detection test model using electroencephalogram (EEG) signals is studied in literature. In this paper we studied deep learning framework in lie detection test paradigm. First, we apply a preprocessing technique to utilize only a small fragment of the EEG image instead of the whole image. Our model describes a temporal feature map of the EEG signals measured during the lie detection test. A deep learning attention model (V-TAM) extracts the temporal map vector during the learning process. This technique reduces computational time and lessens the overfitting in Deep Learning architectures. We propose a Cascading attention model with a deep learning convolutional neural network (CNN). V-TAM model extracts local features and global features in separate paths spatial and temporal. Also, to enhance the EEG segmentation precision, a novel Visual-Temporal Attention Model (V-TAM) is proposed. The accuracy was evaluated using data measured from a sensor from a public dataset of 9512 subjects during fifteen minutes lie detection task. We compared our model with three recent published models. Our proposed model attained the highest performance of (98.5%) with (p < 0.01). The visual-temporal model of the proposed platform shows an optimized balance between prediction accuracy and time efficiency. Validation investigation were performed to prove the correctness and reliability of the proposed method through sizing of the input data, proving its effectiveness in attaining satisfactory performance by using only a smaller size input data.
Keywords: Lie detection; EEG image; deep learning; machine learning
Recent studies have been performed to launch a feasible and robust lie detection test computerized method to prevent crimes lie-related casualty and losses [1–3]. Recently, lie detection test models are based on extracting multiple features, such as physiological features from EEG signals [3–5], electrocardiogram signals (ECG) [6,7] and electromyography signals (EMG) [8]. Also, visual features such as facial features and eye blinks [9–12]. Recently, the authors in [13] presented a review of research studies in automated lie detection models revealing new relevant trends. Among these trends, physiological metrics have expanded attention for its assessment of lie status of person under test that are independent of other conditions. EEG signals are reliable biomarker for lie detection [14–16]. It is noteworthy saying that most of the results were obtained for individual subject-lie detection test, due to evidences of lie is always person-reliant on with large variances in developmental and EEG signals [17–21], with same distribution assumption of same feature set [22–24]. The physiological nature of the signals may enlarge the differences among tested subjects [25]. Another approach to enhance the reliability of lie detection models towards a lie detection expert system is to apply personal identification, which might simplify the cross subject lie detection to within-subject detection. EEG signals have reliable long-term investigation for lie detection [25–27]. An efficient platform for robust lie detection test from EEG signals would can be achieved. However, there is no such study for the feasibility of EEG-based deep learning model to achieve robust time efficient lie detection test. This goal has been the main motivation for this research. We aim to develop new method for deep learning based lie detection model. Deep learning attention (DL-Attention) models are used extensively in pattern recognition [28], handwritten recognition [29–31]. DL Attention is utilized for grid-like input topology. i.e., the input data are correlated such as 2-dimensional data in images. Therefore, DL Attention has been used in many applications such as cancer diagnosis [31], signals differentiations and EEG classification [32,33]. Many recent studies used Attention models for lie detection and performed well [34]. These studies revealed new results for feasible and robust lie detection models. In this research, we utilized dataset of recorded EEG signals from multiple sensors with inherent correlation. Hence, DL Attention model was utilized to discriminate the subject lie state with brain activities. DL Attention employs computerized data mining from EEG datasets [26]. EEG is brain activities pointers where successive instants are highly correlated. Classical deep learning (DL) models do not have enough memory to process sequential data correlation, which can yield to signal loss. In this paper, we propose a platform that syndicates deep learning with the attention model. Such platform was used previously in natural language analysis for long-term memory computation [31]. The logic of our proposed model is that the is correlation existed in one channel signal implicates Lie state. We developed a practical lie detection system for robust usage. The proposed study presents a unified deep learning and Attention based model that could achieve lie prediction.
The rest of this paper is planned as follows. Section 2 depicts the methodology and the data description of the participants in the dataset, the data preprocessing and experiment design, the EEG signal acquisition. The lie state definition using objective behavior measures and the V-TAM Attention classification model. In Section 3, we introduce the experimental results. Section 4 entails discussion. The conclusion is depicted in Section 5.
The model is described in details; the model starts with a data preprocessing phase in Section 2.1. Section 2.3 will describe the V-TAM Attention model in details. The V-TAM model depicts the spatial and temporal attention model. Classification and validation process are then described.
2.1 Data Description and Preprocessing
EEG signals were recorded in the dataset utilizing the HD-72 Cognionics headset with 32 noninvasive devices on the person’s head utilizing 15–30 sensor system. The Cognionics 72 wireless EEG device with two sensors. The flex one is positioned over the head and the Drypad is located over the forehead.
The sensors described in the public dataset [28] are the horizontal mastoids. Electro-oculogyric (EOG signals) were logged from electrodes positioned above the both eyes. The resistance of the device was less than 24 kilo ohms (kΩ) in the recording session. The signals were measured at 240 hertz (Hz). The EEG were stored on the processor i5–3800U through Bluetooth antenna. The EEG signals were normalized into 1−56 Hz range utilizing a Fourier series transform. The filtered EEG signal are then averaged across all channels. The high correlation components in the EOG signals were also eradicated. Also, data with 6 decibels (db) frequencies are discarded. EEG preprocessing is done using EEG MatLAB toolbox [31]. Also lie feature will lessen the model performance, and can increase the model propensity for faulty detection [32]. Therefore, the objective measures for our model were computed to decide on the most rejected lie value. Precisely, the developmental enactment of the subjects in a 30-min window was recorded where the first 5-min with the lowest variation was reported as a vigilant state and the last 5-min as the most lied. Statistical study depicts that there is a p < 0.01 significant difference (Fig. 1). Hence, the final 5 min were assumed to define the maximum attentive lied states in our research.
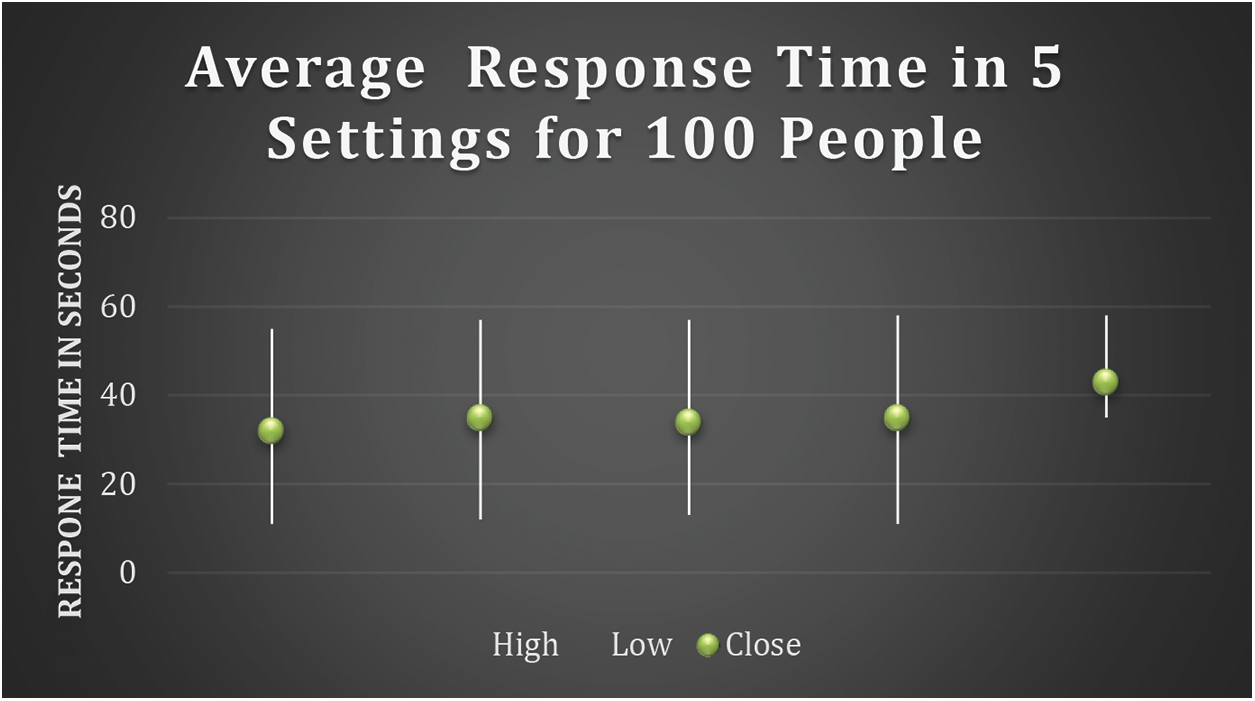
Figure 1: Average response time in 5 settings for 100 people
2.2 The Proposed V-TAM Attention Model
In this paper, we present a Deep Learning technique for lie prediction. EEG data signals are used as input for the lie detection in both spatial and temporal dimensions. EEG signal in the first and last 5 min were also labeled and contained for lie detection. Definitely, the input to the model is a 2-s interval of the EEG signal (annotated as a single label) with a dimension of 25 × 260 with no intersection. Therefore, there are 300 EEG labels for each subject for the lie detection test. A k-fold cross validation technique was used to validate the prediction performance with 80% of the input signals was used training and 20% for testing.
2.2.1 Spatial Attention Process
Previous methods typically choose EEG channels randomly assuming all channels have an equal role. Nevertheless, the dynamic brain areas for the same lie detection action are diverse for various people, which implies that the forte of the EEG signal differs from one person to another, as well as for various readings by the same person. This disparity will yield lower prediction accuracy. Thus, to choose the best EEG channel for computing the distinguishable feature map representations for different subjects and eradicate the mistakes caused by traditional selection methods of EEG channels. In this paper, we present a spatial attention neural module.
We define the parameters of the S squares (defined in Fig. 1) in Tab. 1. Let Z ∈ MH×W be the data of side length L of 25. We first utilize these square data into four convolutions (Con1 – Con4) to produce feature representation vectors V1 to V4, where they belong to MM×D×B and M = 8 denotes the number of feature maps. Then, Vi are reformed (Mi) to MD×(M×B) and M(M×B)×D, to permit multiplication of the two matrices. At the end, a Softmax classifier is employed to compute the temporal attention representation map vector

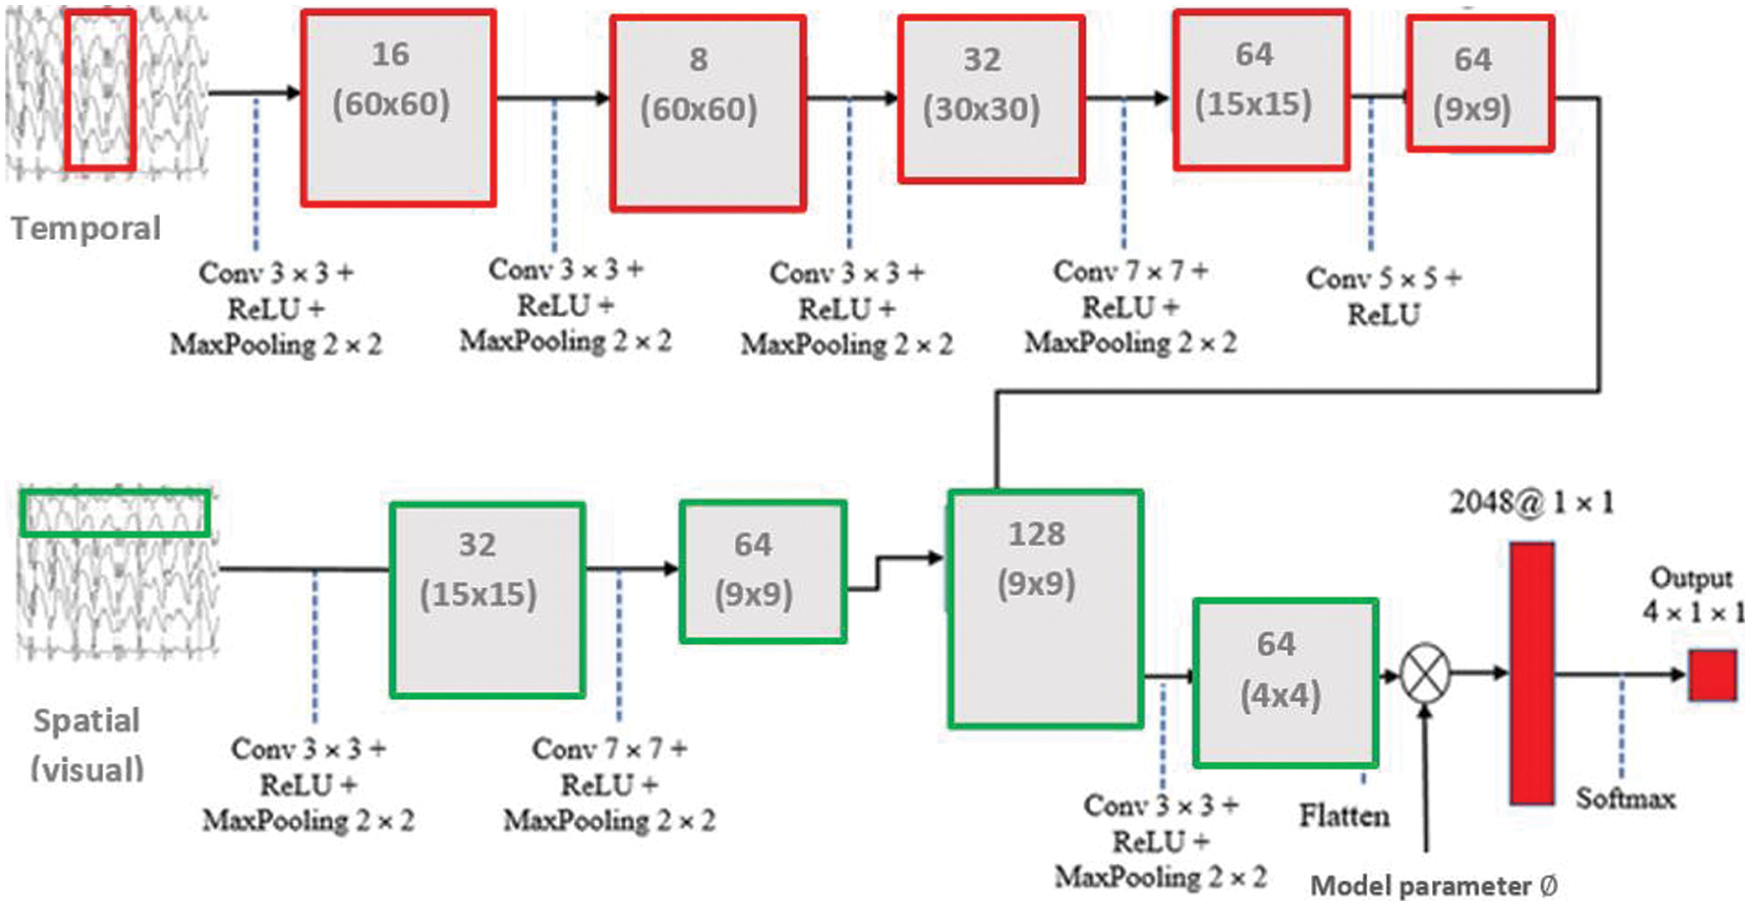
Figure 2: The proposed V-TAM attention model using EEG signals with spatial and temporal attention models
Dot operation between V and
2.2.2 Feature Extraction in Temporal Domain
We join all the temporal features into one map from the EEG continuous data. The second convolution layer of kernel stride of 1 × 32 is executed in the temporal dimension. Afterwards, the convolution output is forwarded to the classifier. The output is converted from (3, 32, 125) to (30, 22, 101). Also, the third convolution of stride (32 × 1) is employed to the feature map. The analogous output become (30,1,101). The max pooling with stride size of 1 × 64 and another pooling of 1 × 12 is employed to produce a grainier feature map vector. The output will be diminished to (30, 1, 49). At the end, the nonlinear score function is utilized before the max Pooling process and the log activation function is employed to the final output of the max Pooling. All feature representation are forwarded to the last convolution namely Con4, and its output has stride size of (3, 1, 1). The Softmax classifier is utilized to accomplish multi class of the four classes.
The proposed V-TAM Attention model consists of multiple convolutional (CL) and Maxpooling (ML) layers with double fully-connected (FL) and a single attention layer (AL) as depicted in Tab. 1. The convolutional layers have various sizes of kernels (fuzzy filters), which improves the signal features and lessens noise. Each CL can be defined as follows,
where,
where,
Softmax can resolve the multiple classification challenge and is utilized in our research to perform lie detection task. Depending on different input v, the probability p defines the prediction result.
The model hypothesis generates a vector (Not-Lie/Lie) for lie detection. The addition of the vector values is equal to one.
where,
where, r defines the model output and
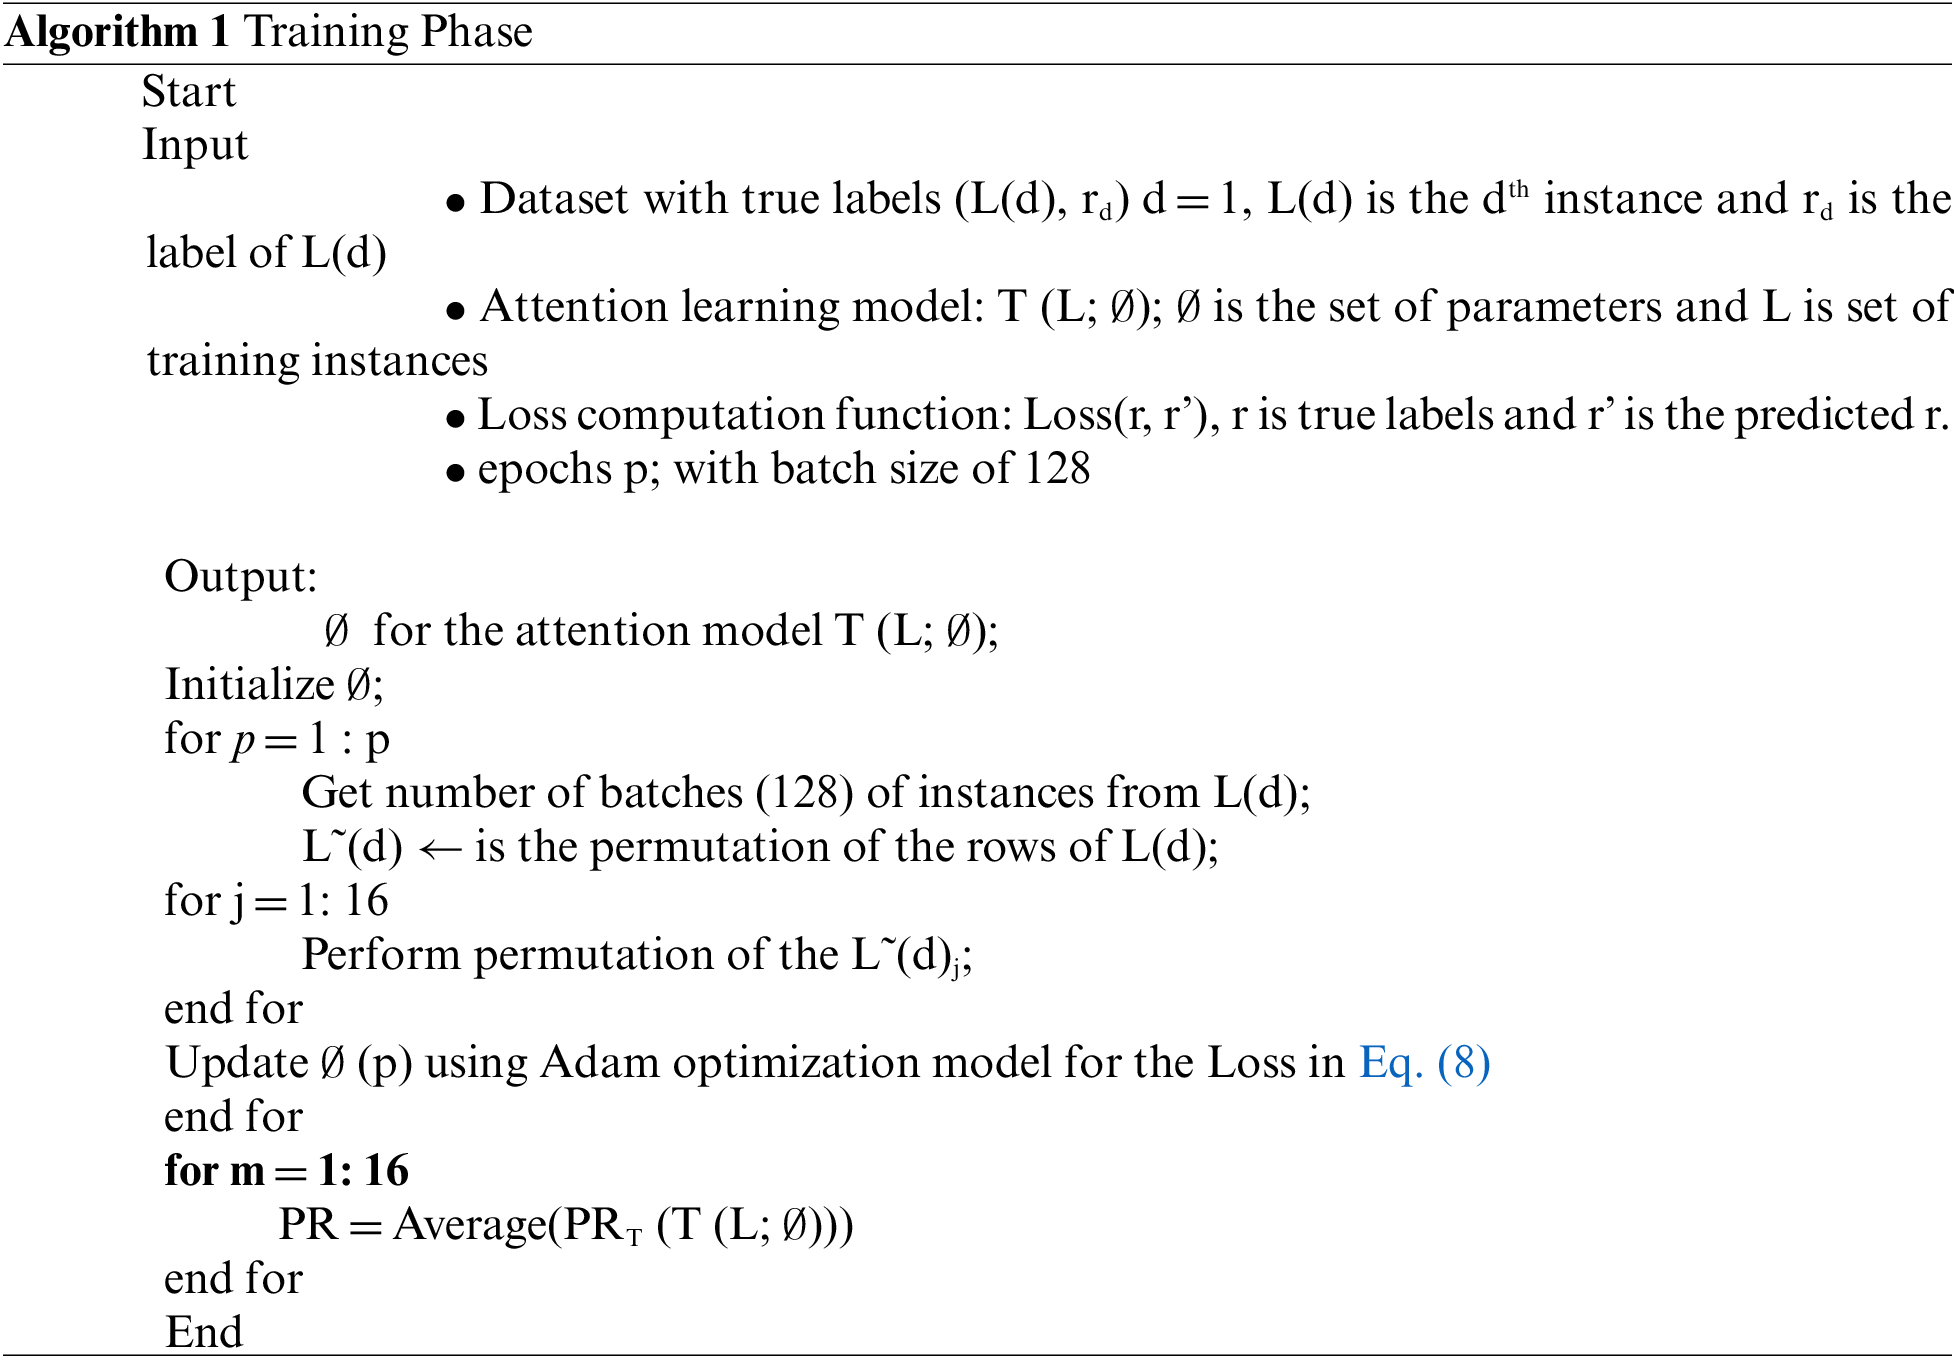
The training phase for the model is depicted in Algorithm 1. The precision of prediction (PR) is depicted as follows:
where, t has a value of 12 (12-fold validation), z denotes two states (Lie state detection).
1) Comparative Study with Different model: The performance of our model is compared using three models: CNN, D-LSTM, and Attention neural nets., We will describe these models briefly. CNN model utilizes the CNN configuration with no attention phase; deep long short term memory (D-LSTM) combines the deep learning model with the a long-term/short-term memory architecture (LSTM). The Attention neural model employ an attention layer.
2) Kernel Size: In the V-TAM model, we utilize CL with input of 22 × 240 dimension. Hence, an appropriate kernel size will pledge the feature extraction and reduce. To study the influence of kernel size, we perform exhaustive analysis multiple kernel sizes and discover the kernel size that yield the best accuracy.
3) Impact of the Input: To study the robustness of the introduced method, we employed two investigation studies to measure the impact of the inputs. Lie state prediction: A practicable lie predication model uses smaller size data. Hence, we use measures for the accuracy of lie prediction using subset of the input.
In the experiments, a public dataset was used for this research. The dataset involves EEG signal recorded during classical lie detection test with non-invasive multiple sensors. The dataset includes 931 male and female subjects of ages 43.13 ± 10.68 years [28]. Each subject has no history of mental illness.
To efficiently represent the lie state of the involved subjects, we design our research experiment so that we can use the dataset efficiently. To reduce the experiment complexity, we only study the temporal factors for each subject related signal rather than subjective factors such as the attitude of the subjects [33]. Specifically, simulated lie detection EEG signal recording experiment was reported, which embraces a simulated sensor system (Logitech L24 lie detector simulator). Based on previous lie detection studies, the duration of the setting is 30 min for salient effect [30–32]. As described in the public dataset in [26], a safe sole setting was used. The dataset recorded the EEG signals for the subject who randomly received various personal questions with known answers, produced with random intervals. The latency between the question and the response made by the subject was defined as the response time (RT). The response time variation of the subject was reported for the prediction of the lie state. Given the association between heart rhythm and mental tiredness [31], all data were recorded between 10–12 am to eliminate this potential factor.
We performed the lie detection process utilizing the EEG signals with the V-TAM Attention model and compared the prediction rate with the DL-Attention model [21] and D-LSTM model [24]. Statistically, the compared models display significant variances in the performance (F3,132 = 123.7, p < 0.002), the proposed V-TAM system yields the highest accuracy in lie prediction as depicted in Fig. 3. The next best prediction was attained from the D-LSTM technique. More study of the lie prediction model accuracy at subject level, was depicted on 930 recorded subject’s EEG in the dataset. An accuracy as low as 97% was displayed. We also computed the computational time cost of the compared models with the proposed V-TAM Attention model utilizes a low 0.19 s to finish the prediction at each epoch.
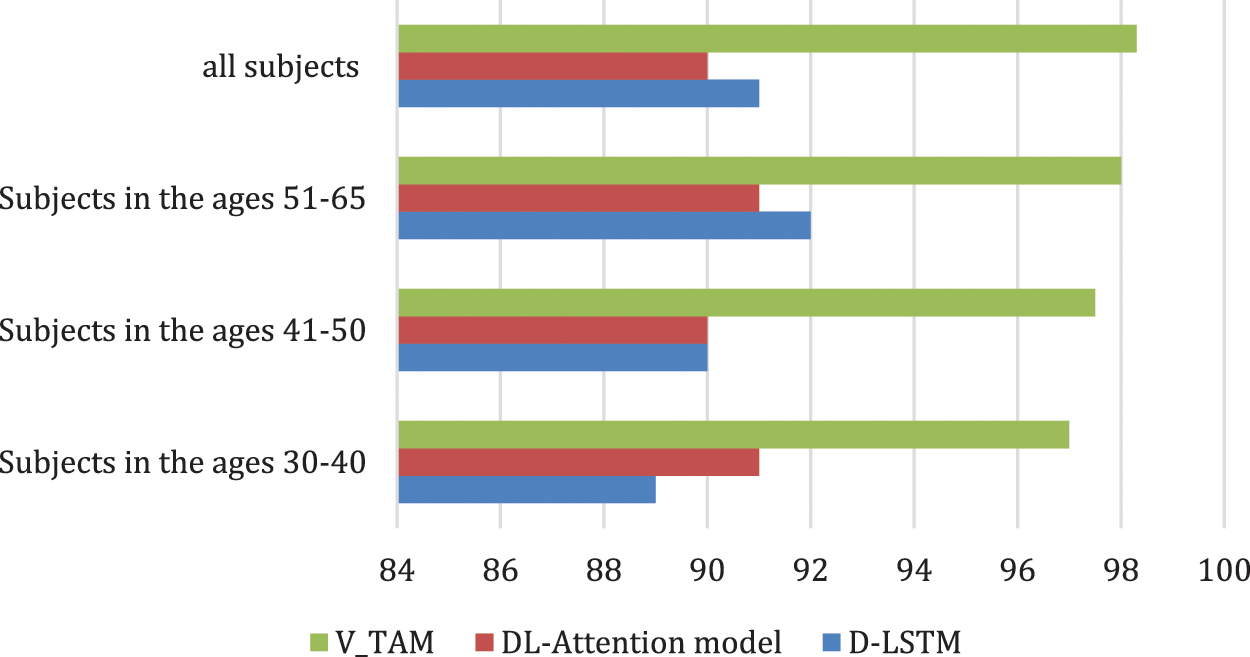
Figure 3: Prediction rate
In the proposed model, three layers were utilized to balance the accuracy with the model training time. We investigated the effect of various kernel sizes on the computational time complexity for binary classification of lie state detection. We establish that the model performance is satisfactory for various kernel sizes with the highest performance of 98.5%. this performance was attained utilizing 3 × 5 × 5 kernel size. A lower performance of 94% was attained for kernel of 2 × 7 × 3. We also investigated the prediction at subject level and we attain the lowest accuracy among various kernel sizes for the V-TAM vs. the other two models (Fig. 4). The best performance was attained with a kernel of 2 × 7 × 4, with the lowest variance.
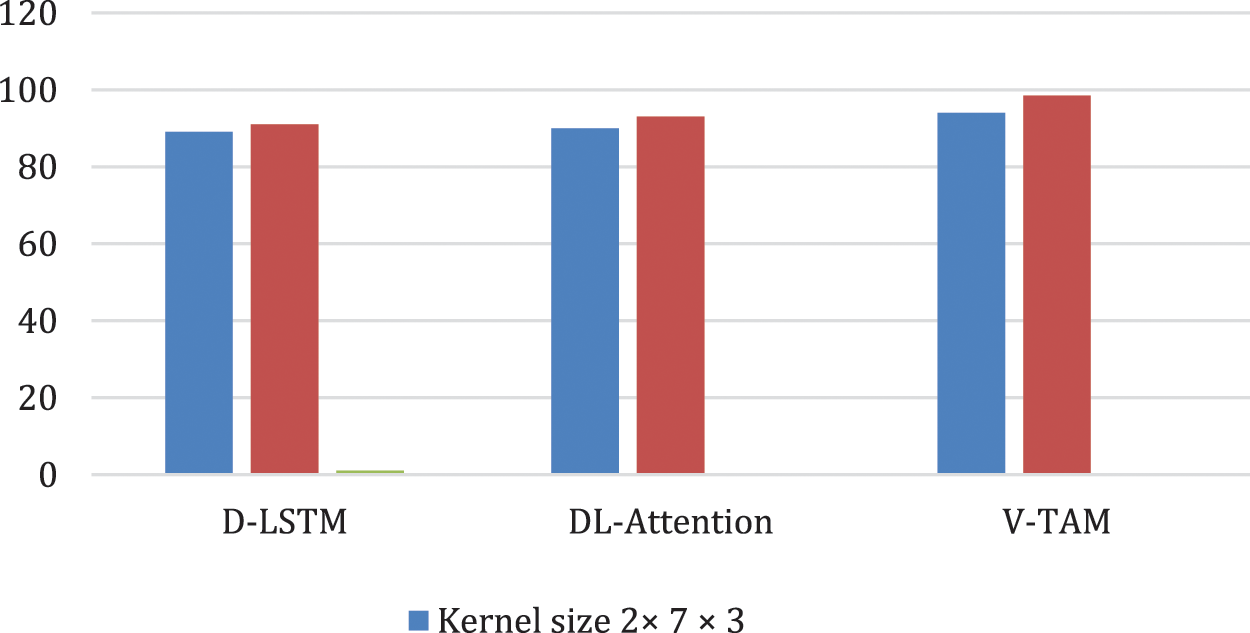
Figure 4: Kernel size
To evaluate the robustness of the V-TAM system, we completed experiments to display the model stability with various sized inputs which is depicted in Fig. 5 using Pearson coronation. We discovered the highest stable accuracy for EEG in the Lie state (average accuracy = 98.4% vs. 97.2% utilizing vigilant data). However, utilizing diversified data (data from Not-Lie and Lie states). We evaluated the computational time cost with three various sets of inputs with reasonably efficient prediction with only partial the computational time when diversified data was utilized.
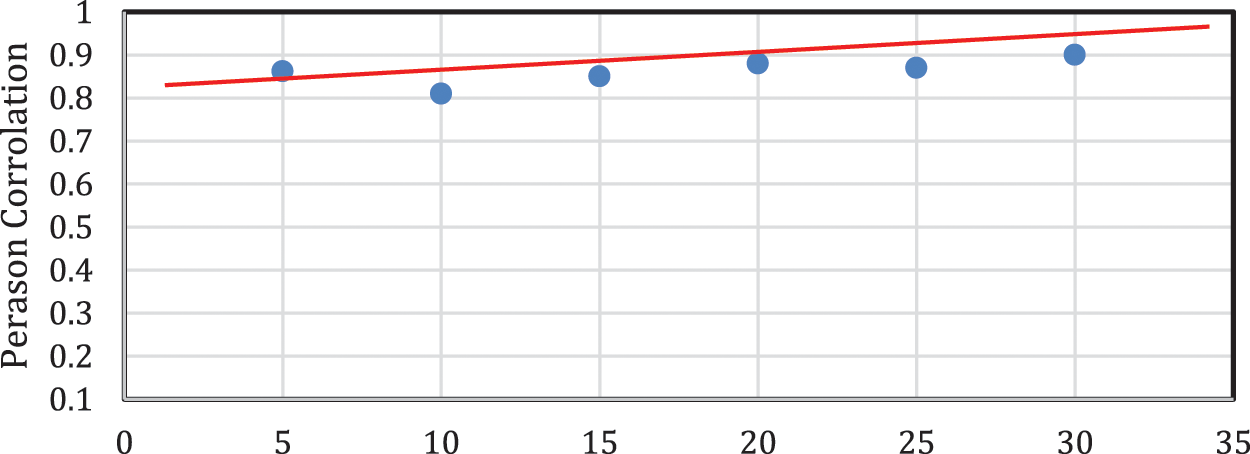
Figure 5: Pearson correlation between actual lie test (with known truth) and predicted output from our model for different input questions
We also measured the feasibility of the proposed model structure with input data form less channels. Precisely, four subsets of the EEG data were used (Fig. 6). As estimated, the performance of the lie detection model was less than when utilizing brain signals from more than one channel. Precisely, the best prediction is attained from the frontal and side channels. Our model performance for lie detection show comparable the highest accuracy across the four EEG channels with the highest performance attained from the frontal (Accuracy Frontal = 94.5%), data from frontal area yield a balanced performance.
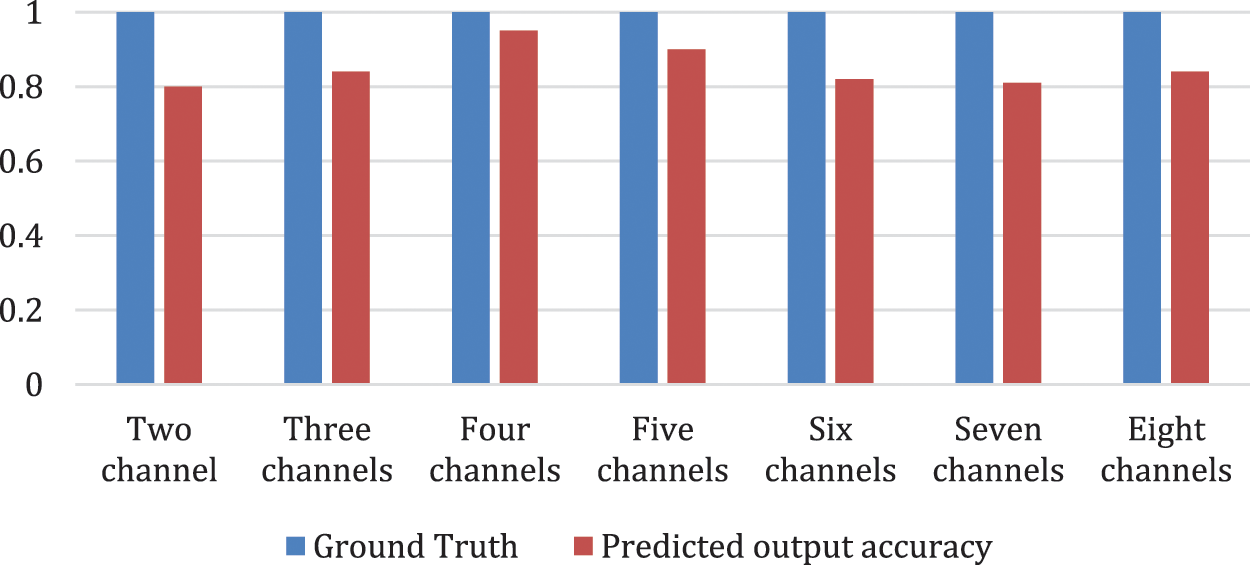
Figure 6: Average accuracy of actual lie test (with known truth) and predicted output from our model for different channels
3.5 Prediction Computational Time
We compared our model with other lie detection models namely DL-Attention model [21] and D-LSTM model [24]. We utilized the classification CPU time as depicted in Fig. 7 As depicted our V-TAM model has the lowest CPU time for classification vs. the other models when the questions exceed 10 question. Below 10 questions all models are comparable. We also compared the time cost that our model needed in training vs. other models as depicted in Fig. 8.
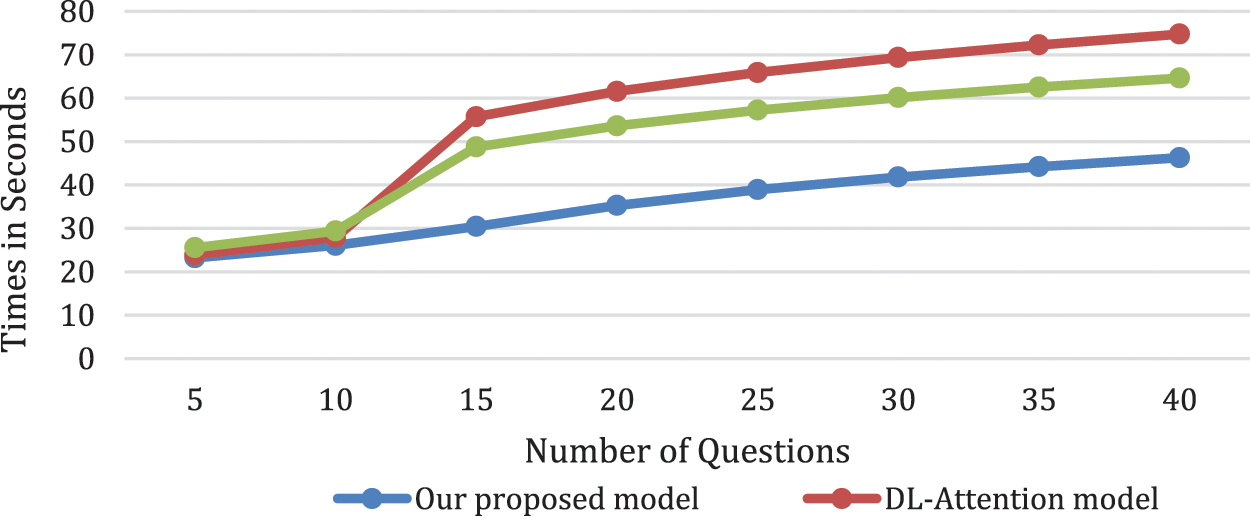
Figure 7: Mean time cost for prediction for our model vs. the state of the art model
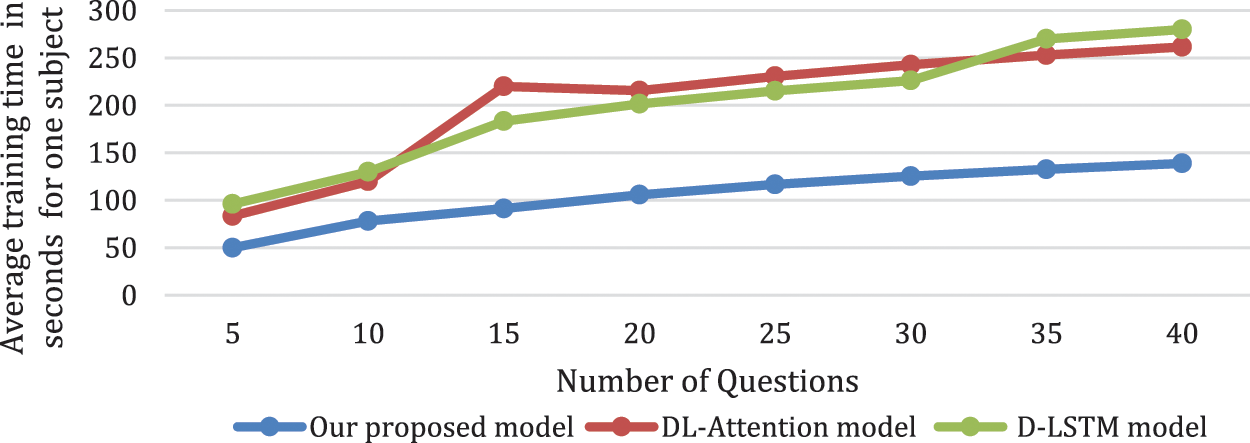
Figure 8: The cost of training time for different models using different number of questions in the Lie test
The ablation results are employed to investigate both temporal and spatial attention model. To study the impact of temporal attention alone, and the spatial attention alone in the CNN, we performed ablation experiment as depicted in Tab. 2.

In the proposed study, we tested the feasibility of our model using subsets of the signal data and verified an adequate performance through utilizing EEG signals from frontal and side areas. The prominence of our efficient lie detection model is evident, and our platform moves forward for a practical correct system for lie detection.
EEG signals for brain learning, have been attracting significant interests matching recent deep learning advances. Here, we have proved the feasibility of employing EEG signals for lie detection. Compared with classical measures where static patterns are used. EEG signals has the unique advantages of resistance to deceiving attacks and the disability to be used under coercion EEG-based Lie Detection models.
EEG-based Lie detection has a resurgence of attention recently, taking advantage with recent improvements in deep learning research [24] in public databases and attained high prediction accuracy. To validate the high performance of our proposed model in lie detection, we compared our model performance vs. other state of the art models utilized in Tab. 3 on the EGG data as depicted in Fig. 8. The validation of the correctness of the input data was investigative in nature to validate the model reliability. Therefore, we did not utilize exhaustive permutations of the EEG channels. We also optimize electrode choice in advance of studying the electrodes utilized in the system modeling and might result in higher opportunity to lessen the time complexity and require additional investigation [24,31].
4.2 Impact of Network Structure
We established that the performance of deep learning with attention model or DNN model with recurrent structure (such as D-LSTM in this work) is higher than that Deep learning alone. These cascaded model perform according to the neural model nature, where the previous layers perform as feature extraction phase for the next layers [30]. Heuristically, deep learning models has proven to be superior in learning visual features [32]. Indeed, the main element of such models is the convolution process using smaller size kernels (such as 3 × 5 × 5 in this research) that are able of learning local features or patterns. These features can then be joined to construct complex features when loading up multiple convolution layers (3 layers in our model). The pooling (PL) is then utilized to sub-sample the of the CL output using a different scale. The attention model is superior in handling temporal sequence [32,33], which is a main specification of the EEG signals. The discriminating processing of the attention model may supplement the deep learning model and results in high prediction performance in our research. However, the proposed V-TAM Attention model outperform the D-LSTM in time efficiency, where the computational cost of the V-TAM Attention is considerably less than the D-LSTM model. Our results demonstrate the advantage of the cascaded model combining both visual and temporal features and emphasize the efficacy of the EEG signals in terms of visual-temporal features for EEG-based prediction studies.
4.3 The Merits of This Research and Its Applications
In comparison to the state of the art research of Lie detection, results of the current research are of significant for the following reasons. First, high prediction performance is accompanied with an easy to be implemented Lie detection model and long-term easy wearing sensors. Through employing wearable non-invasive EEG sensors, our research advances forward to realize a real time construction of a Lie detection model that does not require well-trained expertise to set a gel-based classical EEG stratagem and enhance the comforts [34]. Mostly, considering the reasonable performance for Lie detection utilizing only a small portion of the EEG data, the proposed model demonstrates its ability for in-field testing. However, the considerable individual variations in mental lie [25,26] would considerably impact the performance of lie detection. We then theorize that the high prediction performance of Lie states would be benefit from the attention model. In addition to intelligent criminology model, the lie detection apparatus would be of great importance to enhance the safety or real life world, if such computerized portable device can be applied.
Some concerns should be deliberated when interpreting our results. First, a within-subject scheme was employed in our work for Lie detection. Accumulating indications have proven obvious individual variations in Lie-related brain EEG activities [24–26]. However, subject-independent Lie detection model requires strong efforts to build cross-subject Lie detection models [28,31]. We have done extra analyses in the subject-independent model through employing leave subjects out in the cross-validation of our model. As anticipated, the prediction performance is considerably reduced, yielding an average Lie detection precision of 70% (data not included). One probable cause is that the preprocessed EEG data were fixed as input for the prediction. More advances in feature selection [32,34] and deep learning techniques such as transfer learning and adaptive training techniques can enhance the generalizability of the Lie detection model across subjects. Second, the EEG signals offers rich-content information on cognitive and mental states (such as trust, belief, … , etc.), compared to peripheral measures [19,27]. Here, using a simulated setting as our main experimental procedure, we established the feasibility of a deep learning lie detection system. In our future work, we will develop a simulated setting where subjects will be going under autonomous setting and under various flops. In a pioneer work, the authors in [30] tested the feasibility of observing mental workload and Lie-states during loud simulator. Recently, researchers, proposed a transfer learning platform to detect multiple states (i.e., Lie, Not-Lie, stressed or awareness) [28]. Promising future work may include developing expert systems for comprehensively detecting lie status to further formalize the rules by accommodating new knowledge.
In this paper, we proposed an analysis platform founded on V-TAM Attention model that is capable of perform lie detection task using portions of EEG data with high precision (an average of 98.5%). In comparison with state of the art models, our proposed system generates a balance between the prediction accuracy and the time complexity. Consequent validation studies on the impact of the size of the kernel and the input data demonstrated the reliability of our platform. Also, our results marked that devised model has multi-task classification ability with brain signals for intelligent applications of criminology expert system. A dataset of 9512 subjects during fifteen minutes lie detection task was used. We compared our model with three recent published models (DL, DL-LSTM, and Attention). Our proposed model attained the highest performance of (98.5%) with (p < 0.01). With future testing on larger independent samples and remote EEG acquisition devices, our model has a promising opportunity for real-world lie detection task remotely.
Acknowledgement: We would like to thank for funding our project: Princess Nourah bint Abdulrahman University Researchers Supporting Project Number (PNURSP2022R113), Princess Nourah bint Abdulrahman University, Riyadh, Saudi Arabia.
Funding Statement: This research was funded by Princess Nourah bint Abdulrahman University Researchers Supporting Project Number (PNURSP2022R113), Princess Nourah bint Abdulrahman University, Riyadh, Saudi Arabia.
Conflicts of Interest: The authors declare that they have no conflicts of interest to report regarding the present study.
References
1. S. Barsever and E. Neftci, “Building a better lie detector with BERT: The difference between truth and lies,” in Proc. Int. Joint Conf. Neural Network (IJCNN), Paris, France, pp. 1–7, 2020. [Google Scholar]
2. R. H. Nugroho, M. Nasrun and C. Setianingsih, “Lie detector with pupil dilation and eye blinks using hough transform and frame difference method with fuzzy logic,” in Proc. Int. Conf. Control Electron. Renew. Cairo, Egypt, pp. 40–45, 2017. [Google Scholar]
3. S. Ahmet, B. Hafez and M. Soric, “Deep learning model to detect suspects’ lies,” Journal of Applied Informatics, vol. 9, no. 1, pp. 137, 2021. [Google Scholar]
4. A. Hafez, M. Zamil, and M. Camil, “Lie detection of young age subjects,” in Proc. of the Int. Conf. on Multimodal Deep Learning, Paris, France, pp. 129–135, 2021. [Google Scholar]
5. W. Wang, X. Huang, J. Li, P. Zhang and X. Wang, “Detecting COVID-19 patients in X-ray images based on MAI-nets,” International Journal of Computational Intelligence Systems, vol. 14, no. 1, pp. 1607–1616, 2021. [Google Scholar]
6. Y. Gui and G. Zeng, “Joint learning of visual and spatial features for edit propagation from a single image,” The Visual Computer, vol. 36, no. 3, pp. 469–482, 2020. [Google Scholar]
7. W. Wang, Y. T. Li, T. Zou, X. Wang, J. Y. You et al., “A novel image classification approach via dense-MobileNet models,” Mobile Information Systems, vol. 2, no. 3, pp. 126–132, 2020. https://doi.org/10.1155/2020/7602384. [Google Scholar]
8. F. Li, C. Ou, Y. Gui and L. Xiang, “Instant edit propagation on images based on bilateral grid,” Computers Materials & Continua, vol. 61, no. 2, pp. 643–656, 2019. [Google Scholar]
9. D. Tsechpenakis, M. A. Kruse, J. K. Burgoon and M. L. Jensen, “HMM-Based deception recognition from visual cues,” in Proc. IEEE Int. Conf. Multimedia Expo, Lafayette, USA, pp. 824–827, 2005. [Google Scholar]
10. M. Graciarena, E. Shriberg, A. Stolcke, F. Enos, J. Hirschberg et al., “Combining prosodic lexical and cepstral systems for deceptive speech detection,” in Proc. IEEE Int. Conf. of Acoustics and Speed Signal Process, Alexandria, Egypt, pp. 1033–1036, 2006. [Google Scholar]
11. M. Sanaullah and M. H. Chowdhury, “Neural network based classification of stressed speech using nonlinear spectral and cepstral features,” in Proc. IEEE 12th Int. New Circuits Syst. Conf. (NEWCAS), Cairo, Egypt, pp. 33–36, 2014. [Google Scholar]
12. Y. Zhou, H. Zhao, X. Pan and L. Shang, “Deception detecting from speech signal using relevance vector machine and non-linear dynamics features,” Neurocomputing, vol. 151, pp. 1042–1052, 2015. [Google Scholar]
13. Y. Xie, R. Liang, H. Tao, Y. Zhu and L. Zhao, “Convolutional bidirectional long short-term memory for deception detection with acoustic features,” IEEE Access, vol. 6, pp. 76527–76534, 2018. [Google Scholar]
14. R. C. Cosetl and J. M. D. B. Lopez, “Voice stress detection: A method for stress analysis detecting fluctuations on lippold microtremor spectrum using FFT,” in Proc. 21st Int. Conf. Electronics and Commun. Venice, Italy, pp. 184–189, 2021. [Google Scholar]
15. K. Kumar, C. Kim and R. M. Stern, “Delta-spectral cepstral coefficients for robust speech recognition,” in Proc. IEEE Int. Conf. on Acoustics and Speech Signal Processing (ICASSP), Benin, China, pp. 4784–4787, 2011. [Google Scholar]
16. J. Li, H. Chen, T. Zhou and X. Li, “Tailings pond risk prediction using long short-term memory networks,” IEEE Access, vol. 7, pp. 182527–182537, 2019. [Google Scholar]
17. S. H. Rafi, N. A. Masood, S. R. Deeba and E. Hossain, “A Short-term load forecasting method using integrated CNN and LSTM network,” IEEE Access, vol. 9, pp. 32436–32448, 2021. [Google Scholar]
18. Y. Zhou, L. Zhang, Q. Yang, K. Liu and Y. Du, “Short-term photovoltaic power forecasting based on long short term memory neural network and attention mechanism,” IEEE Access, vol. 7, pp. 78063–78074, 2019. [Google Scholar]
19. S. Hochreiter and J. Schmidhuber, “Long short-term memory,” Neural Computing vol. 9, no. 8, pp. 1735–1780, 1997. [Google Scholar]
20. T. Painter and A. Spanias, “Perceptual coding of digital audio,” in Proc. IEEE, Paris, France, vol. 88, no. 4, pp. 451–513, 2000. [Google Scholar]
21. Y. Zhang, B. Zhang and Z. Wu, “Multi-model modeling of CFB boiler bed temperature system based on principal component analysis,” IEEE Access, vol. 8, pp. 389–399, 2020. [Google Scholar]
22. J. S. Park, J. S. Yoon, Y. H. Seo and G. J. Jang, “Spectral based voice activity detection for real-time voice interface”, J. Theor. Appl. Inf. Technol., vol. 95, no. 17, pp. 4305–4312, 2017. [Google Scholar]
23. Variani, X. Lei, E. McDermott, I. L. Moreno and J. Gonzalez-Dominguez, “Deep neural networks for small footprint text-dependent speaker verification,” in Proc. IEEE Int. Conf. Acoust. Speech Signal Process. (ICASSP), Washington, USA, pp. 4052–4056, 2014. [Google Scholar]
24. H. Lee, P. Pham, Y. Largman and A. Y. Ng, “Unsupervised feature learning for audio classification using convolutional deep belief networks,” in Proc. 22nd Adv. Neural Inf. Process. Syst. (NIPS), London, England, pp. 1096–1104, 2009. [Google Scholar]
25. Z. Yang, J. Lei, K. Fan and Y. Lai, “Keyword extraction by entropy difference between the intrinsic and extrinsic mode,” Physical State Mechanical Applications, vol. 392, no. 19, pp. 4523–4531, 2013. [Google Scholar]
26. Y. Xu, J. Du, L. -R. Dai and C. -H. Lee, “An experimental study on speech enhancement based on deep neural networks,” IEEE Signal Process. Lett., vol. 21, no. 1, pp. 65–68, 2014. [Google Scholar]
27. L. Hinton, D. Deng, G. Dahl, A. -R. Mohamedand and N. Jaitly, “Deep neural networks for acoustic modeling in speech recognition: The shared views of four research groups,” IEEE Signal Process. Mag, vol. 29, no. 6, pp. 82–97, 2012. [Google Scholar]
28. Z. Labibah, M. Nasrun and C. Setianingsih, “Lie detector with the analysis of the change of diameter pupil and the eye movement use method Gabor wavelet transform and decision tree,” in Proc. IEEE Int. Conf. Internet Things Intell. Syst. (IOTAIS), Cairo, Egypt, pp. 214–220, 2018. [Google Scholar]
29. C. Fan, H. Zhao, X. Chen, X. Fan and S. Chen, “Distinguishing deception from non-deception in Chinese speech,” in Proc. 6th Int. Conf. Intell. Control Inf. Process. (ICICIP), Paris, France, pp. 268–273, 2015. [Google Scholar]
30. B. A. Rajoub and R. Zwiggelaar, “Thermal facial analysis for deception detection,” IEEE Trans. Inf. Forensics Security, vol. 9, no. 6, pp. 1015–1023, 2014. [Google Scholar]
31. K. Gopalan and S. Wenndt, “Speech analysis using modulation-based features for detecting deception,” in Proc. 15th Int. Conf. Digit. Signal Process., New Delhi, India, pp. 619–622, 2007. [Google Scholar]
32. G. Roopa and T. Asha, “A linear model based on principal component analysis for disease prediction,” IEEE Access, vol. 7, pp. 105314–105318, 2019. [Google Scholar]
33. S. V. Fernandes and M. S. Ullah, “Phychoacoustic masking of delta and time-difference cepstrum features for deception detection,” in Proc. 11th IEEE Annu. Ubiquitous Comput. Electron. Mobile Commun. Conf. (UEMCON), Cleveland, USA, pp. 213–217, 2020. [Google Scholar]
34. W. Wang, Y. Jiang, Y. Luo, J. Li, X. Wanget et al., “An advanced deep residual dense network (DRDN) approach for image super-resolution,” International Journal of Computational Intelligence Systems, vol. 12, no. 2, pp. 1592–1601, 2019. [Google Scholar]
 | This work is licensed under a Creative Commons Attribution 4.0 International License, which permits unrestricted use, distribution, and reproduction in any medium, provided the original work is properly cited. |