DOI:10.32604/cmc.2022.031109

| Computers, Materials & Continua DOI:10.32604/cmc.2022.031109 |  |
| Article |
Ensemble of Handcrafted and Deep Learning Model for Histopathological Image Classification
1Department of Computer Science Engineering, Vignan’s Nirula Institute of Technology and Science for Women, Guntur, 522005, India
2Department of Computer Science Engineering, Gayatri Vidya Parishad College of Engineering for Women, Visakhapatnam, 530048, India
3Department of Computer Science and Engineering, Ajay Binay Institute of Technology Cuttack, Odisha, 750314, India
4Department of Computer Science and Engineering, Vignan’s Institute of Information Technology, Visakhapatnam, 530049, India
5Energy Department, Technical College of Engineering, Duhok Polytechnic University, Duhok, Iraq
6Computer Technology Engineering, College of Engineering Technology, Al-Kitab University, Iraq
7Computer Technical Engineering Department, College of Technical Engineering, The Islamic University, Najaf, 54001, Iraq
8College of Technical Engineering, The Islamic University, Najaf, Iraq
*Corresponding Author: Ahmed Alkhayyat. Email: ahmedalkhayyat85@iunajaf.edu.iq
Received: 10 April 2022; Accepted: 12 May 2022
Abstract: Histopathology is the investigation of tissues to identify the symptom of abnormality. The histopathological procedure comprises gathering samples of cells/tissues, setting them on the microscopic slides, and staining them. The investigation of the histopathological image is a problematic and laborious process that necessitates the expert’s knowledge. At the same time, deep learning (DL) techniques are able to derive features, extract data, and learn advanced abstract data representation. With this view, this paper presents an ensemble of handcrafted with deep learning enabled histopathological image classification (EHCDL-HIC) model. The proposed EHCDL-HIC technique initially performs Weiner filtering based noise removal technique. Once the images get smoothened, an ensemble of deep features and local binary pattern (LBP) features are extracted. For the classification process, the bidirectional gated recurrent unit (BGRU) model can be employed. At the final stage, the bacterial foraging optimization (BFO) algorithm is utilized for optimal hyperparameter tuning process which leads to improved classification performance, shows the novelty of the work. For validating the enhanced execution of the proposed EHCDL-HIC method, a set of simulations is performed. The experimentation outcomes highlighted the betterment of the EHCDL-HIC approach over the existing techniques with maximum accuracy of 94.78%. Therefore, the EHCDL-HIC model can be applied as an effective approach for histopathological image classification.
Keywords: Histopathological image classification; machine learning; deep learning; handcrafted features; bacterial foraging optimization
Cancers have turned out to be one of the leading public health problems. Histopathological images (HI) of cancer tissue samples are regularly checked by pathologists for cancer type prognosis and identification [1]. Haematoxylin-Eosin (H&E) stained slides were utilized by pathologists for over a century [2]. With the emergence of digital pathology, HIs is exists for automatic analysis at scale. Hence, the interpretation of the HIs is time taking and hard which demands the professional’s knowledge [3]. In addition to this, the results of interpretation could be influenced by the level of experience of the pathologists engaged. Thus, computer-aided interpretation of HIs acts an important role in the detection of breast cancer (BC) and its prognosis [4].
But the process which involves advancing tools for executing this analysis is hindered by subsequent challenges. Firstly, HIs of BC are fine-grained, high-resolution images that show complicated textures and rich geometric architecture. The differences observed within a class and the constancy amongst classes could make classification highly complex, particularly while addressing various classes [5]. Secondly, the problem is the restriction of feature abstraction techniques for HIs of BC. Conventional feature abstraction techniques, namely Gray-level co-occurrence matrix (GLCM) and scale-invariant feature transform (SIFT) all depend on supervised information. Moreover, previous knowledge regarding data requires for selecting helpful features that make, the computational load very heavy and feature extraction proficiency extremely low. Finally, the final abstracted features are only unrepresentative and few lower-level features of HIs. Subsequently, this may result in final model generating inferior classification outcomes [6].
Deep learning (DL) methods are capable of extracting features automatically, learning advanced abstract representations of data, and restoring information from data automatically [7]. It can easily solve the issues of conventional feature extraction and it was implied in biomedical science, computer vision, and many other domains in a successful manner. The latest years bring specifically intense advancements of DL related methods for image classification. Specifically, Convolutional Neural Networks (CNNs) have acted as a backbone for various breakthroughs in computer vision wholly [8], particularly in image classification. In general, medical imaging, and especially HI classification (HIC), considers the significant applications of such approaches. Various machine learning (ML) methodologies exceed the performances of whole-slide segmentation and tissue type classification, validating there exists a lot of information regarding the patients encoded in HIs than instantly visible by eye [9,10].
Hameed et al. [11] proposed an ensemble DL method for the certain categorization of carcinoma and non-carcinoma BC histopathology images using gathered information. Then, trained four distinct methods depends on pre-trained visual geometry group (VGG)-16 and VGG19 structures. At first, we developed fivefold cross validation processes on every single method, such as fine-tuned VGG16, fully trained VGG16, fine-tuned VGG19, and fully trained VGG19 architectures. Next, developed an ensemble model by taking the average of predicting possibility of the carcinoma class. Kumar et al. [12] presented an architecture based VGGNet-16 and assessed the efficiency of the fused architecture along with distinct classifications on the human BC data set (BreakHis) and CMT data set (CMTHis).
Vang et al. [13] developed a DL architecture for multiple class BC image categorization. After which the patch level prediction is passed by an ensemble fusion architecture including logistic regression (LR), majority voting, and gradient boosting machine (GBM) to attain the image level prediction. Gour et al. [14] proposed an automatic technology for the diagnoses of tumors via HI. In the developed model, we designed a residual learning-based 152-layered CNN called as ResHist for breast tumor HIC. ResHist architecture learns discriminative and rich features from the HIC into malignant and benign.
Peng et al. [15] designed a multi-task DL architecture for histopathology image retrieval and classification simultaneously, which leverages the classical approach of K-nearest neighbor (KNN) to enhance model interpretability. For testing image, we retrieved a similar image from the training database. The retrieved nearest neighbour method is utilized for classifying the testing image with a confidence score and presents a human interpretable description of the categorization. In [16], a DL and transfer learning (TL)-based technique is presented for classifying HI for BC diagnoses. In our work, we have adapted patch selection method for classifying breast HI on smaller amounts of training images by TL method without losing the performance. Also, feature extracted from Efficient-Net model is utilized for training and support vector machine (SVM) classification.
This paper presents an ensemble of handcrafted with deep learning enabled histopathological image classification (EHCDL-HIC) model. The proposed EHCDL-HIC technique initially performs Weiner filtering (WF) based noise removal technique. Once the images get smoothened, an ensemble of deep features and LBP features are extracted. For classification process, bidirectional gated recurrent unit (BGRU) model can be employed. At the final stage, bacterial foraging optimization (BFO) algorithm is utilized for optimal hyperparameter tuning process which leads to improved classification execution. For validating the enhanced performance of the proposed EHCDL-HIC technique, a set of simulations is performed.
In this work, a new EHCDL-HIC method was developed for effective classification of HIs. The proposed EHCDL-HIC method initially performs WF based noise removal technique. Once the images get smoothened, an ensemble of deep features and SURF features are extracted. Then, the BGRU model can be employed for the identification and classification of HIs. Finally, the BFO algorithm has been utilized for optimal hyperparameter tuning process which results in improved classification performance. Fig. 1 depicts the block diagram of EHCDL-HIC technique.
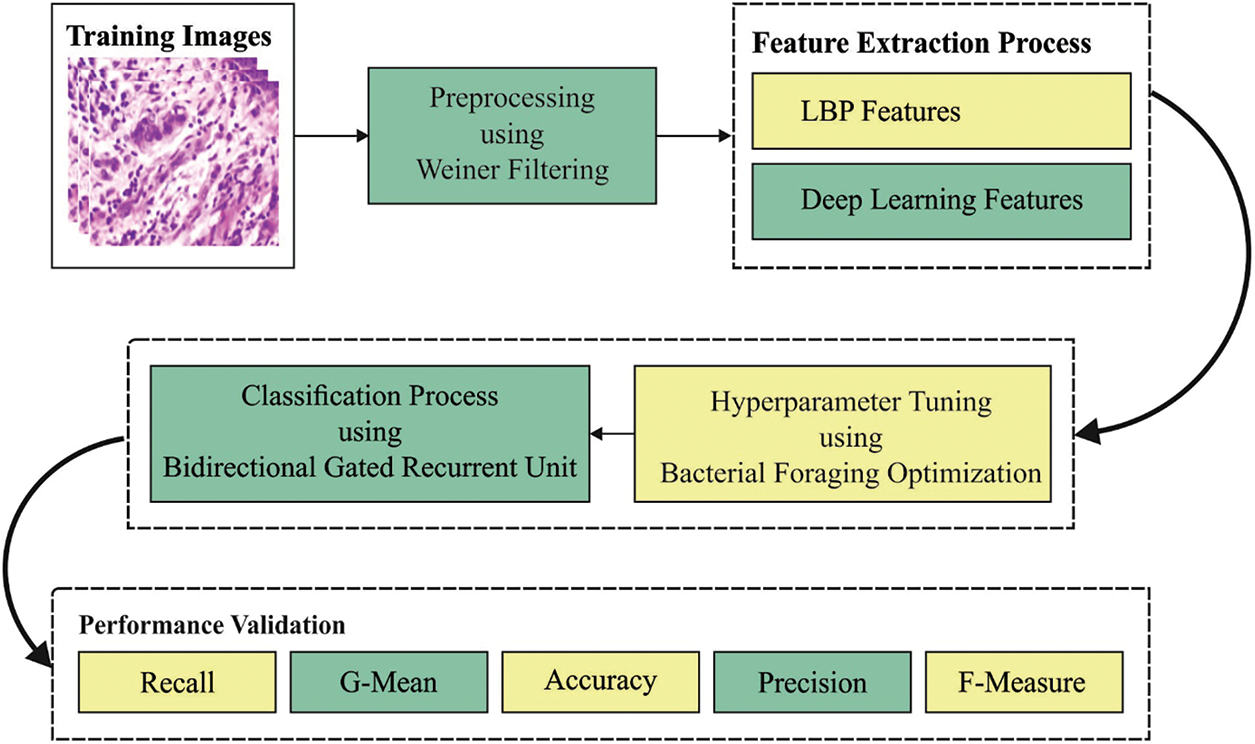
Figure 1: Block diagram of EHCDL-HIC technique
2.1 Ensemble of Feature Extraction
At this stage, an ensemble of handcrafted and deep features is extracted to accomplish effective classification purposes. Initially, the LBP model is employed to generate features. A new kind of feature depiction is shading-based LBP operator that abuses texture and shading discriminative characteristics. This feature comprises of binary pattern that depicts the surrounding pixel in the region. The obtained feature from the locations is interconnected with a solitary feature histogram that frames an image representation. By evaluating the similarities among the pixel and the histogram of images, value differs bit by bit alongside this line and a bigger window estimation is well trained for making the architecture productive.
Now,
Then, the CapsNet architecture is employed for producing a set of features existing in it [17]. The architecture of CapsNet contains capsule neuron structure, dynamic routing algorithm, and fully connected layer (FC). Initially, FC layer is utilized for extracting features of the input factor. Later, dynamic routing algorithm is utilized among the digitCaps layer and the primary capsule layer for iteratively updating the weight, and it also allows the digitCaps layer for extracting entity features from lower-level capsules and capturing geometric relationships.
In this study, the BGRU method can be employed for the identification and classification of HIs [18]. Long short term memory (LSTM) is a better version based on recurrent neural network (RNN) that could resolve the gradient explosion and vanishing problems. Simultaneously, it is utilized in every kind of problem with time series features. GRU is a variant of LSTM system that is simpler when compared to LSTM. Different from LSTM that three gates (forgetting, output, and input gates), GRU has two gates (reset and update gates). The function of update gate is same as input and forgetting gates in LSTM. It defines the information to forget and new data to update and add. Since the number of gating of GRU is lesser in comparison with LSTM, GRU is fast in comparison with LSTM in calculation. Fig. 2 demonstrates the framework of GRU method. The architecture of GRU is calculated by the following equations:
In the equation,
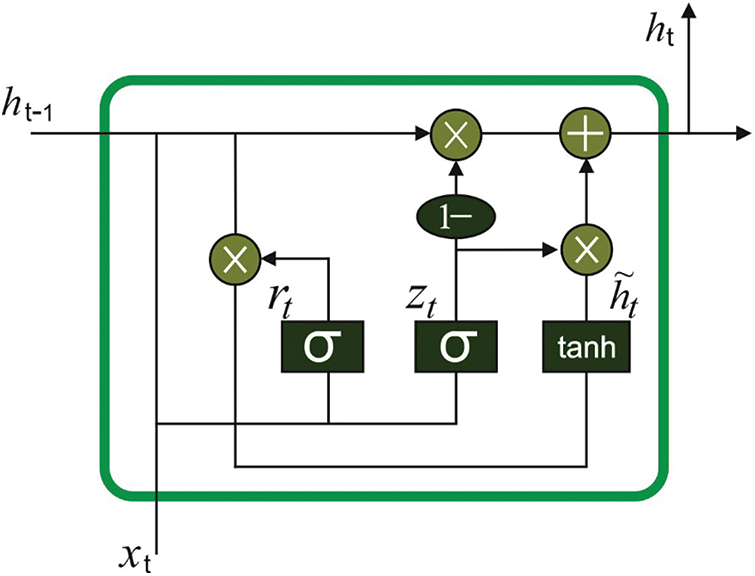
Figure 2: Structure of GRU
2.3 Hyperparameter Optimization
At the last stage, the BFO algorithm has been utilized for optimal hyperparameter tuning process which results in improved classification performance [19]. The E.coli foraging method is inspired by BFO approach that comprises swarming, chemotaxis, elimination-dispersal step, and reproduction operations. The bacterial foraging approach is inspired by this stage. Initially, change in the direction of bacteria for a certain time depends on tumbling. Then, a short distance is changed by bacteria. Assume that
Now
In which
whereas
The reproduction procedure can be performed after
The accumulated cost can be defined by the health of bacterium. When the nutrient of a bacterium is minimized, the value of accumulated cost is maximized. The bacteria are arranged in descending order corresponding to their health. The
In this study, the experimental validation of the EHCDL-HIC model is tested using a HI classification dataset for BC [20]. The dataset includes 588 samples into benign class and 1232 images in malignant class. A few sample images are depicted in Fig. 3.
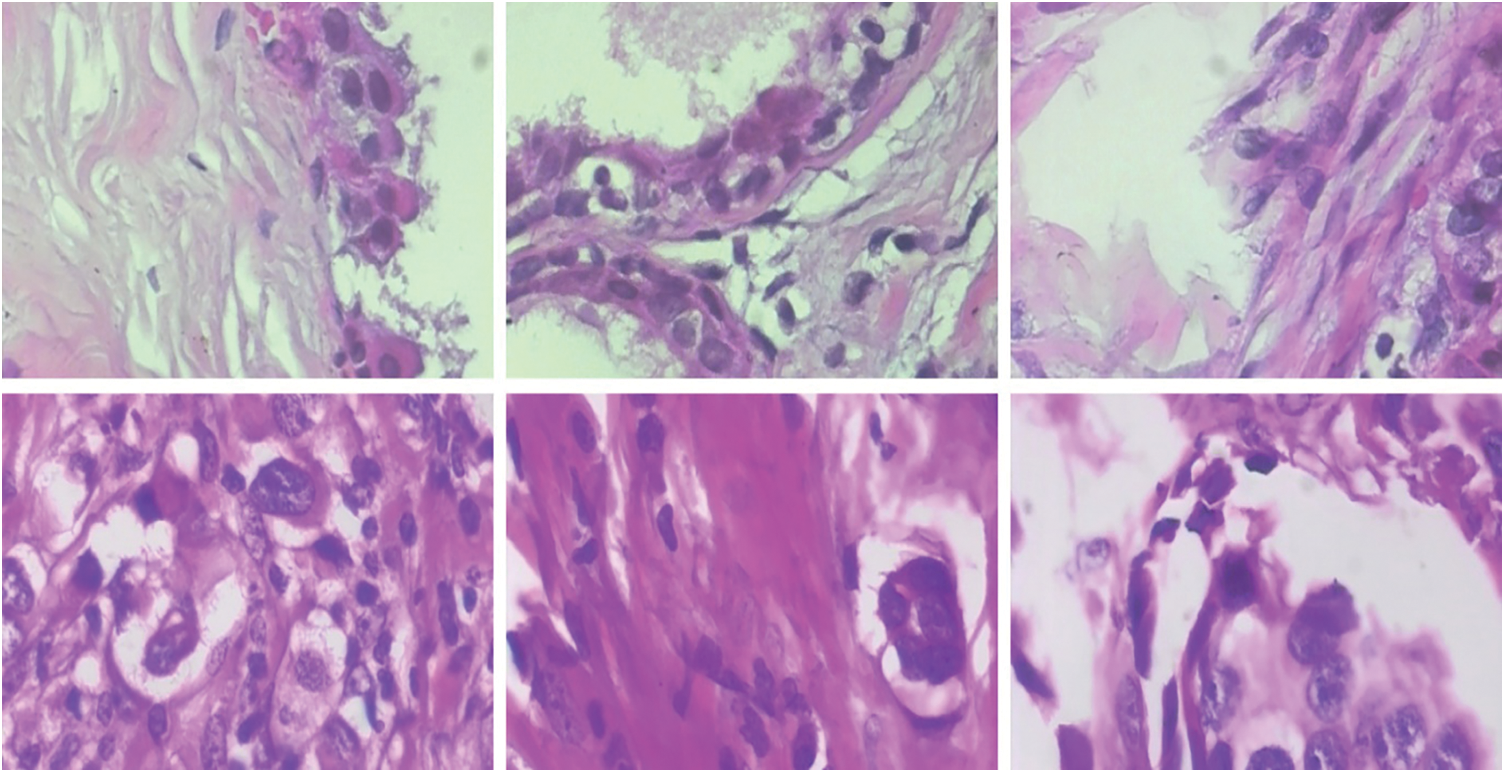
Figure 3: Sample Images (Benign and Malignant)
Fig. 4 portrays a collection of confusion matrices generated by the EHCDL-HIC model on 5 test runs. The figure indicated that the EHCDL-HIC model has obtained maximal performance under each run. For instance, with run 1, the EHCDL-HIC model has recognized 536 samples under benign class and 1180 samples under malignant class. Moreover, with run 3, the EHCDL-HIC technique has identified 540 samples under benign class and 1179 samples under malignant class. Furthermore, with run 5, the EHCDL-HIC system has identified 542 samples under benign class and 1183 samples under malignant class.
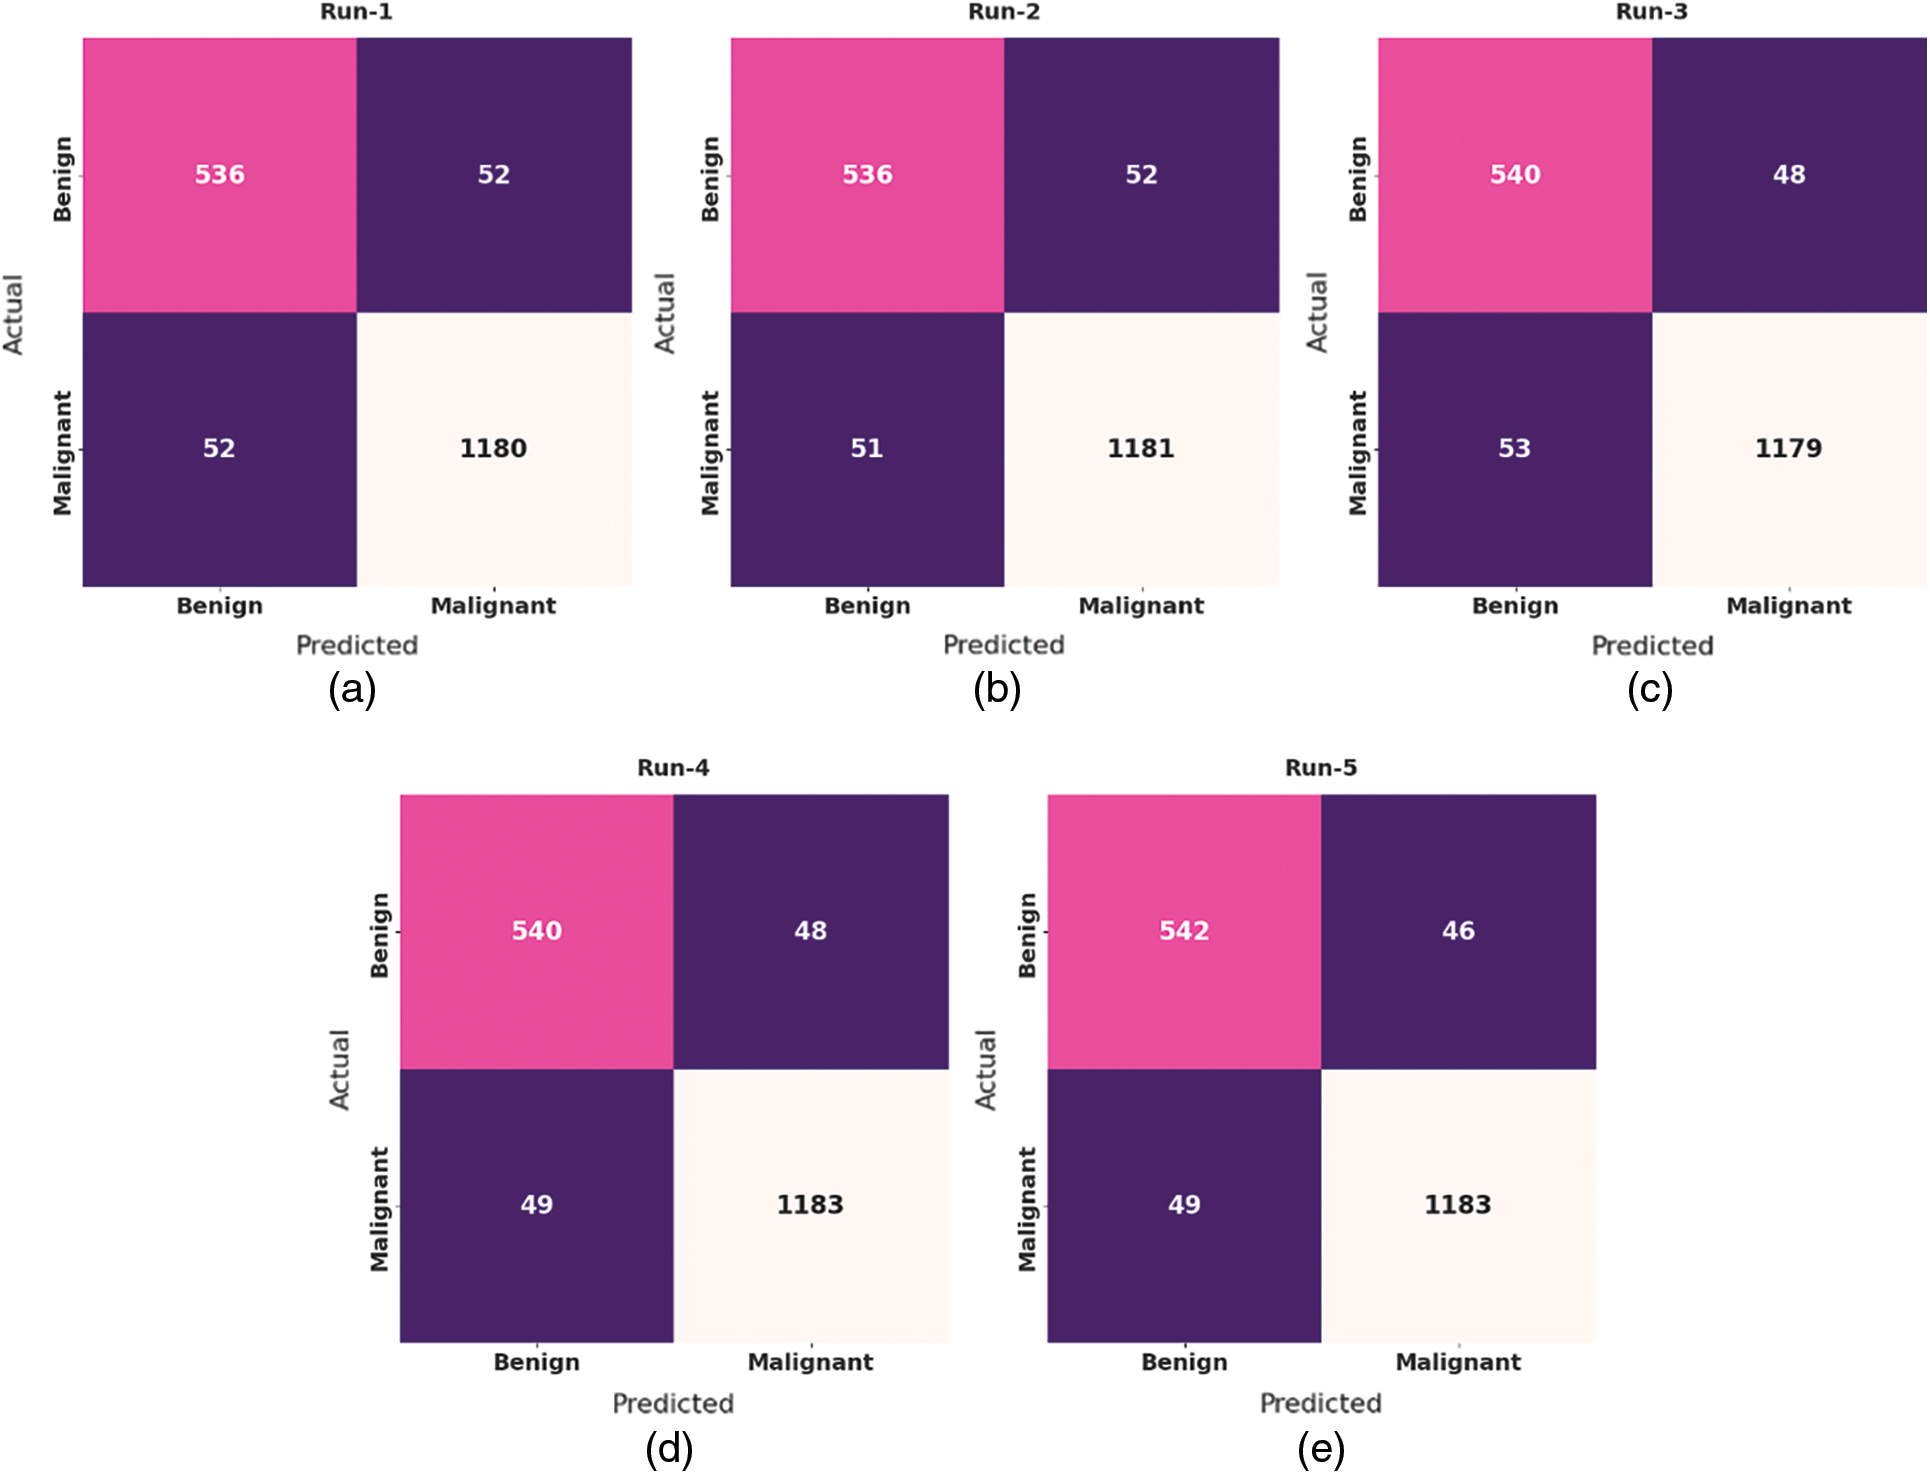
Figure 4: Confusion matrix of EHCDL-HIC technique under different 5 runs
Tab. 1 provides a detailed classification result interpretation of the EHCDL-HIC model under distinct test runs. The experimental table values pointed out that the EHCDL-HIC method has accomplished effectual outcomes under every run.

Fig. 5 offers a brief classifier result of the EHCDL-HIC model under distinct runs. The outcomes implied that the EHCDL-HIC model has gained maximal results over the other models. For instance, with run-1, the EHCDL-HIC model has offered average
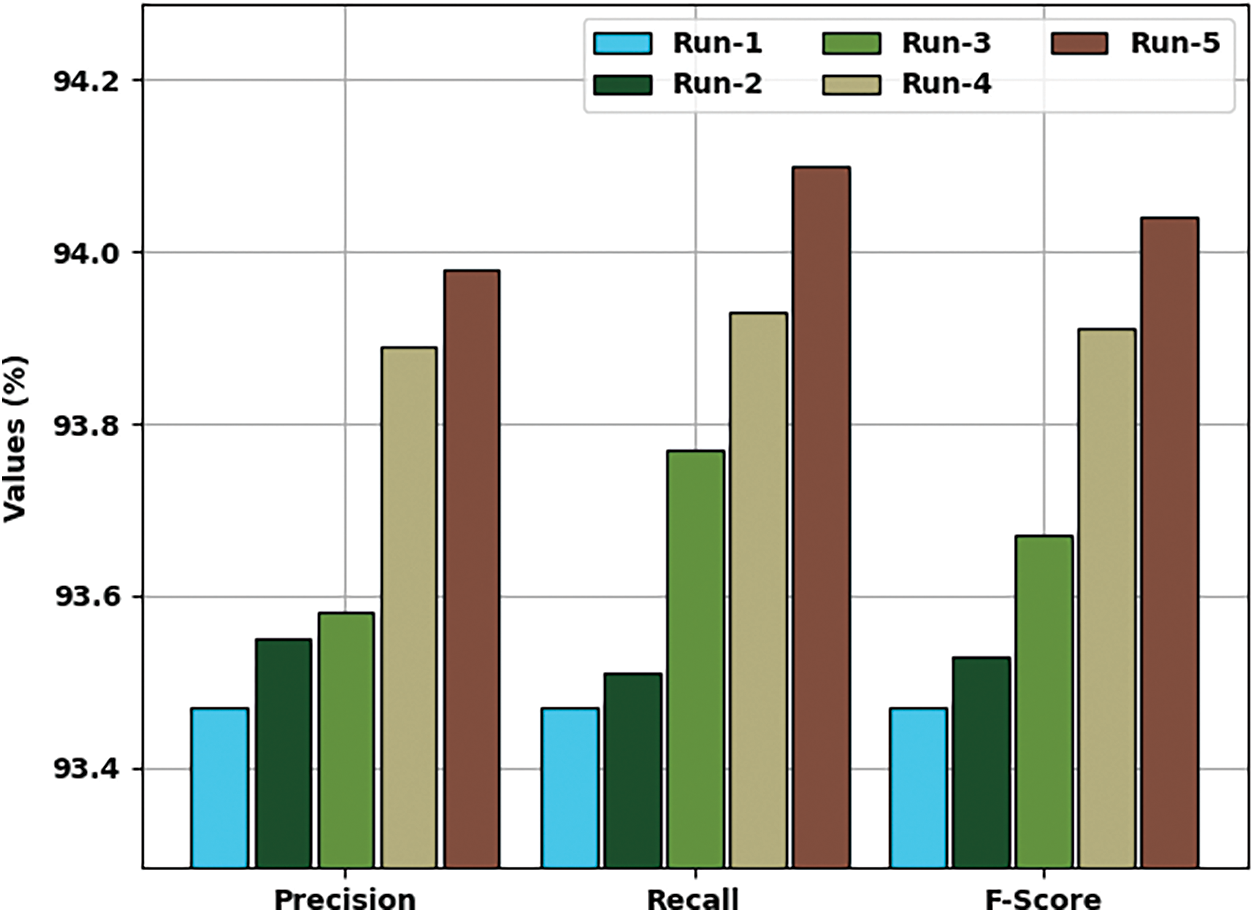
Figure 5:
Fig. 6 provides a detailed classifier result of the EHCDL-HIC technique under distinct runs. The outcomes demonstrated that the EHCDL-HIC approach has reached maximal results over the other approaches. For instance, with run-1, the EHCDL-HIC approach has obtainable average
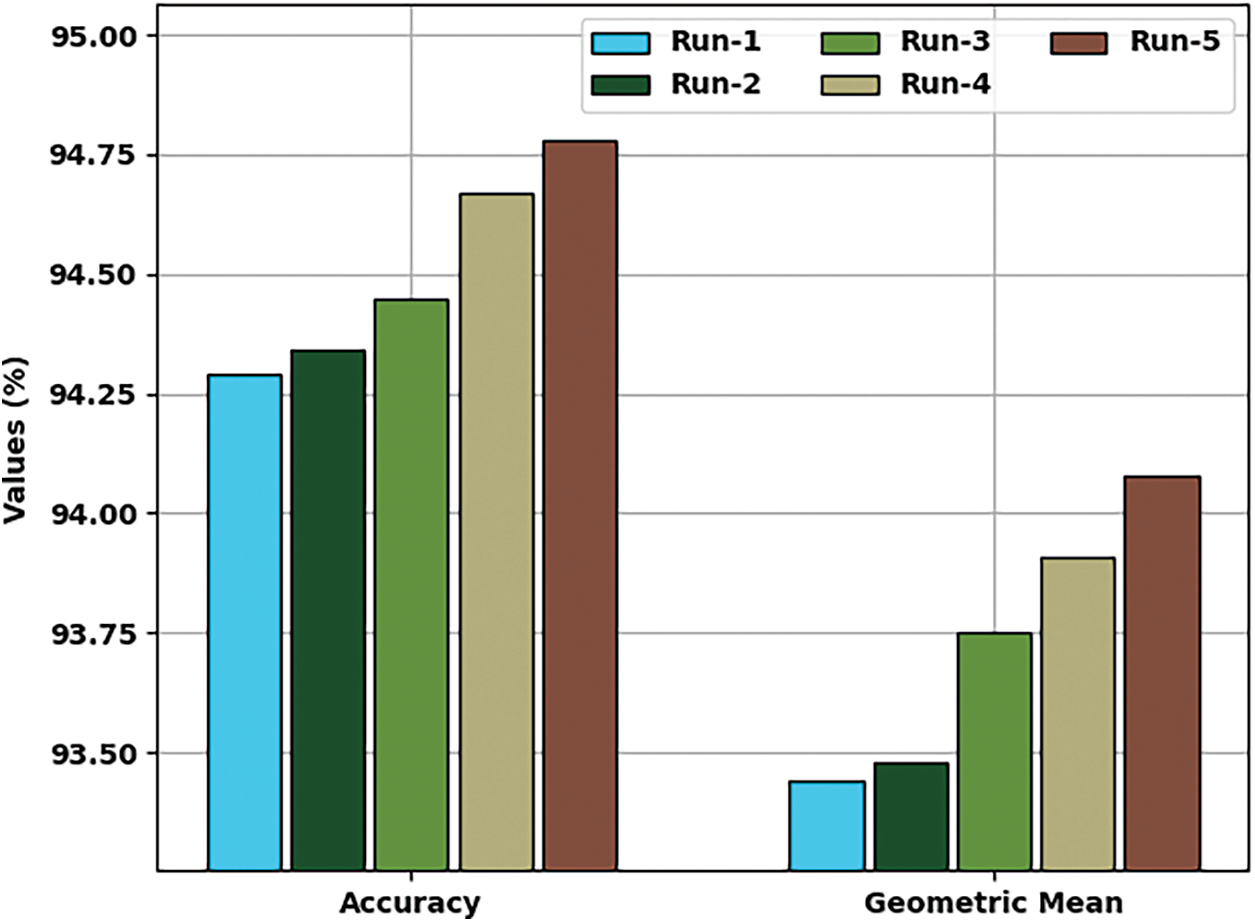
Figure 6:
The training accuracy (TA) and validation accuracy (VA) attained by the EHCDL-HIC model on test datasets is demonstrated in Fig. 7. The experimental outcomes implied that the EHCDL-HIC model has gained maximum values of TA and VA. In specific, the VA is seemed to be high than TA.
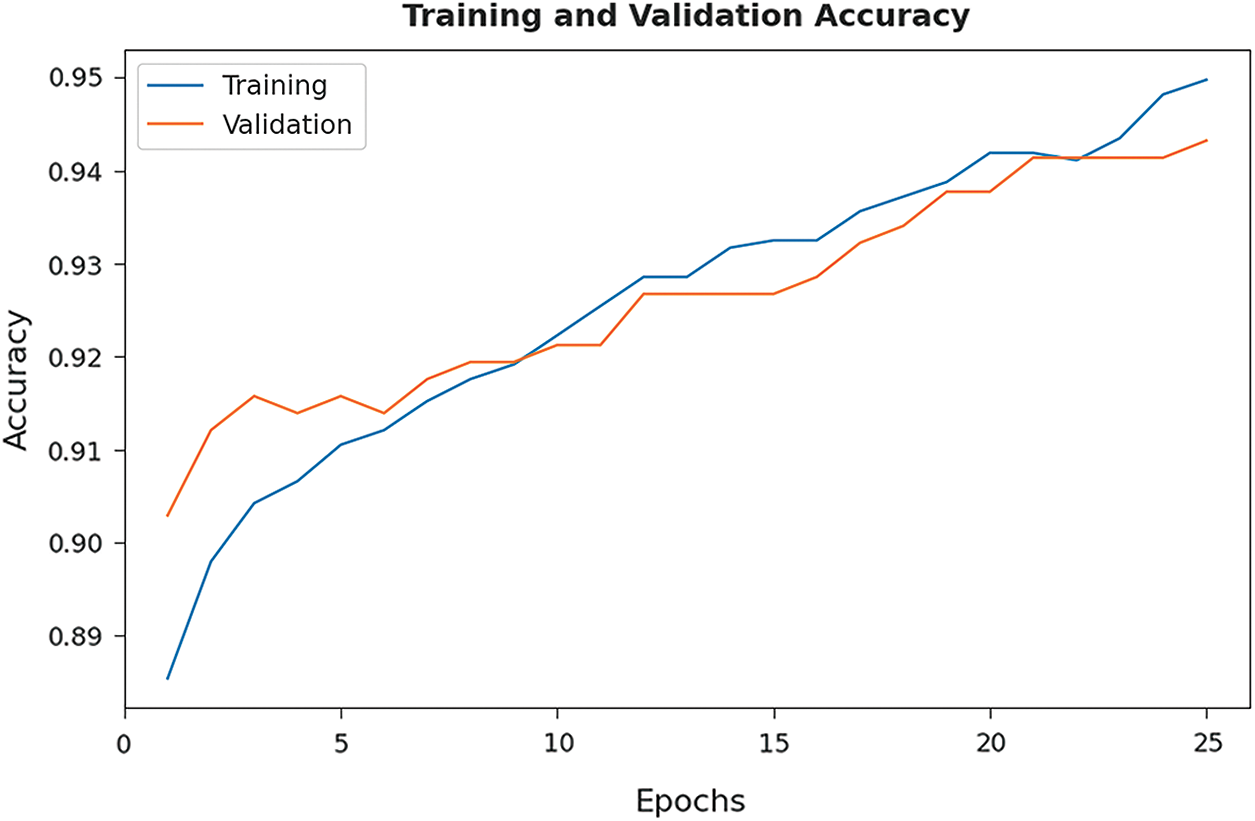
Figure 7: TA and VA graph analysis of EHCDL-HIC technique
The training loss (TL) and validation loss (VL) achieved by the EHCDL-HIC model on test datasets are established in Fig. 8. The experimental outcomes inferred that the EHCDL-HIC model has accomplished least values of TL and VL. In specific, the VL is seemed to be lower than TL.
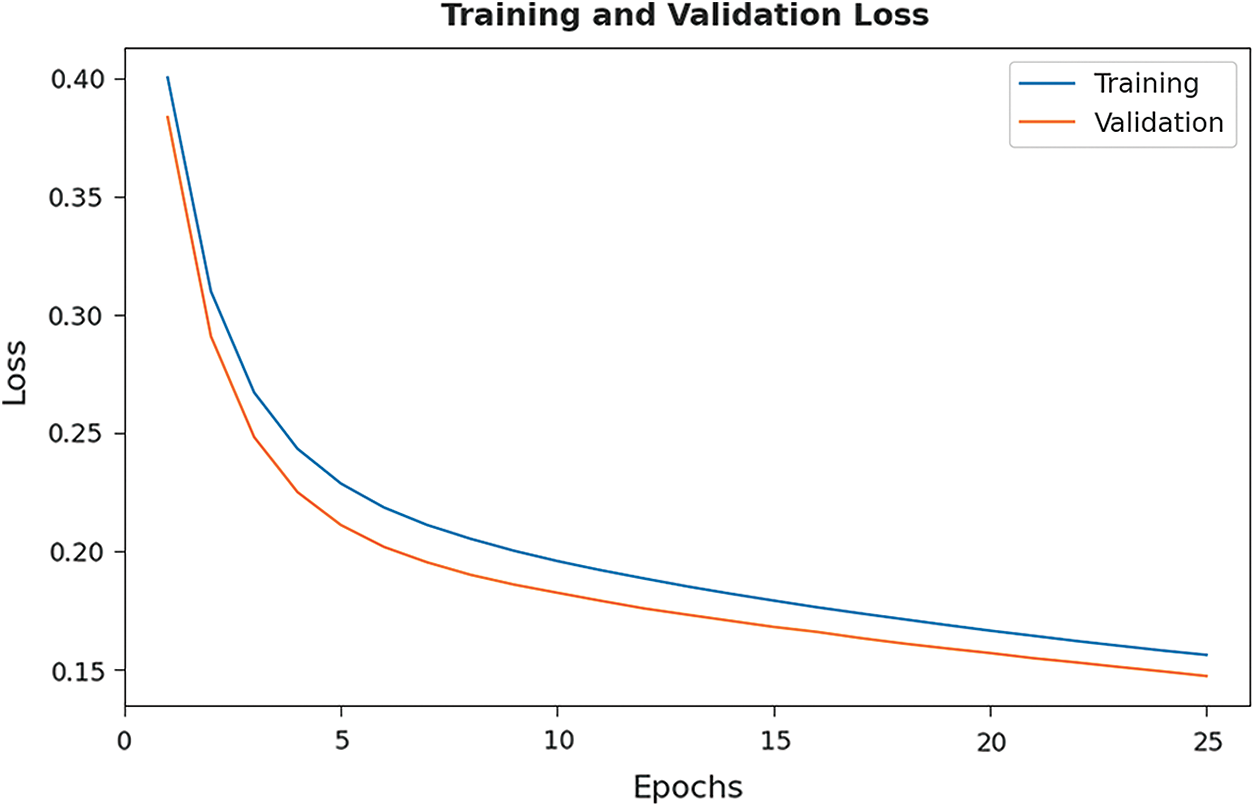
Figure 8: TL and VL graph analysis of EHCDL-HIC technique
A brief precision-recall examination of the EHCDL-HIC model on test dataset is portrayed in Fig. 9. By observing the figure, it has been noticed that the EHCDL-HIC method has established maximum precision-recall performance under all classes.
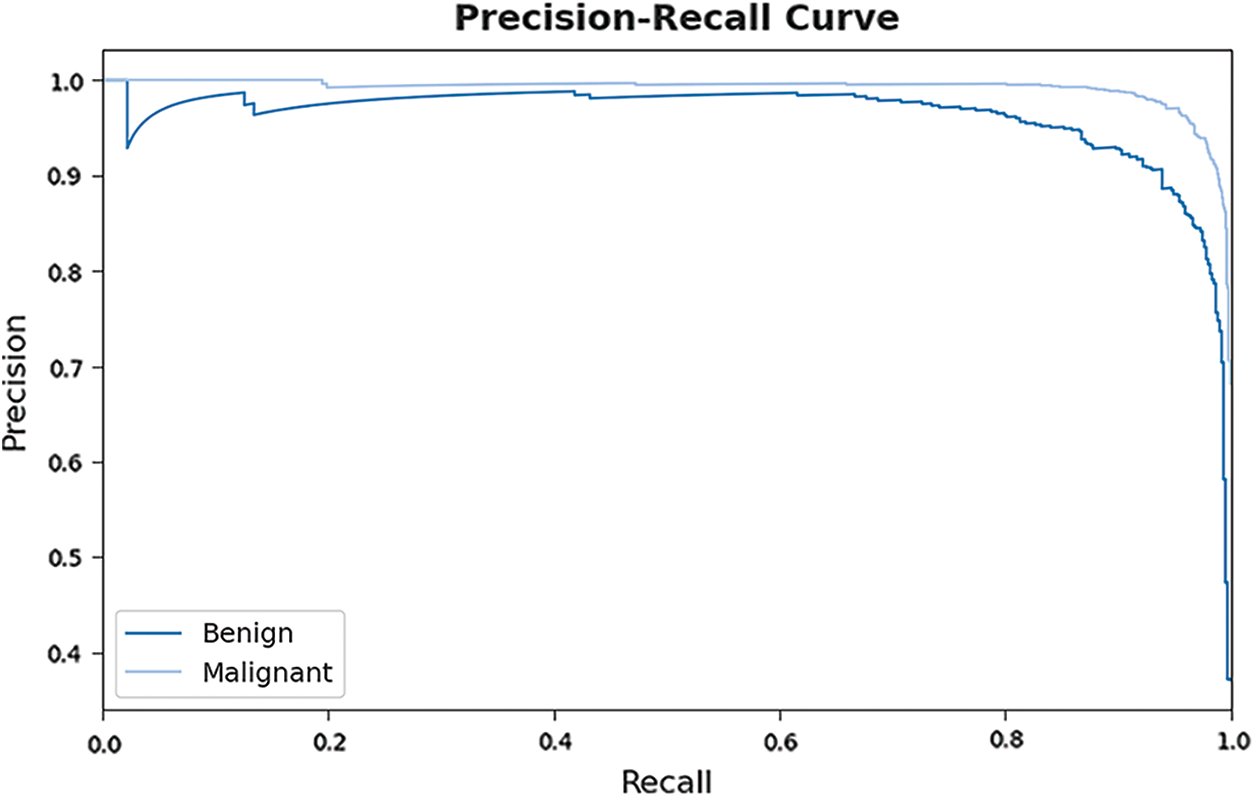
Figure 9: Precision-recall curve analysis of EHCDL-HIC technique
Fig. 10 portrays a clear receiver operating characteristic (ROC) investigation of the EHCDL-HIC model on test dataset. The figure portrayed that the EHCDL-HIC model has resulted in proficient results with maximum ROC values under distinct class labels.
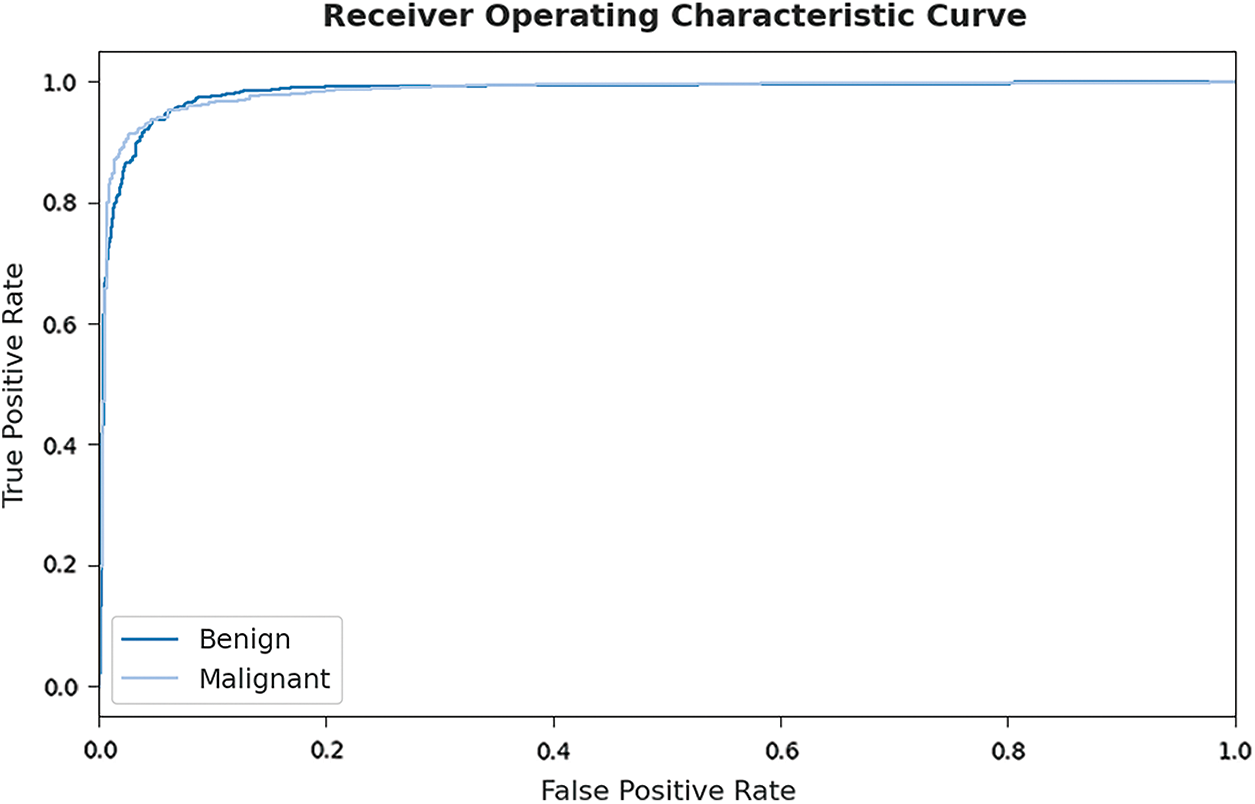
Figure 10: ROC curve analysis of EHCDL-HIC technique
With a view to highlighting the enhanced outcomes of the EHCDL-HIC method, a wide range of simulations are carried out in Tab. 2 [21].

Fig. 11 illustrates
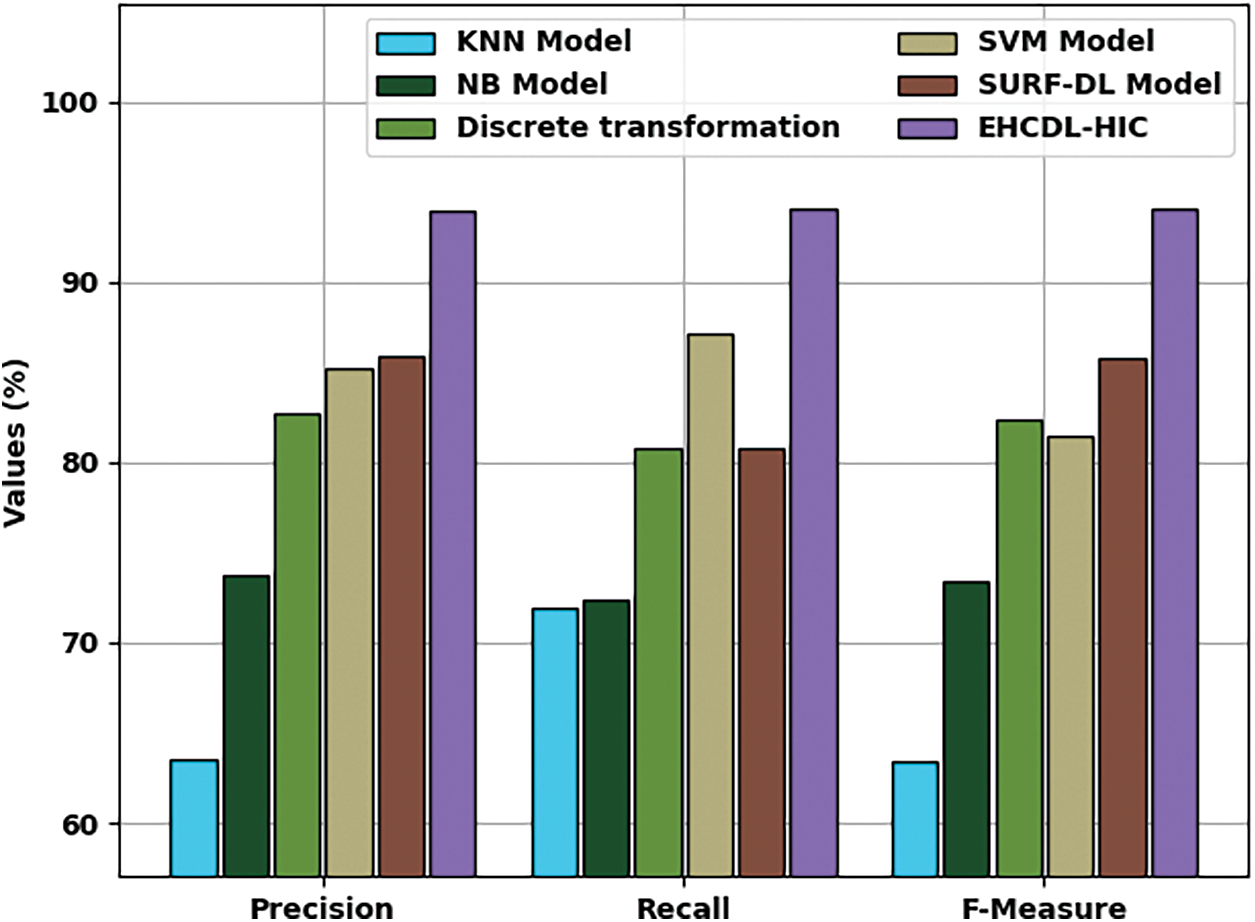
Figure 11: Comparative analysis of EHCDL-HIC system with existing algorithms
Fig. 12 showcases
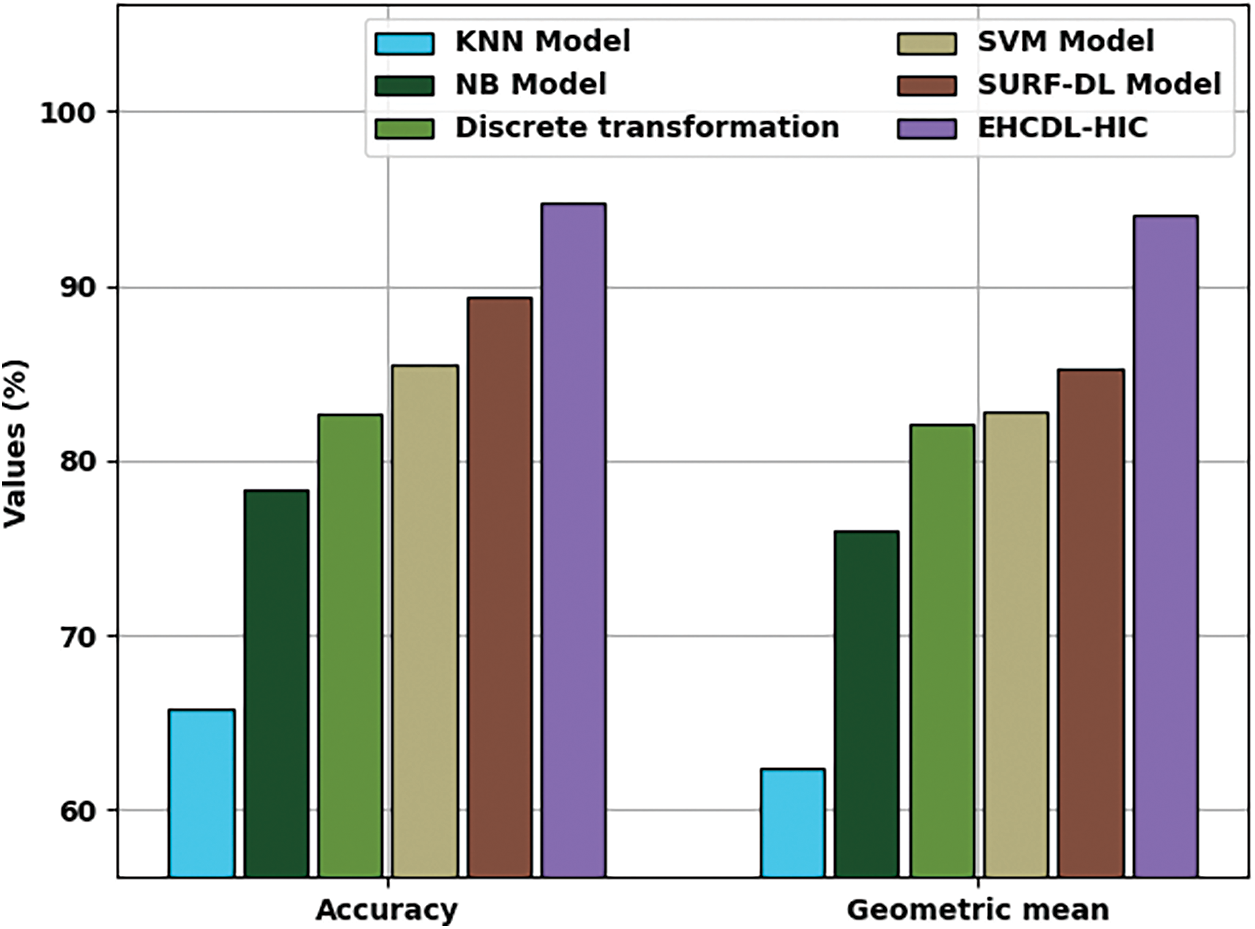
Figure 12:
In this study, a new EHCDL-HIC model was advanced for effective classification of HIs. The proposed EHCDL-HIC technique initially performs WF based noise removal technique. Once the images get smoothened, an ensemble of deep features and SURF features are extracted. Then, the BGRU model can be employed for the identification and classification of HIs. Finally, the BFO algorithm has been utilized for optimal hyperparameter tuning process which leads to improved classification performance. With a view to authenticating the enhanced execution of the proposed EHCDL-HIC technique, a set of simulations is performed. The experimentation outcomes highlighted the betterment of the EHCDL-HIC approach over the existing techniques. Therefore, the EHCDL-HIC model can be applied as an effective approach for histopathological image classification. In future, the classification execution is improvised by the use of feature selection approaches.
Funding Statement: The authors received no specific funding for this study.
Conflicts of Interest: The authors declare that they have no conflicts of interest to report regarding the present study.
1. Ł. Rączkowski, M. Możejko, J. Zambonelli and E. Szczurek, “ARA: Accurate, reliable and active histopathological image classification framework with Bayesian deep learning,” Scientific Reports, vol. 9, no. 1, pp. 14347, 2019. [Google Scholar]
2. R. Yan, F. Ren, Z. Wang, L. Wang, T. Zhang et al., “Breast cancer histopathological image classification using a hybrid deep neural network,” Methods, vol. 173, pp. 52–60, 2020. [Google Scholar]
3. D. Zhang, J. Hu, F. Li, X. Ding, A. K. Sangaiah et al., “Small object detection via precise region-based fully convolutional networks,” Computers, Materials and Continua, vol. 69, no. 2, pp. 1503–1517, 2021. [Google Scholar]
4. J. Wang, Y. Wu, S. He, P. K. Sharma, X. Yu et al., “Lightweight single image super-resolution convolution neural network in portable device,” KSII Transactions on Internet and Information Systems (TIIS), vol. 15, no. 11, pp. 4065–4083, 2021. [Google Scholar]
5. J. Wang, Y. Zou, P. Lei, R. S. Sherratt and L. Wang, “Research on recurrent neural network based crack opening prediction of concrete dam,” Journal of Internet Technology, vol. 21, no. 4, pp. 1161–1169, 2020. [Google Scholar]
6. J. Zhang, J. Sun, J. Wang and X. G. Yue, “Visual object tracking based on residual network and cascaded correlation filters,” Journal of Ambient Intelligence and Humanized Computing, vol. 12, no. 8, pp. 8427–8440, 2021. [Google Scholar]
7. S. He, Z. Li, Y. Tang, Z. Liao, F. Li et al., “Parameters compressing in deep learning,” Computers, Materials & Continua, vol. 62, no. 1, pp. 321–336, 2020. [Google Scholar]
8. S. R. Zhou, M. L. Ke and P. Luo, “Multi-camera transfer GAN for person re-identification,” Journal of Visual Communication and Image Representation, vol. 59, no. 1, pp. 393–400, 2019. [Google Scholar]
9. X. R. Zhang, X. Sun, W. Sun, T. Xu and P. P. Wang, “Deformation expression of soft tissue based on BP neural network,” Intelligent Automation & Soft Computing, vol. 32, no. 2, pp. 1041–1053, 2022. [Google Scholar]
10. X. R. Zhang, J. Zhou, W. Sun and S. K. Jha, “A lightweight CNN based on transfer learning for COVID-19 diagnosis,” Computers, Materials & Continua, vol. 72, no. 1, pp. 1123–1137, 2022. [Google Scholar]
11. Z. Hameed, S. Zahia, B. G. Zapirain, J. J. Aguirre and A. M. Vanegas, “Breast cancer histopathology image classification using an ensemble of deep learning models,” Sensors, vol. 20, no. 16, pp. 4373, 2020. [Google Scholar]
12. A. Kumar, S. K. Singh, S. Saxena, K. Lakshmanan, A. K. Sangaiah et al., “Deep feature learning for histopathological image classification of canine mammary tumors and human breast cancer,” Information Sciences, vol. 508, no. 1, pp. 405–421, 2020. [Google Scholar]
13. Y. S. Vang, Z. Chen and X. Xie, “Deep learning framework for multi-class breast cancer histology image classification,” in Int. Conf. Image Analysis and Recognition, ICIAR 2018: Image Analysis and Recognition, Cham, Lecture Notes in Computer Science book series, Springer,vol. 10882, pp. 914–922, 2018. [Google Scholar]
14. M. Gour, S. Jain and T. S. Kumar, “Residual learning based CNN for breast cancer histopathological image classification,” International Journal of Imaging Systems and Technology, vol. 30, no. 3, pp. 621–635, 2020. [Google Scholar]
15. T. Peng, M. Boxberg, W. Weichert, N. Navab and C. Marr, “Multi-task learning of a deep K-nearest neighbour network for histopathological image classification and retrieval,” in Int. Conf. on Medical Image Computing and Computer-Assisted Intervention, MICCAI 2019: Medical Image Computing and Computer Assisted Intervention–MICCAI 2019, Lecture Notes in Computer Science book series,vol. 11764, pp. 676–684, 2019. [Google Scholar]
16. N. Ahmad, S. Asghar and S. A. Gillani, “Transfer learning-assisted multi-resolution breast cancer histopathological images classification,” The Visual Computer, pp. 1–20, 2021. https://doi.org/10.1007/s00371-021-02153-y. [Google Scholar]
17. Q. Zeng, T. Xie, S. Zhu, M. Fan, L. Chen et al., “Estimating the near-ground PM2.5 concentration over china based on the capsnet model during 2018–2020,” Remote Sensing, vol. 14, no. 3, pp. 623, 2022. [Google Scholar]
18. Q. Zhou, C. Zhou and X. Wang, “Stock prediction based on bidirectional gated recurrent unit with convolutional neural network and feature selection,” PLOS ONE, vol. 17, no. 2, pp. e0262501, 2022. [Google Scholar]
19. G. Wang, J. Guo, Y. Chen, Y. Li and Q. Xu, “A PSO and BFO-based learning strategy applied to faster R-CNN for object detection in autonomous driving,” IEEE Access, vol. 7, pp. 18840–18859, 2019. [Google Scholar]
20. F. A. Spanhol, L. S. Oliveira, C. Petitjean and L. Heutte, “A dataset for breast cancer histopathological image classification,” IEEE Transactions on Biomedical Engineering, vol. 63, no. 7, pp. 1455–1462, 2016. [Google Scholar]
21. V. Reshma, N. Arya, S. S. Ahmad, I. Wattar, S. Mekala et al., “Detection of breast cancer using histopathological image classification dataset with deep learning techniques,” BioMed Research International, vol. 2022, no. 1, pp. 1–13, 2022. [Google Scholar]
 | This work is licensed under a Creative Commons Attribution 4.0 International License, which permits unrestricted use, distribution, and reproduction in any medium, provided the original work is properly cited. |