DOI:10.32604/cmc.2022.030923

| Computers, Materials & Continua DOI:10.32604/cmc.2022.030923 |  |
| Article |
A Novel Inherited Modeling Structure of Automatic Brain Tumor Segmentation from MRI
1Radiological Sciences Department, College of Applied Medical Sciences, Najran University, Najran, 61441, Saudi Arabia
2Department of Computer Science, COMSATS University Islamabad, Sahiwal Campus, Sahiwal, 57000, Pakistan
3Department of Informatics and Systems, University of Management and Technology, Lahore, 54000, Pakistan
4Electrical Engineering Department, College of Engineering, Najran University, Najran, 61441, Saudi Arabia
5Department of Clinical Laboratory Sciences, Collage of Applied Medical Science, Najran University, Najran, Saudi Arabia
*Corresponding Author: Hassan A. Alshamrani. Email: hamalshamrani@nu.edu.sa
Received: 06 April 2022; Accepted: 11 May 2022
Abstract: Brain tumor is one of the most dreadful worldwide types of cancer and affects people leading to death. Magnetic resonance imaging methods capture skull images that contain healthy and affected tissue. Radiologists checked the affected tissue in the slice-by-slice manner, which was time-consuming and hectic task. Therefore, auto segmentation of the affected part is needed to facilitate radiologists. Therefore, we have considered a hybrid model that inherits the convolutional neural network (CNN) properties to the support vector machine (SVM) for the auto-segmented brain tumor region. The CNN model is initially used to detect brain tumors, while SVM is integrated to segment the tumor region correctly. The proposed method was evaluated on a publicly available BraTS2020 dataset. The statistical parameters used in this work for the mathematical measures are precision, accuracy, specificity, sensitivity, and dice coefficient. Overall, our method achieved an accuracy value of 0.98, which is most prominent than existing techniques. Moreover, the proposed approach is more suitable for medical experts to diagnose the early stages of the brain tumor.
Keywords: Brain tumor; support vector machine; convolutional neural network; BraTS; classification
A human brain consists of billions of cells within the human nervous system. When these cells start behaving abnormally or growing irregularly, brain cancerous disease occurs. Brain cancer is the most dreadful type of cancer and triggers many deaths among all ages of people. Brain tumor detection at early stages can save many people lives [1]. The latest World Health Organization (WHO) survey described that around seven lacks people were affected with a brain tumor, and above eighty thousand have been diagnosed since 2019. Other details show that almost 16,830 deaths due to brain tumors were recorded since 2019 survey reports. Nowadays, because of many demises, the diagnosis of brain tumors is the state-of-the-art study area in medicinal imaging [2]. The initial signs of brain tumor depends on size, location and growth rate of tumor. The initial signs are headaches, vision problem, tiredness, speech problems and confusion in every matters etc. However, the early recognition of the brain tumor could surely decrease the demise rates. The early detection of these signs from a medical expert can save many patients lives.
According to WHO standards, the tumor can cure underneath individual evaluations known as grades 1–4. The initial stage cancer is grade 1 or benign, and the final stage is grade 4 or malignant [3]. Many types of cancers are spreading around the world. Physicians use many methods like radiotherapy, chemotherapy, and surgery [4,5]. In contrast, the clinical magnetic resonance imaging (MRI) technique yields detailed information related to the healthy and tumorous regions with few slices [6]. However, it’s still an interesting task to diagnose the tumor abnormality due to slice-like shapes. As medical professionals check the abnormality of tumors in the slice by slice manners, it is more challenging and time-consuming to analyze the tumorous details [7].
Moreover, with the help of naked eyes, it’s a bit more confusing to analyze the tumors in every slice. An expert physician is always required to optimize the identification of tumor regions [8]. Therefore, it’s always an ultimate need to develop an automatic system to diagnose the tumor without human intervention. In the previous automated methods, many computer vision researchers performed region of interest (ROI) based preprocessing steps to enhance the tumor diagnosis accuracy with other convention techniques like K-means, watershed, and deep learning techniques [9].
Many deep learning methods, mainly CNN, have been considered for brain tumor segmentation. These techniques pick up features in hierarchy behaviors when matched with other procedures like SVM [10]. These techniques are also effectively useful for the segmentation, retrieval, and classification related brain tumor imaging [11]. Moreover, many supervised learning methods are also helpful for the identification of brain tumors like Random Forest Classifiers (RFC) [12], Markov Random Field (MRF) [13], and intensity-based features mapping and other Gaussian models [14]. These methods are only applied for handcrafted features extraction; the problem with the handmade features method is that it is mathematically exhaustive compared to the other methods [15].
On the other hand, deep learning approaches are more dominant to extract the handcrafted features. CNN cab helps analyze medical images to achieve better results [16]. Firstly, with the help GPU 2D CNN model is applied for the segmentation of clinical manifestations. To get the 3D segmentation, initially, 2D slices are being processed [17]. However, having a simple CNN structure has an enormous potential to get better results. Many parameters, computational power, and large memory are required to process 3D-CNN architecture [18,19].
In current years, CNN must turn out to be most prevalent for medical imaging classification. In this study, an automated brain tumor detection system with CNN and integration of SVM is presented. The proposed method can be beneficial for supporting radiologists to precisely predict brain tumor classification and segmentation. Moreover, the approach in this study uses multilevel models (models 1, 2, and 3) to get ensemble model results. They have different CNN structures with various layers, parametric functionalities, learning rates, strides, and filter sizes. All models are combined to obtain a metric used as an input for the ensemble technique. The ensemble model saves the values to integrate them with SVM. This ensemble-based integration approach allows a fair assessment of the proposed method with benchmark papers. Thus, the contributions of this paper are as follows:
• The critical impression of this study is a detailed and early diagnosis of brain tumor by using a convolutional neural network with integration of support vector machine.
• This work considers classification as well as segmentation of brain tumor region.
• Computer aided systems based on this novel integration would help the radiologist to determine the tumor stages with accurate precision.
The rest of this paper is organized as follows. We describe related work in Section 2. The detailed procedure of the proposed method is presented in Section 3. The datasets and evaluation criteria are presented in Section 4. Finally, Section 5 concludes the paper.
The brain is a significant body part of humans and consists of many cells. In current ages, numerous methods grounded on MRI were applied to diagnose brain tumors. Some of the used methods are discussed below.
A supervised random forest and Gaussian model is used to segment brain tumors in [20,21]. Another research applied morphological and contextual feature extraction methods for brain tumor recognition [22]. Moreover, a Markov random forest (MRF) model has been used to segment tumorous regions in [23]. Deep learning methods are more dominant as these create highly discriminative features hierarchy and build up the feature mapping [24].
On the other hand, in [25], a histogram matching, and bias field correction method is used for brain tumor analysis. Machine learning methods k-mean, fuzzy c-mean, and thresholding are used [26,27]. Another research applied a rule and level set-based technique for brain tumor separation [28]. The discrete wavelet transforms [29], artificial neural network, and k-nearest neighbor are applied to detect the brain tumor [30]. To get the results, these techniques were tested on T1 weighted MRI images of the BraTS 2013 dataset [31].
Moreover, a fusion approach was used on the multiple BraTS datasets like BraTS 2012, 2013, 2015, and 2018 to get the results for brain tumor detection [32]. A microscopic brain tumor recognition using 3D CNN was applied on BraTS 2015, 2017, and 2018 datasets to get the accuracy values as 98.32%, 96.97%, 92.67%, respectively [33]. Deep learning with the handcrafted feature-based method with fusion approach is applied on BraTS 2015, 2016 and 2017 datasets and achieved the dice similarity coefficient values as 0.99, 1.00 and 0.99, respectively [34].
In machine learning algorithms, voxel intensities and texture properties are widely utilized. Each one is classified using the feature vector. Texture features including power, intensity difference, neighborhood, and others were explored using a benchmark dataset. In this paper, we look at wavelet surface structures and other machine learning algorithms [35]. According to existing research, statistical features like feature vector, grey levels-occurrence matrix, SVM, and Back Propagating Neural Network statistical characteristics outperform other approaches [36].
Moreover, brain tumor analysis using machine learning and statistical methods is also done on BraTS 2013 and 2015 datasets to achieve the statistical values. The outcomes for specificity, sensitivity, accuracy, area under the curve and dice similarity values for BraTS 2013 are 0.90, 1.00, 0.97, 0.98 and 0.98 and for BraTS 2015 are 0.90, 0.91, 0.90, 0.77 and 0.95 respectively [37]. Another deep convolutional neural network for brain tumor recognition is used on BraTS datasets to achieve the 99.8% accuracy value [38].
A computerized technique is used by using SVM to distinguish between tumorous and non-tumorous MRI. The achieved results for specificity 98.0%, sensitivity 91.9%, accuracy 97.1%, area under the curve 0.98 are the best ones compared to the already existing algorithms [39]. A novel BrainMRNet model is used with the help of a pre-trained neural network known as AlexNet, Google Net, VGG16, and it achieved an accuracy of 96.5% [40].
For brain tumors detection, a machine learning-based backpropagation neural network with the help of infrared sensor imaging technology had proposed to get the best results [41]. A convolutional neural network with Keras and TensorFlow is applied for brain tumor detection and achieved an accuracy value of 97.87%. The other six traditional methods, SVM, KNN, logistic regression, naive Bayes, random forest classifier, and multilayer perceptron, were also applied with scikit-learn for verification of results. Still, the convolutional neural network shows better results than the traditional methods [42].
Moreover, a convolutional neural network with SVM and KNN is also applied to achieve an accuracy of 95.62% [43]. A multi-level deep convolutional neural network with different parameters, layers, and filters is also used [44]. On the other hand, including deep neural network and bias field correction with feed-forward neural network is also used for brain tumor detection for MRI images of BraTS 2013 dataset. This method achieved the statistical results as specificity 0.86, sensitivity 0.86, and accuracy 0.91 as depicted in [45]. An adaptive threshold-based deep CNN is also applied to get the accuracy values as 99.39% in [46].
In another research, a novel correlation relation mechanism for deep neural network architecture with the combination of CNN is used in [47]. It achieved an accuracy value of 96%. It helps CNN architecture to find the most appropriate filters for pooling and convolutional layers. Moreover, a multi-level deep convolutional neural network for multispectral images is also applied to get the accuracy results as 99.92% in [48]. Another multilayer’s convolutional neural network is used for 99% accuracy values [49].
A VGG stacked classifier network is applied for brain tumor recognition. Different traditional and hybrid machine learning methods are applied to classify the tumor without human involvement in this research. The proposed VGG stacked classifier network achieved various statistical as precision, recall, and f1-score as 99.2%, 99.1%, and 99.2%, respectively [50]. Another super-resolution fuzzy approach is applied in [51] to segment the tumor in high-performance results. The proposed method shows that by using this technique, the brain tumor is segmented and removed better than the already existing algorithms, with an accuracy value of 98.33%.
The novel hybrid method explains in this part of the research. This method integrates CCN with SVM in the last layer of CNN. This technique has been executed on the system with GPU having 16 GB RAM, Core i7, and 11 the generation. The integration process detail has given below.
Almost every image consists of noise which creates a variation in measuring the numerical image values. Nowadays, the images captured by digital cameras consist of heavy noise ratios, disturbing the image quality. Therefore, the Gaussian filter and histogram equalizer technique makes the image noise-free without losing the image feature mapping. The influence of higher-frequency pixels, including noise, is amplified by differentiation of a histogram equalizer (HE), as shown in Fig. 1. It is also better to use a Gaussian filter before the image segmentation phase as a preprocessing stage. The mathematical model for denoising of Gaussian filter shows in Eq. (1), where
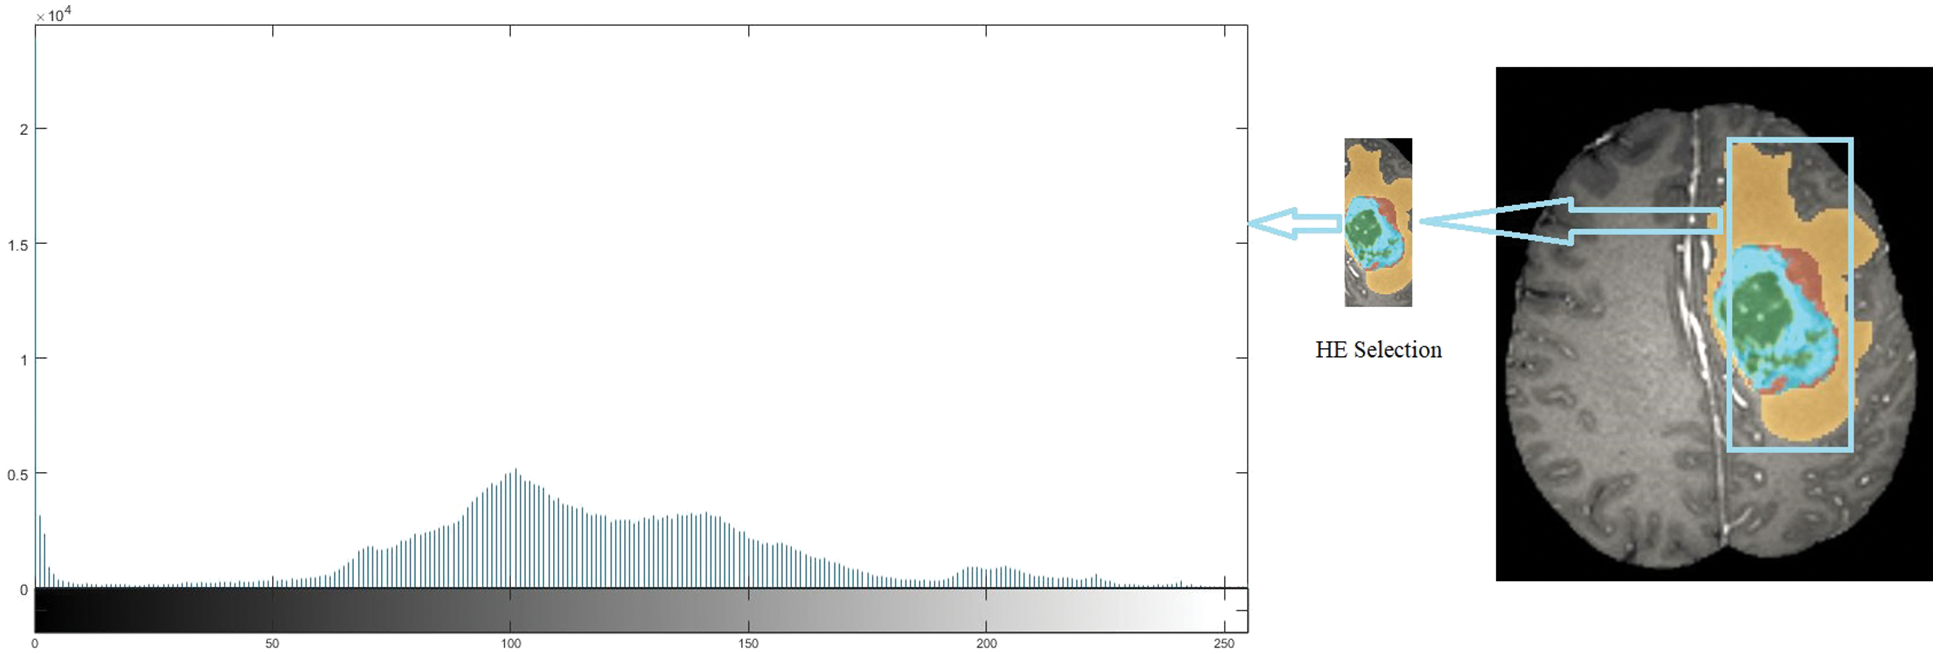
Figure 1: Histogram equalizer
The segmentation technique rationally distributes the image into different parts to better understand the semantics of an image. This technique is helpful for the image dataset at the preprocessing stage to detect the identical region of interest (ROI), as shown in Fig. 2. These techniques extract the areas of the high intensity to get better quality of the brain tumor affected regions. The region-based segmentation of brain tumor images extracts only the affected areas in terms of multiple ROIs [52].
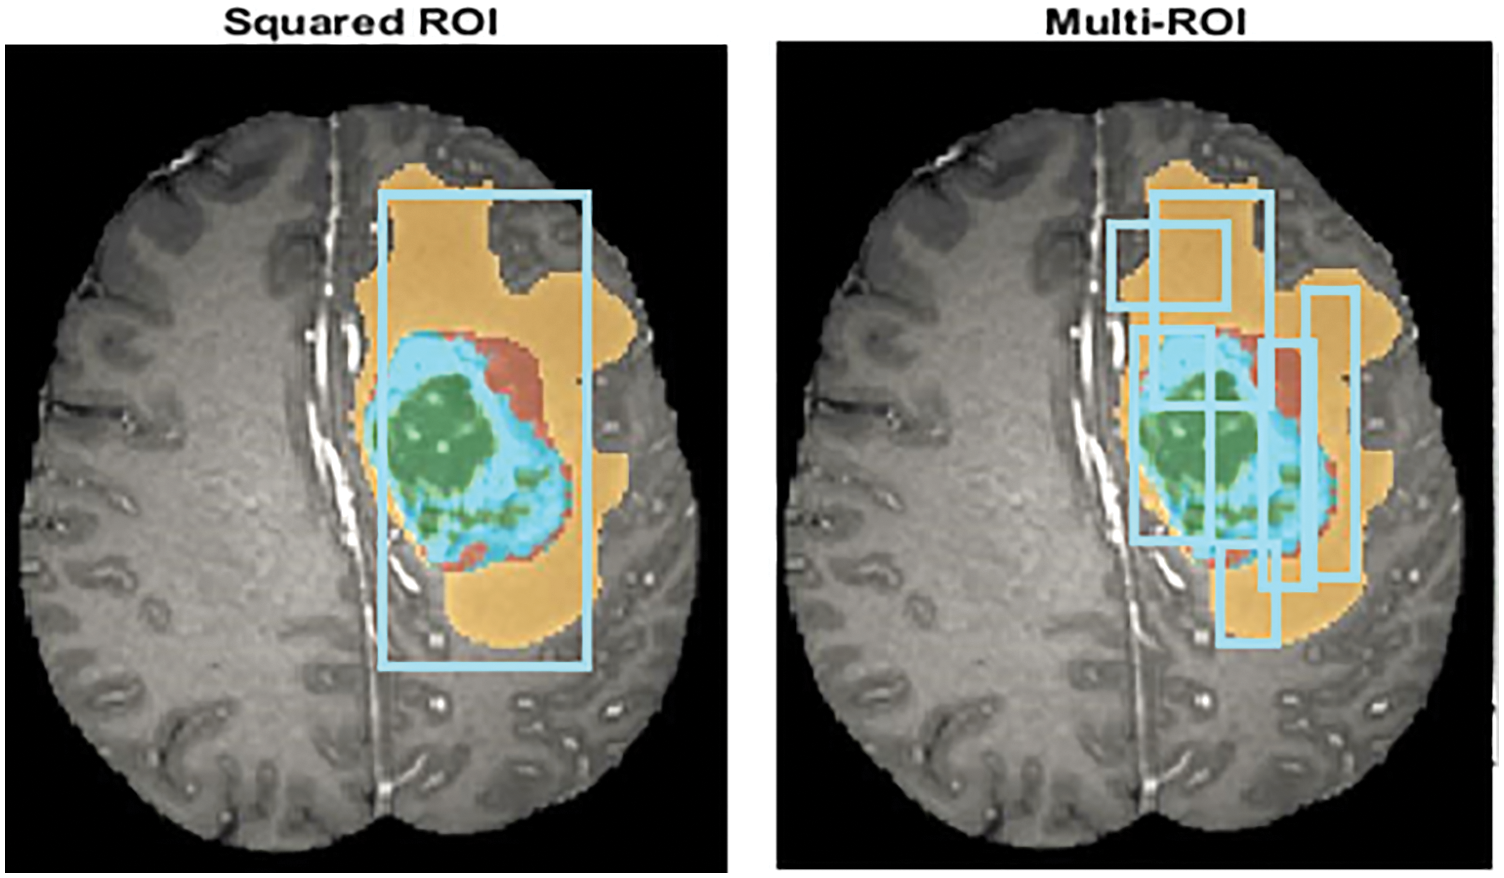
Figure 2: ROI feature extraction
Many approaches can apply to extract features for classifying the characteristics of brain tumor. In recent years CNN has attained more attention to brain tumor detection and classification. Due to different filters, stride and kernel size, and padding, the CNN model, has a significant impact on the accuracy factor. The feature map created by using these CNN parameters has more accuracy value. As an outcome, the aggregate of time taken for learning and classification precision are both affected [53,54]. Hence, this work applied a CNN due to its higher brain tumor classification and analysis results. Moreover, CNN contains different layers, as described below and shown in Fig. 4.
i. Input Layer: This layer is the initial one and is treated as an input layer for the whole CNN model to normalize the images. It takes the image in same sizes, widths, and heights with a specific number of gray or RGB color schema channels.
ii. Convolutional Layer: It is the fundamental part of CNN and is used for feature extraction to create the feature map [55]. This layer holds various filters and parameters to mine the features. The size of output layers are measured by using Eqs. (2) and (3), correspondingly, where
iii. Batch Normalization Layer: This specific layer provides strength to the whole CNN network with zero mean value [56].
iv. ReLU Layer: This layer is the handler of the batch normalization layer and gains the dataset’s nonlinear values [57]. All the negative values of the layers changed to zero in this layer. The ReLU output layer measures with the help of Eq. (4), where z is the given input.
v. Pooling Layer: This layer is used after every convolutional layer and handles the overfitting problem in the image dataset. This layer consists of max, min, and average pooling layer functions [58], as presented in Fig. 3. The size and output of the pooling layer are measured using Eqs. (5) and (6), respectively, where P is the output and G represents the pooling region.
vi. Softmax Layer: This layer is used as an input for the CNN model as it takes values from pooling and convolutional layers [59].
vii. Fully Connected Layer: This layer does the real classification task. It covers all layers, and its input is passed through the whole network of CNN to handle the network’s training. This last, entirely connected layer symbolizes and yields a vector of size Z, where Z is the number of classes in the dataset images related to a brain tumor. On the other hand, to learn more about classification odds, the fully interconnected layer duplicates each information component according to its weighting before application. The convolutional neural network assessments weigh the same way as the convo layer in the training stage [60].
viii. Classification Layer: The actual class entropy against each class measured in this layer. It also matches the introductory course with relevant features [61].
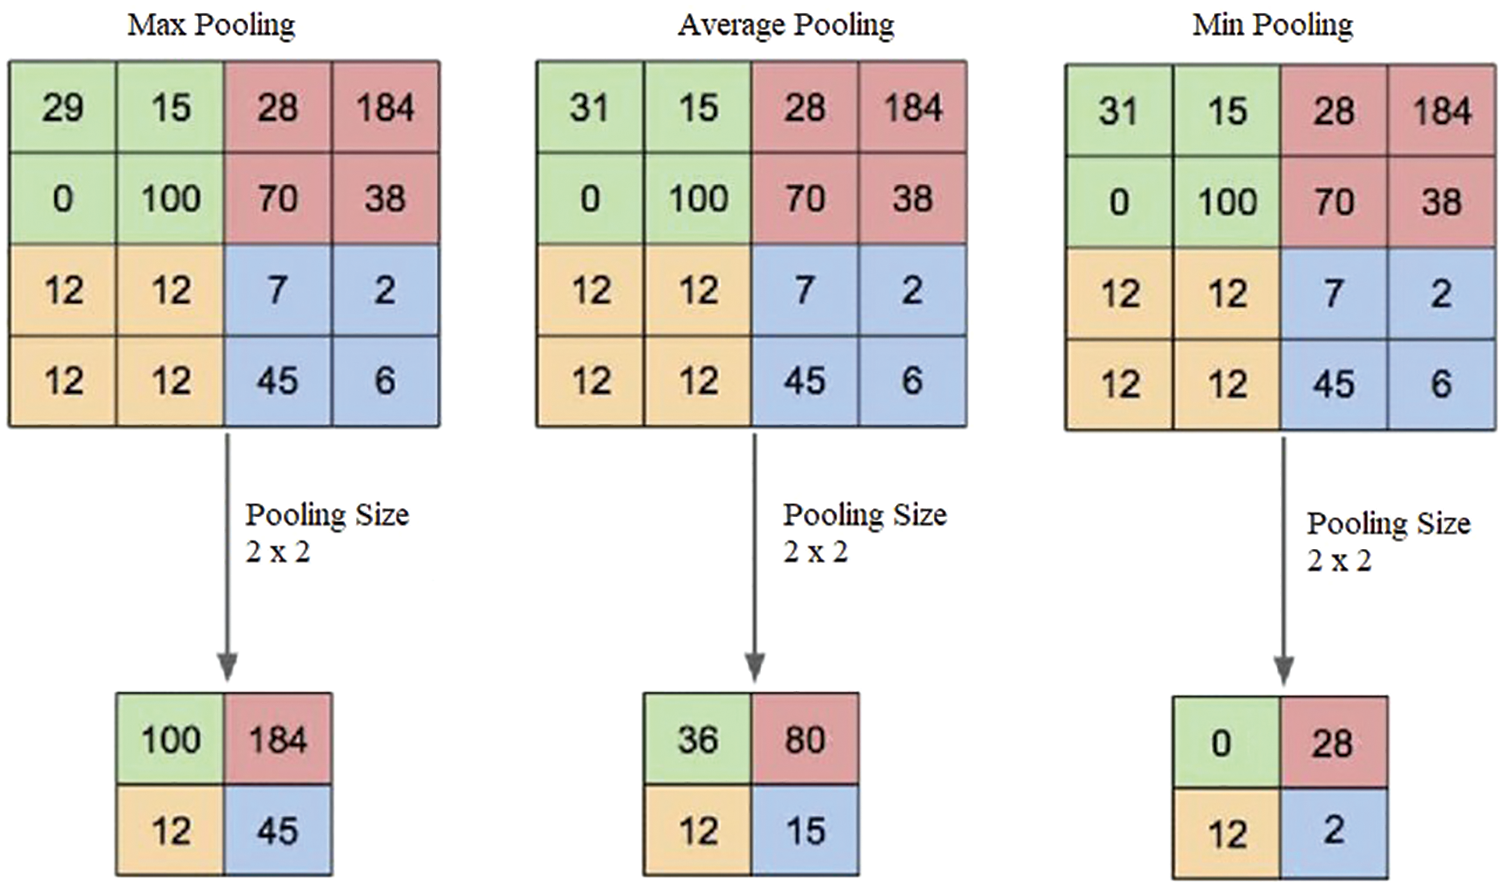
Figure 3: Pooling layer output description
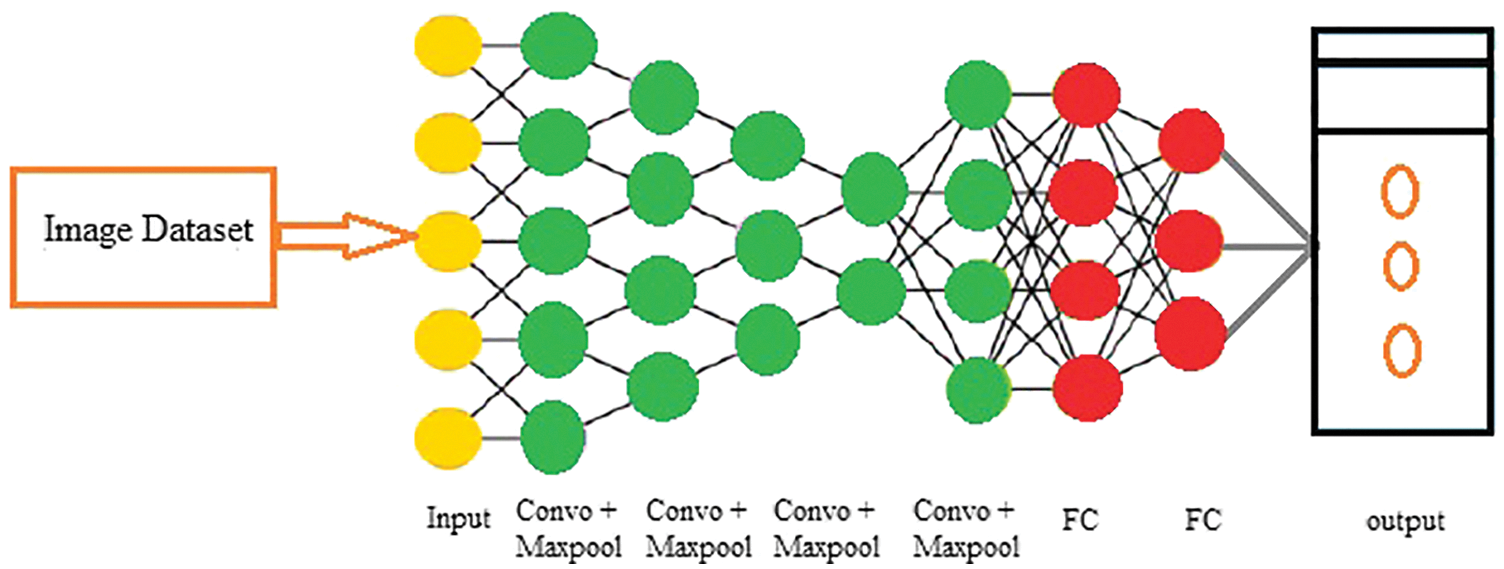
Figure 4: CNN architectural flow
3.3 Classification of Features
The feature extraction phase has been completed with a bag of matching features according to the specific classes. Then a pool of accurate features is developed to predict tumor classes [62]. Furthermore, ROI-based characteristics are also considered in terms of classification using the CNN model layers to create a map of similar and dissimilar features. The softmax layer layouts the feature data for the category; conversely, the fully connected layer is applied for the actual type.
3.4 Integration of Convolutional Neural Network with SVM
In this part, the integration process of a convolutional neural network with SVM has been explained. Initially, three CNN models with different layers, parametric functionalities, learning rates, strides, and filter sizes, as described in Tab. 1 and Fig. 6. The input images Y1, Y2, and Yn are fed into CNN models to start the model execution. The CNN models extract feature maps (EFM) and match them with the classified parameters. Finally, the CNN models output acts as an input for the integration of the SVM model to create output values as X to complete the model execution.

On the other hand, SVM is a supervised machine learning classifier that analyzes data for classification and regression purposes. These classifiers provide data for both input and output, which can use for classification. As SVM creates a learning model in which fresh instances are assigned to one of two groups of brain tumors with positive and negative hyperplanes, as shown in Fig. 5. Due to their functionalities, SVM is a non-probabilistic binary linear classifier, and represents learning techniques used in data analysis domains. In a binary classification problem, the SVM seeks to discover an ideal hyperplane that divides the data into two classes, as indicated by a subclass of samples called supporting vectors. SVM can tackle nonlinearly separable situations by altering the data with mapping kernel functions. Radial basis, polynomial and linear functions are among the tasks used. The value of hyperplane separation can be expressed as shown in Eq. (7), where v is the weighted vector, f is the feature vector, and b is the bias.
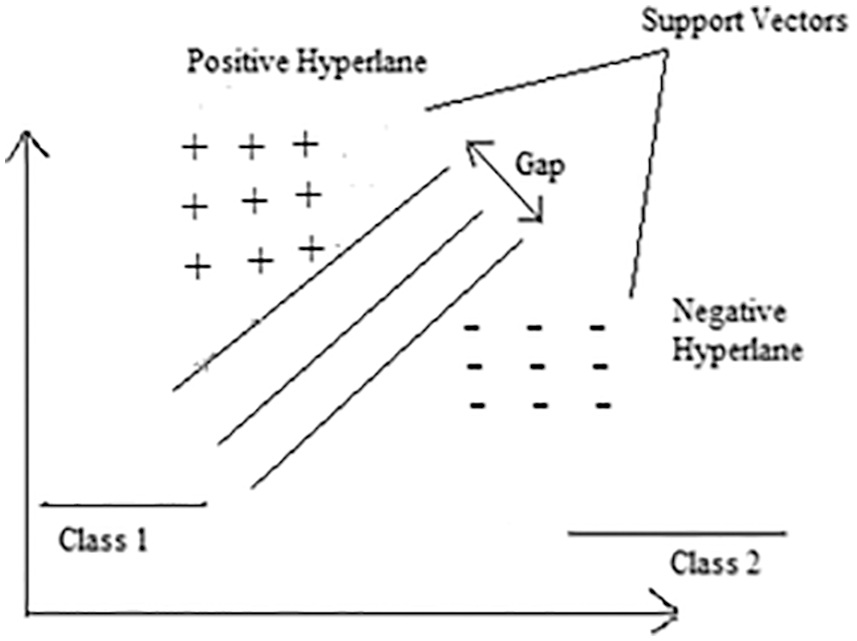
Figure 5: SVM architecture
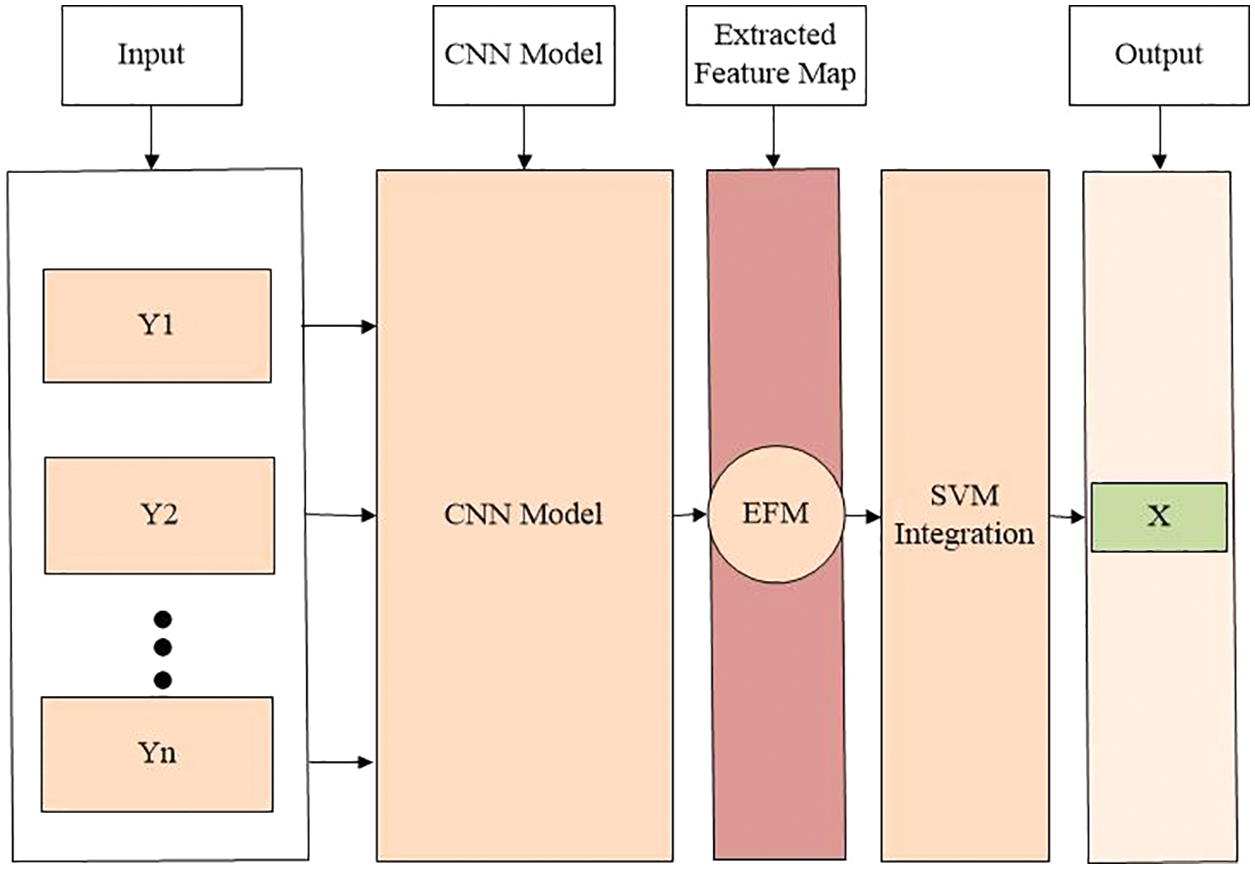
Figure 6: Proposed model architecture
Accordingly, the point nearest to the hyperplane is determined using Eq. (8).
The separating hyperplane equations for the two classes are given in Eqs. (9) and (10), where
The overall results are explained in this section with the different statistical measures known as sensitivity, specificity, precision, accuracy, and dice coefficient. The training and testing accuracy and loss are also calculated during the training and testing processes.
4.1 Dataset Description and Preprocessing
The brain tumor segmentation 2020 (BraTS2020) used for this research is publicly available https://www.kaggle.com/datasets/awsaf49/brats20-dataset-training-validation. It consists of different image folders such as training 249, validation 74, and testing 45. Each folder contains five NIfTI files (Flair, T1, T1ce, T2, and Seg). Each file contains 155 slices of image. Some data samples are shown in Fig. 7. In the preprocessing phase, the noise was removed from the images, the images were resized, and duplicates were removed. Overall, the dataset was separated into testing, training, and validation sets in ratios of 15%, 70%, and 15%, respectively. The dataset details are given in Tab. 2, along with the distribution.
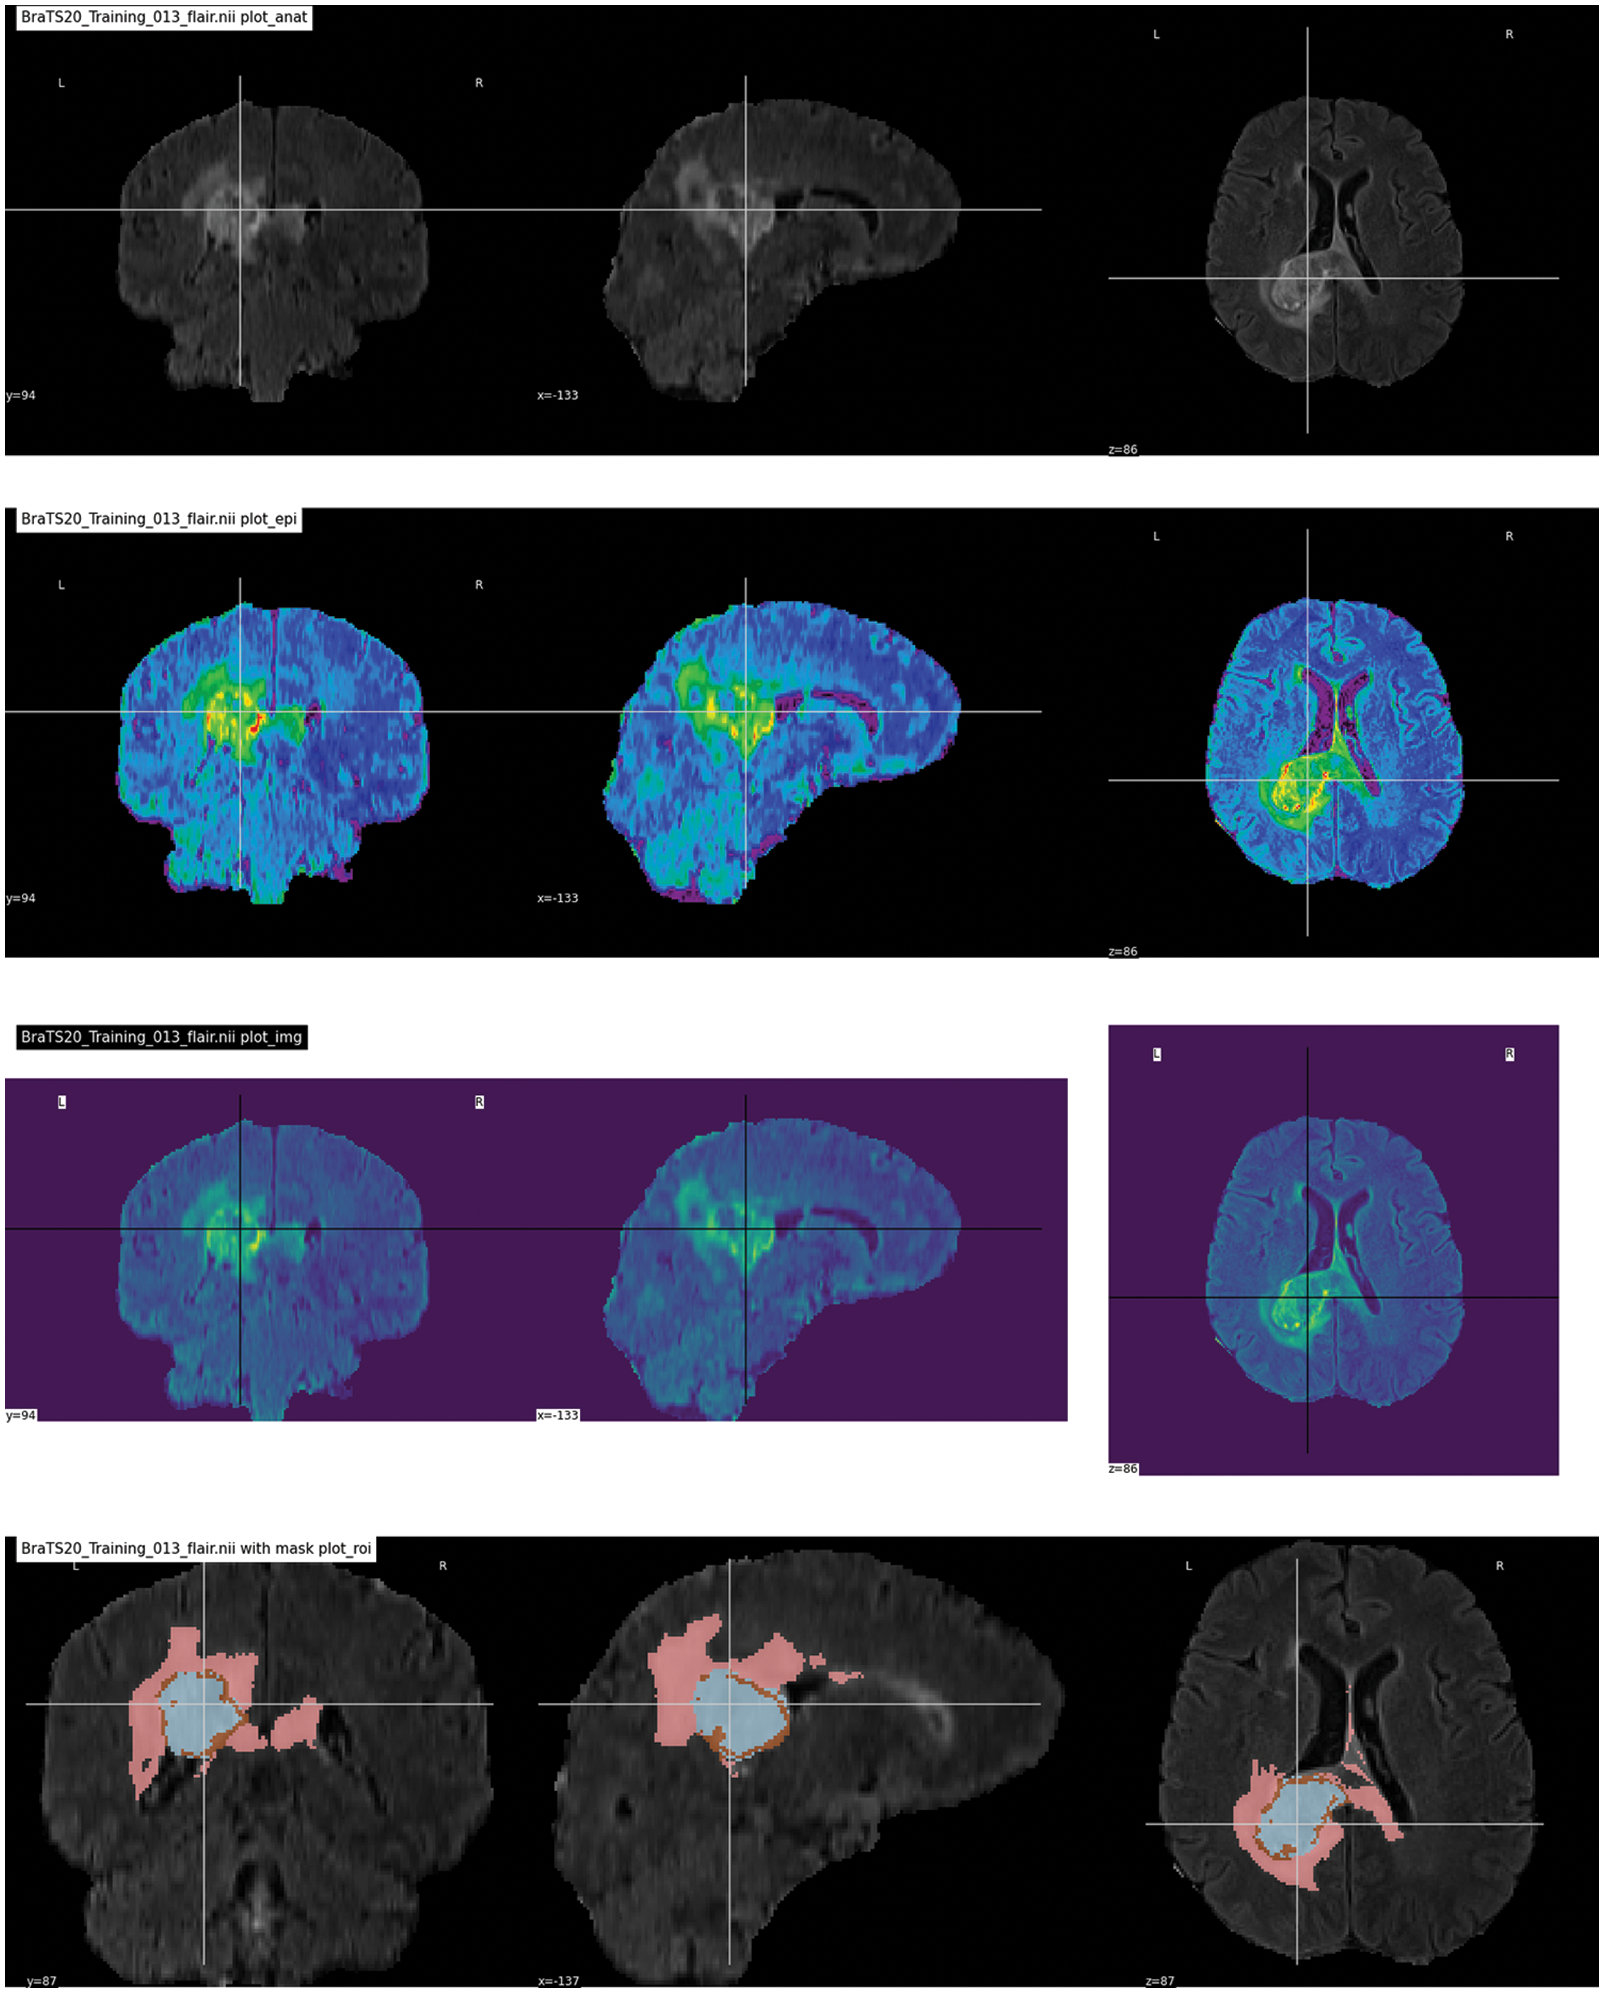
Figure 7: Dataset sample images

The accuracy, precision, sensitivity, specificity, and dice coefficient are the statistical terms used to evaluate the model.
• Accuracy: The term accuracy defines the overall model accuracy, which is the combination of true positive (Tp), true negative (Tn), false positive (Fp), and false negative (Fn) as shown in Eq. (11) and Fig. 8.
• Sensitivity: A model can correctly classify the images with positive values as true positive rates expressed in Eq. (12) and Fig. 9.
• Specificity: It is the ability of a model to correctly classify the images with negative classification values as false positive rate shown in Eq. (13) and Fig. 10.
• Precision: The precision is the ratio of true positive over true positive plus false positive as shown in Eq. (14) and Fig. 11.
• Dice Coefficient: The ratio of 2 multiplied by true positive over true positive plus false positive and true positive and false negative as shown in Eq. (15) and Fig. 12.
• Loss function: The number of lousy predictions occurs in a model during the model’s training process, as shown in Fig. 13.
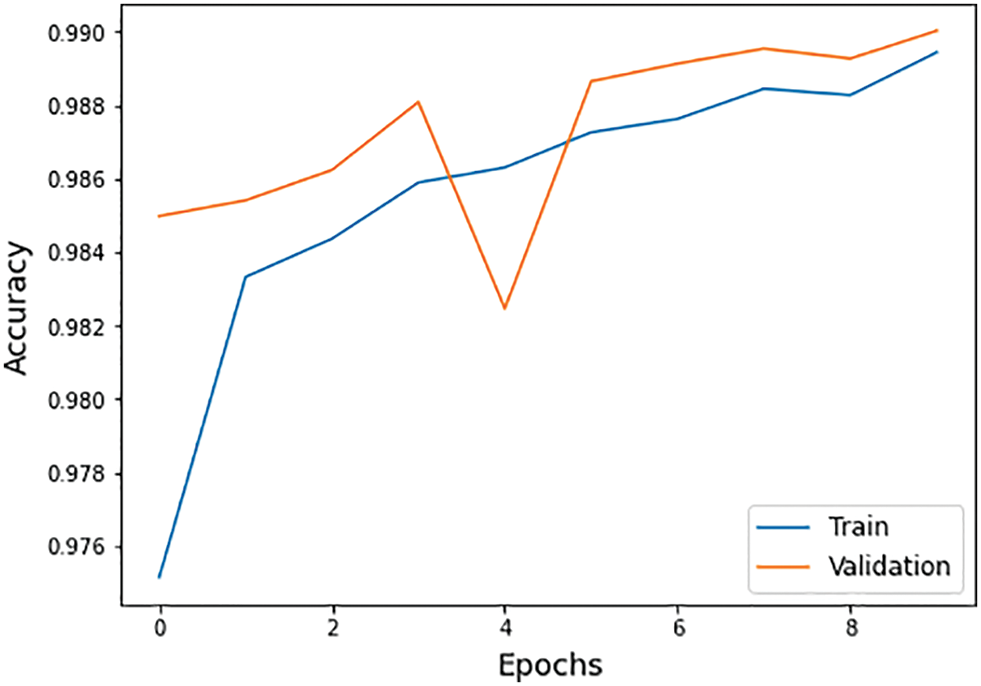
Figure 8: Accuracy graph of training and validation process
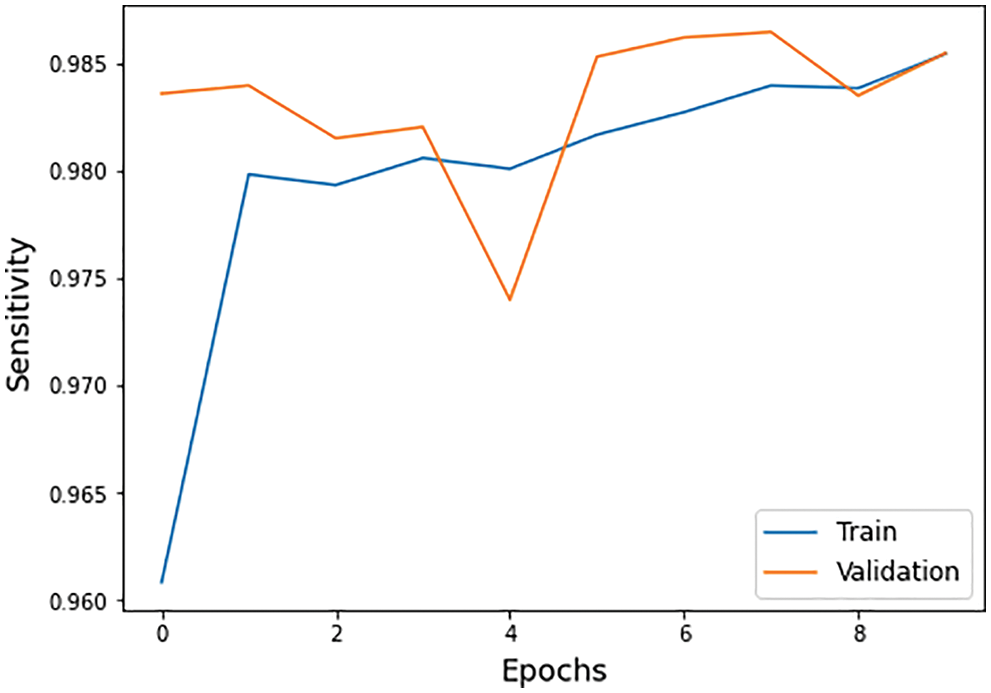
Figure 9: Sensitivity graph of training and validation process
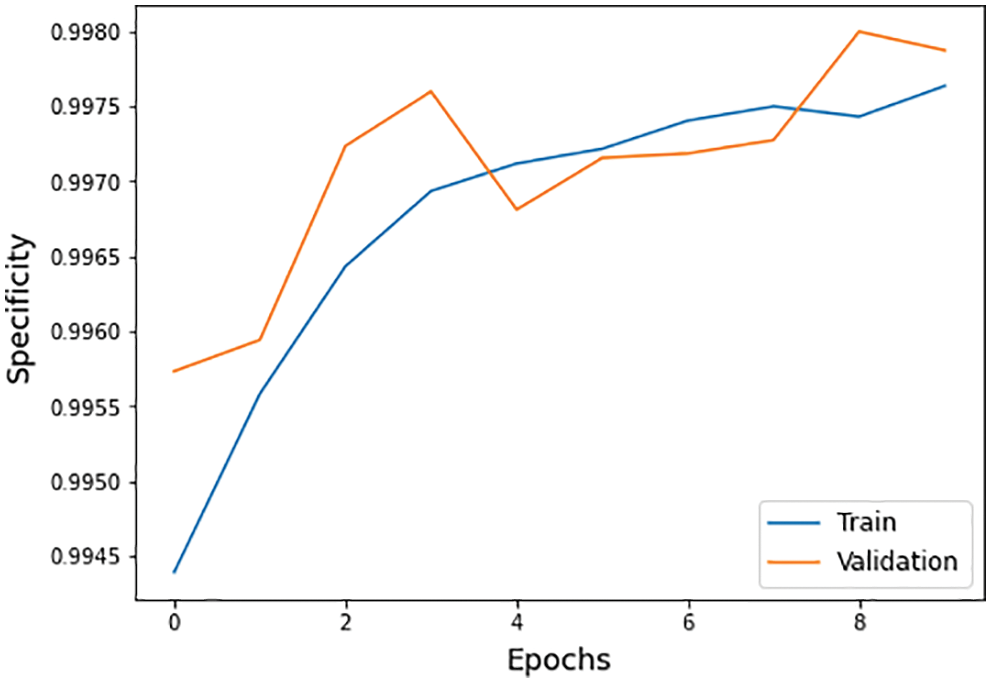
Figure 10: Specificity graph of training and validation process
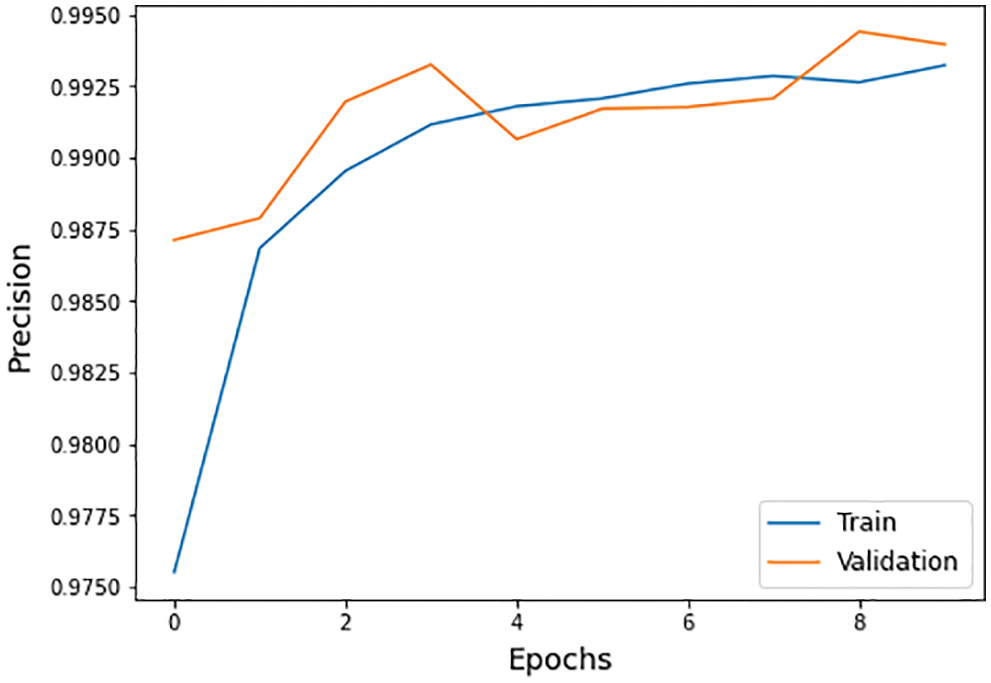
Figure 11: Precision graph of training and validation process
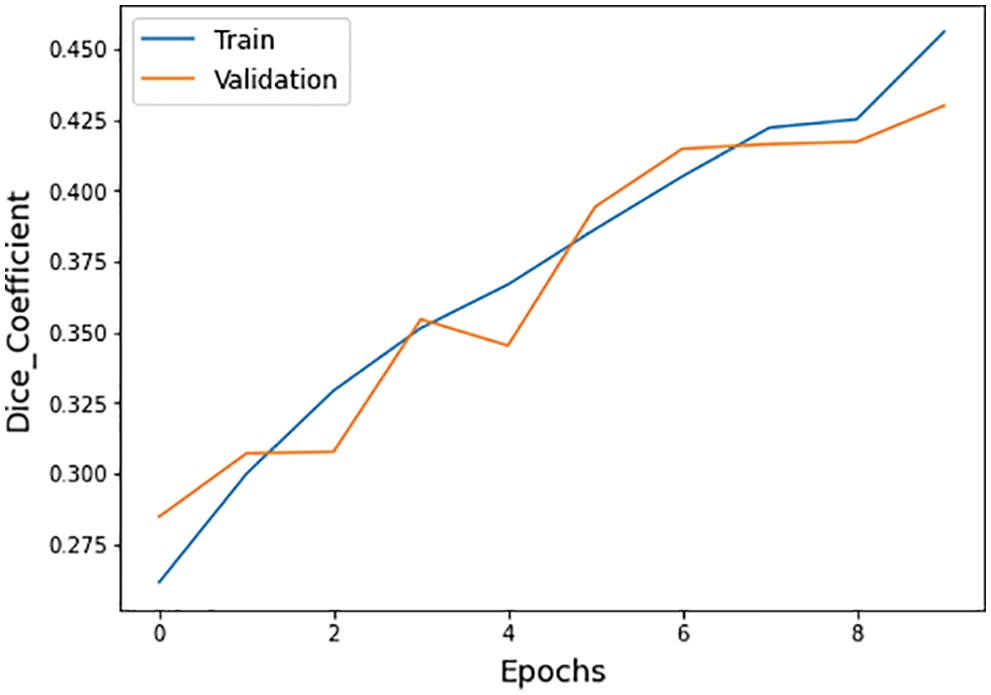
Figure 12: Dice coefficient graph of training and validation process
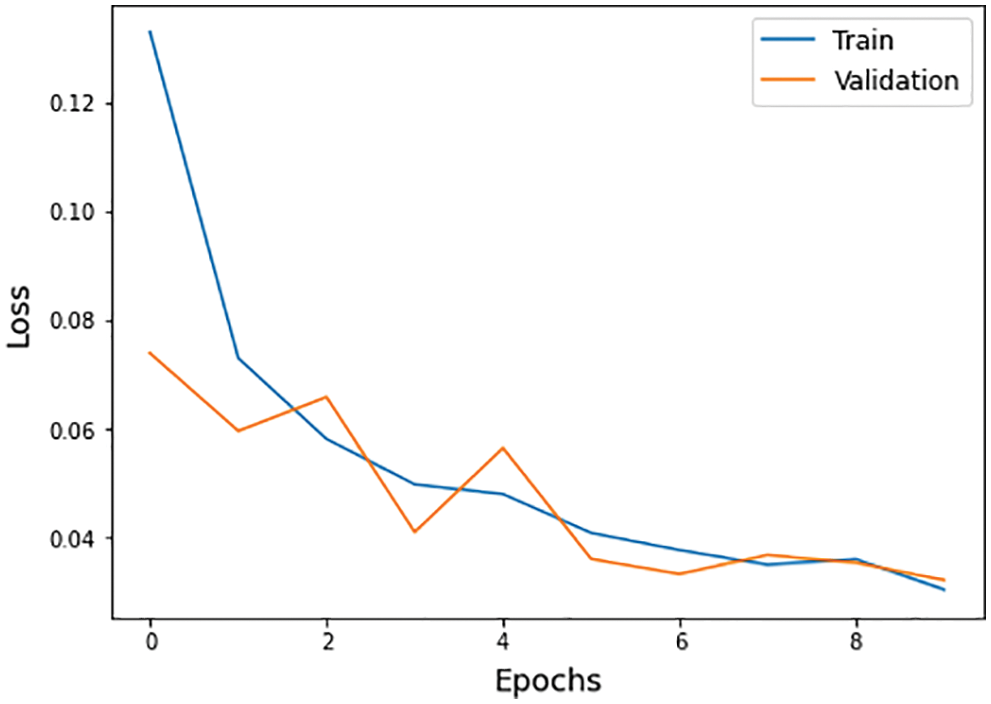
Figure 13: Loss function graph of training and validation process
The different statistical values are given in Tab. 4. These values represent different values related to loss, accuracy, dice coefficient, precision, sensitivity, and specificity. The accuracy value of 0.98 analysis is the highest value and remains constant during the maximum epoch sizes. The other statistical factors’ highest values are dice coefficient 0.46 on epoch number 9, precision is 0.99, and remains constant during the total epochs. On the other hand, the maximum sensitivity value is 0.99 on epoch number 9, and specificity is 0.99 and remains constant during complete epoch circle execution. During the whole process, the learning rate is 0.001, and other filters and parameters remain the same. The further details for all the statistical values are given in Tab. 3.


The other statistical values of the BraTS 2020 dataset are also defined in Tab. 4. There are three subtypes of the BraTS dataset known necrotic, edema, and enhancing. The necrotic is a wild type of cells death. Moreover, edema is a cancer type in which fluid buildup in the body tissues and swelling occur in different body parts. While enhancing type cancer cells increase in numbers, these are initially not cancer but may become cancer. The dice coefficient values for necrotic is 0.32, edema is 0.58, and for enhancing is 0.46 on epoch number 9 during the whole execution circle, as shown in Figs. 14–16.
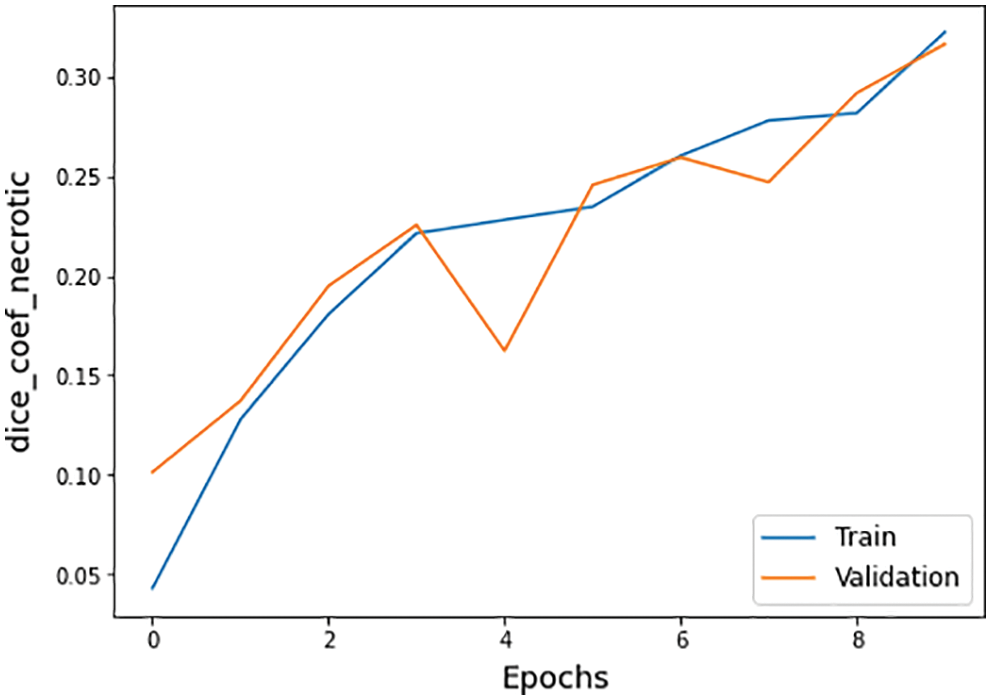
Figure 14: Dice coefficient necrotic graph of training and validation process
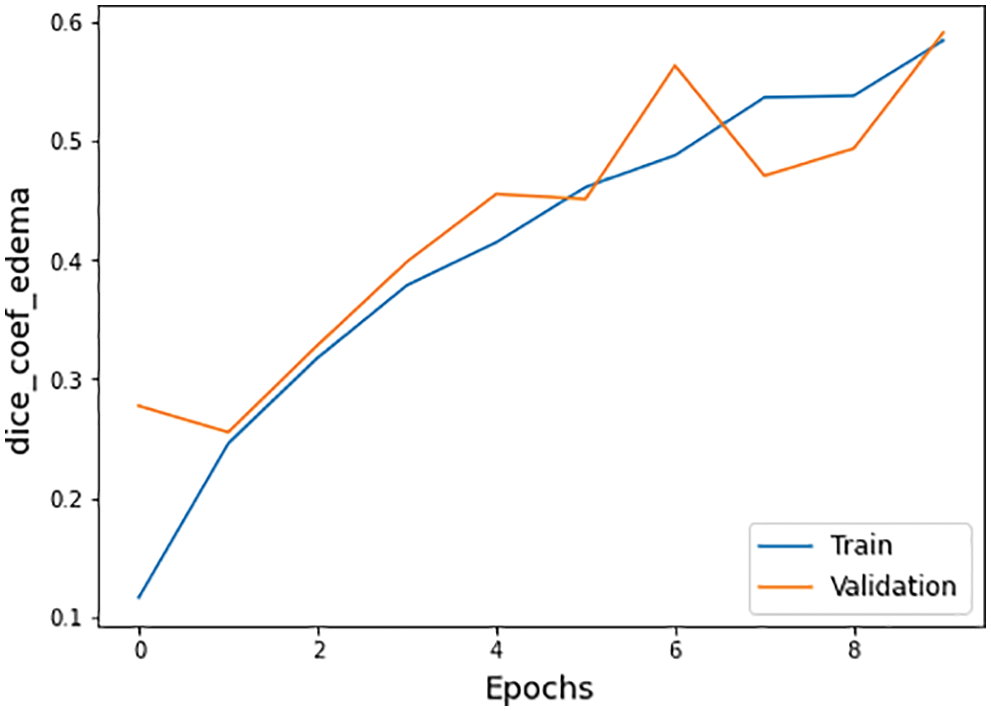
Figure 15: Dice coefficient edema graph of training and validation process
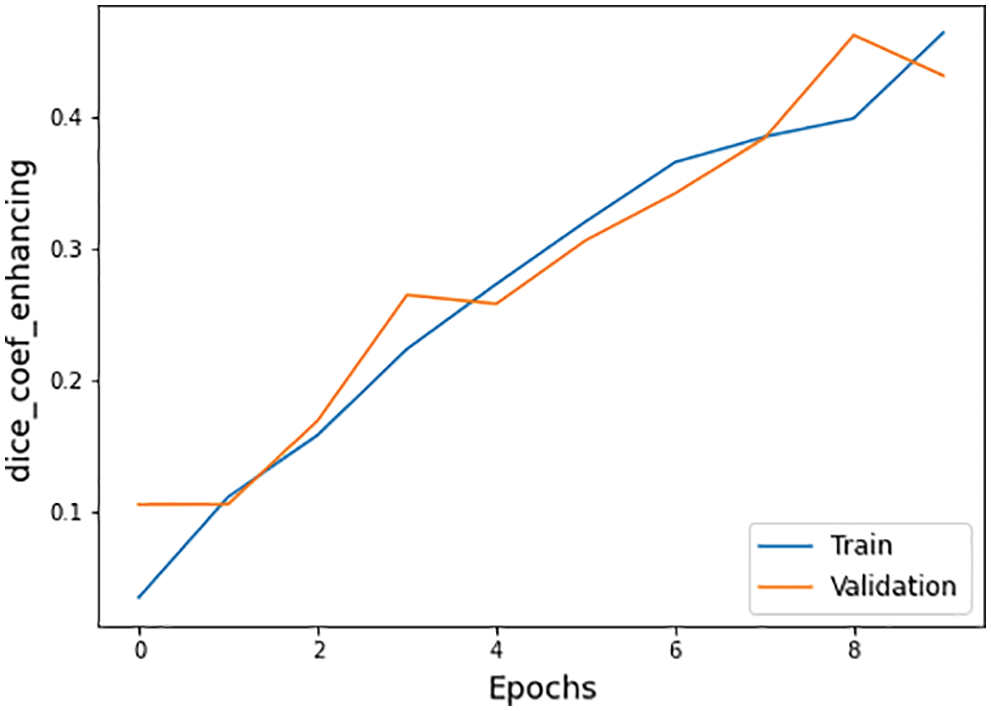
Figure 16: Dice coefficient enhancing graph of training and validation process
The comparison of all the existing techniques is also expressed in Tab. 5. Our proposed method indicates the best accuracy compared to the current methods on the BraTS2020 dataset. It shows an accuracy value of 0.98, the highest one compared to others. Therefore, the proposed technique is most suitable for helping the radiologist detect the early stages of brain tumor to save human lives.

A hybrid method for brain tumor classification and segmentation is proposed in this work. The main contribution of this work is the integration of convolutional neural network (CNN) with support vector machine (SVM) for diagnosis of brain tumor. The CNN models extract features and match them with the true labels. The CNN models output acts as an input for SVM model to auto segment the tumor region. A publicly available BraTS2020 dataset is used to evaluate the proposed work. Different statistical parameters like accuracy, sensitivity, specificity precision, and dice coefficient are used to calculate execution values. A comparison of the proposed work with the existing approaches revealed a significant improvement in accuracy achieved. Our work achieved a classification accuracy of 0.98, which is the most essential value as compared to the current techniques on the BraTS2020 dataset. As the proposed work is only tested on the BraTS2020 dataset, this technique may be used with other datasets of brain tumor to diagnose the sub-stages of brain tumors. As for future directions, the proposed techniques would be used for other datasets and assist in the medical fields.
Funding Statement: Authors would like to acknowledge the support of the Deputy for Research and Innovation-Ministry of Education, Kingdom of Saudi Arabia for funding this research through a Project (NU/IFC/ENT/01/014) under the institutional funding committee at Najran University, Kingdom of Saudi Arabia.
Conflicts of Interest: The authors declare that they have no conflicts of interest to report regarding the present study.
1. F. Ramzan, M. U. G. Khan, S. Iqbal, T. Saba and A. Rehman, “Volumetric segmentation of brain regions from MRI scans using 3D convolutional neural networks,” IEEE Access, vol. 8, no. 1, pp. 103697–103709, 2020. [Google Scholar]
2. A. Mittal, D. Kumar, M. Mittal, T. Saba, I. Abunadi et al., “Detecting pneumonia using convolutions and dynamic capsule routing for chest X-ray images,” Sensors, vol. 20, no. 4, pp. 1068–1097, 2020. [Google Scholar]
3. M. A. Khan, I. Ashraf, M. Alhaisoni, R. Damaševičius, R. Scherer et al., “Multimodal brain tumor classification using deep learning and robust feature selection: A machine learning application for radiologists,” Diagnostics, vol. 10, no. 8, pp. 565–584, 2020. [Google Scholar]
4. K. Ejaz, M. S. M. Rahim, A. Rehman, H. Chaudhry, T. Saba et al., “Segmentation method for pathological brain tumor and accurate detection using MRI,” International Journal of Advanced Computer Science and Applications, vol. 9, no. 8, pp. 394–401, 2018. [Google Scholar]
5. K. Ejaz, M. S. M. Rahim, U. I. Bajwa, H. Chaudhry, A. Rehman et al., “Hybrid segmentation method with confidence region detection for tumor identification,” IEEE Access, vol. 9, no. 1, pp. 35256–35278, 2021. [Google Scholar]
6. B. Tahir, S. Iqbal, M. Usman, T. Saba, Z. Mehmood et al., “Feature enhancement framework for brain tumor segmentation and classification,” Microscopy Research and Technique, vol. 82, no. 6, pp. 803–811, 2019. [Google Scholar]
7. M. Grade, J. A. Hernandez Tamames, F. B. Pizzini, E. Achten, X. Golay et al., “A neuroradiologist’s guide to arterial spin labeling MRI in clinical practice,” Neuroradiology, vol. 57, no. 12, pp. 1181–1202, 2015. [Google Scholar]
8. J. Amin, M. Sharif, M. Raza, T. Saba, R. Sial et al., “Brain tumor detection: A long short-term memory (LSTM)-based learning model,” Neural Computing & Applications, vol. 32, no. 20, pp. 15965–15973, 2020. [Google Scholar]
9. T. Saba, A. Sameh Mohamed, M. El-Affendi, J. Amin and M. Sharif, “Brain tumor detection using fusion of hand crafted and deep learning features,” Cognitive Systems Research, vol. 59, no, 1, pp. 221–230, 2020. [Google Scholar]
10. J. Amin, M. Sharif, M. Yasmin and S. L. Fernandes, “Big data analysis for brain tumor detection: Deep convolutional neural networks,” Future Generation Computer Systems, vol. 87, no. 10, pp. 290–297, 2018. [Google Scholar]
11. G. Litjens, T. Kooi, B. E. Bejnordi, A. A. A. Setio, F. Ciompi et al., “A survey on deep learning in medical image analysis,” Medical Image Analysis, vol. 42, no. 12, pp. 60–88, 2017. [Google Scholar]
12. M. Thayumanavan and A. Ramasamy, “An efficient approach for brain tumor detection and segmentation in MR brain images using random forest classifier,” Concurrent Engineering, Research, and Applications, vol. 29, no. 3, pp. 266–274, 2021. [Google Scholar]
13. R. Domingues, M. Filippone, P. Michiardi and J. Zouaoui, “A comparative evaluation of outlier detection algorithms: Experiments and analyses,” Pattern Recognition, vol. 74, no. 2, pp. 406–421, 2018. [Google Scholar]
14. J. Mitra, P. Bourgeat, J. Fripp, S. Ghose, S. Rose et al., “Lesion segmentation from multimodal MRI using random forest following ischemic stroke,” Neuroimage, vol. 98, no. 9, pp. 324–335, 2014. [Google Scholar]
15. K. Kamnitsas, C. Ledig, V. F. J. Newcombe, J. P. Simpson, A. D. Kane et al., “Efficient multi-scale 3D CNN with fully connected CRF for accurate brain lesion segmentation,” Medical Image Analysis, vol. 36, no. 1, pp. 61–78, 2017. [Google Scholar]
16. M. Havaei, A. Davy, D. Warde-Farley, A. Biard, A. Courville et al., “Brain tumor segmentation with deep neural networks,” Medical Image Analysis, vol. 35, no. 1, pp. 18–31, 2017. [Google Scholar]
17. A. de Brebisson and G. Montana, “Deep neural networks for anatomical brain segmentation,” in Proc. 2015 IEEE Conf. on Computer Vision and Pattern Recognition Workshops (CVPRW), Boston, MA, USA, pp. 20–28, 2015. [Google Scholar]
18. H. R. Roth, L. Lu, A. Seff, K. M. Cherry, J. Hoffman et al., “A new 25 D representation for lymph node detection using random sets of deep convolutional neural network observations,” Medical Image Computing and Computer Assisted Intervention, vol. 17, no. 1, pp. 520–527, 2014. [Google Scholar]
19. S. Deepak and P. M. Ameer, “Automated categorization of brain tumor from MRI using CNN features and SVM,” Journal of Ambient Intelligence and Humanized Computing, vol. 12, no. 8, pp. 8357–8369, 2021. [Google Scholar]
20. E. Geremia, B. H. Menze, O. Clatz, E. Konukoglu, A. Criminisi et al., “Spatial decision forests for MS lesion segmentation in multi-channel MR images,” Medical Image Computing and Computer Assisted Intervention, vol. 13, no. 1, pp. 111–118, 2010. [Google Scholar]
21. A. Rao, C. Ledig, V. Newcombe, D. Menon and D. Rueckert, “Contusion segmentation from subjects with traumatic brain injury: A random forest framework,” in Proc. 2014 IEEE 11th Int. Symp. on Biomedical Imaging, Beijing, China, pp. 333–336, 2014. [Google Scholar]
22. W. Wu, A. Y. C. Chen, L. Zhao and J. J. Corso, “Brain tumor detection and segmentation in a CRF (conditional random fields) framework with pixel-pairwise affinity and superpixel-level features,” International Journal of Computer Assisted Radiology and Surgery, vol. 9, no. 2, pp. 241–253, 2014. [Google Scholar]
23. T. Rajesh, R. S. M. Malar and M. R. Geetha, “Brain tumor detection using optimisation classification based on rough set theory,” Cluster Computing, vol. 22, no. S6, pp. 13853–13859, 2019. [Google Scholar]
24. J. Kleesiek, A. Biller, G. Urban, U. Kothe, M. Bendszus et al., “Ilastik for multi-modal brain tumor segmentation,” in Proc. Medical Image Computing and Computer Assisted Intervention BraTS, Boston, Massachusetts, pp. 12–17, 2014. [Google Scholar]
25. E. Abdel-Maksoud, M. Elmogy and R. Awadi, “Brain tumor segmentation based on a hybrid clustering technique,” Egyptian Informatics Journal, vol. 16, no. 1, pp. 71–81, 2015. [Google Scholar]
26. D. R. Nayak, R. Dash, X. Chang, B. Majhi and S. Bakshi, “Automated diagnosis of pathological brain using fast curvelet entropy features,” IEEE Transactions on Sustainable Computing, vol. 5, no. 3, pp. 416–427, 2020. [Google Scholar]
27. D. Yamamoto, H. Arimura, S. Kakeda, T. Magome, Y. Yamashita et al., “Computer-aided detection of multiple sclerosis lesions in brain magnetic resonance images: False positive reduction scheme consisted of rule-based, level set method, and support vector machine,” Computerized Medical Imaging and Graphics, vol. 34, no. 5, pp. 404–413, 2010. [Google Scholar]
28. A. Gudigar, U. Raghavendra, T. R. San, E. J. Ciaccio and U. R. Acharya, “Application of multiresolution analysis for automated detection of brain abnormality using MR images: A comparative study,” Future Generation Computer Systems, vol. 90, no. 1, pp. 359–367, 2019. [Google Scholar]
29. E. -S. A. El-Dahshan, T. Hosny and A. -B. M. Salem, “Hybrid intelligent techniques for MRI brain images classification,” Digital Signal Processing, vol. 20, no. 2, pp. 433–441, 2010. [Google Scholar]
30. M. Graña, “Computer aided diagnosis system for Alzheimer disease using brain diffusion tensor imaging features selected by Pearson’s correlation,” Neuroscience Letters, vol. 502, no. 3, pp. 225–229, 2011. [Google Scholar]
31. I. Cabria and I. Gondra, “MRI segmentation fusion for brain tumor detection,” Information Fusion, vol. 36, no. 3, pp. 1–9, 2017. [Google Scholar]
32. D. Haritha, “Comparative study on brain tumor detection techniques,” in Proc. 2016 Int. Conf. on Signal Processing, Communication, Power and Embedded System (SCOPES), Paralakhemundi, India, pp. 1387–1392, 2016. [Google Scholar]
33. A. Rehman, M. A. Khan, T. Saba, Z. Mehmood, U. Tariq et al., “Microscopic brain tumor detection and classification using 3D CNN and feature selection architecture,” Microscopy Research and Technique, vol. 84, no. 1, pp. 133–149, 2021. [Google Scholar]
34. V. Zeljkovic, C. Druzgalski, Y. Zhang, Z. Zhu, Z. Xu et al., “Automatic brain tumor detection and segmentation in MR images,” in Proc. 2014 Pan American Health Care Exchanges (PAHCE), Brasilia, Brazil, pp. 1, 2014. [Google Scholar]
35. K. Usman and K. Rajpoot, “Brain tumor classification from multi-modality MRI using wavelets and machine learning,” Pattern Analysis and Applications, vol. 20, no. 3, pp. 871–881, 2017. [Google Scholar]
36. P. M. Shakeel, T. E. E. Tobely, H. Al-Feel, G. Manogaran and S. Baskar, “Neural network based brain tumor detection using wireless infrared imaging sensor,” IEEE Access, vol. 7, no. 1, pp. 5577–5588, 2019. [Google Scholar]
37. J. Amin, M. Sharif, M. Raza, T. Saba and M. A. Anjum, “Brain tumor detection using statistical and machine learning method,” Computer Methods and Programs in Biomedicine, vol. 177, no. 8, pp. 69–79, 2019. [Google Scholar]
38. M. S. Alam, M. M. Rahman, M. A. Hossain, M. K. Islam, K. M. Ahmed et al., “Automatic human brain tumor detection in MRI image using template-based K means and improved fuzzy C means clustering algorithm,” Big Data and Cognitive Computing, vol. 3, no. 2, pp. 1–27, 2019. [Google Scholar]
39. J. Amin, M. Sharif, M. Yasmin and S. L. Fernandes, “A distinctive approach in brain tumor detection and classification using MRI,” Pattern Recognition Letters, vol. 139, no. 11, pp. 118–127, 2020. [Google Scholar]
40. M. Toğaçar, B. Ergen and Z. Cömert, “BrainMRNet: Brain tumor detection using magnetic resonance images with a novel convolutional neural network model,” Medical Hypotheses, vol. 134, no. 109531, pp. 109531, 2020. [Google Scholar]
41. A. Singh, S. Bajpai, S. Karanam, A. Choubey and T. Raviteja, “Malignant brain tumor detection,” International Journal of Computer Theory and Engineering, vol. 4, no. 6, pp. 1002–1006, 2012. [Google Scholar]
42. T. Hossain, F. S. Shishir, M. Ashraf, M. D. A. Al Nasim and F. Muhammad Shah, “Brain tumor detection using convolutional neural network,” in Proc. 2019 1st Int. Conf. on Advances in Science, Engineering and Robotics Technology (ICASERT), Dhaka, Bangladesh, pp. 1–6, 2019. [Google Scholar]
43. F. Özyurt, E. Sert, E. Avci and E. Dogantekin, “Brain tumor detection based on convolutional neural network with neutrosophic expert maximum fuzzy sure entropy,” Measurement, vol. 147, no. 106830, pp. 106830, 2019. [Google Scholar]
44. M. Aamir, T. Ali, A. Shaf, M. Irfan and M. Q. Saleem, “ML-DCNNet: Multi-level deep convolutional neural network for facial expression recognition and intensity estimation,” Arabian Journal for Science and Engineering, vol. 45, no. 12, pp. 10605–10620, 2020. [Google Scholar]
45. S. Sajid, S. Hussain and A. Sarwar, “Brain tumor detection and segmentation in MR images using deep learning,” Arabian Journal for Science and Engineering, vol. 44, no. 11, pp. 9249–9261, 2019. [Google Scholar]
46. M. Aamir, M. Irfan, T. Ali, G. Ali, A. Shaf et al., “An adoptive threshold-based multi-level deep convolutional neural network for glaucoma eye disease detection and classification,” Diagnostics, vol. 10, no. 8, pp. 602, 2020. [Google Scholar]
47. M. Woźniak, J. Siłka and M. Wieczorek, “Deep neural network correlation learning mechanism for CT brain tumor detection,” Neural Computing and Applications, vol. 33, no. 5, pp. 1–16, 2021. [Google Scholar]
48. M. Aamir, T. Ali, M. Irfan, A. Shaf, M. Z. Azam et al., “Natural disasters intensity analysis and classification based on multispectral images using multi-layered deep convolutional neural network,” Sensors, vol. 21, no. 8, pp. 2648, 2021. [Google Scholar]
49. A. U. Gondal, M. I. Sadiq, T. Ali, M. Irfan, A. Shaf et al., “Real time multipurpose smart waste classification model for efficient recycling in smart cities using multilayer convolutional neural network and perceptron,” Sensors, vol. 21, no. 14, pp. 4916, 2021. [Google Scholar]
50. M. S. Majib, M. M. Rahman, T. M. S. Sazzad, N. I. Khan and S. K. Dey, “VGG-SCNet: A VGG net-based deep learning framework for brain tumor detection on MRI images,” IEEE Access, vol. 9, no. 1, pp. 116942–116952, 2021. [Google Scholar]
51. F. Özyurt, E. Sert and D. Avcı, “An expert system for brain tumor detection: Fuzzy C-means with super resolution and convolutional neural network with extreme learning machine,” Medical Hypotheses, vol. 134, no. 109433, pp. 109433, 2020. [Google Scholar]
52. N. F. Abubacker, A. Azman and M. A. A. Murad, “An improved peripheral enhancement of mammogram images by using filtered region growing segmentation,” Journal of Theoretical & Applied Information Technology, vol. 95, no. 14, pp. 1–11, 2017. [Google Scholar]
53. Z. Gao, Y. Li, Y. Yang, X. Wang, N. Dong et al., “A GPSO-optimized convolutional neural networks for EEG-based emotion recognition,” Neurocomputing, vol. 380, no. 5, pp. 225–235, 2020. [Google Scholar]
54. R. M. Ghoniem, “A novel bio-inspired deep learning approach for liver cancer diagnosis,” Information (Basel), vol. 11, no. 2, pp. 80, 2020. [Google Scholar]
55. A. Krizhevsky, I. Sutskever and G. E. Hinton, “ImageNet classification with deep convolutional neural networks,” Communications of the ACM, vol. 60, no. 6, pp. 84–90, 2017. [Google Scholar]
56. Y. Li, N. Wang, J. Shi, J. Liu and X. Hou, “Revisiting batch normalization for practical domain adaptation,” arXiv:1603.04779 [cs.CV], 2016. [Online]. Available: https://arxiv.org/abs/1603.04779). [Google Scholar]
57. J. Cao, Y. Pang, X. Li and J. Liang, “Randomly translational activation inspired by the input distributions of ReLU,” Neurocomputing, vol. 275, no. 1, pp. 859–868, 2018. [Google Scholar]
58. H. J. Jie and P. Wanda, “RunPool: A dynamic pooling layer for convolution neural network,” International Journal of Computational Intelligence Systems, vol. 13, no. 1, pp. 66, 2020. [Google Scholar]
59. B. Yuan, “Efficient hardware architecture of softmax layer in deep neural network,” in Proc. 2016 29th IEEE Int. System-on-Chip Conf. (SOCC), Shanghai, China, pp. 1–5, 2016. [Google Scholar]
60. K. Liu, G. Kang, N. Zhang and B. Hou, “Breast cancer classification based on fully-connected layer first convolutional neural networks,” IEEE Access, vol. 6, no. 1, pp. 23722–23732, 2018. [Google Scholar]
61. O. Deperlioglu, “Classification of phonocardiograms with convolutional neural networks,” BRAIN. Broad Research in Artificial Intelligence and Neuroscience, vol. 9, no. 2, pp. 22–33, 2018. [Google Scholar]
62. M. Mohammed, H. Mwambi, I. B. Mboya, M. K. Elbashir and B. Omolo, “A stacking ensemble deep learning approach to cancer type classification based on TCGA data,” Scientific Reports, vol. 11, no. 1, pp. 15626, 2021. [Google Scholar]
63. S. Iqbal, M. U. Ghani Khan, T. Saba, Z. Mehmood, N. Javaid et al., “Deep learning model integrating features and novel classifiers fusion for brain tumor segmentation,” Microscopy Research and Technique, vol. 82, no. 8, pp. 1302–1315, 2019. [Google Scholar]
64. M. Sajjad, S. Khan, K. Muhammad, W. Wu, A. Ullah et al., “Multi-grade brain tumor classification using deep CNN with extensive data augmentation,” Journal of Computational Science, vol. 30, no. 1, pp. 174–182, 2019. [Google Scholar]
65. V. Wasule and P. Sonar, “Classification of brain MRI using SVM and KNN classifier,” in Proc. 2017 Third Int. Conf. on Sensing, Signal Processing and Security (ICSSS), Chennai, India, pp. 218–223, 2017. [Google Scholar]
66. K. B. Vaishnavee and K. Amshakala, “An automated MRI brain image segmentation and tumor detection using SOM-clustering and proximal support vector machine classifier,” in Proc. 2015 IEEE Int. Conf. on Engineering and Technology (ICETECH), Coimbatore, India, pp. 1–6, 2015. [Google Scholar]
 | This work is licensed under a Creative Commons Attribution 4.0 International License, which permits unrestricted use, distribution, and reproduction in any medium, provided the original work is properly cited. |