DOI:10.32604/cmc.2022.027017
| Computers, Materials & Continua DOI:10.32604/cmc.2022.027017 | |
| Article |
Underwater Terrain Image Stitching Based on Spatial Gradient Feature Block
1School of Information Science and Engineering, Hebei University of Science and Technology, Shijiazhuang, 050018, China
2Case Western Reserve University, Cleveland, 44106, USA
*Corresponding Author: Xiang Wang. Email: wangxiang@hebust.edu.cn
Received: 08 January 2022; Accepted: 04 March 2022
Abstract: At present, underwater terrain images are all strip-shaped small fragment images preprocessed by the side-scan sonar imaging system. However, the processed underwater terrain images have inconspicuous and few feature points. In order to better realize the stitching of underwater terrain images and solve the problems of slow traditional image stitching speed, we proposed an improved algorithm for underwater terrain image stitching based on spatial gradient feature block. First, the spatial gradient fuzzy C-Means algorithm is used to divide the underwater terrain image into feature blocks with the fusion of spatial gradient information. The accelerated-KAZE (A-KAZE) algorithm is used to combine the feature block information to match the reference image and the target image. Then, the random sample consensus (RANSAC) is applied to optimize the matching results. Finally, image fusion is performed with the global homography and the optimal seam-line method to improve the accuracy of image overlay fusion. The experimental results show that the proposed method in this paper effectively divides images into feature blocks by combining spatial information and gradient information, which not only solves the problem of stitching failure of underwater terrain images due to unobvious features, and further reduces the sensitivity to noise, but also effectively reduces the iterative calculation in the feature point matching process of the traditional method, and improves the stitching speed. Ghosting and shape warping are significantly eliminated by re-optimizing the overlap of the image.
Keywords: Underwater terrain images; image stitching; feature block; fuzzy C-means; spatial gradient information; A-KAZE
Underwater topographic analysis plays a very important role in river basin management and development, water resources utilization, flood control and drought relief guarantee system, safety construction and planning of waterway, and the construction and management of water conservancy projects [1–3]. It is very important for the exploration of underwater resources to master the situation, dynamic change and exploitable potential of terrain in an area [4–8]. The current underwater terrain images are obtained by side-scan sonar data acquisition and processing. After pre-processing, the side-scan sonar images are only partial fragment images, which need to be matched and stitched in order to get a full range of underwater topographic scenery. However, the grayscale values of each point of the side-scan sonar image is related to the intensity of the echo signal [9]. The target is analyzed by judging the surrounding image and its shadow relationship. Compared with natural optical images, these images have the characteristics of less features, less obvious features and more noise, which affect the efficiency of image matching and stitching. Therefore, it is very important to select an appropriate stitching method to obtain higher quality underwater terrain images.
Image stitching technology aims to stitch multiple images taken in different directions, at different times, and locations to obtain a wide-view, high-resolution panoramic image [10]. In recent years, the commonly applied feature-based registration methods include the scale invariant feature transform (SIFT), speeded-up robust features (SURF), A-KAZE, etc. [11]. However, the SURF algorithm, like the SIFT algorithm, requires the establishment of high-dimensional descriptors, which requires a large amount of memory space and a long operation time. A-KAZE [12] is a fast and good matching algorithm. In a large number of studies, these traditional methods have been improved and applied.
At present, a large number of studies have been carried out to achieve stitching of side-scan sonar underwater image that produces images with complete information and high quality. Vandrish et al. [13] showed that the scale invariant feature transform (SIFT) algorithm can be used for the registration of sonar images, although the accuracy was not ideal. Wang et al. [14] improved the pre-processing method of side-scan sonar images to extract feature points more accurately and effectively after preprocessing; they also proposed a speeded-up robust features (SURF)-based elastic mosaic algorithm to achieve feature-level conformal mosaic of the images. Moreover, Chailloux et al. [15] extracted a series of significantly correlated areas on adjacent strip images and calculated the global rigid transformation parameters and local elastic transformation parameters, thereby eventually realizing mosaic of adjacent strip images. Zhao et al. [16] extracted SURF features of the pre-processed strip images and then performed block registration, which achieved good mosaic results. To obtain sonar images of large-area seafloor surface, Zhao et al. [17] also proposed a side-scan image mosaicking method based on the coupling feature points of position constraints. In addition, He et al. [18] used the unsharp masking (USM) algorithm to enhance the side-scan images and the SURF algorithm for image mosaicking; experiments showed that their method effectively enhanced image features and increased the amount of image information, but the average gray values of the images were affected. Shang et al. [19] used the SURF algorithm to match the multi-beam side-deep sonar image with the side-scan sonar image, but this method is only suitable for the stable and obvious features in the side-scan sonar image to achieve the matching effect.
Due to the complicated marine environment in the process of marine exploration [20], the differences in image resolution need to be considered in the process of underwater terrain image stitching, and the necessary information is screened in the blurred image while retaining clear image information. Moreover, the traditional image extraction feature is to extract the feature points of the entire reference image and the target image, and search for the feature points in the global domain, which increases the time complexity. In order to improve the efficiency of image stitching, the main contributions of the improved image stitching method proposed in this paper are summarized as follows:
(1) The feature block algorithm of fuzzy C-Means (FCM) before image stitching is improved, and the average gradient of adjacent regions is used as the associated information between the regions, which solves the problem of ineffective blocking between adjacent gray areas in the background of underwater terrain images and reduces incorrect classification by combining spatial information functions.
(2) Most existing methods use the SIFT method to compute feature points directly. From the perspective of feature blocks, we have changed the process of traditional image stitching. First, the image feature is divided into blocks and then combined with the A-KAZE algorithm and the random sample consensus (RANSAC) [21] for image matching, and the feature blocks are registered and fused with the global homography [22] and the optimal seam-line method, which improves the image stitching speed and optimizes the image quality.
The rest of this article is organized as follows: Part 2 describes the image segmentation using the improved FCM algorithm to determine the feature overlap area, and describes the image matching and stitching of the overlap area after feature block. Part 3 shows the results of the proposed method. Part 4 discusses and summarizes our work.
We proposed an underwater terrain image stitching method based on the spatial gradient fuzzy C-Means (SPGFCM) feature block. The method of fuzzy C-Means (FCM) feature clustering was improved by combining gradient information with spatial information, and the pixels with common visual features in the image are effectively divided into feature blocks. Matching images at the feature block level can effectively reduce the data calculation process. As shown in the second part of Fig. 1, the divided image is matched with cluster feature blocks using the A-KAZE algorithm, which constructs a nonlinear scale space, filters out noise through nonlinear diffusion filtering, and retains the detailed information of the image. The RANSAC algorithm is used to optimize the result of matching, which effectively reduces the iterative process of feature point matching and homography calculation, and solves the problem of noise affecting the quality of image stitching. The last step is image fusion using optimal seam-line method. Fig. 1 shows the overall flow of our method.
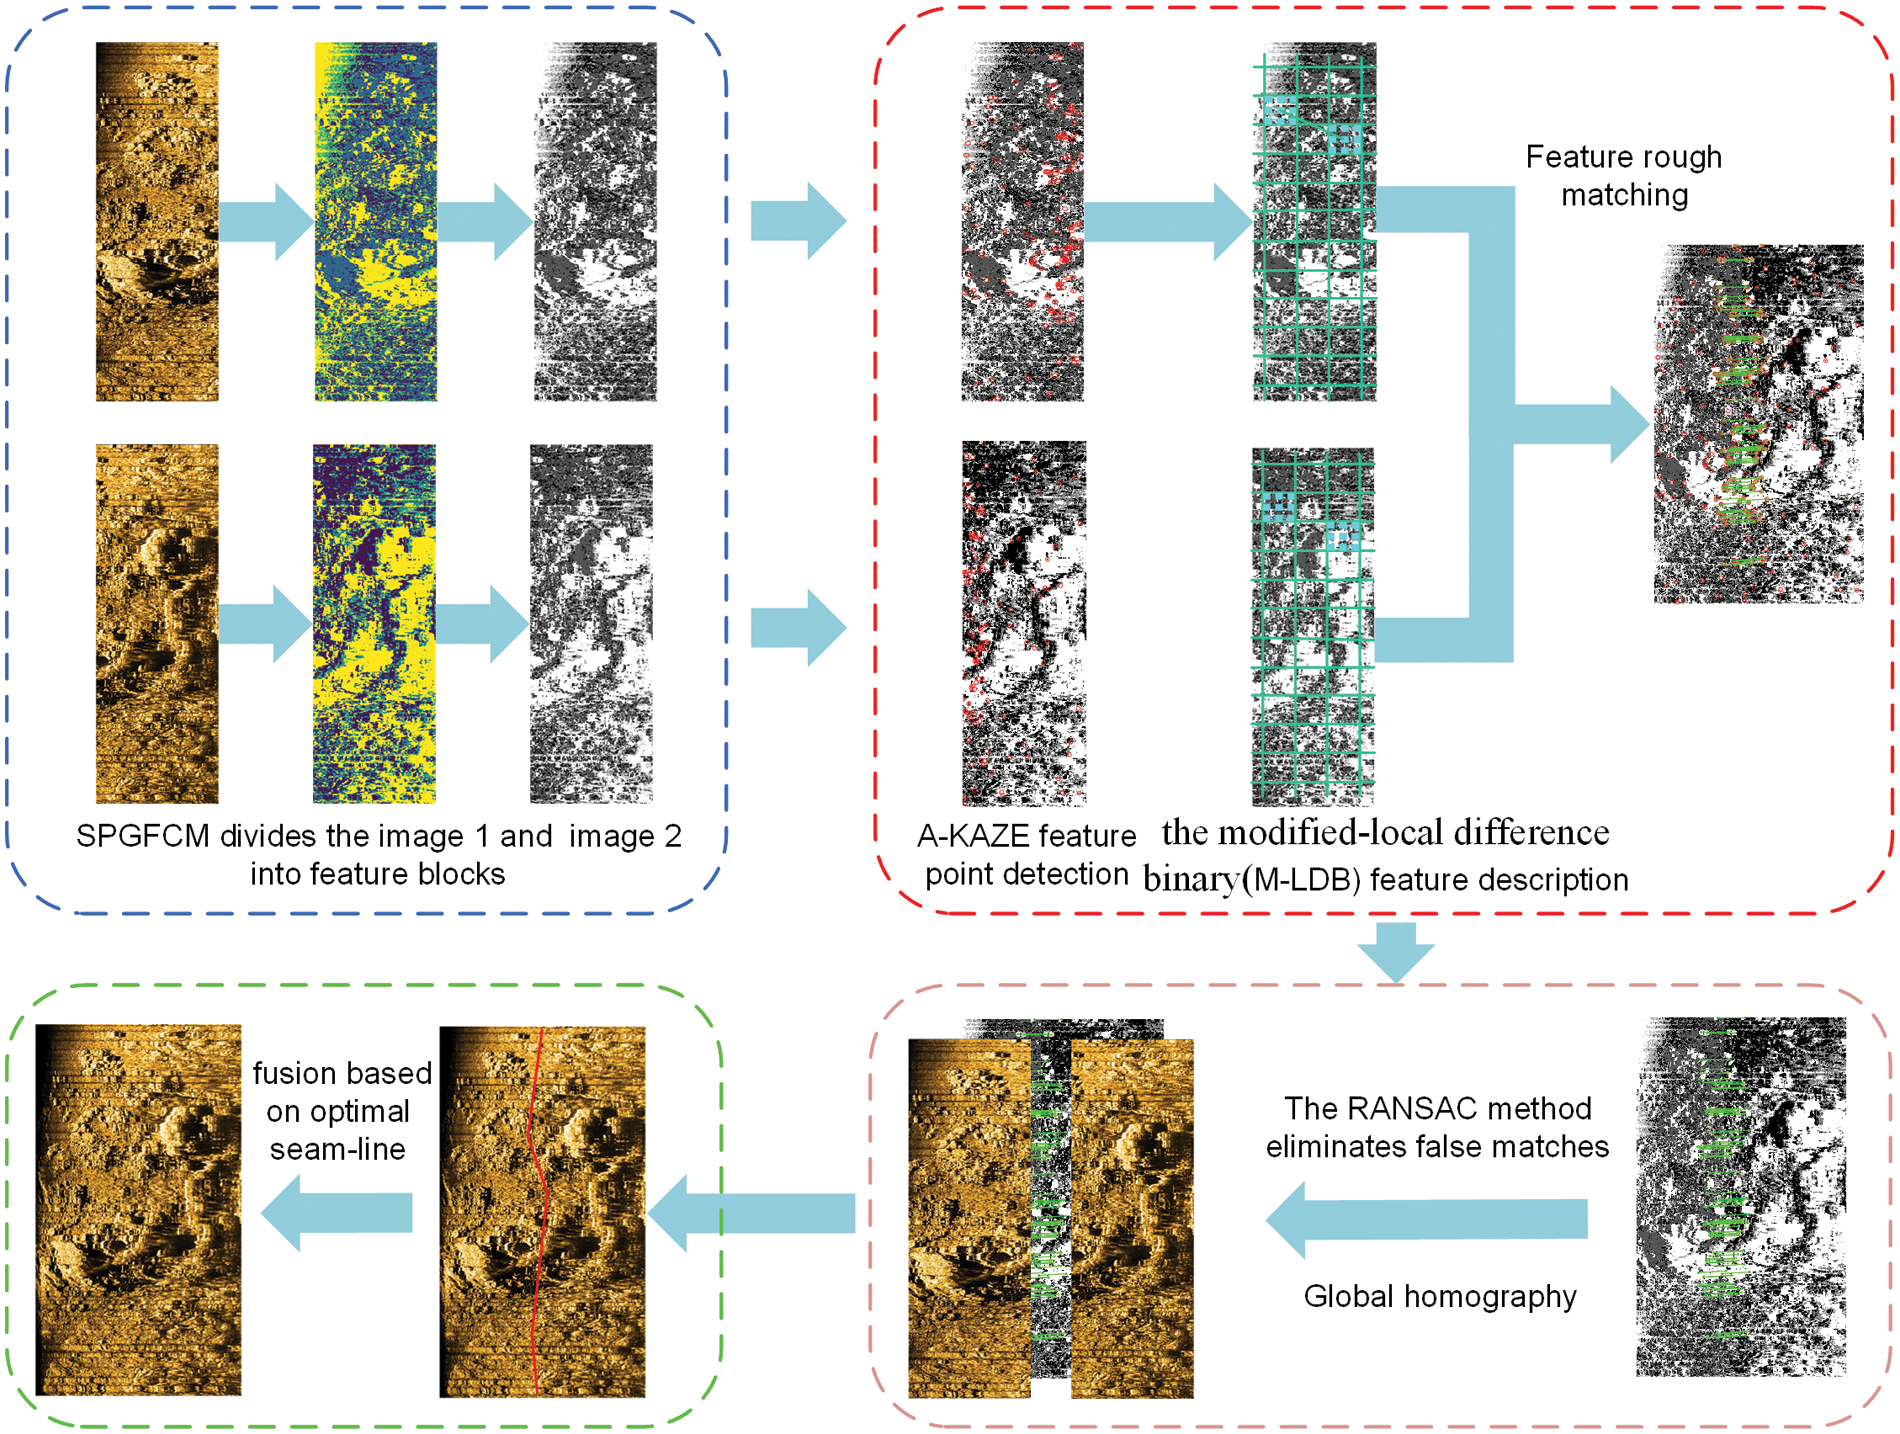
Figure 1: Overall flow chart of underwater terrain image stitching
2.1 Improved FCM Feature Block Algorithm
The fuzzy C-Means (FCM) clustering algorithm [23,24] makes better use of the difference of pixel gray values at different positions of the image and iterative clustering method, and performs the best segmentation by minimizing the weighted sum of the square error objective function. The objective cost function form of the FCM algorithm is as follows:
As shown in formula (1),
Because the image gray value generated by side-scan sonar has a simple structure, the FCM algorithm is prone to the problem that the adjacent areas of the target grayscale and background grayscale of the image cannot be effectively segmented, and the grayscale is uneven. In order to solve this problem, from the perspective of pixel space, we proposed a feature block method based on spatial gradient fuzzy C-Means (SPGFCM), which combines spatial information and gradient information to construct a new objective cost function to achieve more accurate image alignment in this subsection.
The proposed method sets
where
According to the above equation, the edge gradient information
Combining the region information and edge information to construct a new objective cost function, which is defined as follows:
The objective cost function is minimized in the iterative process through the constraint term
By using the principle that adjacent pixels in the image have similar intensities or features to further correct the misclassified pixels in the noise area, we define a spatial membership function as follows:
where
where p and q determine the initial membership degree and the relative weight of the spatial function respectively. In the homogeneous segmentation region, the spatial function simply enhances the original membership, and the clustering results remain unchanged.
The process of the proposed spatial gradient fuzzy C-Means (SPGFCM) feature block for underwater terrain image is as follows:
Step1: Provide the initial values for the centroids
Step2: Compute the membership function
Step3: Calculate the spatial function
Step4: The membership information of each pixel is mapped to the spatial domain. Compute the new membership function which incorporates the spatial function
Step5: Calculate the new centroids
Step6: If
After deblurring each pixel, each pixel is assigned to the specific cluster with the largest degree of membership, and finally the feature block is segmented. By segmenting these regions with independent features before stitching the images, the overlapping regions of the reference image and the target image can be easily determined. It can be seen in Fig. 2 that SPGFCM divides the underwater topographic imagery into three types of blocks.
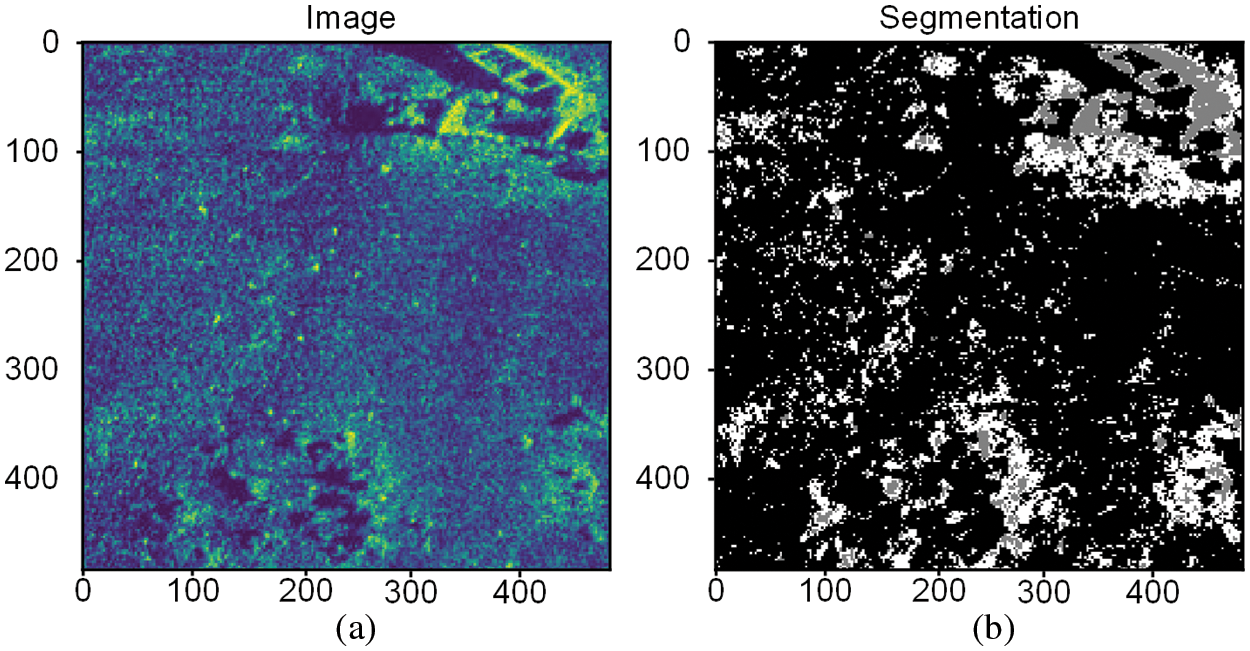
Figure 2: Image is divided into feature blocks: (a) Original image; (b) Segmented image
2.2 Match Underwater Terrain Feature Blocks
The A-KAZE algorithm is used to match the underwater terrain image after each segmented feature block. A-KAZE algorithm firstly constructs the nonlinear scale space, which uses nonlinear diffusion filtering and pyramid strategy to divide the scale space into O groups and S layers. The scale parameter
where
where E is the identity matrix,
The detected feature point is taken as the center of the circle, and the search radius
Keypoint descriptor is an important part of feature detection [26]. After obtaining the main direction of the feature, the modified-local difference binary (M-LDB) [27], which is a binary descriptor, is used to describe the feature points. The algorithm is performed by grid pixel sampling. After determining a group around the feature points and dividing it into grids of size
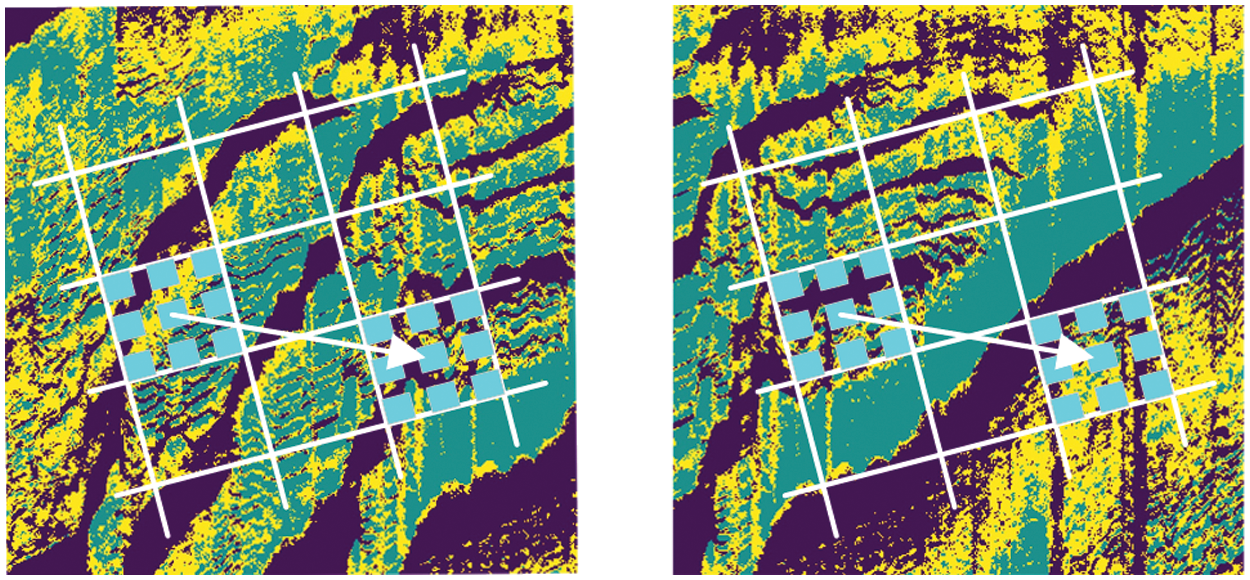
Figure 3: M-LDB feature description for terrain image block
Calculate the gradient information of the pixels in each grid in the x and y directions, and encode according to the average pixel value of each grid and the gradient value of the grid pixels, and construct the local difference binary (LDB) descriptor.
where
2.4 Matching and Fusing Feature Blocks
After the image is divided into feature blocks by the SPGFCM algorithm, the repeated calculation process of matching feature points can be avoided, the time complexity is reduced, and the matching calculation is easier. After the feature description, the binary form of the image is obtained. We directly used the Hamming distance method to perform rough matching on the feature blocks. We used the Hamming distance to perform exclusive or (XOR) calculations, which further improved the matching speed.
The RANSAC algorithm uses the detection method of random sampling to eliminate false matches [28], randomly selects the
Different from improving the traditional image stitching algorithm process, we performed feature block in advance, and chose the method of selecting feature points from different feature matching blocks to calculate the homography. The feature matching point set P of the image is divided into M different subsets according to the feature block, that is
where
The energy value of each pixel in the overlapping area is defined as the corresponding difference value in the difference image. Each pixel in the first row serves as the starting point of a path. The paths that expand from these starting points all represent a possible optimal path. Search for the next line on the path calculated in the previous step. The energy values of the three nearest points on the previous row and the next row are respectively added. The point with the smallest addition result is used as the new extension point of this path. Up to the last line of the overlapping area. Compare the total energy of all paths. The path with the smallest sum is the optimal path. The total difference value measurement formula is as follows:
In the formula, V represents the neighborhood with the point as the center.
3 Experimental Results and Analysis
The experiments were performed on the Windows 10 system with a NVIDIA Tesla K80 GPU, 3.6 GHz CPU and 8GB RAM. We used a single side-scan sonar device on a small unmanned surface vehicles (USV) to interactively scan the path to ensure that overlapping and seamless underwater terrain image data could be collected. We used the pseudo-color data fragments processed by the sonar software. The intercepted fragments of the test data are shown in Fig. 4. The (a) and (b) is a pair of test group 1, and the (c) and (d) is a pair test group 2.
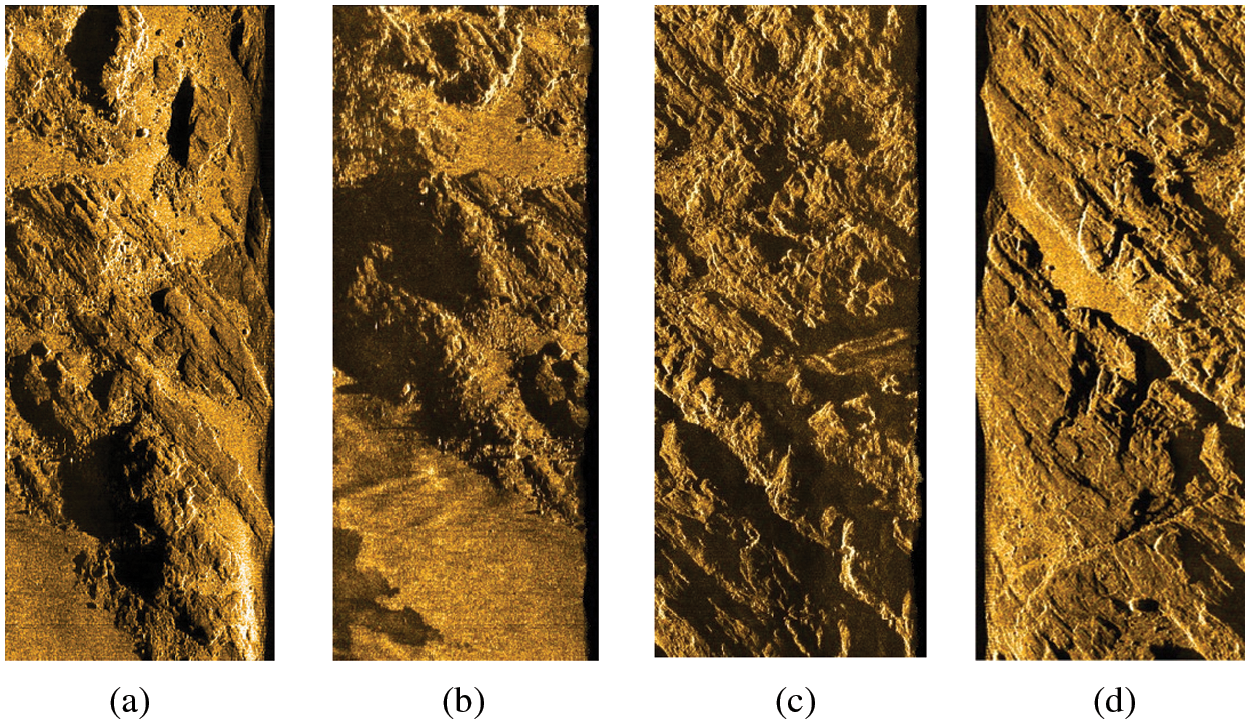
Figure 4: Underwater terrain dataset. (a) Reference image of group 1; (b) Target image of group 1; (c) Reference image of group 2; (d) Target image of group 2
First, the image before splicing is divided into feature blocks, and the appropriate number of classification groups is set to c = 3. In the process of SPGFCM image segmentation, the visualized image segmentation result is shown in Fig. 5. It can be seen that the parts with similar features are divided together, which makes the original image more simplified. These regions with independent features can be divided before the image is stitched, the overlapping regions of the reference image and the target image can be easily determined.
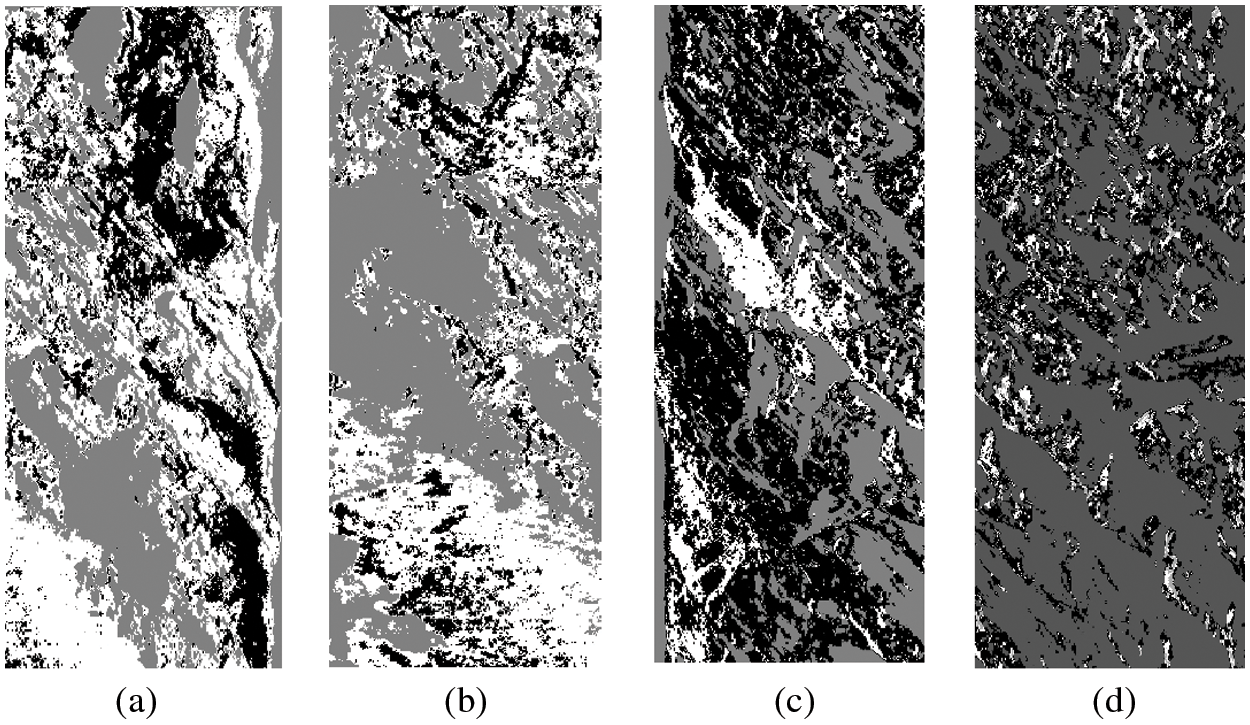
Figure 5: Underwater terrain image is divided into feature blocks. (a) Reference image of group 1; (b) Target image of group 1; (c) Reference image of group 2; (b) Target image of group 2
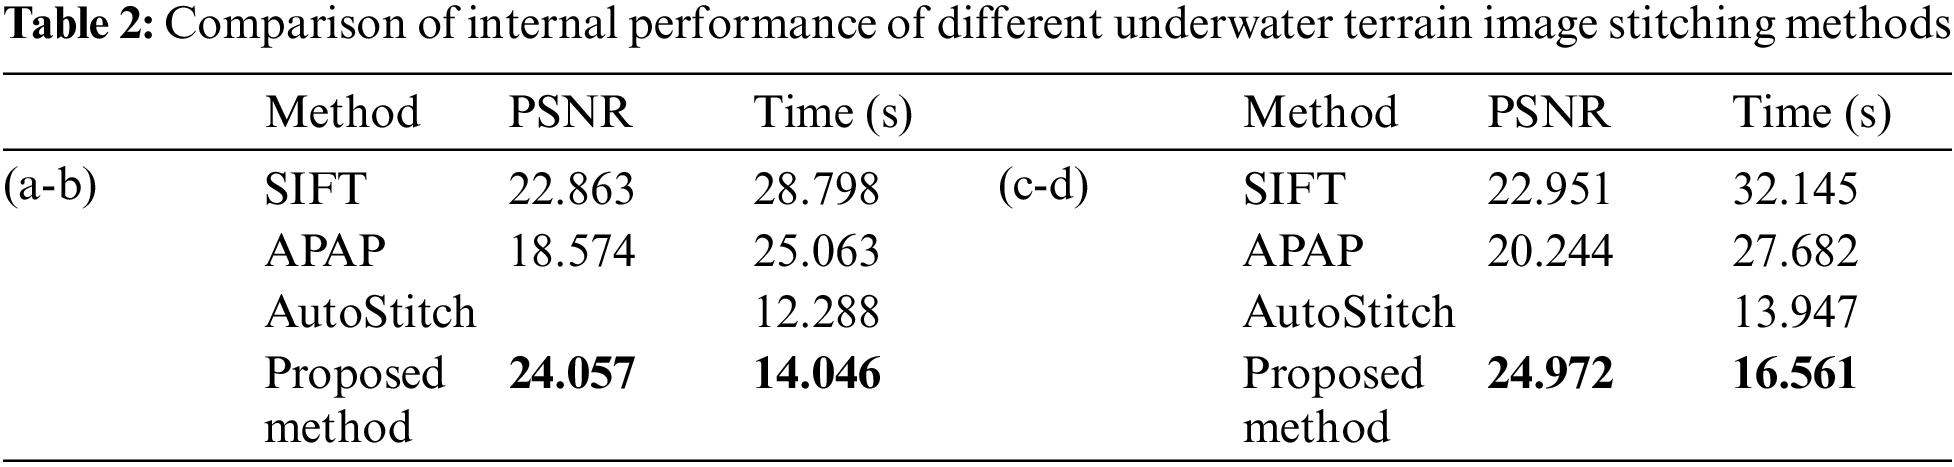
We use internal evaluation indicators such as the partition coefficient Vpcand partition entropy Vpe [29] to measure the effectiveness of SPGFCM method feature clustering. The larger the Vpc, the better the clustering effect, and the smaller the Vpe, the stronger the clustering effect. At the same time, the performance of the algorithm is evaluated by two clustering validity functions Davies-Bouldin index (DBI) and Dunn index (DI) [30,31]. The quantitative evaluation results are listed in Tab. 1, which shows the average Vpc, Vpe, DBI and DI values of two sets of image data segmentation effects in different algorithm models.
From the results shown in Tab. 1, the proposed method attained 0.504 and 0.405 (Vpc), 0.317 and 0.382 (Vpe), 0.572 and 0.544 (DBI), 3.046 and 2.985 (DI) in two pairs of data. Compared with FCM and the spatial fuzzy C-Means (SFCM), the results of SPGFCM method achieve the best performance.
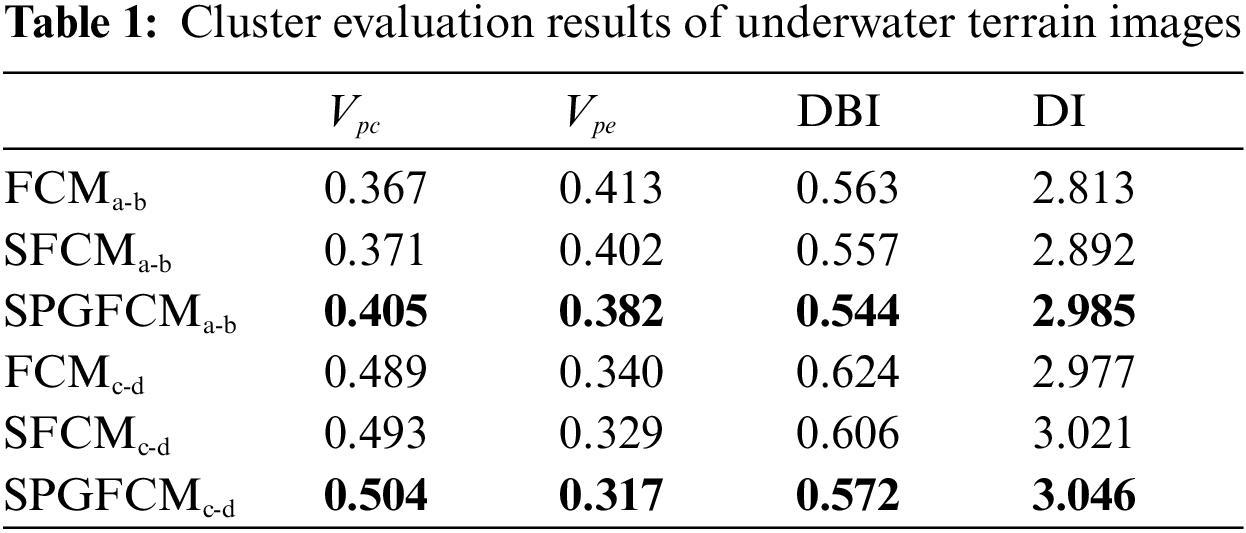
Matching the images between feature blocks after feature segmentation by the SPGFCM algorithm. As shown in Fig. 6, the corresponding matching points of the image are displayed, in which the green circles on the graph correspond to the points of the same feature block. Then the outliers are removed by applying RANSAC, where the removal threshold is set to 0.1. The matched feature points are grouped to calculate the best global homography transformation, and the pixel coordinates of the divided image are mapped with the pixel coordinates of the original image. As shown in Fig. 7, the global homography transform is used to adjust the distortion of the target image, and the optimal seam-line is used for fusion, and finally the stitching is completed.
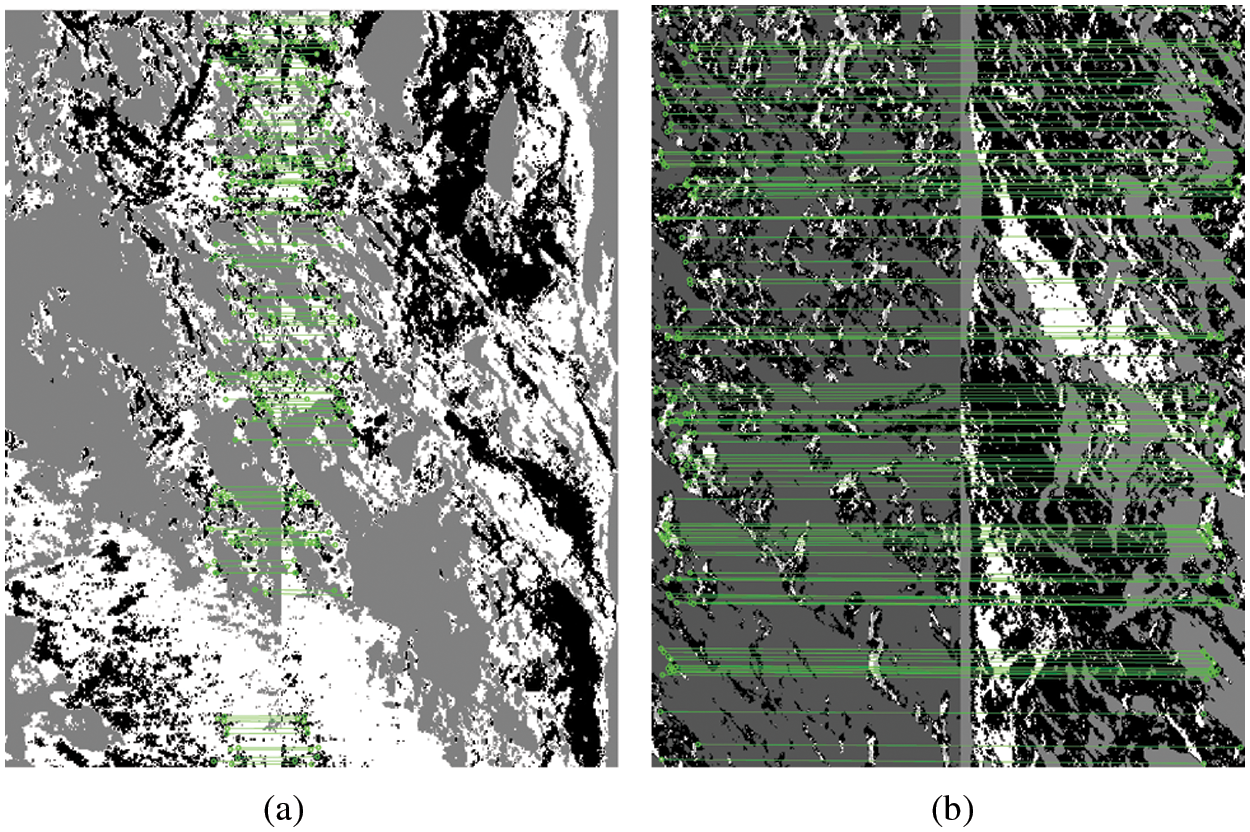
Figure 6: Image matching result. (a) The result of group 1; (b) The result of group 2
Figure 7: The result of two groups of image stitching
As shown in Figs. 8 and 9, different matching and splicing algorithms are compared. The proposed method and SIFT method achieve excellent external effects. It can be seen that the SIFT algorithm has a transitional visual difference at the splicing intersection, which is still unsatisfactory in detail processing, but the final effect is relatively good. The as-projective-as-possible (APAP) algorithm can align images well through local alignment, but the local homography matrix is used to map the image onto the panoramic canvas, which causes the image to be deformed. Autostitch has obvious ghosting in the stitching results. From the stitching results produced by AutoStitch in Fig. 9, it can be seen that small black lines exist in the middle of the image, and the overlapping parts of the stitching details are not handled well. In the proposed SPGFCM combined with A-KAZE method, the method is still stable in the presence of large parallax in the image. The images are pre-blocked and aligned, and the global similarity is considered to obtain a good stitching effect of the underwater terrain.
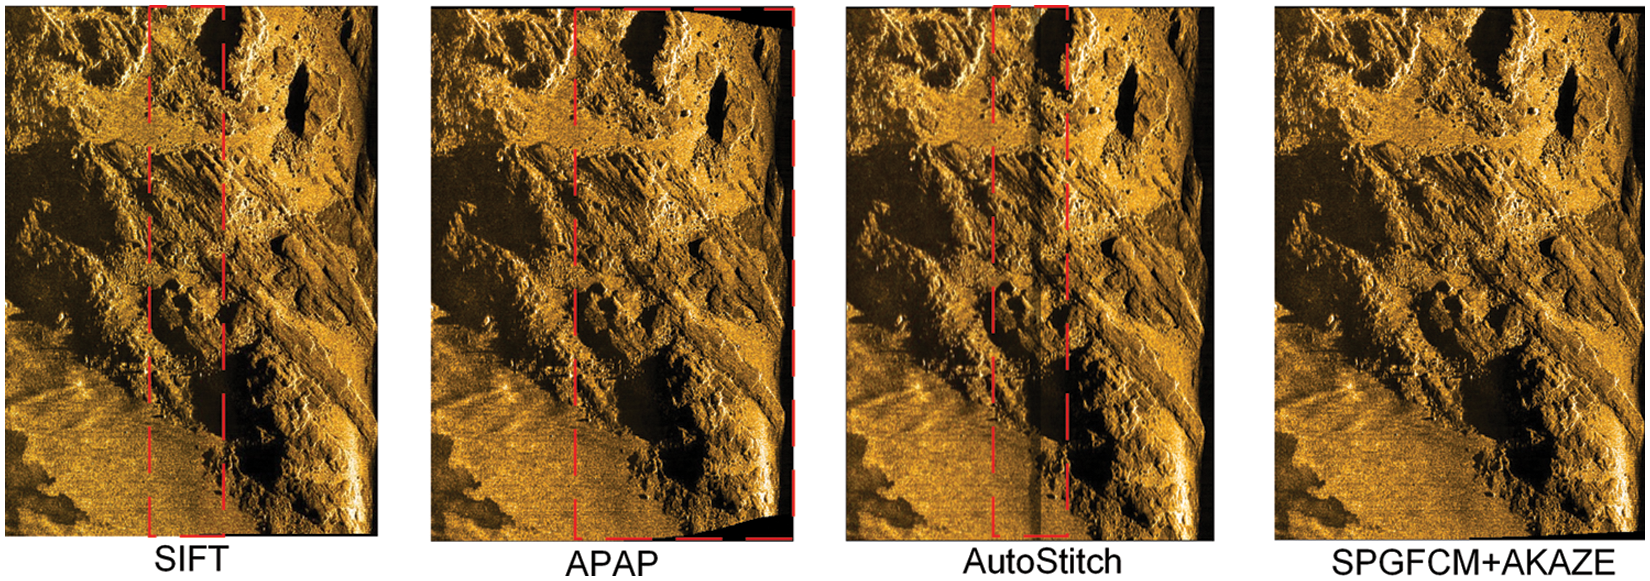
Figure 8: Underwater topographic image stitching results of group 1 data for different method
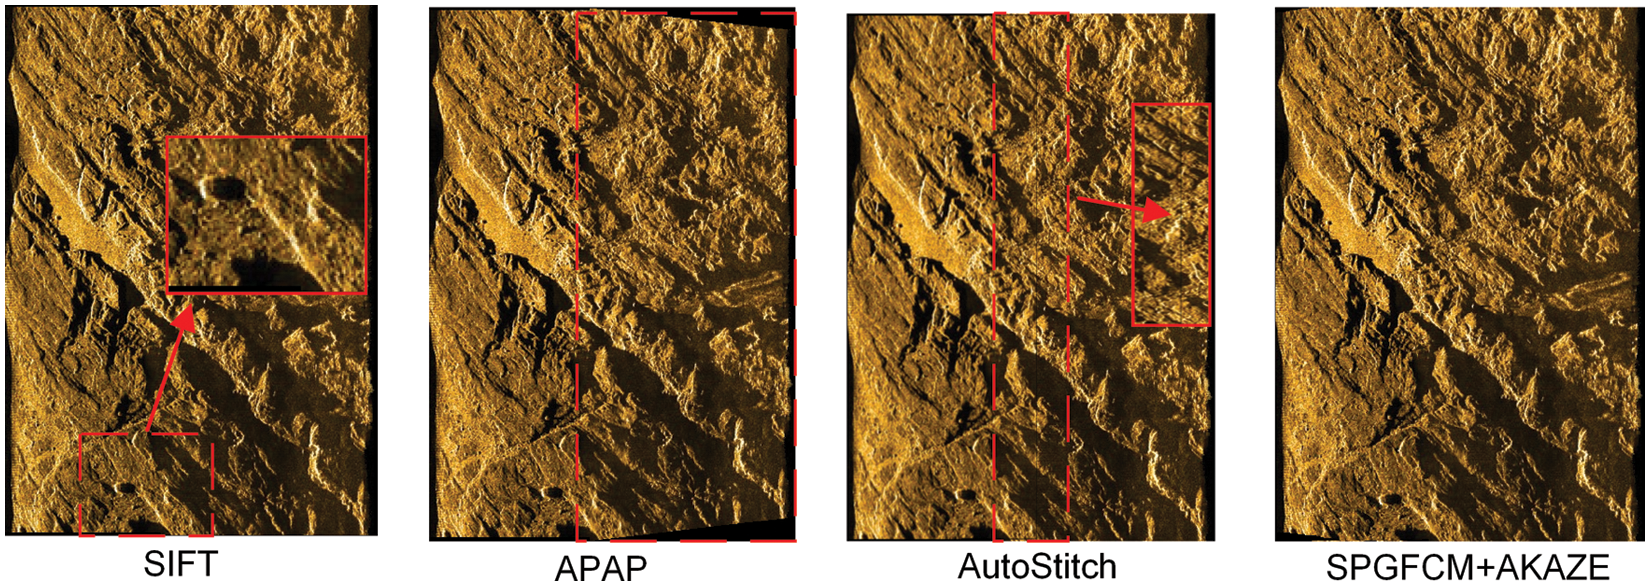
Figure 9: Underwater topographic image stitching results of group 2 data for different method
The peak signal-to-noise ratio (PSNR) evaluation method takes the peak signal-to-noise ratio of an image as a measure to evaluate the image quality. According to Tab. 2, comparing the peak signal-to-noise ratio (PSNR) and time of key point detection and complete image matching stitching for five different sets of data in different algorithms. It can be seen that the peak signal-to-noise ratio (PSNR) values obtained by the algorithm after stitching the complete images are higher compared to SIFT. At the same time, the running time of most image stitching methods increases as the number of key point matching increases. Both the SIFT algorithm and the APAP algorithm take a long time, and the SIFT processing speed is too slow. In the overall image stitching, it can be seen that the proposed method and the AutoStitch method take less time. However, the running time does not determine the advantages of the AutoStitch algorithm. As shown in the results of Figs. 8 and 9, it can be seen that AutoStitch has significantly lower stitching performance and ghosting phenomenon. Therefore, the proposed algorithm is advantageous after a comprehensive comparison. The proposed method not only obtains high-quality images but also reduces the time for image stitching.
Different from traditional splicing methods, this article proposes an underwater terrain image splicing algorithm based on SPGFCM segmentation feature blocks, which combines feature clustering and image splicing algorithms to speed up the matching calculation process of image stitching and realize image stitching by segmented feature blocks. By improving the FCM segmentation algorithm, we solved the problem that the feature edges could not be segmented effectively and the gray scale was not uneven due to the inconspicuous features of the underwater terrain image, and improved the efficiency for the subsequent image feature block matching.
At the same time, the A-KAZE algorithm is used to solve the problem of boundary blur and detail loss caused by Gaussian extended filtering, and improve the quality of feature matching. We used global homography and optimized stitch-based fusion to eliminate overlapping ghosts and distortions. Finally, an optimization method is provided for synthesizing a complete underwater terrain overview from the strip image obtained by the side-scan sonar.
Acknowledgement: We would like to thank the anonymous reviewers for their valuable and helpful comments, which substantially improved this paper. At last, we also would also like to thank all of the editors for their professional advice and help.
Funding Statement: This research was funded by College Student Innovation and Entrepreneurship Training Program, Grant Number 2021055Z and S202110082031, the Special Project for Cultivating Scientific and Technological Innovation Ability of College and Middle School Students in Hebei Province, Grant Number 2021H011404.
Conflicts of Interest: The authors declare that they have no conflicts of interest to report regarding the present study.
1. Y. Liu, S. Xu, T. Zhu and T. Wang, “Application of multi-source data fusion method in updating topography and estimating sedimentation of the reservoir,” Water, vol. 12, no. 11, pp. 3057, 2020. [Google Scholar]
2. F. Yang, F. Xu, K. Zhang, X. Bu, H. Hu et al., “Characterisation of terrain variations of an underwater ancient town in qiandao lake,” Remote Sensing, vol. 12, no. 2, pp. 268, 2020. [Google Scholar]
3. W. Xiong, C. S. Cai, B. Kong, X. Zhang and P. Tang, “Bridge scour identification and field application based on ambient vibration measurements of superstructures,” Journal of Marine Science and Engineering, vol. 7, no. 5, pp. 121, 2019. [Google Scholar]
4. R. S. Nair, R. Agrawal, S. Domnic and A. Kumar, “Image mining applications for underwater environment management-A review and research agenda,” International Journal of Information Management Data Insights, vol. 1, no. 2, pp. 100023, 2021. [Google Scholar]
5. A. Naseer, E. N. Baro, S. D. Khan, Y. Vila and J. Doyle, “Automatic detection of nephrops norvegicus burrows from underwater imagery using deep learning,” Computers, Materials & Continua, vol. 70, no. 3, pp. 5321–5344, 2022. [Google Scholar]
6. X. Cao, L. Chen, L. Guo and W. Han, “Auv global security path planning based on a potential field bio-inspired neural network in underwater environment,” Intelligent Automation & Soft Computing, vol. 27, no. 2, pp. 391–407, 2021. [Google Scholar]
7. A. Sun, X. Cao, X. Xiao and L. Xu, “A fuzzy-based bio-inspired neural network approach for target search by multiple autonomous underwater vehicles in underwater environments,” Intelligent Automation & Soft Computing, vol. 27, no. 2, pp. 551–564, 2021. [Google Scholar]
8. A. Mathias, S. Dhanalakshmi, R. Kumar and R. Narayanamoorthi, “Deep neural network driven automated underwater object detection,” Computers, Materials & Continua, vol. 70, no. 3, pp. 5251–5267, 2022. [Google Scholar]
9. P. Cervenka, C. de. Moustier and P. F. Lonsdale, “Geometric corrections on sidescan sonar images based on bathymetry. Application with SeaMARC II and sea beam data,” Marine Geophysical Researches, vol. 17, no. 2, pp. 217–219, 1995. [Google Scholar]
10. Z. Wang and Z. Yang, “Review on image-stitching techniques,” Multimedia Systems, vol. 26, no. 4, pp. 413–430, 2020. [Google Scholar]
11. S. A. K. Tareen and Z. Saleem, “A comparative analysis of sift, surf, kaze, akaze, orb, and brisk,” in Int. Conf. on Computing, Mathematics and Engineering Technologies (iCoMET), Sukkur, Pakistan, IEEE, pp. 1–10, 2018. [Google Scholar]
12. S. K. Sharma and K. Jain, “Image stitching using AKAZE features,” Journal of the Indian Society of Remote Sensing, vol. 48, no. 10, pp. 1389–1401, 2020. [Google Scholar]
13. P. Vandrish, A. Vardy, D. Walker and O. A. Dobre, “Side-scan sonar image registration for AUV navigation,” in 2011 IEEE Symp. on Underwater Technology and Workshop on Scientific Use of Submarine Cables and Related Technologies, Tokyo, Japan, pp. 1–7, 2011. [Google Scholar]
14. A. Wang, J. Zhao, J. Guo and X. Wang, “Elastic mosaic method in block for side-scan sonar image based on speeded-up robust features,” Wuhan Univ. Inf. Sci. Ed, vol. 43, no. 5, pp. 697–703, 2018. [Google Scholar]
15. C. Chailloux, J. Le Caillec, D. Gueriot and B. Zerr, “Intensity-based block matching algorithm for mosaicing sonar images,” IEEE Journal of Oceanic Engineering, vol. 36, no. 4, pp. 627–645, 2011. [Google Scholar]
16. J. Zhao, A. Wang, H. Zhang and X. Wang, “Mosaic method of side-scan sonar strip images using corresponding features,” IET Image Processing, vol. 7, no. 6, pp. 616–623, 2013. [Google Scholar]
17. J. Zhao, X. Shang and H. Zhang, “Side-scan sonar image mosaic using couple feature points with constraint of track line positions,” Remote Sensing, vol. 10, no. 6, pp. 953, 2018. [Google Scholar]
18. F. He, M. Wu, R. Long and Z. Chen, “Accurate mosaic of side scan sonar image based on SURF feature,” Chin. J. Ocean. TechCnol, vol. 39, no. 6, pp. 35–41, 2020. [Google Scholar]
19. X. Shang, J. Zhao and H. Zhang, “Obtaining high-resolution seabed topography and surface details by co-registration of side-scan sonar and multibeam echo sounder images,” Remote Sensing, vol. 11, no. 12, pp. 1496, 2019. [Google Scholar]
20. J. Raihan A, P. E. Abas and L. C. De Silva, “Role of restored underwater images in underwater imaging applications,” Applied System Innovation, vol. 4, no. 4, pp. 96, 2021. [Google Scholar]
21. M. A. Fischler and R. C. Bolles, “Random sample consensus: A paradigm for model fitting with applications to image analysis and automated cartography,” Communications of the ACM, vol. 24, no. 6, pp. 381–395, 1981. [Google Scholar]
22. L. Nie, C. Lin, K. Liao, M. Liu and Y. Zhao, “A View-free image stitching network based on global homography,” Journal of Visual Communication and Image Representation, vol. 73, pp. 102950, 2020. [Google Scholar]
23. J. C. Dunn, “A fuzzy relative of the ISODATA process and its use in detecting compact well-separated clusters,” Journal of Cybernetics, vol. 3, no. 3, pp. 32–57, 1974. [Google Scholar]
24. J. Chen, C. Yang, G. Xu and L. Ning, “Image segmentation method using fuzzy C mean clustering based on multi-objective optimization,” in Journal of Physics: Conf. Series, Hong Kong, pp. 12035, 2018. [Google Scholar]
25. M. Li, “Generalized lagrange multiplier method and KKT conditions with an application to distributed optimization,” IEEE Transactions on Circuits and Systems II: Express Briefs, vol. 66, no. 2, pp. 252–256, 2018. [Google Scholar]
26. I. E. Rube and S. Alsharif, “Keypoint description using statistical descriptor with similarity-invariant regions,” Computer Systems Science and Engineering, vol. 42, no. 1, pp. 407–421, 2022. [Google Scholar]
27. M. Kumar, R. Gupta, K. S. Raju and D. Kumar, “Modified local binary pattern algorithm for feature dimensionality reduction,” Recent Advances in Computer Science and Communications (Formerly: Recent Patents on Computer Science), vol. 14, no. 3, pp. 934–940, 2021. [Google Scholar]
28. Z. Pan and Z. Wen, “Analysis of image registration algorithm RANSAC and its improved algorithm,” in IOP Conf. Series: Earth and Environmental Science, Zhangjiajie, China, pp. 12138, 2021. [Google Scholar]
29. D. Kumar, R. K. Agrawal and H. Verma, “Kernel intuitionistic fuzzy entropy clustering for MRI image segmentation,” Soft Computing, vol. 24, no. 6, pp. 4003–4026, 2020. [Google Scholar]
30. S. Manochandar, M. Punniyamoorthy and R. K. Jeyachitra, “Development of new seed with modified validity measures for k- means clustering,” Computers & Industrial Engineering, vol. 141, pp. 106290, 2020. [Google Scholar]
31. M. Danesh, M. Dorrigiv and F. Yaghmaee, “Ensemble-based clustering of large probabilistic graphs using neighborhood and distance metric learning,” The Journal of Supercomputing, vol. 77, no. 4, pp. 4107–4134, 2020. [Google Scholar]
 | This work is licensed under a Creative Commons Attribution 4.0 International License, which permits unrestricted use, distribution, and reproduction in any medium, provided the original work is properly cited. |