DOI:10.32604/cmc.2022.025722
| Computers, Materials & Continua DOI:10.32604/cmc.2022.025722 | |
| Article |
Machine Learning Empowered Electricity Consumption Prediction
Department of Computer Science, College of Computer Science and Information Technology, Imam Abdulrahman Bin Faisal University, Dammam, 31441, Saudi Arabia
*Corresponding Author: Maissa A. Al Metrik. Email: 2190500246@iau.edu.sa
Received: 02 December 2021; Accepted: 11 January 2022
Abstract: Electricity, being the most efficient secondary energy, contributes for a larger proportion of overall energy usage. Due to a lack of storage for energy resources, over supply will result in energy dissipation and substantial investment waste. Accurate electricity consumption prediction is vital because it allows for the preparation of potential power generation systems to satisfy the growing demands for electrical energy as well as: smart distributed grids, assessing the degree of socioeconomic growth, distributed system design, tariff plans, demand-side management, power generation planning, and providing electricity supply stability by balancing the amount of electricity produced and consumed. This paper proposes a medium-term prediction model that can predict electricity consumption for a given location in Saudi Arabia. Hence, this study implemented a standalone Artificial Neural Network (ANN) model and bagging ensemble for predicting total monthly electricity consumption in 18 locations across Saudi Arabia. The dataset used in this research is gathered exclusively from the Saudi Electric Company. The pre-processing phase included normalizing the data using min-max method and mapping the cyclical attribute to its sine and cosine facets. The number of neurons and learning rate of the standalone model were optimized using hyperparameter tuning. Finally, the standalone model was tested against the bagging ensemble using the optimized ANN. The bagging ensemble with an optimized ANN as the chosen classifier outperformed the standalone ANN model. The results for the proposed model produced 0.9116 Correlation Coefficient (CC), 0.2836 Mean Absolute Percentage Error (MAPE), 0.4578, Root Mean Squared Percentage Error (RMSPE), 0.0298 MAE, and 0.069 Root Mean Squared Error (RMSE), respectively.
Keywords: Electricity consumption prediction; artificial neural network; machine learning
Electricity is regarded as the most adaptable type of energy, a major secondary energy source, a critical component for developing socioeconomic infrastructure, and a rare commodity. However, electricity is not economically storable, and the power system's stability requires a continuous balance between electricity output and consumption [1]. The objectives of electricity consumption forecasting, and prediction differ depending on the time scale. Long-term, mid-term, and short-term are examples of relative time scales. As the monthly time scale is fundamental in many governments and business decision-making processes, the mid-term electricity consumption is the time scale chosen for this and most research as it always refers to the monthly forecasting [2,3]. Electric power, as the most effective secondary energy, accounts for a greater percentage of total energy consumption. Excessive supply will result in energy dissipation and massive investment waste and due to the lack of storage for energy resources, while this inadequate supply will have a negative impact on economic growth [4]. Saudi Arabia, on the other hand, consumes three times more energy than the world average. Saudi Arabia may be forced to self-import oil to accommodate the energy demands of its growing population if current consumption rates continue at their current levels by 2038 [5,6]. Therefore, as the electricity consumption intensity is at an all-time high in Saudi Arabia, accurate electricity demand estimates are critical for developing an effective energy development strategy. Moreover, forecasting electricity consumption is vital for the efficient management of today's electric power systems, and it has sparked interest from both academia and industry [7]. Many studies revealed the vitality of accurate electricity consumption prediction. Reliable and accurate estimation of electrical energy consumption allows for the preparation of potential power generation systems to satisfy the growing demands for electrical energy. In addition, forecasting energy consumption can be beneficial in various capacities. Some of these areas are smart distributed grids, assessing the degree of socioeconomic growth, distributed system design, tariff plans, demand-side management, power generation planning [8,9], and providing electricity supply stability by balancing the amount of electricity produced and consumed. Methods for predicting medium- or long-term electricity consumption can be divided into two categories: standalone and hybrid models. The standalone frameworks are then further classified into three groups based on the underlying methodology: statistical, mathematical programming, and computational intelligence models. Statistical-statistical, statistical-mathematical programming, and statistical-computational intelligence are examples of hybrid models [7,10,11]. Regression analysis, exponential smoothing, and time-series methods are the most popular statistical standalone methods whereas machine-learning, metaheuristic, uncertainty-based, and knowledge-based methods are all examples of stand-alone computational intelligence methods. Accordingly, this research will focus towards the statistical-computational intelligence hybrid method since hybrid models, as opposed to stand-alone models, are more favorable due to their superior ability to represent random and nonlinear variables [12]. In this study, a new dataset provided by the Saudi Electrical Company is used for investigating the effects of machine learning techniques in predicting electricity consumption. Predicting electricity consumption using ANN was widely used due to how well the ANN performs with large datasets. As the proposed model in this study utilizes a vast amount of data from several locations, the performance of the ANN is investigated in this work. Additionally, amongst the literature, no ensemble techniques were attempted for predicting electricity consumption, although ensembles have been proven to provide good results. Therefore, this study investigated the effects of bagging ensemble on predicting electricity consumption in Saudi Arabia.
The rest of the paper is organized as follows: Section 2 provides a literature review. Section 3 describes the proposed techniques. Section 4 presents the empirical studies. Section 6 presents the experiments on predicting electricity consumption in Saudi Arabia. Section 6 covers the results and discussion Section 7 presents the authors’ conclusions.
This section covers the past literature for predicting electricity consumption. The review is divided into global experiments and experiments that took place in Saudi Arabia. Furthermore, the review is provided in a reverse chronologically order.
2.1 Global Electricity Consumption Forecasting
Forecasting electricity consumption has been investigated previously in many locations around the world, such as the province of Jiangsu, China, which was the focus in [4]. The authors proposed a novel model called the self-adaptive grey fractional weighted model. The goal of the proposed model was to predict the electricity consumption in the Jiangsu province. The model was compared with five other models and outperformed all of them in terms of Root Mean Squared Error (RMSE) and Mean Absolute Percentage Error (MAPE), with a value of 120.83 and 1.77, respectively. In [12], holt-winters smoothing method was used to predict electricity consumption, and a Fruit fly optimization algorithm was used to enhance the predictor's accuracy. One of the main aims of the research was to produce an accurate prediction by using minimal data. The data that was used was a semimonthly electricity consumption of the city of Chongqing from 2010–2018. The research covers 54 points where 6 points were saved for testing while the rest were for training and validation. The proposed model with the optimization illustrated a good performance with a result of 3.58% MAPE. However, it should be mentioned that the obtained results might be attributed to the very scarce testing set; hence, performance is not a guarantee for other, larger datasets, and more investigation on the potential of this model can be beneficial.
Mengying et al. [13] proposed using Elman Neural Networks to predict the monthly electric consumption of a Chinese city. Although the dataset was of monthly data, to implement some other input features such as gross domestic product and temperature, a quarterly input was used to output monthly estimations. The results showed a promising prediction. A vector error correction model with self-adapting screening was deployed in [3] to forecast the electricity consumption of China. The authors’ approach was to utilize the most influential external economic factors for a more accurate prediction. Although the proposed model had high computational complexity due to the number of economic factors included, the model resulted in robust and affective forecasting. Neural networks and support vector regression were utilized to predict Turkey's electricity consumption in [14]. The dataset consisted of the monthly electrical consumption for a span of 40 years. Although both techniques operated well and produced less than 4% error in forecasting the values of the actual consumption, support vector regression performed slightly better than NN. Another attempt at forecasting Turkey's electricity consumption was made by Kaytez et al. in [15], where ANN and least-squares support vector machine were utilized to meet their goal. The results showed that the least-squares support vector machine performed better.
2.2 Saudi Arabia Electricity Consumption Forecasting
Mohammad et al. in [16] developed a linear regression model to forecast the annual electricity consumption amongst 351 schools in the eastern province. The data was split into training and validation with the data of 316 schools were for training the model. The input parameters for the model focused on the structure of the schools themselves such as the total area carpeted, the total area covered with air condition, the roof area, building age, type of school, number of floors, number of classrooms as well as other parameters such as the number of staff and students. Due to the data being annual and for 1 year only, there was no need for meteorological data such as the air temp. The model achieved a high accuracy of above 95%. A similar study based on a facility was the research done by Alanbar et al. in [17]. The focus of their research was to forecast the electricity consumption for the college of computer in Qassim university. The prediction model used deep learning using a long short-term memory recurrent neural network. The data used in the study spanned 13 years and had electricity consumption data, weather data, and data about the college such as number of devices and working days.
Ouda et al. in [18], introduced three electricity demand scenarios which were: Optimistic, Pessimistic, and Moderate, respectively. The estimations were calculated from the year 2014 up to the year 2040, based on past yearly total demands and population growth that started from 2006 and spanned 8 years. Although the output of the three potential scenarios can be helpful for policy makers to prepare for future developments, there is still a large margin of uncertainty due to the absence of precise and accurate datasets and implementations of machine learning techniques. In [19], authors attempted electricity energy consumption forecasting for the Organization of Petroleum Exporting Countries. The yearly electric consumption data from 1980 to 2012 for each country was gathered from the Energy Information Administration. Furthermore, the data for the 12 countries was normalized and then combined as a single entity to line up with goal of the study. The proposed model in the study was a Cuckoo Search Algorithm via Lévy flights and Neural Networks. To assess the proposed method, various tests took place that involved a 90–10 split for one- and three-years electricity forecasting, 80–20 for six years, 70–30 for nine years, and 60–40 for 13 years. Additionally, the proposed method was tested against other Neural Networks. Results showed that the proposed model proved to be the most efficient, reliable, and accurate between all the other algorithms. In [20], an abductory induction mechanism was introduced to predict electricity consumption in the eastern region of KSA. Because the experiment used features of different aspects, i.e., meteorological, electrical, and regional, the sources of the data varied, such as from Saudi Consolidated Electric Company for the province, public national statistics, and from the Research Institute of King Fahd University of Petroleum and Minerals. Moreover, many factors went in for the feature selection, mainly using a complexity penalty multiplier. The best results were obtained by using two features which were the monthly mean average of the air temperature and relative humidity. Conclusively, the proposed model using only two features performed better than the past studies compared in the paper achieving a Mean Absolute Error (MAE) of 0.13, mean squared error of 0.02, and mean percentage error of 5.6. Another paper by the same authors proposed an Auto Regressive Integrated Moving Average model based on a Univariate Box-Jenkin time-series forecasting model [21]. In both papers, the same electricity consumption dataset was utilized except that the proposed model only used the time series for electric consumption without the other features that were included in [20]. It was observed that the proposed model outperformed the best machine-learning and multivariate regression-analysis models; it was compared with using only one parameter. The proposed model with the auto regressive coefficients was superior to the other Auto Regressive Integrated Moving Average models, with a mean percentage error of 0.38. A regression forecasting model was developed for electricity consumption in the Eastern region of Saudi Arabia. The model was based on a function of population, global solar radiation, and weather data [22]. To formulate the model, a five-year period of data was utilized and for selecting features, a stepping-regression methodology was implemented. Using normal statistical methods, co-linearity between regressors was explored and the competence of the model was calculated from residual analysis techniques.
3.1 Artificial Neural Networks
As discussed in the literature, Artificial Neural Networks (ANN) and their variations were among the best-performing algorithms in predicting electricity consumption. Predicting electricity consumption using ANN was widely used due to how well the ANN performs with large datasets. As ANNs excel in regression problems and pattern recognition, which are needed when working with forecasting problems such as covered in this study. Moreover, ANNs are considered unstable machine learning algorithms, meaning that they are sensitive to the slightest perturbations on the implemented training set. Hence, even if the same type of ANN is used by two experiments in the same area but with a slight change in the training set, the resulted models are not the same. As this research proposes to predict new electricity consumption data and utilizes a vast amount of data from several locations, this paper examined different ANN architectures to achieve the best outcomes of the prediction. ANNs are models designed to mimic the nervous system's biological nature in how brains think, process information, and learn [23].
Although there are many models and variations of ANNs such as radial basis function and recurrent neural networks, the main tasks expected from ANNs are regression and pattern recognition, which are needed when working with solar radiation and electricity consumption forecasting. Like the neurological system in the brain, neural networks comprise of networks that contain neurons that are interconnected via weights and biases. These artificial computational neurons are the essential component of an ANN, and they work by taking an intercept term that usually possesses a value of 1 with an input. The weight of the intercept term is also known as a bias. Then, a procedure occurs where the terms and inputs are multiplied by a weight and the bias is added. So, each input
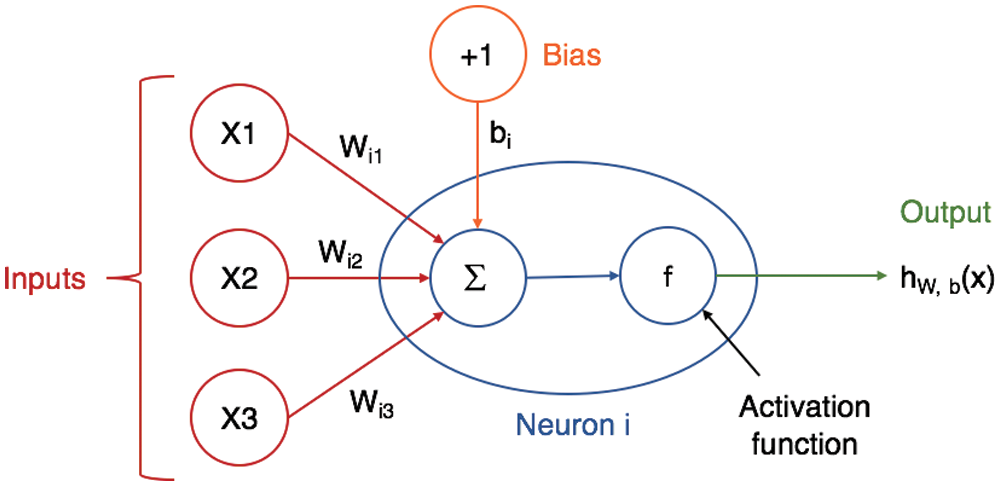
Figure 1: Neuron structure [26]
Typically, three parameters can define the ANN structure: First, the patterns where the neurons are intercepting and interconnecting in the various layers. Second, weighing the biases and updating them throughout the learning process. Third, the product of the transfer or activation function. ANNs are typically divided into three layers: the input layer, the hidden layer, and the output layer. There is one neuron per input parameter in the first layer. Furthermore, the input neurons in the hidden layer are linked to neurons; eventually, these neurons are connected to the neurons that produce the output layer. More complicated structures can have more neuron layers. Fig. 2 is an example of an ANN where it illustrates all three essential layers as well as an additional hidden layer. The illustration can be taken as an example to describe the structure of the ANN. The distribution of the layers is described as follows:
• Input layer: Unlike the other layers, elements in this layer consist of input elements. In Fig. 2, four inputs are considered as parameters for the model.
• Hidden layer: Hidden layers are named after the fact that there is no observation of what the produced values are in that layer as opposed to the known values of both the input and output layer. In the figure, there are two hidden layers with different neurons per layer.
• Output layer: This is the final layer, and the neuron numbers in this layer corresponds to the total of output parameters.
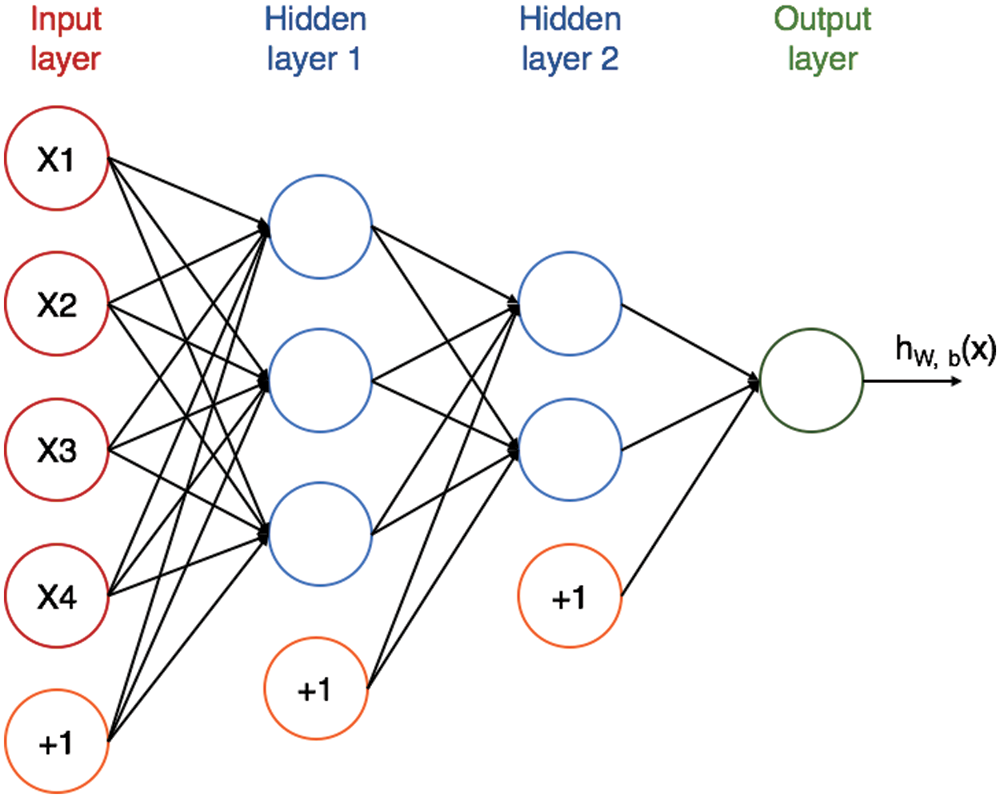
Figure 2: ANN structure [26]
In Fig. 2, the intercept term is represented by the connections between neurons throughout the different layers minus the input layer. Depending on the nature of the network, some connections can be deleted, and backpropagation can be added when dealing with more complex neural networks. Neural networks are beneficial in solving nonlinear and complex problems. However, it is difficult to figure out which parameters are the most influential to the response. The disadvantage of a neural network is that it is difficult to observe or grasp what happens within the network structure after applying the model on a set of inputs [27]. There are several applications of ANN in various areas of study like classification [28], security [29–31], prediction [32], estimation [33], engineering [34–36], healthcare [37–39] and many more [40].
To achieve a more robust prediction model and avoid overfitting, ensemble approaches are often favored. The resulting set should be less prone to errors than any single standalone model. Therefore, this paper proposed using the bagging ensemble as it reduces the variance of a prediction model by creating more data during the training phase. As a result, we have a collection of distinct models to give a more reliable forecast. Leo Breiman formally introduced bagging or bootstrap aggregation in 1996 [41]. Bagging is an ensemble learning approach that uses a series of homogenous machine learning algorithms to decrease error rates. Bagging's main principle is to employ many base learners, each of which is trained individually using a sample population from the training set, to generate a more precise and reliable model using a voting or averaging strategy. In other words, bagging votes on classifiers that were produced by several bootstrapped samples [42]. Bootstrapping, also known as random sampling with replacement, and the collection of uniformed machine learning algorithms are the two primary components of the bagging ensemble. To create a bootstrap sample, randomly selecting m instances from the training set and allow replacements. Fig. 3 illustrates random sampling.
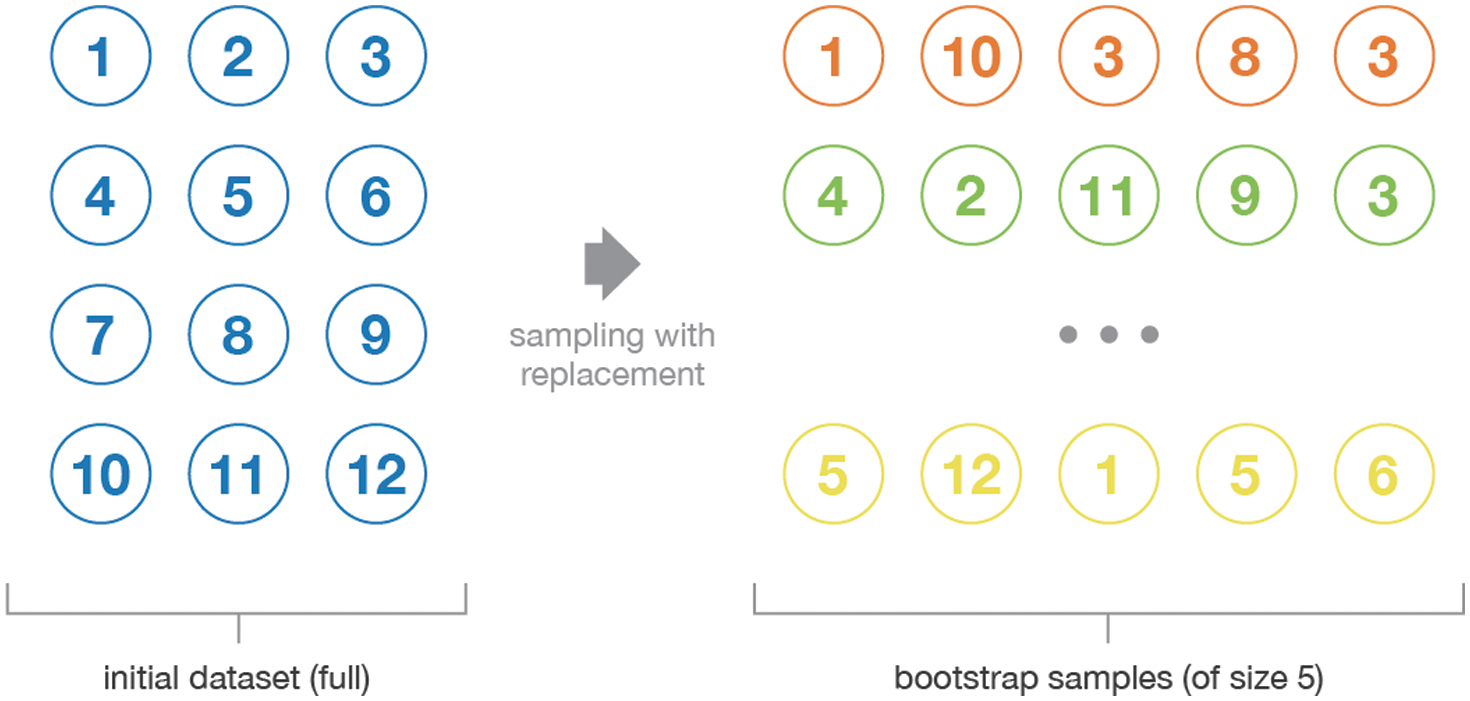
Figure 3: Illustration of the bootstrap process [43]
The bagging ensemble then takes
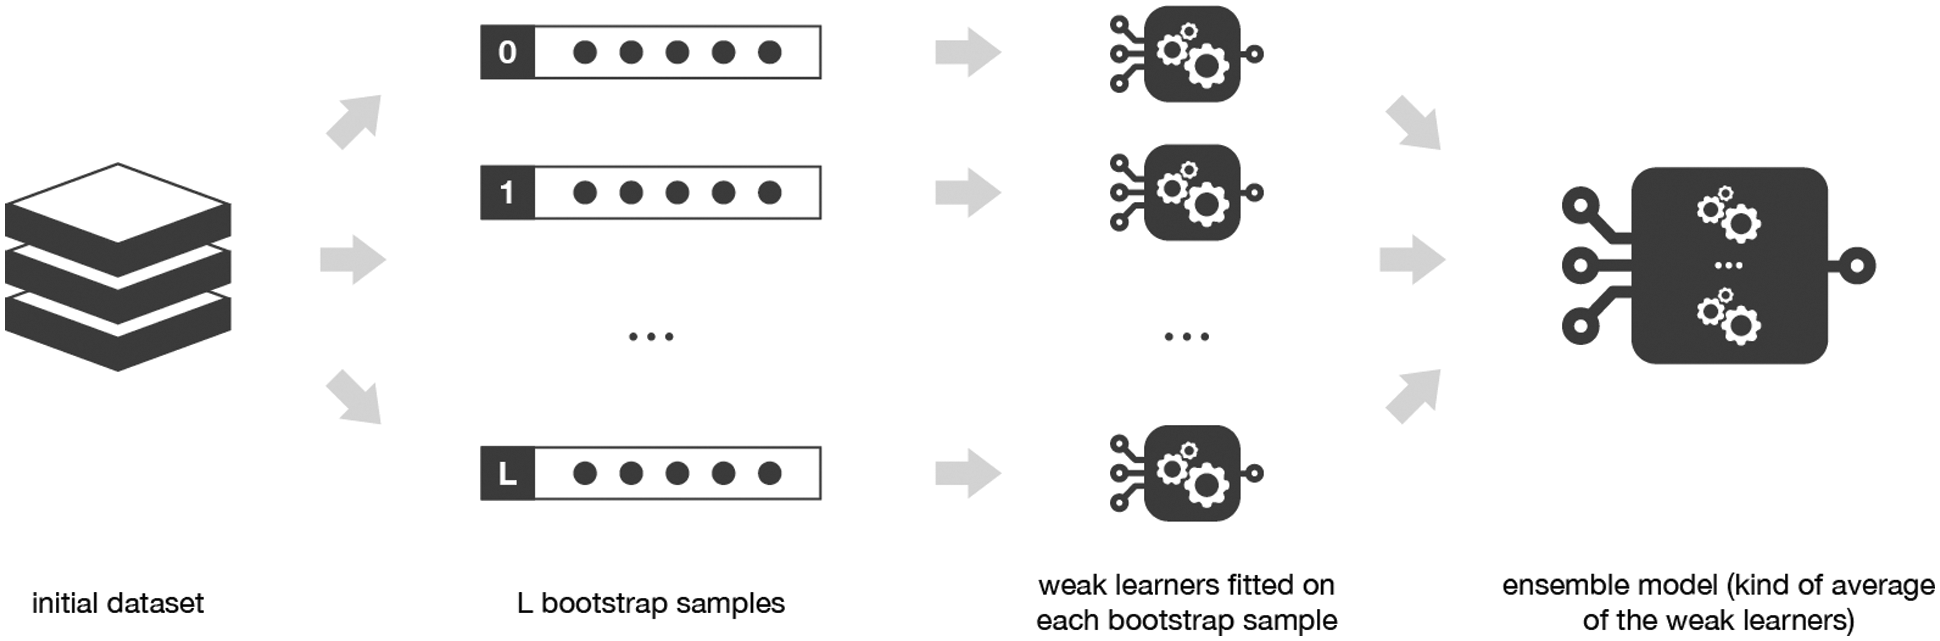
Figure 4: Workflow of bagging ensemble [43]
4.1 Description of the Dataset
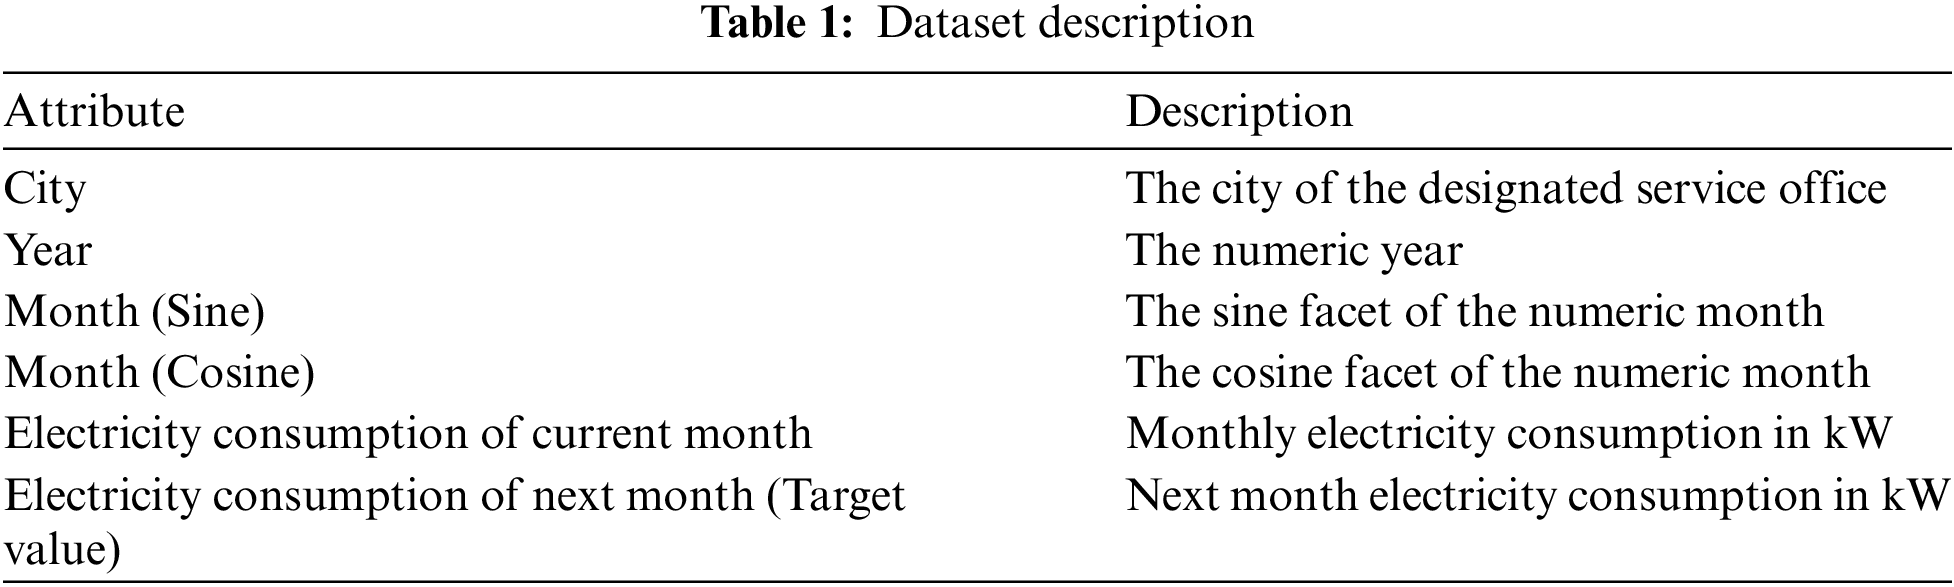
The dataset for the electricity consumption was gathered by the researchers exclusively from the Saudi Electrical Company (SEC) and covered the monthly electricity consumption in kilowatt (kW) for all the locations in Saudi Arabia from January 2010 to September 2020. The attributes of the dataset contain the monthly electricity consumption, city, and the service offices designated to that area. For this research, 18 service are considered. As the goal of this study is to predict the next month electricity consumption, the last month for each location has been removed since the data for the next month is not available. Moreover, the input features and target attribute were normalized within a 0−1 range. Moreover, the month attribute was transformed into two dimensions using the sine and cosine facet of each month to represent the cyclical attribute more competently. After pre-processing the dataset has a total of 6 attributes and comprises of 2298 instances. Tab. 1 shows a brief description of the dataset.
The Waikato Environment for Knowledge Analysis (WEKA) program was used to conduct the prediction experiments for this research. WEKA is an open-source program that includes machine learning algorithms for classification, regression, analyzing, pre-processing, and visualizing data [44]. Both the ANN and bagging models were built using the WEKA platform. Furthermore, Microsoft excel was used to manipulate the datasets for splitting, pre-processing, and statistical analysis as well as visualizing some of the data presented in this study. The dataset was split with 70% of the data for training the model with 1598 instances (Jan 2010–May 2017) and 30% for testing the model with 700 instances (Jun 2017–Aug 2020). The proposed methods’ performances were evaluated based on CC, MAPE, RMPSE, MAE, and RMSE. This research's experiment's methodology for predicting solar radiation and electricity consumption consists of the following steps: First, the pre-processing phase where the data is selected, cleaned, and combined. Then, to validate the data on the training dataset, a 10-fold cross validation was used to find the optimized parameters before applying the model to the test set. To apply the ANN, the experiment was conducted using WEKA's Multilayer Perceptron (MLP) algorithm. After hyperparameter tuning, the best optimized parameters for the ANN model were applied to the test set to measure the models’ capabilities and determine that the training models are not overfitted to the training dataset. Then, the bagging ensemble was tested by using the “bagging” algorithm in WEKA and plugging in the ANN with its optimized parameters as the chosen classifier.
5 Predicting Electricity Consumption in Saudi Arabia
For this research, ANN was applied and evaluated on the electricity consumption dataset. There are two main hyperparameters that were considered tuning in this study, which are the number of neurons in the hidden layer of the ANN structure and the learning rate. The default values for the number of neurons in the hidden layer is ‘a’ which is equivalent to the number of input features and output features divided by two. The default value for the learning rate is 0.3. Nevertheless, before performing hyperparameter tuning, the ANN model with its default values was performed on the solar radiation dataset. The results of the ANN model using the default values on the training set are seen in Tab. 2 below. The ANN model on the default values produced a CC of 0.9762, a MAPE of 0.4973, an RMSPE of 1.0247, a MAE of 0.0157, and an RMSE of 0.0263. Furthermore, for optimization purposes the hyperparameter tuning was performed first on the hidden layer parameter, where the number of neurons inside the hidden parameter was changed by an increment of five. The results of the CC, MAPE, RMSPE, MAE, and RMSE for the different number of neurons can be seen in Tab. 2.
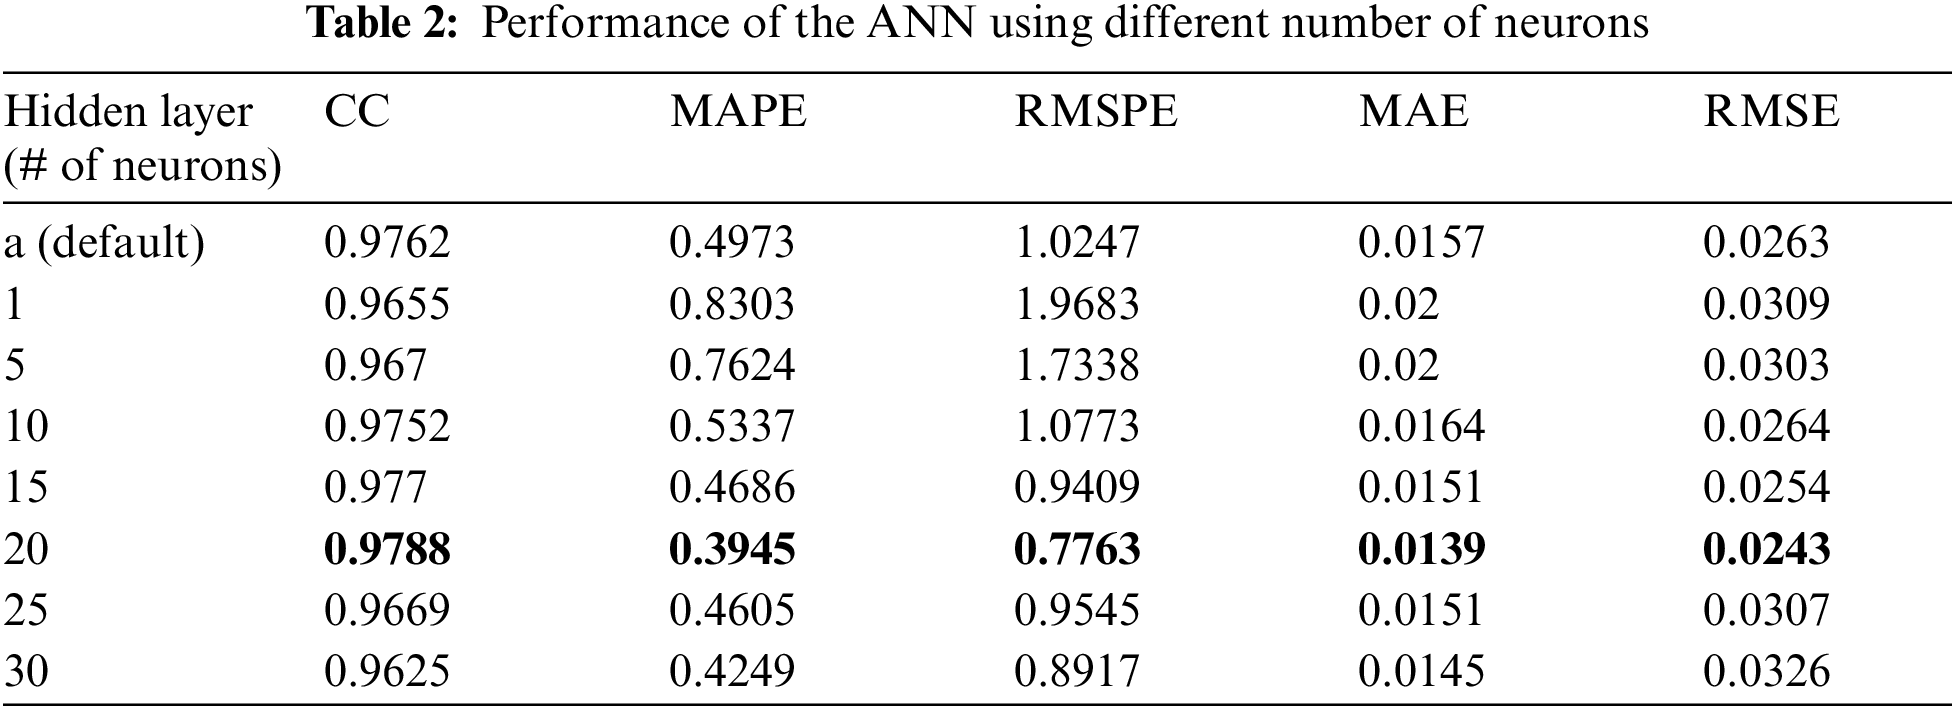
The different numbers of neurons in the hidden layer do not yield substantial differences, Ultimately, the optimal results were obtained by having 20 neurons in the hidden layer where it achieved 0.9788 CC, 0.3945 MAPE, 0.7763 RMSPE, 0.0139 MAE, and 0.0243 RMSE, respectively. Moreover, Figs. 5–9 illustrate the effects the increasing the number of neurons in the hidden layer can have on the CC, MAPE, RMSPE, MAE, and RMSE, respectively for the electricity consumption dataset. In this way, it can be found the optimized number of neurons to be used to obtain the optimum results for the undergoing study.
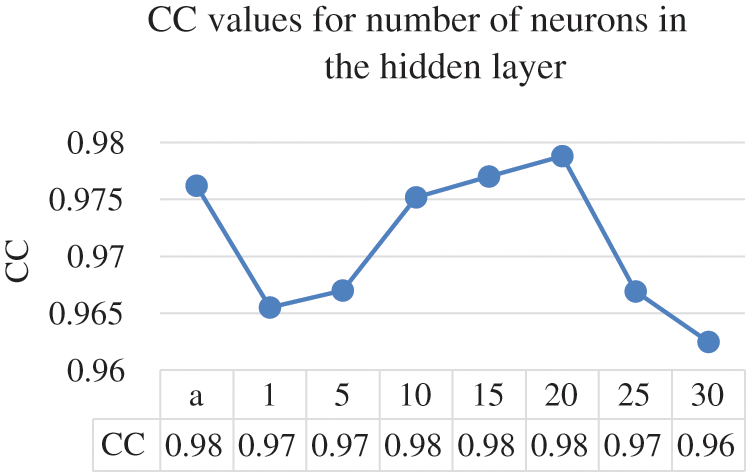
Figure 5: Number of neurons and their CC values
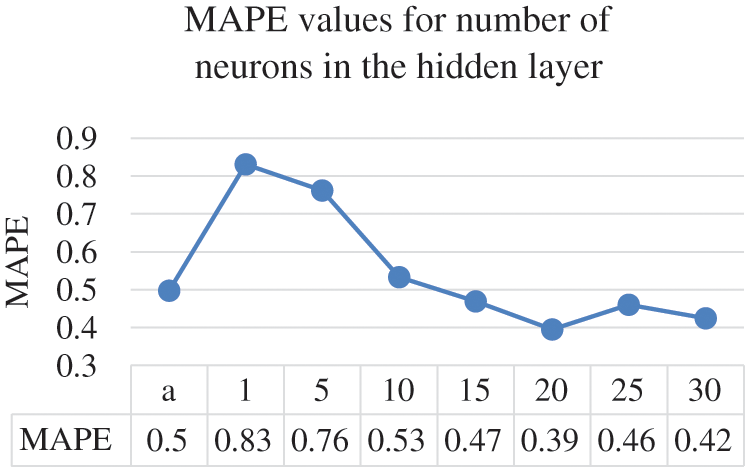
Figure 6: Number of neurons and their MAPE values
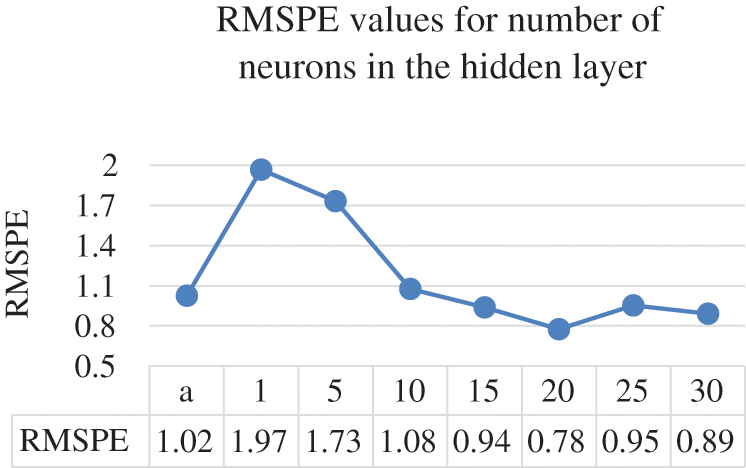
Figure 7: Number of neurons and their RMSPE values
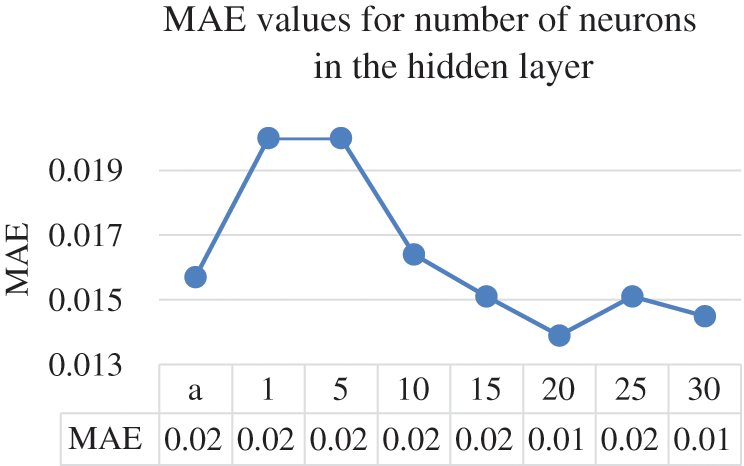
Figure 8: Number of neurons and their MAE values
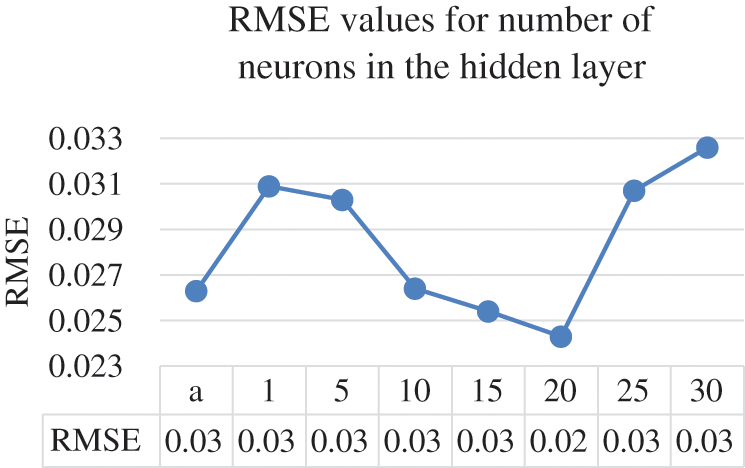
Figure 9: Number of neurons and their RMSE values
The line charts illustrate that the value of the CC continue to enhance until it reaches beyond the 20 points, where the CC value starts to decrease. The same goes with the error rates where they start decreasing in quality after the 20 neurons in the hidden layer. After setting 20 to be the optimal value for the number of neurons in the hidden layers, the next parameter to tune is the learning rate. The ANN parameter was altered by 0.1 increments on the electricity consumption dataset from the range of 0.1 to 0.5. Tab. 3 provides the results of different learning rates for the ANN model on the electricity consumption dataset.
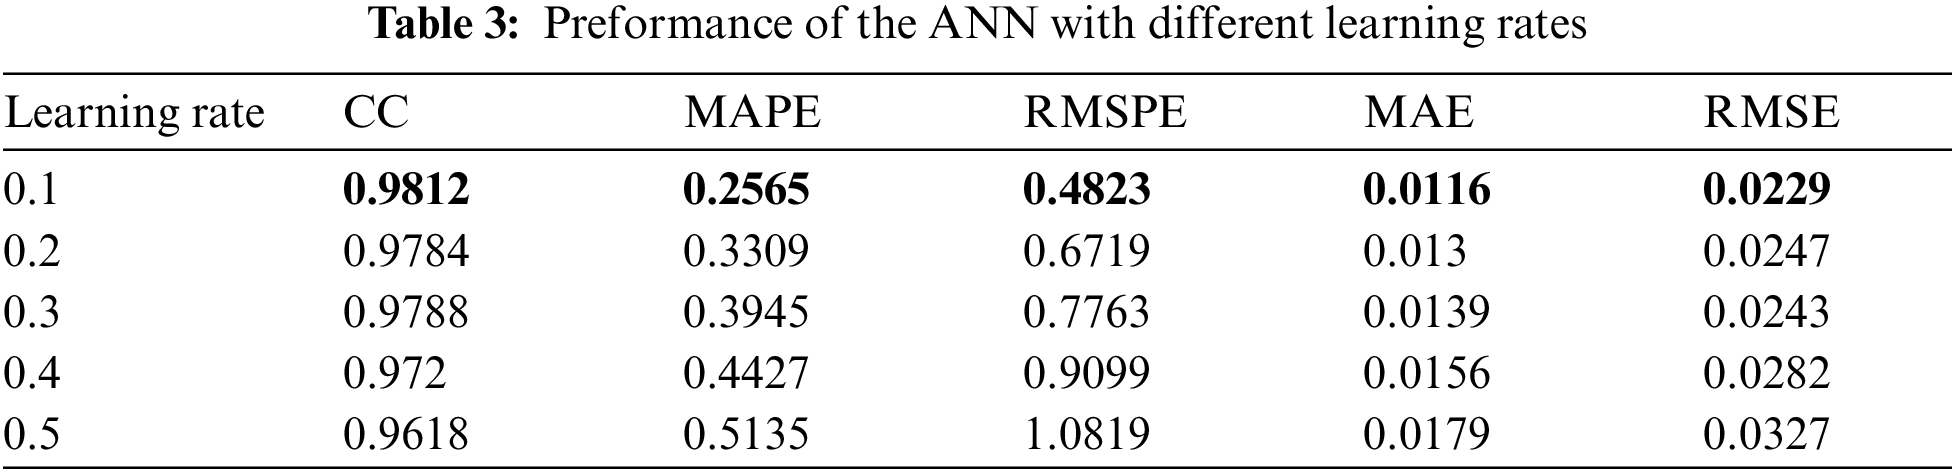
Results from tuning the learning rate on the ANN structure show that the optimal values for the CC, MAPE, RMSPE, MAE, and RMSE were all obtained by setting the learning rate to 0.1. Therefore, the learning rate will be set to 0.1 for the remainder of this experiment on the electricity consumption dataset. Moreover, Figs. 10 to 14 illustrate the effects the learning rate of the ANN has on the CC, MAPE, RMSPE, MAE, and RMSE, respectively for the electricity consumption dataset.
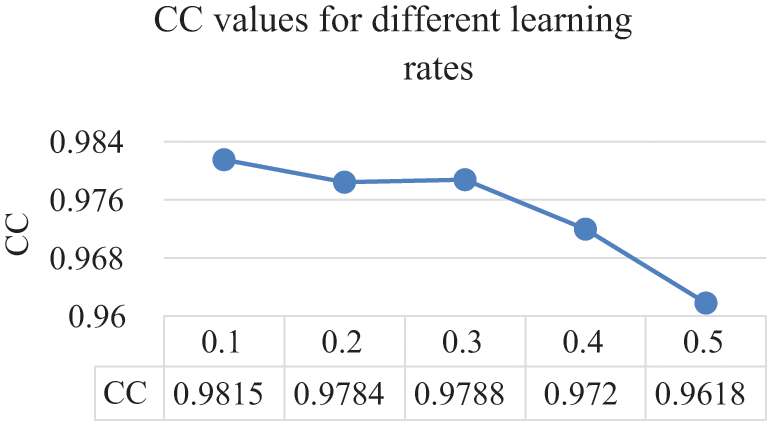
Figure 10: Learning rates and their CC values
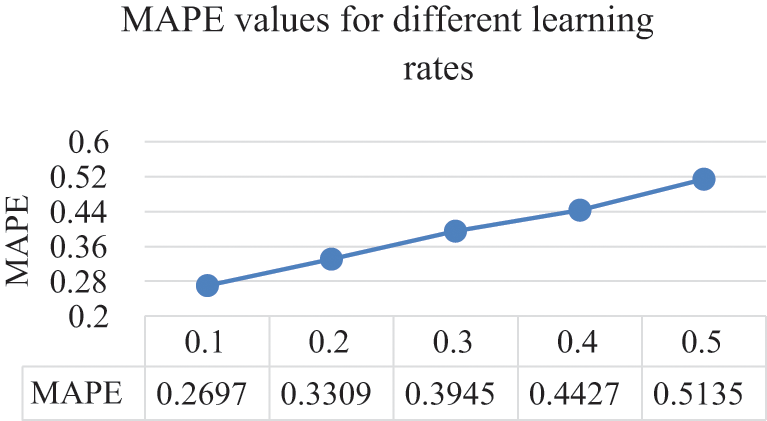
Figure 11: Learning rates and their MAPE values
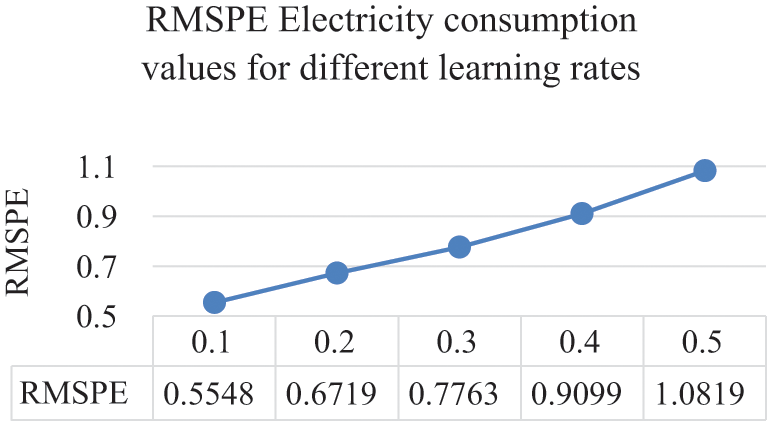
Figure 12: Learning rates and their RMSPE values
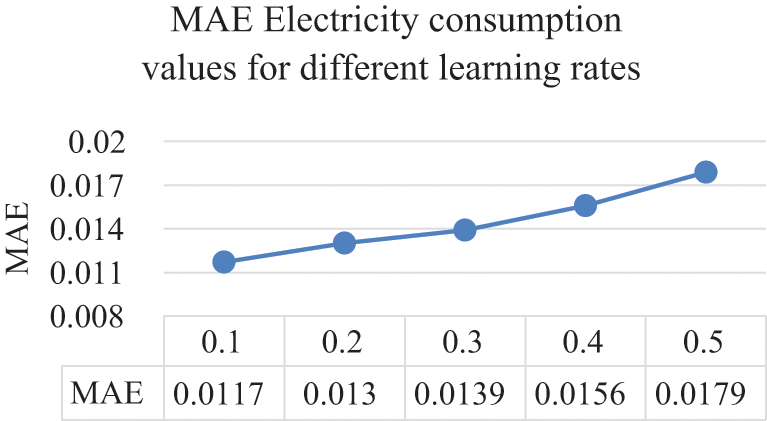
Figure 13: Learning rates and their MAE values
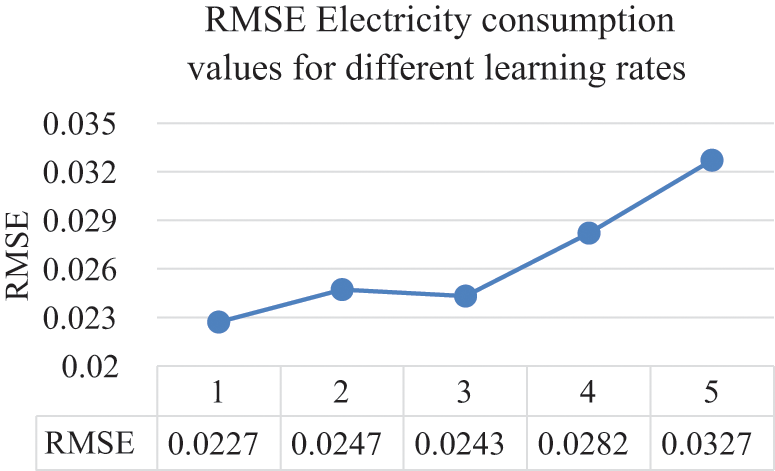
Figure 14: Learning rates and their RMSE values
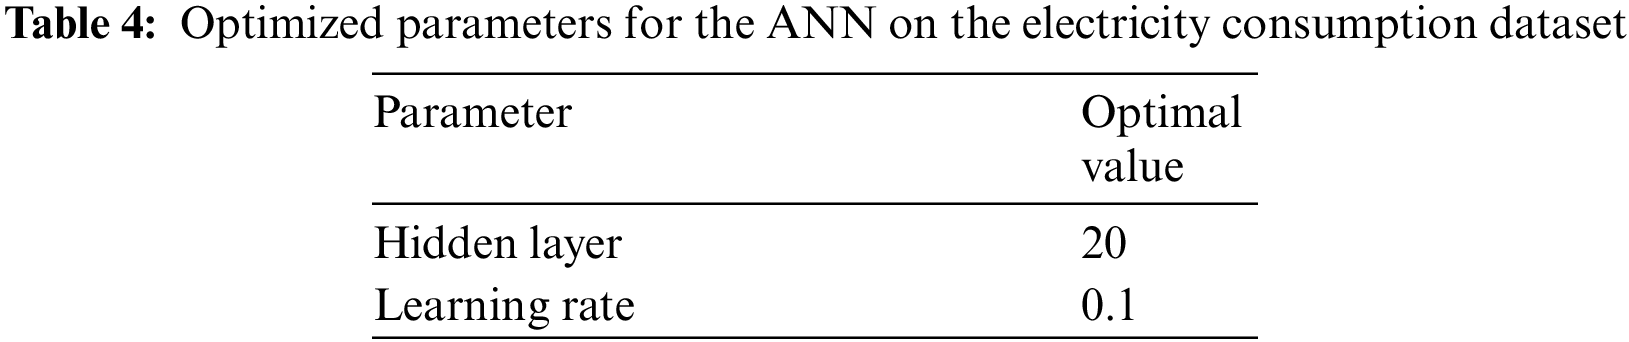
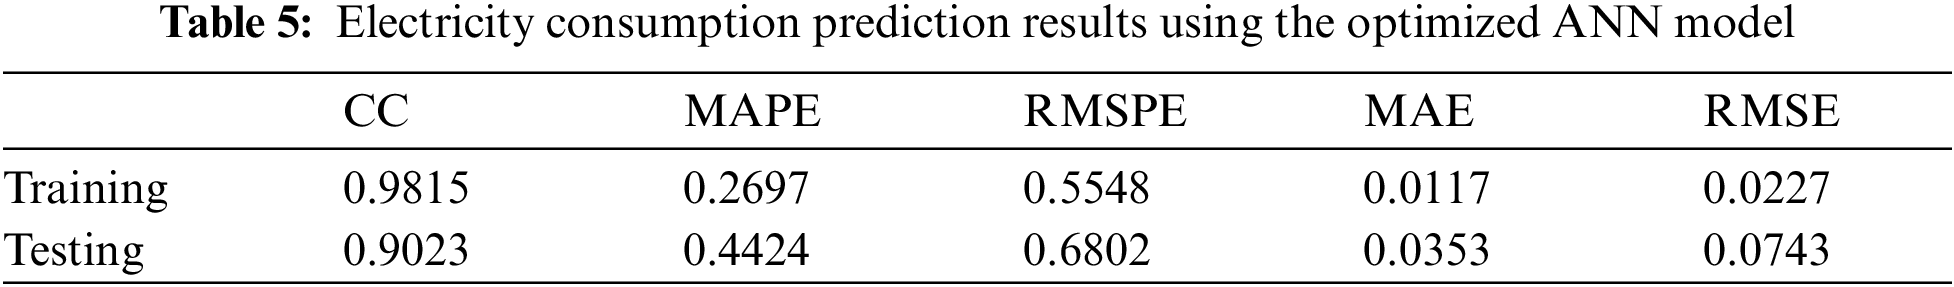
From the above figures, it is evident that as the learning rate increases, the quality of all the metrics decreases. Hence, the chosen value for the learning rate is 0.1. The optimized trained model was applied to the testing data after the ANN model parameters were optimized on the electricity consumption training data to view and analyze how well the model performs to unseen data. The optimized values of both the hidden layer and the learning rate parameter for the ANN on the electricity consumption dataset can be seen in Tab. 4. Furthermore, the results of applying the ANN structure after plugging in the optimal values on both the training and testing set can be viewed in Tab. 5 where it shows the CC, MAPE, RMSPE, MAE, and RMSE values.
From the table above, after the trained models were applied to the unseen test set, it was discovered that for the ANN, the CC decreased by 8% from the trained model. As for MAE, there was a 204% increase from the training model. RMSE also increased by 224%. MAPE and RMSPE both increased from the training set by 72.4% and 41%, respectively. It is evident that the differences in percentages are high. However, it should be noted that when looking more closely to these differences, the prediction results are still very good. As the values are low (smaller than 1), these high differences in percentages are expected and attributed to the normalization of the data, which was the case in the previous studies.
The bagging ensemble was performed on the electricity consumption dataset. The experiment was conducted using WEKA's bagging method. The only parameter that was changed was the chosen classifier used for the prediction. The parameter was changed by having the optimized ANN model as the chosen classifier. Tab. 6 shows the testing results of performing the bagging model on the electricity consumption dataset.
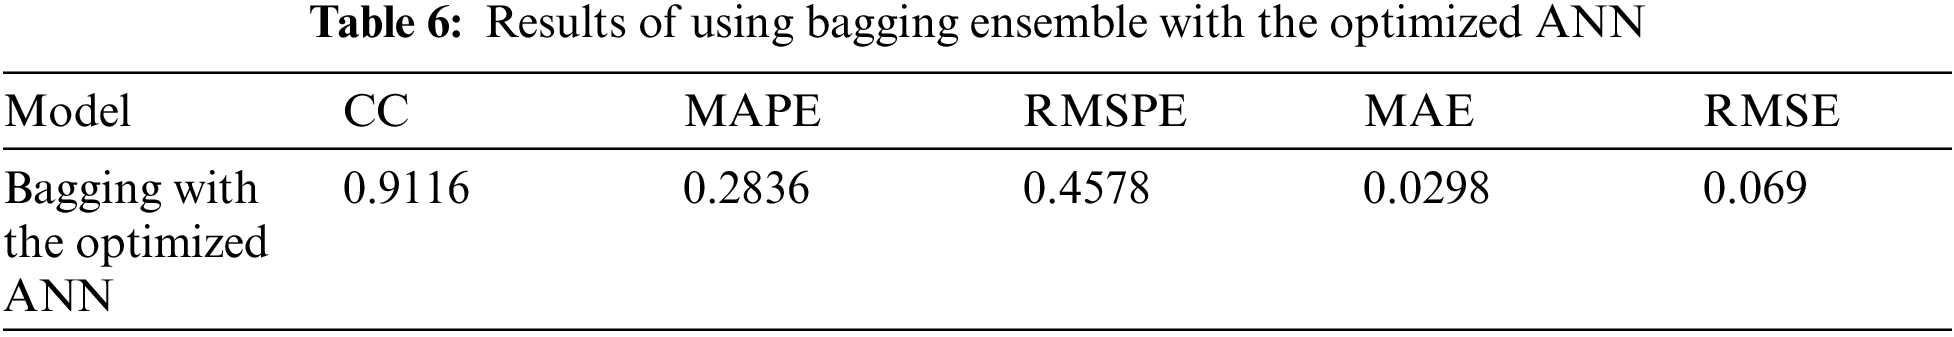
When comparing the standalone optimized ANN with the bagging ANN ensemble on the testing sets, it is evident that the ensemble technique produced better results in all evaluation metrics as illustrated in Fig. 15. The selected metrics are already described in several studies and are most widely used for the experiments and studies of similar nature [45–47]. Additionally, in terms of the extent of the improvements, the CC value increased by 1.03%, while the MAPE, RMSPE, MAE, and RMSE values all decreased by 35.895%, 32.696%, 15.58%, and 7.133%, respectively.
It can be concluded that using bagging ensemble performs well and can predict the total monthly electricity consumption adequately. Fig. 16 shows the predicted vs. actual total consumption.
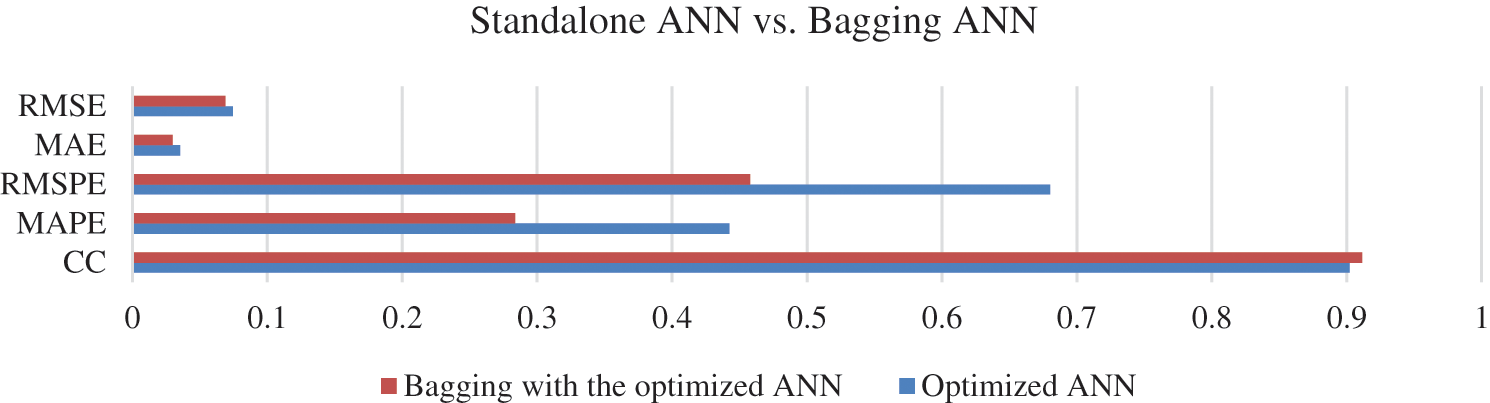
Figure 15: Results of the standalone ANN and the bagging ensemble
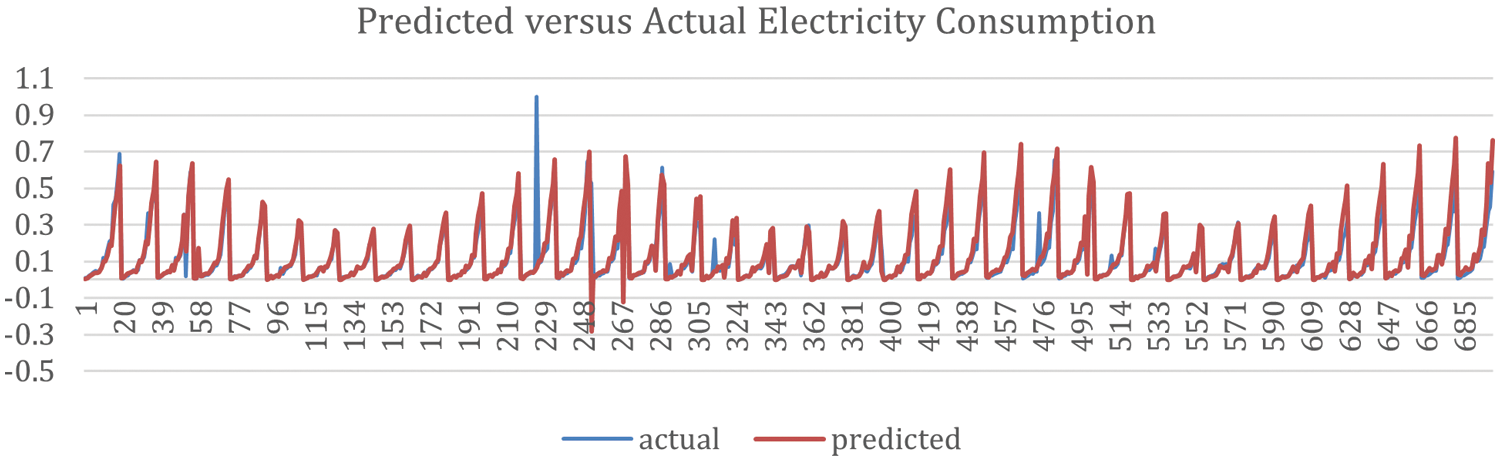
Figure 16: Proposed model's predicted electricity consumption vs. the actual consumption
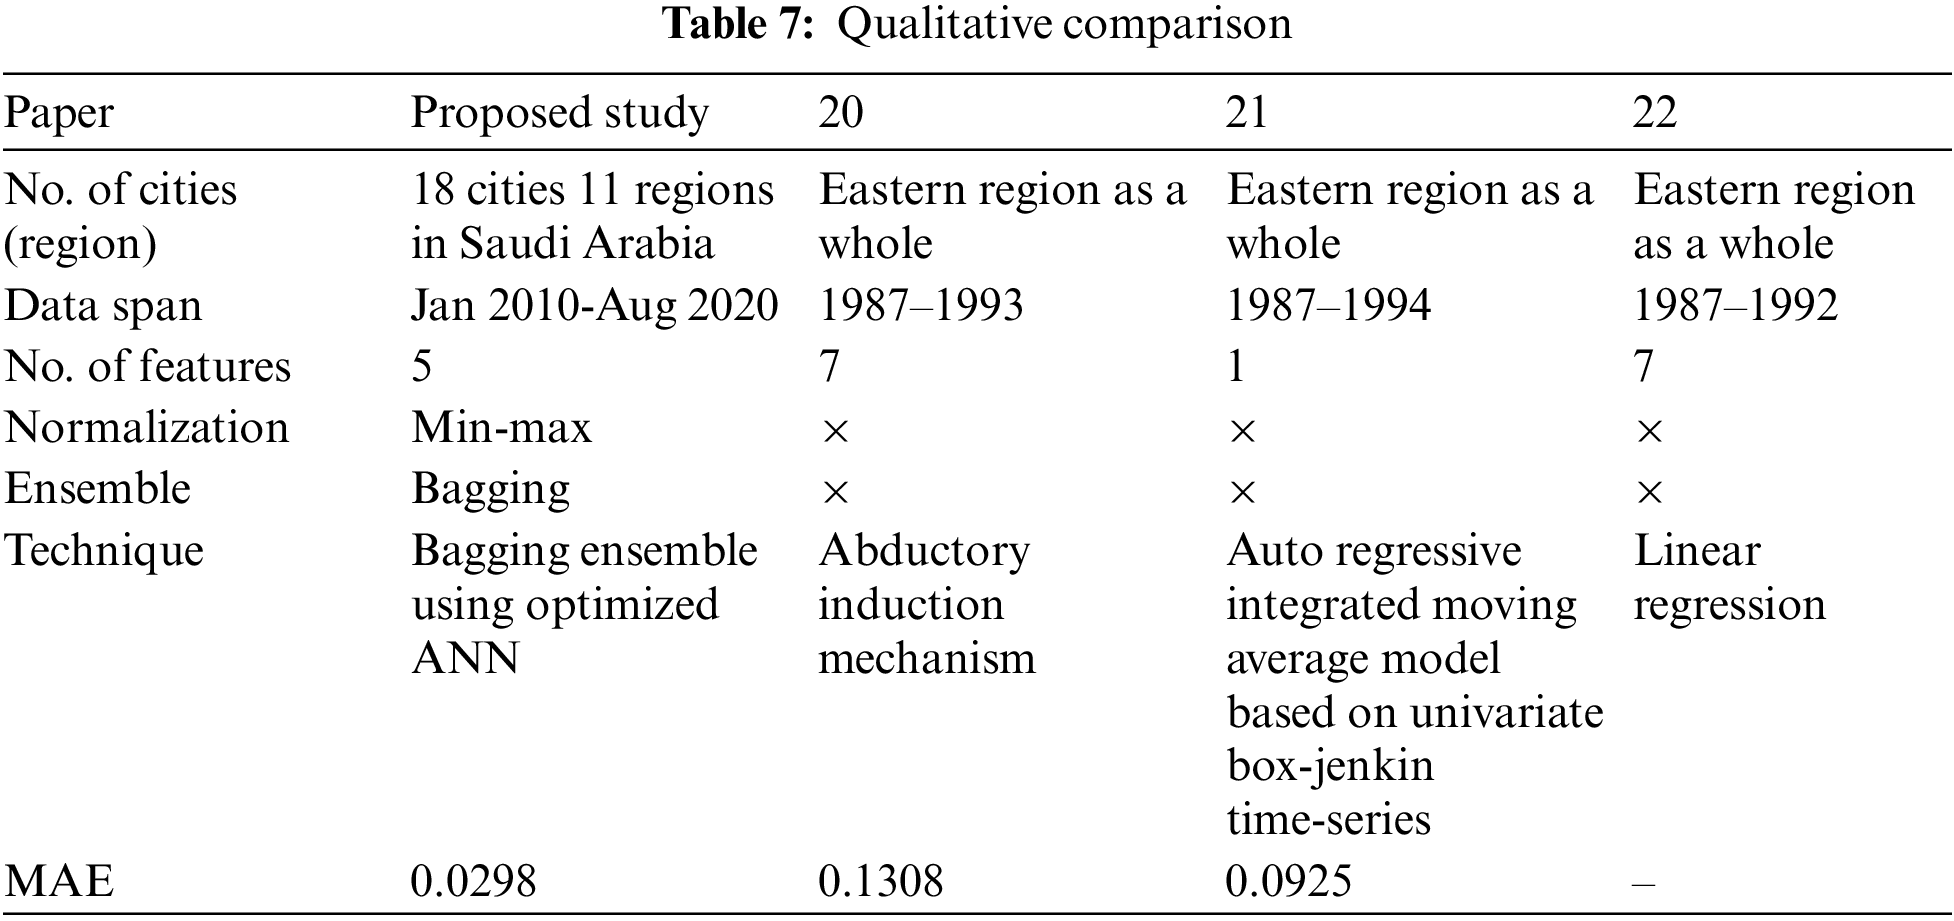
In terms of comparing this work with the past literature, every past model is different in all aspects, methodology, the span of the data, the cities included, the splitting technique, the included features, and even the goal of the model itself (daily, yearly, monthly). Furthermore, the evaluation metrics amongst each paper differed. Conversely, this study is also distinct from the other past literature that predicted electricity consumption in Saudi Arabia, such that it uses a new dataset that has not been experimented with before that includes ten years of the electricity consumption of eighteen cities and locations from across the Kingdom for both the testing and training sets. Additionally, this paper used distinctive cities in the dataset as opposed to the country or region. In contrast, the only study that included a city as a feature was by [16] for predicting a school's annual electricity consumption. Furthermore, an ensemble technique was utilized which has not been experimented with in the past. Because of the different methodology used in this study, it is very challenging to evaluate the performance of the proposed electricity consumption prediction model against the past literature. Furthermore, this study brings forth a new dataset with ten years’ worth of electricity consumption for eighteen different locations, the results are expected to be less accurate than the other models in the literature that attempt to forecast consumptions of a region as a whole [20–22], or multiple countries as a whole [19], or schools [16], or colleges [17]. Furthermore, the MAE values of this study surpass that of [20] and [21]. To conclude, when comparing the proposed model against the past previous models in the literature, it cannot be a reasonable comparison due to how different the models are inherently. Yet, it is apparent that the proposed electricity consumption model performs adequately for forecasting electricity consumption for 18 locations throughout the Kingdom. Tab. 7 shows a qualitative comparison of the proposed study with the similar studies in the literature that attempt monthly electricity consumption prediction in KSA.
Forecasting energy usage is critical for today's electric power networks to operate efficiently. The planning of future power production systems to meet the expanding needs for electrical energy requires a reliable and accurate assessment of electrical energy consumption. Predicting energy consumption may also help with smart distributed networks, analyzing socioeconomic development, distributed system design, tariff planning, supply planning, power generation plans, and ensuring electricity supply stability by balancing the quantity of electricity generated and consumed. As Saudi Arabia is one of the world's leading countries in electricity consumption, this paper proposed a unified electricity consumption prediction model. The built models utilized new data obtained by the authors from the Saudi Electric Company that contained the monthly total electricity consumption for 18 locations across the Kingdom. The data was preprocessed by normalizing the numerical features within a range between 0−1. Furthermore, the cyclic attributes were transformed into their sine and cosine counterparts. A standalone Artificial Neural Network and a bagging ensemble were used to achieve the goal of the study. The ANN was optimized by using hyperparameter tuning and its results were analyzed and discussed. Furthermore, a bagging ensemble was implemented with the previously optimized ANN as the chosen classifier. The results concluded that the bagging ensemble outperformed the standalone ANN in all evaluation metrics where it achieved a 0.9116 CC, 0.2836 MAPE, 0.4578, RMSPE, 0.0298 MAE, and 0.069 RMSE. For the future work, more machine learning models can be investigated in addition to feature selection techniques. Furthermore, the original dataset contains a breakdown of the electricity consumption based on the sectors, such as governmental, schools, and household consumption. It would be interesting to investigate how well the proposed models can perform while focusing on a certain sector.
Acknowledgement: The authors would like to thank the Saudi Electrical Company (SEC), Saudi Arabia for providing the electricity consumption data.
Funding Statement: The authors received no specific funding for this study.
Conflicts of Interest: The authors declare, there is no conflicts of interest to report regarding the study.
1. R. Weron, “Electricity price forecasting: A review of the state-of-the-art with a look into the future,” International Journal of Forecasting, vol. 30, no. 4, pp. 1030–1081, 2014. [Google Scholar]
2. B. J. Chen, M. W. Chang and C. J. Lin, “Load forecasting using support vector machines: A study on EUNITE competition 2001,” IEEE Transactions on Power Systems, vol. 19, no. 4, pp. 1821–1830, 2004. [Google Scholar]
3. H. Guo, Q. Chen, Q. Xia, C. Kang and X. Zhang, “A monthly electricity consumption forecasting method based on vector error correction model and self-adaptive screening method,” International Journal of Electrical Power and Energy Systems, vol. 95, no. 1, pp. 427–439, 2018. [Google Scholar]
4. X. Zhu, Y. Dang and S. Ding, “Using a self-adaptive grey fractional weighted model to forecast Jiangsu's electricity consumption in China,” Energy, vol. 190, no. 1, pp. 116417, 2019. [Google Scholar]
5. M. A. Salam and S. A. Khan, “Transition towards sustainable energy production–a review of the progress for solar energy in Saudi Arabia,” Energy Exploration and Exploitation, vol. 36, no. 1, pp. 3–27, 2018. [Google Scholar]
6. M. Almaraashi, “Short-term prediction of solar energy in Saudi Arabia using automated-design fuzzy logic systems,” PLoS ONE, vol. 12, no. 8, pp. 1–16, 2017. [Google Scholar]
7. K. B. Debnath and M. Mourshed, “Forecasting methods in energy planning models,” Renewable and Sustainable Energy Reviews, vol. 88, no. 1, pp. 297–325, 2018. [Google Scholar]
8. S. G. Kim, J. Y. Jung and M. K. Sim, “A Two-step approach to solar power generation prediction based on weather data using machine learning,” Sustainability, vol. 11, no. 5, pp. 1501, 2019. [Google Scholar]
9. S. Blumsack and A. Fernandez, “Ready or not, here comes the smart grid!,” Energy, vol. 37, no. 1, pp. 61–68, 2012. [Google Scholar]
10. P. Singh and P. Dwivedi, “A novel hybrid model based on neural network and multi-objective optimization for effective load forecast,” Energy, vol. 182, no. 1, pp. 606–622, 2019. [Google Scholar]
11. L. F. Tratar and E. Strmčnik, “The comparison of holt-winters method and multiple regression method: A case study,” Energy, vol. 109, no. 1, pp. 266–276, 2016. [Google Scholar]
12. W. Jiang, X. Wu, Y. Gong, W. Yu and X. Zhong, “Holt–winters smoothing enhanced by fruit fly optimization algorithm to forecast monthly electricity consumption,” Energy, vol. 193, no. 1, pp. 116779, 2020. [Google Scholar]
13. H. Mengying, D. Jiandong, H. Zequan, W. Peng, F. Shuai et al., “Monthly electricity forecast based on electricity consumption characteristics analysis and multiple effect factors,” in Proc. IEEE 8th Int. Conf. on Advanced Power System Automation and Protection (APAP), Xi'an, China, pp. 1814–1818, 2019. [Google Scholar]
14. G. Oğcu, O. F. Demirel and S. Zaim, “Forecasting electricity consumption with neural networks and support vector regression,” Procedia-Social and Behavioral Sciences, vol. 58, no. 1, pp. 1576–1585, 2012. [Google Scholar]
15. F. Kaytez, M. C. Taplamacioglu, E. Cam and F. Hardalac, “Forecasting electricity consumption: A comparison of regression analysis, neural networks and least squares support vector machines,” International Journal of Electrical Power and Energy Systems, vol. 67, no. 1, pp. 431–438, 2015. [Google Scholar]
16. A. Mohammed, A. Alshibani, O. Alshamrani and M. Hassanain, “A Regression-based model for estimating the energy consumption of school facilities in Saudi Arabia,” Energy and Buildings, vol. 237, no. 1, pp. 110809, 2021. [Google Scholar]
17. M. Alanbar, A. Alfarraj and M. Alghieth, “Energy consumption prediction using deep learning technique case study of computer college,” International Journal of Interactive Mobile Technologies, vol. 14, no. 10, pp. 166–177, 2020. [Google Scholar]
18. M. Ouda, S. El-Nakla, C. B. Yahya and K. M. O. Ouda, “Electricity demand forecast in Saudi Arabia,” in Proc. 2019 IEEE 7th Palestinian Int. Conf. on Electrical and Computer Engineering (PICECE), Gaza, Palestine, pp. 1–5, 2019. [Google Scholar]
19. A. Khan, H. Chiroma, M. Imran, A. Khan, J. Bangash et al., “Forecasting electricity consumption based on machine learning to improve performance: A case study for the organization of petroleum exporting countries (OPEC),” Computers and Electrical Engineering, vol. 86, no. 1, pp. 106737, 2020. [Google Scholar]
20. R. E. Abdel-Aal, A. Z. Al-Garni and Y. N. Al-Nassar, “Modelling and forecasting monthly electric energy consumption in eastern Saudi Arabia using abductive networks,” Energy, vol. 22, no. 9, pp. 911–921, 1997. [Google Scholar]
21. R. E. Abdel-Aal and A. Z. Al-Garni, “Forecasting monthly electric energy consumption in eastern Saudi Arabia using univariate time-series analysis,” Energy, vol. 22, no. 11, pp. 1059–1069, 1997. [Google Scholar]
22. A. Z. Al-Garni, S. M. Zubair and J. Nizami, “A regression model for electric-energy-consumption forecasting in eastern Saudi Arabia,” Energy Sources, vol. 19, no. 4, pp. 325–334, 1994. [Google Scholar]
23. F. Alhaidari, S. H. Almotiri, M. A. Ghamdi, M. A. Khan, A. Rehman et al., “Intelligent software-defined network for cognitive routing optimization using deep extreme learning machine approach,” Computers, Materials & Continua, vol. 67, no. 1, pp. 1269–1285, 2021. [Google Scholar]
24. M. Gupta, L. Jin and N. Homma, Static and Dynamic Neural Networks: From Fundamentals to Advanced Theory. 1st ed., New York: Wiley-IEEE Press, 2003. [Google Scholar]
25. M. Hassoun, Fundamentals of Artificial Neural Networks. Cambridge,Massachusetts: MIT Press, 1995. [Google Scholar]
26. A. Alzahrani, P. Shamsi, C. Dagli and M. Ferdowsi, “Solar irradiance forecasting using deep neural networks,” Procedia Computer Science, vol. 114, no. 1, pp. 304–313, 2017. [Google Scholar]
27. A. Rahman, I. M. Qureshi, A. N. Malik and M. T. Naseem, “QoS and rate enhancement in DVB-s2 using fuzzy rule base system,” Journal of Intelligent & Fuzzy Systems, vol. 30, no. 1, pp. 801–810, 2016. [Google Scholar]
28. A. Rahman, S. Dash, A. K. Luhach, N. Chilamkurti, S. Baek et al., “A Neuro-fuzzy approach for user behavior classification and prediction,” J Cloud Comp, vol. 8, no. 17, pp. 1–15, 2019. [Google Scholar]
29. M. Mahmud, A. Rahman, M. Lee and J. Choi, “Evolutionary-based image encryption using RNA codons truth table,” Optics & Laser Technology, vol. 121, no. 1, pp. 1–8, 2020. [Google Scholar]
30. M. T. Naseem, I. M. Qureshi, A. Rahman and M. Z. Muzaffar, “Robust and fragile watermarking for medical images using redundant residue number system and chaos,” Neural Network World, vol. 30, no. 3, pp. 177–192, 2020. [Google Scholar]
31. A. Rahman, “Optimum information embedding in digital watermarking,” Journal of Intelligent and Fuzzy Systems, vol. 37, no. 1, pp. 553–564, 2019. [Google Scholar]
32. M. A. Khan, S. Abbas, A. Atta, A. Ditta, H. Alquhayz et al., “Intelligent cloud based heart disease prediction system empowered with supervised machine learning,” Computers, Materials & Continua, vol. 65, no. 1, pp. 139–151, 2020. [Google Scholar]
33. A. Rahman, “Memetic computing based numerical solution to troesch problem,” Journal of Intelligent and Fuzzy Systems, vol. 37, no. 1, pp. 1545–1554, 2019. [Google Scholar]
34. A. Rahman, S. Dash and A. K. Luhach, “Dynamic MODCOD and power allocation in DVB-s2: A hybrid intelligent approach,” Telecommun Syst., vol. 76, no. 1, pp. 49–61, 2021. [Google Scholar]
35. A. Rahman, “GRBF-NN based ambient aware realtime adaptive communication in DVB-s2,” J Ambient Intell Human Comput, vol. 12, no. 1, pp. 1–11, 2020. [Google Scholar]
36. A. Rahman, I. M. Qureshi, A. N. Malik and M. T. Naseem, “A real time adaptive resource allocation scheme for OFDM systems using GRBF-neural networks and fuzzy rule base system,” International Arab Journal of Information Technology, vol. 11, no. 6, pp. 593–601, 2014. [Google Scholar]
37. A. Rahman, K. Sultan, I. Naseer, R. Majeed, D. Musleh et al., “Supervised machine learning-based prediction of COVID-19,” Computers, Materials & Continua, vol. 69, no. 1, pp. 21–34, 2021. [Google Scholar]
38. S. M. Alotaibi, A. Rahman, M. I. Basheer and M. A. Khan, “Ensemble machine learning based identification of pediatric epilepsy,” Computers, Materials & Continua, vol. 68, no. 1, pp. 149–165, 2021. [Google Scholar]
39. R. Zagrouba, M. A. Khan, A. Rahman, M. A. Saleem, M. F. Mushtaq et al., “Modelling and simulation of COVID-19 outbreak prediction using supervised machine learning,” Computers, Materials & Continua, vol. 66, no. 3, pp. 2397–2407, 2021. [Google Scholar]
40. A. Dilawari, M. U. G. Khan, Y. D. Al-Otaibi, Z. Rehman, A. Rahman et al., “Natural language description of videos for smart surveillance,” Appl. Sci., vol. 11, no. 9, pp. 3730–3742, 2021. [Google Scholar]
41. L. Breiman, “Bagging predictors,” Machine Learning, vol. 24, no. 2, pp. 123–140, 1996. [Google Scholar]
42. E. Bauer and R. Kohavi, “Empirical comparison of voting classification algorithms: Bagging, boosting, and variants,” Machine Learning, vol. 36, no. 1, pp. 105–139, 1999. [Google Scholar]
43. J. Rocca, “Ensemble methods: bagging, boosting and stacking,” Towards Data Science, https://towardsdatascience.com/ensemble-methods-bagging-boosting-and-stacking-c9214a10a205, accessed Oct. 26, 2021. [Google Scholar]
44. A. Rahman, K. Sultan, N. Aldhafferi and A. Alqahtani, “Educational data mining for enhanced teaching and learning,” Journal of Theoretical and Applied Information Technology, vol. 96, no. 14, pp. 4417–4427, 2018. [Google Scholar]
45. M. I. B. Ahmed, A. Rahman, M. Farooqui, F. Alamoudi, R. Baageel et al. “Early identification of COVID-19 using dynamic fuzzy rule based system,” Mathematical Modelling of Engineering Problems, vol. 8, no. 5, pp. 805–812, 2021. [Google Scholar]
46. G. Zaman, H. Mahdin, K. Hussain, A. Rahman, J. Abawajy and S. A. Mostafa, “An ontological framework for information extraction from diverse scientific sources,” IEEE Access, vol. 9, no. 1, pp. 42111–42124, 2021. [Google Scholar]
47. M. Ahmad, M. A. Qadir, A. Rahman, R. Zagrouba, F. Alhaidari et al., “Enhanced query processing over semantic cache for cloud based relational databases,” J Ambient Intell Human Comput, vol. 20, no. 4, pp. 1–9, 2020. [Google Scholar]
 | This work is licensed under a Creative Commons Attribution 4.0 International License, which permits unrestricted use, distribution, and reproduction in any medium, provided the original work is properly cited. |