DOI:10.32604/cmc.2022.025466

| Computers, Materials & Continua DOI:10.32604/cmc.2022.025466 |  |
| Article |
Energy Theft Identification Using Adaboost Ensembler in the Smart Grids
1Electrical Engineering Department, College of Engineering, Najran University Saudi Arabia, Najran, 61441, Saudi Arabia
2Department of Computer Science, Federal Urdu University of Science and Technology, Islamabad, 44000, Pakistan
3Faculty of Maritime Studies, King Abdulaziz University, Jeddah, 21589, Saudi Arabia
4Department of Electrical Engineering, HITEC University, Taxila, 47080, Pakistan
5Department of Computer Science and Engineering, University of Engineering and Technology, Narowal Campus, Lahore, 54000, Pakistan
6College of Computer Science and Information Systems, Najran University, Najran, 61441, Saudi Arabia
7Department of Electrical and Power Engineering, AGH University of Science and Technology Mickiewicza 30 Avenue, Krakow, 30-059, Poland
*Corresponding Author: Muhammad Irfan. Email: irfan16.uetian@gmail.com
Received: 24 November 2021; Accepted: 07 January 2022
Abstract: One of the major concerns for the utilities in the Smart Grid (SG) is electricity theft. With the implementation of smart meters, the frequency of energy usage and data collection from smart homes has increased, which makes it possible for advanced data analysis that was not previously possible. For this purpose, we have taken historical data of energy thieves and normal users. To avoid imbalance observation, biased estimates, we applied the interpolation method. Furthermore, the data unbalancing issue is resolved in this paper by Nearmiss undersampling technique and makes the data suitable for further processing. By proposing an improved version of Zeiler and Fergus Net (ZFNet) as a feature extraction approach, we had able to reduce the model's time complexity. To minimize the overfitting issues, increase the training accuracy and reduce the training loss, we have proposed an enhanced method by merging Adaptive Boosting (AdaBoost) classifier with Coronavirus Herd Immunity Optimizer (CHIO) and Forensic based Investigation Optimizer (FBIO). In terms of low computational complexity, minimized over-fitting problems on a large quantity of data, reduced training time and training loss and increased training accuracy, our model outperforms the benchmark scheme. Our proposed algorithms Ada-CHIO and Ada-FBIO, have the low Mean Average Percentage Error (MAPE) value of error, i.e., 6.8% and 9.5%, respectively. Furthermore, due to the stability of our model our proposed algorithms Ada-CHIO and Ada-FBIO have achieved the accuracy of 93% and 90%. Statistical analysis shows that the hypothesis we proved using statistics is authentic for the proposed technique against benchmark algorithms, which also depicts the superiority of our proposed techniques
Keywords: Smart grids and meters; electricity theft detection; machine learning; AdaBoost; optimization techniques
By adding new transmission technology, i.e., smart meters, a traditional power network becomes an SG infrastructure. Current findings in [1] demonstrate that the SG can help to control electrical power efficiently. To create the ultimate use of deployed resources [2], the SG framework has created the platform [3] for transactive energy and short-term load balancing. The work in [4] proposes a hierarchical energy delivery system that avoids peak hours and exchanges more power for less money. To reduce the unpredictable nature of green energy, a strategy based on information-gap decision theory [5] is applied. In an SG, the meter reading shares data among energy users and also the infrastructure. It stores an immense amount of data, including consumers’ electrical energy usage. Artificial intelligence techniques may manipulate these data to map customer energy usage trends and reliably detect power thieves through using them.
Power grids all around the world are concerned with energy losses in electricity generation and transmission. Energy losses are generally known as Non-Technical Loss (NTL) and Technical Losses (TL) [6]. TLs are caused by the internal functioning of power grid components such as transformers and transmission lines in the transmission of electricity; NTLs is defined as the difference between total losses and TLs caused mostly by energy theft. Physical attacks such as line tapping, meter smashing and interruption meter reading are the most common ways to stop power [7]. As a result, the revenue loss of power utilities will arise from these electricity fraud activities. Herein, the cost of power theft in the United States (US) is estimated to be about $4.5 billion a year [8]. Nonetheless, it is believed that electricity theft costs the world's power systems more than $20 billion per year [9]. As a result of the advent of digital metering infrastructure in SGs, utility companies have collected massive volumes of actual electricity usage data from smart meters, allowing them to track power loss [10]. The Advanced Meter Infrastructure (AMI) network, on the other hand, makes new energy theft attacks possible. AMI attacks can take a range of forms, including cyber-attacks and digital devices. Unauthorized line diversions, meter data comparisons and testing problematic equipment or hardware are also critical strategies for identifying electricity theft. Whereas, these solutions are highly costly and time-consuming when inspecting all of the meters in a system [11].
Special devices, such as transmission transformers and wireless sensors, use the state-based recognition concept [12]. These techniques can detect energy theft, but they necessitate the procurement of real-time system topology and additional physical measurements, which can be challenging to obtain. Game-based control systems create a game involving power utility and theft, then use the game equilibrium to generate various normal and abnormal behavior distributions. They achieve a low cost and a fair outcome in minimizing energy theft, as detailed in [13]. Although evaluating the utility function of each player is still a challenge (e.g., regulators, marketers and fraudsters). Deep learning and machine learning approaches are examples of artificial intelligence-focused methods. There are two types of machine learning systems clustering models and classification, as described in [14]. While the methods of detecting ma-chine learning described above are revolutionary and exceptional, their efficiency is still not adequate for practice. The majority of these approaches, for example, focus on manual feature extraction due to their limited capacity to manage data with several dimensions. The standard deviation, mean, minimum and maximum of costs and extra are all hand-designed functions. Manually removing functionality from smart meter data is time-consuming and tedious and it skips out capturing 2D features.
From the aforementioned literature, the current Electricity Theft Detection (ETD) methods’ results are relevant. These processes, on the other hand, have certain limitations, which are outlined as follows. 1) Traditional ETD employs manual processes, such as human checking of meter readings and manual catching of electricity transmission lines. On the other hand, these tactics require an additional cost for the inspection teams that will be hiring. 2) The False Positive Rate (FPR) of game theory-based approaches is high, while the recognition rate is low. 3) The state-based approach is costly, although the installation of hardware needs an extra cost [15]. 4) The handling of unbalanced data is a big concern in ETD using machine learning techniques. This issue is left unresolved in conventional models. Some authors employ the Synthetic Minority Oversampling Technique (SMOTE) and Rusboost approaches, both of which result in information loss and overfitting. 5) In some instances, the available data includes inaccurate data that minimize the precision of the classification [16]. 6) For big data, traditional machine learning strategies like the Logistic Regression (LR) and Support Vector Machine (SVM) have poor classification efficiency [17]. 7) The machine learning techniques have the overfitting problem on a large amount of ETD data [18].
We employed an interpolation approach to modify missing values, normalization methods and the three-sigma rule to pre-process the electrical data to address the aforementioned issues, namely missing values and eliminating outliers in the data. For managing the imbalanced dataset, a Near-miss algorithm is applied. Afterward, the balanced data is fed into the ZFNet module for feature extraction and ZFNet is opted to detect the irregular patterns. Finally, the obtained features are forwarded to the AdaBoost-based FBIO and AdaBoost-based CHIO Algorithm module for classification. To this end, the following points discuss the paper's} main application. 1) The proposed strategy offers a solution to an issue in the power grid, such as energy waste due to electricity theft. 2) Utility companies can effectively enforce this model by classifying electricity criminals and reducing energy waste using current power consumption data. 3) It is possible to use the suggested solution against all forms of customers that steal energy.
Herein, the following are the key contributions:
1. We have stabilized, balance the data, removed unbiased estimates and ensure valid conclusions with the Interpolation method and near-miss algorithm along with the proposed Enhanced version of the ZFNet technique.
2. Also, we minimized the overfitting issues, computational complexity by 9%, less model training time, and model training loss by a proposed enhanced version of the AdaBoost classifier.
3. Less computation time while utilizing as few resources as feasible. Anomalous and normal user classification accuracy and stability are achieved using optimation methods; CHIO and FBIO. Optimization techniques are merged with AdaBoost to fine-tune the classifier by defining a subset of its parameters.
4. Extensive simulations are carried out on actual electricity consumption collection of data are used as output evaluators for comparative analysis, accuracy, recall, F1-score, Kruskal Test, Mann-Whitney Test, Paired Student's Test, ANOVA Test, Student's Test, Pearson's Test, Wilcoxon Test, Spearman's Test, Chi-Squared Test, Kendalla's Test Obtaining Operational Characteristics Area Under Curve (ROC-AUC), MAPE, Mean Average Error (MAE) and Root Mean Square Error (RMSE)
Recently, researchers have applied different techniques to track energy theft. It is possible to classify these methods into three categories: game theory, state-based strategies and machine learning. To detect power theft, state-based solutions use external hardware devices such as distribution transformers, wireless sensors and smart meters [19]. So the need for extra hardware resources, this approach has a high deployment cost. In a theory-based game scheme, the power suppliers and energy criminals are thought to be playing a game. The difference between positive consumer behavior and electricity thieves may be utilized to assess the game's outcome [20]. After all, describing the utility function with all players in the game is extremely difficult. For ETD, machine learning approaches are commonly used. They are further categorized into supervised (classification) and unsupervised (clustering) approaches, which are then applied to unlabeled datasets to distinguish between illegitimate and legitimate consumers. Tab. 1 presents the existing approaches used by ETD, containing their inputs and their shortcomings.
Based on supervised learning, our solution is proposed. Therefore, the details of recent advances made in supervised learning methods will be reviewed. LR and SVM are often used for ETD [21]. When the dataset is small, these strategies work better. However, when the dataset is wide and highly imbalanced, these strategies are not successful. A hybrid model combining Long Short-Term Memory (LSTM) and Convolutional Neural Network (CNN) was proposed in [22]. The CNN gathers features, while the LSTM refines them to distinguish between normal consumers and energy thieves. For an unbalanced dataset, the SMOTE is applied to make it balanced. Strong results have been obtained, i.e., 90% accuracy and 87% recall. The over-fitting problem caused by the inclusion of duplicate data through SMOTE is not taken into account. The author proposed a hybrid ETD model based on LSTM and Multi-Layer Perception (MLP) in [23]. LSTM and MLP are used to combine additional data and energy usage data; this model describes the NTL. The problem of unbalanced results, on the other hand, is not resolved until classification. Besides, because of training on fewer data, the FPR of this model is high. When 80% of the data was used in training, the Precision Recall (PR-AUC) reached 54.5%.

To detect electricity theft, the author of [32] addresses gradient loss by improving the internal structure of LSTM. The model of GMM and LSTM is used in this methodology. The results from this model were fantastic. 90.1% accuracy and 91.9% memory, in other words. However, the execution time for this model is extended. For energy theft detection, the authors use the CNN model [33]. According to the classification by fully interconnected layers [34], the CNN contributes to the degradation of generalization. For final classification, the authors used the RF. Besides, the imbalanced data is handled using SMOTE. Using the decision trees with the CNN, the generalized performance is achieved. SMOTE, on the other hand, creates synthetic data, which leads to the issue of overfitting. For NTL detection, the authors in [35] employed a gradient Boosting theft detector. This approach refines precision by learning from a decision tree ensemble, demonstrating the model's usefulness. The simulation indicates that a gradient boosting theft detector outperforms most machine learning methods.
Fig. 1 depicts the proposed model for our ETD. There are five phases to our model. Firstly, the data is loaded and preprocessed using methods such as missing value interpolation and normalization. Secondly, the imbalanced data is forwarded as input to the Near-miss technique for undersampling. Thirdly, the imbalanced data is then forwarded to ZFNet for feature extraction. Fourthly, the data is passed to the proposed classifier AdaBoost, which CHIO and FBIO optimize. After classification, we have performed performance evaluation using performance metrics and performance error metrics, i.e., MAPE, Mean Square Error (MSE), RMSE, F1-score, precision, accuracy, Recall. Furthermore, statistical analysis is also performed on the proposed method. Our proposed algorithm is compared with the benchmark techniques.
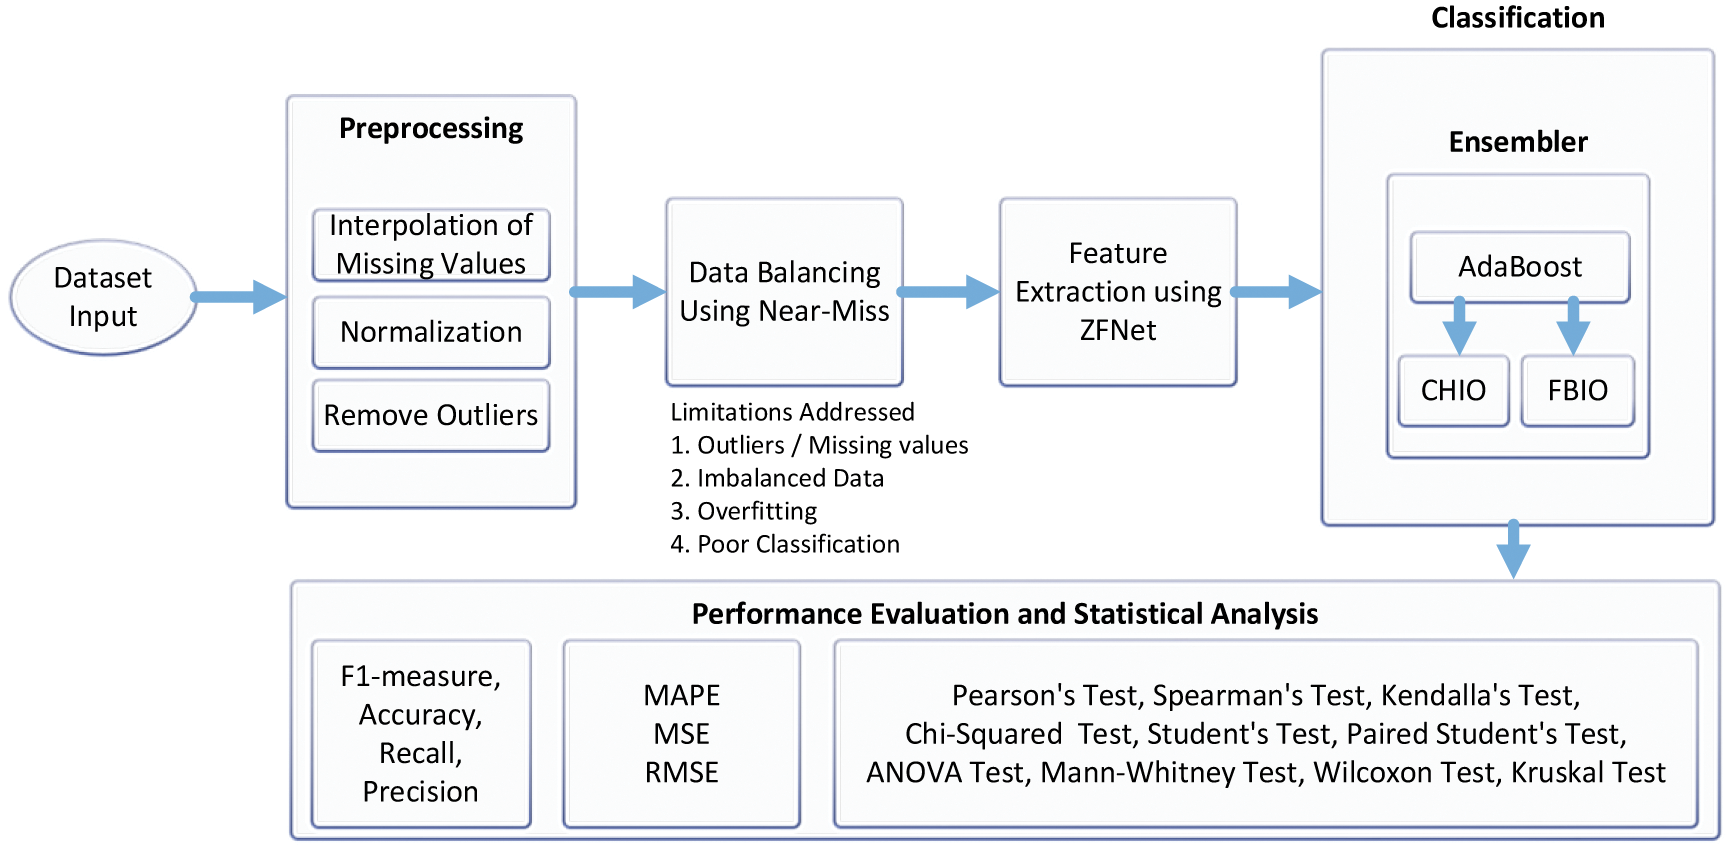
Figure 1: Proposed electricity theft detection model
The proposed system is being evaluated using State Grid Corporation of China (SGCC) [36] smart meter data. The data used in this paper is time-series data, which claims that data is collected at regular time intervals. 1032 is the input dimensions or attributes. Three years is the duration of the data obtained. It consists of data from 42,372 customers on electricity consumption. The data released also provides the ground reality that 9% of the overall customers are energy thieves, which is shown in Tab. 2.

In the data on energy usage, trustworthy users have different levels of consumption than electricity thieves. Electricity thieves have erratic energy usage patterns and because of meter tampering, their energy consumption is often low. Besides, honest customers have a daily frequency in their pattern of consumption. Machine learning algorithms use data from smart meters to detect consumers’ unusual consumption patterns to identify them as energy thieves.
The data is preprocessed using the interpolation approach, which improves the accuracy of the results. Eq. (1), which gives the interpolation technique [19], given that:
where
To remove outliers, the three-sigma technique is applied to the input data. These outliers are aware that energy use spikes on non-working days. Using Eq. (2) [23], we recreate these values using the Three Sigma rule of thumb:
The average value of n is avg(n), while the standard deviation is std(n). This method works well for dealing with outliers. To standardize the data between the 1 and 0 scales, we employed the Min-Max scaling technique, interpolation and the three-sigma rule. It is required because neural networks function poorly when the findings are inconsistent [24]. Data normalization improves the training phase of deep learning models by providing the data on a standard scale. Eq. (3) is used to normalize the data as follows:
where the normalized value is represented by M’. The consistency of the input data determines machine learning's algorithms efficiency. The quality and dependability of the data utilized in these models are improved by pre-processing them.
3.3 Balancing of Input Dataset
In the SGCC dataset, the number of typical energy consumers outnumbers the number of thieves. This data mismatch is a serious problem in ETD that must be addressed; otherwise, the classifier would be biased towards the majority class, resulting in poor performance [25].
Motivated by SMOTEBoost [26] and SMOTE [27], helping to navigate the imbalanced collection of results. To minimize the difference in quantity between the two types of data, sampling-based methods under-sample or over-sample the imbalanced dataset. To reduce the majority class occurrences, under-sampling automatically dismisses the majority class's entries. This strategy reduces the amount of the dataset, which is beneficial from a statistical view; However, the random elimination might be omitted and the remaining data could be a good sample representation or not. The model created with the test data may produce a less accurate result. It seeks to balance class representation by removing instances of the majority class at random. When two different classes have examples that are substantially similar to one another, we delete all of the instances of the majority class to optimize the space available for comparing the two classes. This contributes to the classifying procedure.
Methods based on near-neighbors are commonly in most under-sampling techniques. This is used to eliminate the issue of information loss. A brief explanation of how some of the near-neighbor approaches work:
• Stage 1: The method begins by identifying the distinctions between majority and minority class instances. In this circumstance, the majority class must be under-represented.
• Stage 2: The majority of N class instances with the shortest distances from the minority class are then selected.
• Stage 3: The majority class will have k*n instances if the minority class has k instances, resulting in the closest process.
The Near-miss technique for selecting n closest examples in the majority class can be implemented in a variety of ways:
• NearMiss Variant 1: Selects majority class samples with the shortest average distances to the nearest k occurrences of the minority class.
• NearMiss Variant 2: Selects samples from the majority class that have the shortest average distances to the minority class's furthest k occurrences.
• NearMiss Version 3 is a two-step process. The nearest M-neighbors of each instance of the minority class will be saved first. Finally, the majority class instances with the biggest average distance between N and its nearest neighbors are chosen.
3.4 Feature Extraction Using ZFNet
The Graphic Geometry Group (GGP) [28] launched ZFNet, an updated 05-layer version of CNN. A 7/7 filer and a decreased stride value are utilized in the first layer. The softmax layer of ZFNet is the final one. It is used for feature isolation and propagation learning [29]. This post uses ZFNet for feature extraction to display the representation spaces formed by all layer filters in greater detail. All of a layer's activations are utilized to remove the related features using a deconvolution network. Convolutional and pooling layers are utilized. In the last dense layer, the softmax is used as an activation mechanism. The multi-pooling layers of the ZFNet modules are superior at significant advanced data characteristics. We'll examine the input image that optimizes the filter's activation and discover what features each filter catches. Sliding the kernel through the full inputs gives a functional chart in the convolutional technique. The kernel function merges the final output from the convolution layer after numerous feature mapping procedures, namely:
The input in Eq. (4) is m and filter T, also known as the kernel failure, is calculated by multiplying the number of times a certain filter is activated [30], but the input image is random at first. k is the convolutional layer, s is the input data size and d is the convolution result size. Rectified Linear Unit (ReLu) [21] is used as an activation function to introduce non-linearity to the model, as demonstrated in Eq. (5):
A thick layer is used to show the essential features after the dropout layer processes. To avoid over-fitting, the dropout is set at 0.01 and the learning rate is set to 0.001. This approach may be used to activate the final thick layer with softmax, which is specified in Eq. (6) [8] as follows:
If K and S are the functions and weight matrices, respectively, then is determined in Eq. (7) as:
The ZFNet's hyper-parameters are including learning rate, batch size, quantity of epochs, optimizer, and drop-out rates. These criteria are fundamental for finding the ZFNet module's optimum results.
3.5 Classification Using AdaBoost Optimized by CHIO and FBIO
For classification, we have used the AdaBoost algorithm, which is optimized by CHIO and FBIO. The details of the algorithm are further explained in subsections.
The AdaBoost algorithm, or Adaptive Boosting, is a boosting approach used as an Ensemble Method in Machine Learning [13]. Weights are reassigned to each occurrence, with improperly classified instances receiving larger weights, AdaBoost is the term for this. Boosting is used to minimize bias and variance in supervised learning. It is centered on the sequential success of learners.
3.5.2 Working of AdaBoost Algorithm
AdaBoost creates n number of decision trees during the data training cycle. When the first decision tree/model is built, the record that was incorrectly labeled in the previous model takes precedence. Only these records are sent as reviews to the second model. The procedure will be repeated until the number of base learners has been determined. Always keep in mind that all boosting methods cause you to reproduce records [15]. AdaBoost is a specific training approach for boosted classifiers. A boosted classifier is a type of classifier that works in the form of Eq. (8) [16]:
In Eq. (8), each fr function takes an object c as input and returns a value indicating the object's c class. In a two-class problem, for example, the sign of bad learner performance defines the predicted object type, but the absolute value represents confidence in that classification. Similarly, if the sample belongs to a positive class, the R-th classifier is positive; otherwise, it is negative.
Each weak learner provides a performance hypothesis, h(ci), for each sample in the training set. Selecting a weak learner and giving it a coefficient alpha at each iteration, r reduces the cumulative training error Wr of the resulting r-stage boost classifier. Each iteration of the training algorithm gives each sample in the training set a weight wi, t equal to the current error W(Fr–1(xi)). The slow learner's training can be guided by these weights; for example, decision trees that support sorting sets of samples with high weights can be built. A class probability estimation s(c) = S(h = 1|c) is the output of decision trees, the certainty that c refers to the positive class. An empirical minimizer derived by Hastie, e–h(Fr–1(c) + fr(p(c))) for a fixed f(c), where:
Whereas, c described the weighted error rate. Rather than increasing the output of the entire tree by a fixed value, each leaf node now produces half of its previous value's logit transform as shown in Eq. (9) [17].
3.5.3 Forensic Based Optimization
Nguyen and Chou introduced the FBIO approach, which is inspired by police officers’ forensic analysis methods. The FBIO is initiated by police officers, who use criminal investigations, arrests and convictions as a tool. The investigative process and the pursuit phase are the two primary stages of the FBIO. The investigators’ unit is in charge of the investigative process, while the police officers’ team controls the pursuit phase i.e., Non Performing Assets (NPA). During the investigation process, the parameter XAi represents the i-th suspected location to be investigated (i = 1, 2, …, NPA); whereas XBi denotes the i-direction of the police officer, in which the officer continues to pursue the attacker (i = 1, 2,…, NPB). The terms NPA and NPB relate to the pursuit squad, which refers to the number of locations and police personnel inspected. In this algorithm, population size (NP) is treated the same as NPA and NPB. The forensic procedure is completed when the total iterations (gmax) are reached. As shown in Fig. 5, the FBIO algorithm consists of four steps: analysis of results (A1), course of the investigation (A2), behavior (B1) and extending the phase of actions (B2). The parameter XAl and knowledge about other possible locations were used to make this decision. A new suspected location (Xskl) is deduced in (A1). It is presumed that each person moves as a result of the actions of others. The flowchart of the FBIO method is shown in Fig. 2a.
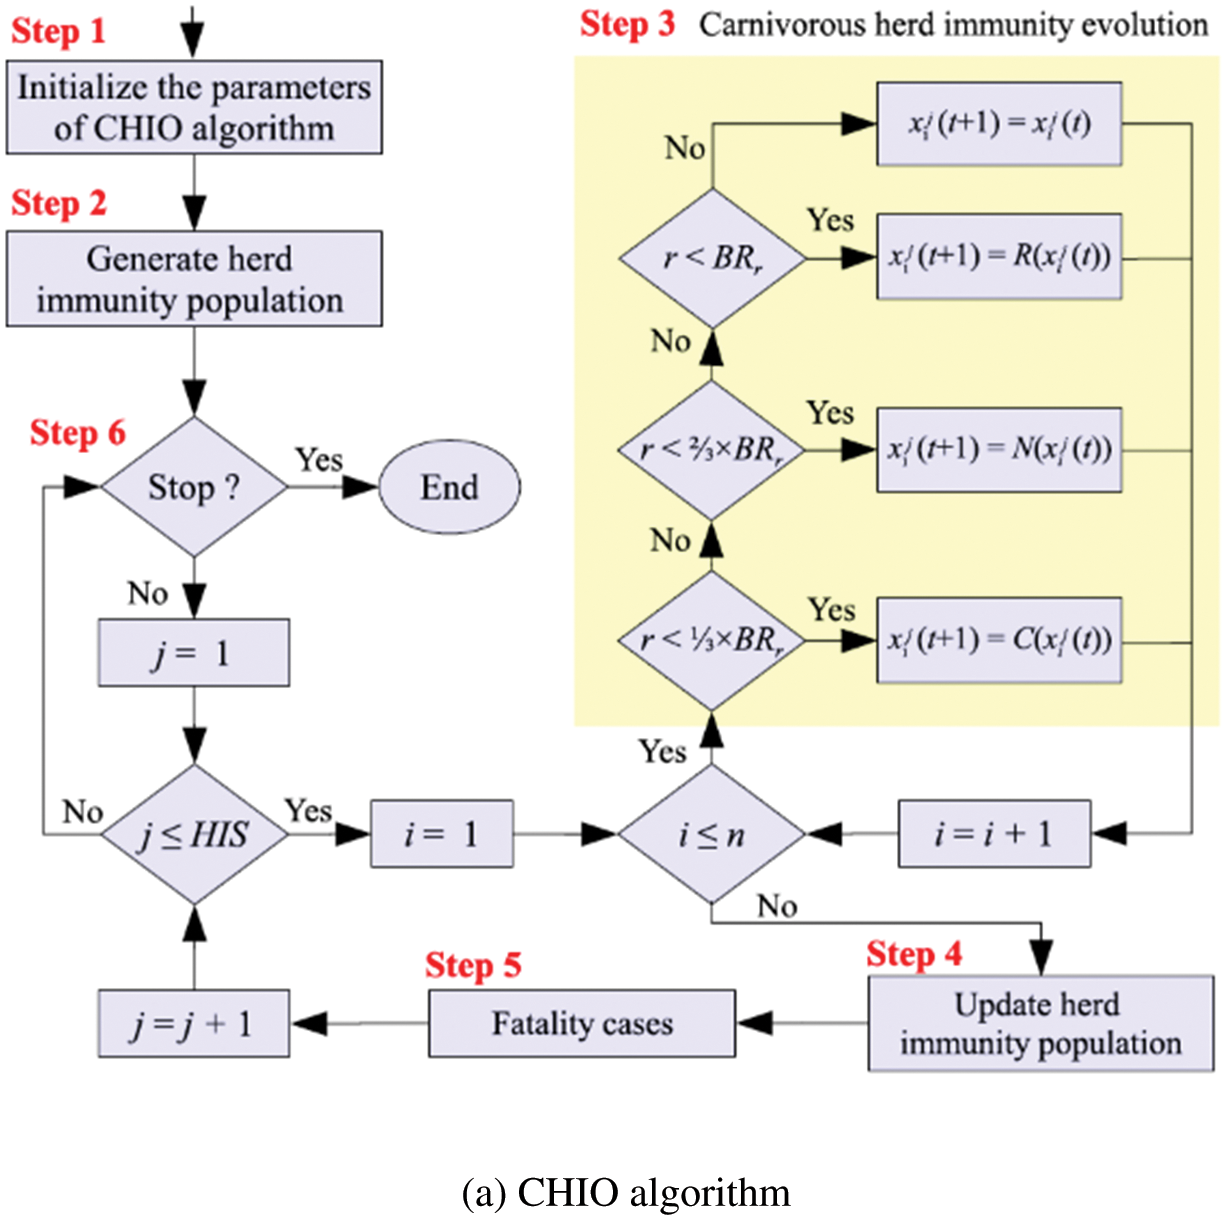
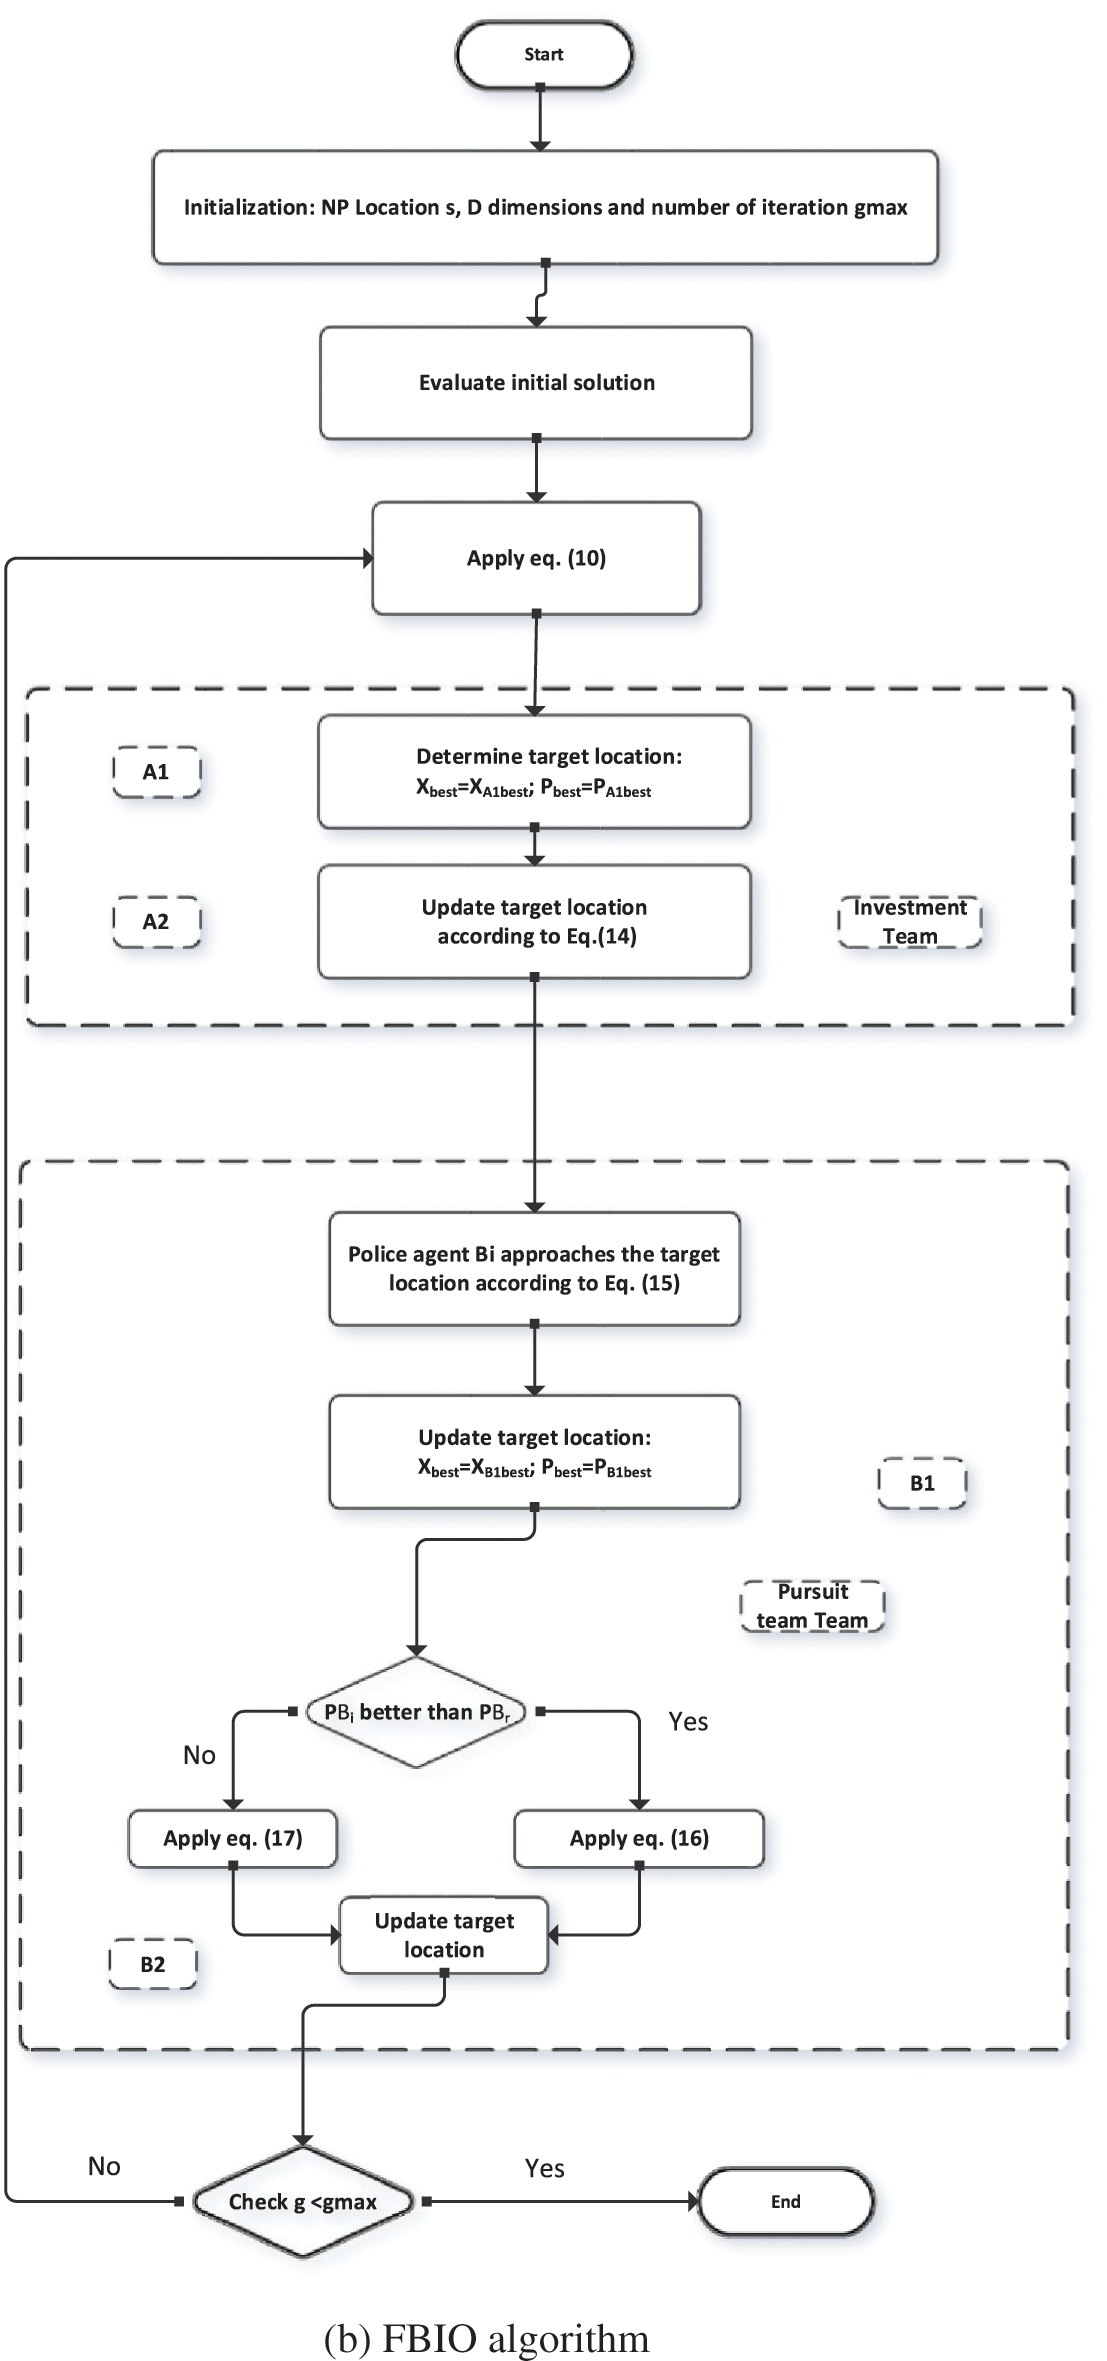
Figure 2: Flowchart of the optimization algorithm
3.5.4 Corona Virus Herd Immunity Optimization
In this article, we have used the CHIO algorithm [18] for the parameter tuning of AdaBoost. CHIO is used to reduce the time complexity and improve the precision of the AdaBoost performance measurement. CHIO was inspired by the idea of herd immunity as a means to tackle a coronavirus disease outbreak (COVID-19). The pace at which coronavirus infection spreads is determined by how infected individuals interact with other members of society. Health authorities recommend social distancing to shield all members of the community from the disorder. Herd immunity is a condition reached by a species when most of the population is immune, preventing disease spread. These ideas are modeled using optimization principles. CHIO is a mix of herd immunity and social distancing strategies. For herd immunity, three forms of human cases are used: susceptible, contaminated and immuned. This is to see if the newly created approach uses social distancing techniques to update the genes. The flow of the CHIO algorithm is shown in Fig. 2a.
3.6 Classification with Ensembler
The ETD classification is carried out using the AdaBoost tuned with the CHIO and FBIO. FBIO and CHIO compute the optimal values for the AdaBoost parameters, as illustrated in Fig. 3. The optimization algorithms determine the most suited value for the classifier's parameters, allowing the classifier to perform better.
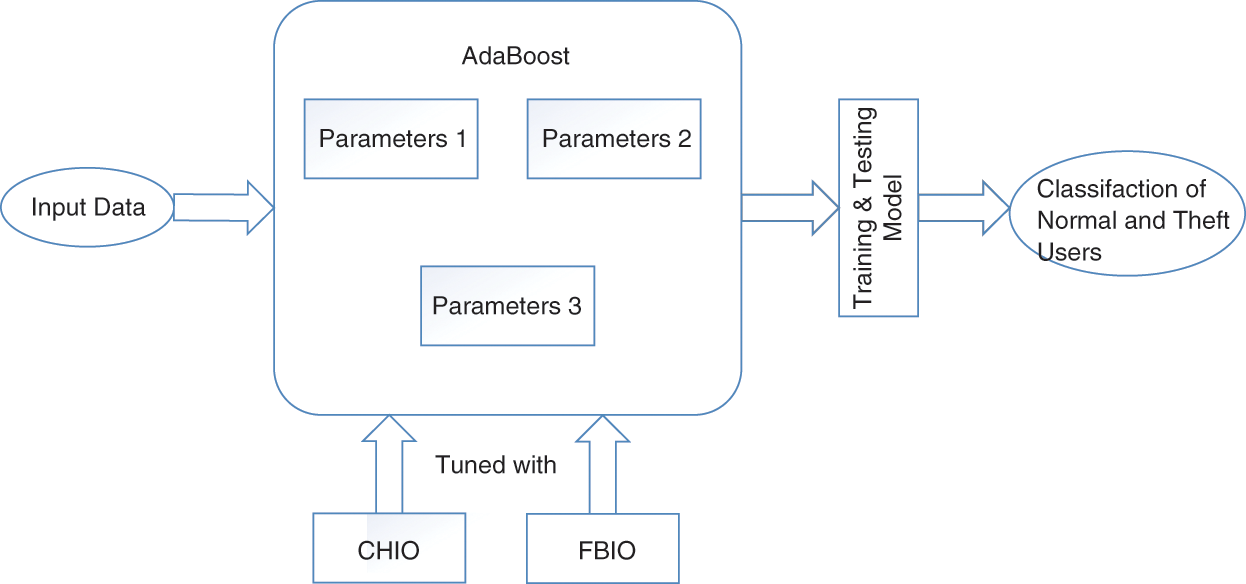
Figure 3: A visual view of the optimized AdaBoost model
4 Simulation Results and Discussions
The findings of our proposed model's implementation are described in this section, are explained in terms of their performance metrics. We have simulated our model on system specification core i7, 16GB RAM and 4.8GHZ processor. The IDE environment Anaconda (Spyder) and language python are used. Extensive simulations are carried out, which are explained below in Figs. 4–6.
In Figs. 4a and 4b, the curve of our proposed model is gradually increasing and attaining accuracy. The reason is the optimizers are giving the optimized values to the proposed methods. The accuracy of our proposed model is increasing with the increase in the iterations. As the accuracy of our suggested model is increases, on the other side the loss of our model is also decreasing with the iterations as shown in Figs. 5a and 5b, which shows the superiority of our methodology.
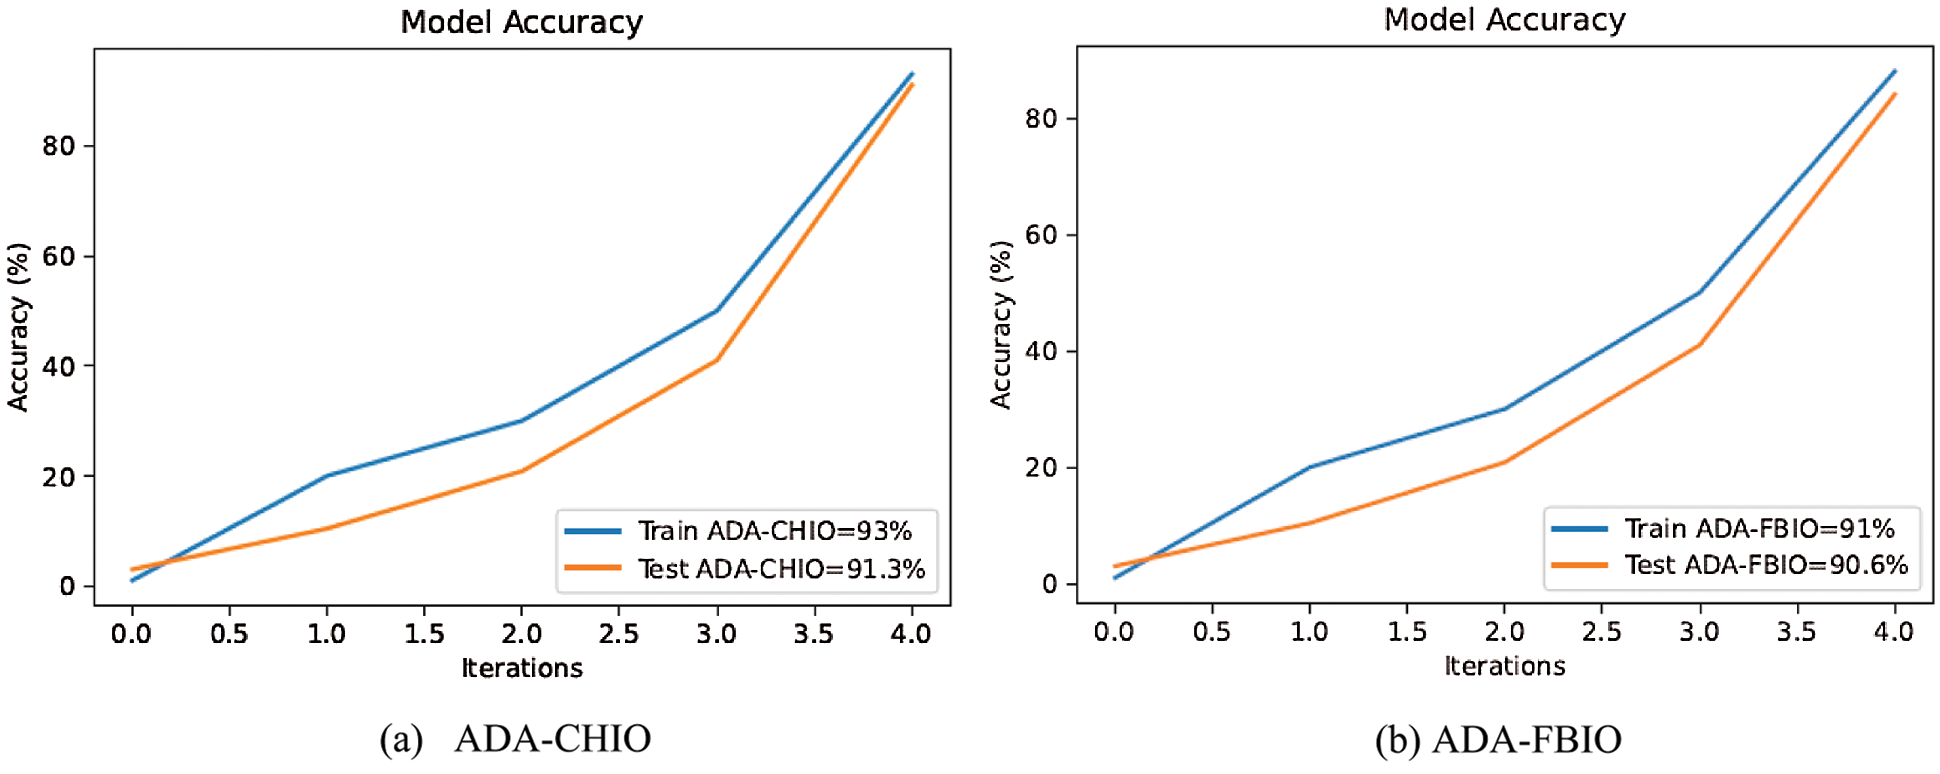
Figure 4: Accuracy vs. iteration of ADA-CHIO method
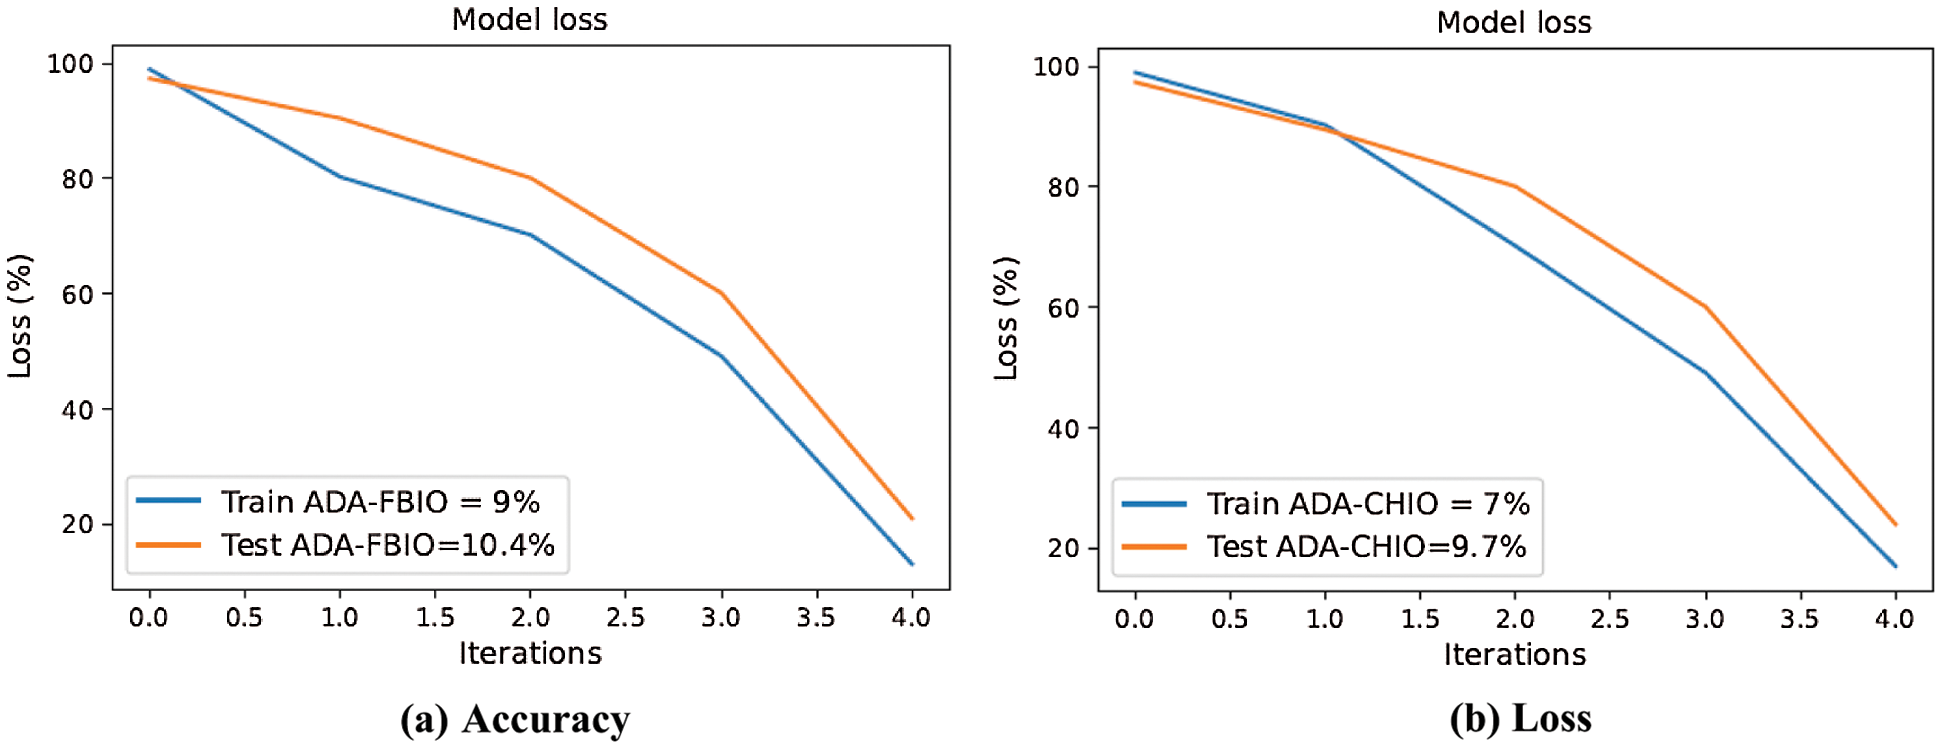
Figure 5: ADA-FBIO and ADA-CHIO method
The effectiveness of our proposed techniques has been assessed with evaluation metrics and error metrics. The evaluation metrics are accuracy, F-score, precision, and recall. Furthermore, the performance error metrics are RMSE, MSE and MAPE. Our proposed techniques outperform the state-of-the-art methods in terms of performance metrics, i.e., highest value and the lowest error rate of MSE, RMSE and MAPE. The formulas of performance evaluation metrics and performance error metrics are governed by Eqs. (10)–(16) [2].
where “Actual” variable describes the real data (on which classifier is trained), whereas the “Predicted” variable is the predicted data. True positive rate is TPT, false positive rate is FPT, false negative values are FNT and false positive value is FPT.
Figs. 6a and 6b describe the values of performance error and performance metrics. These figures show that our proposed techniques’ error values are low compared to the other techniques. In Fig. 6, it is clearly shown that the ADA-CHIO and ADA-FBIO have the highest accuracy of 93% and 90%. Furthermore, the ADA-CHIO and ADA-FBIO have the low MAPE value of error, i.e., 6.7% and 9.4%, respectively. These values show the sovereignty of our proposed techniques.
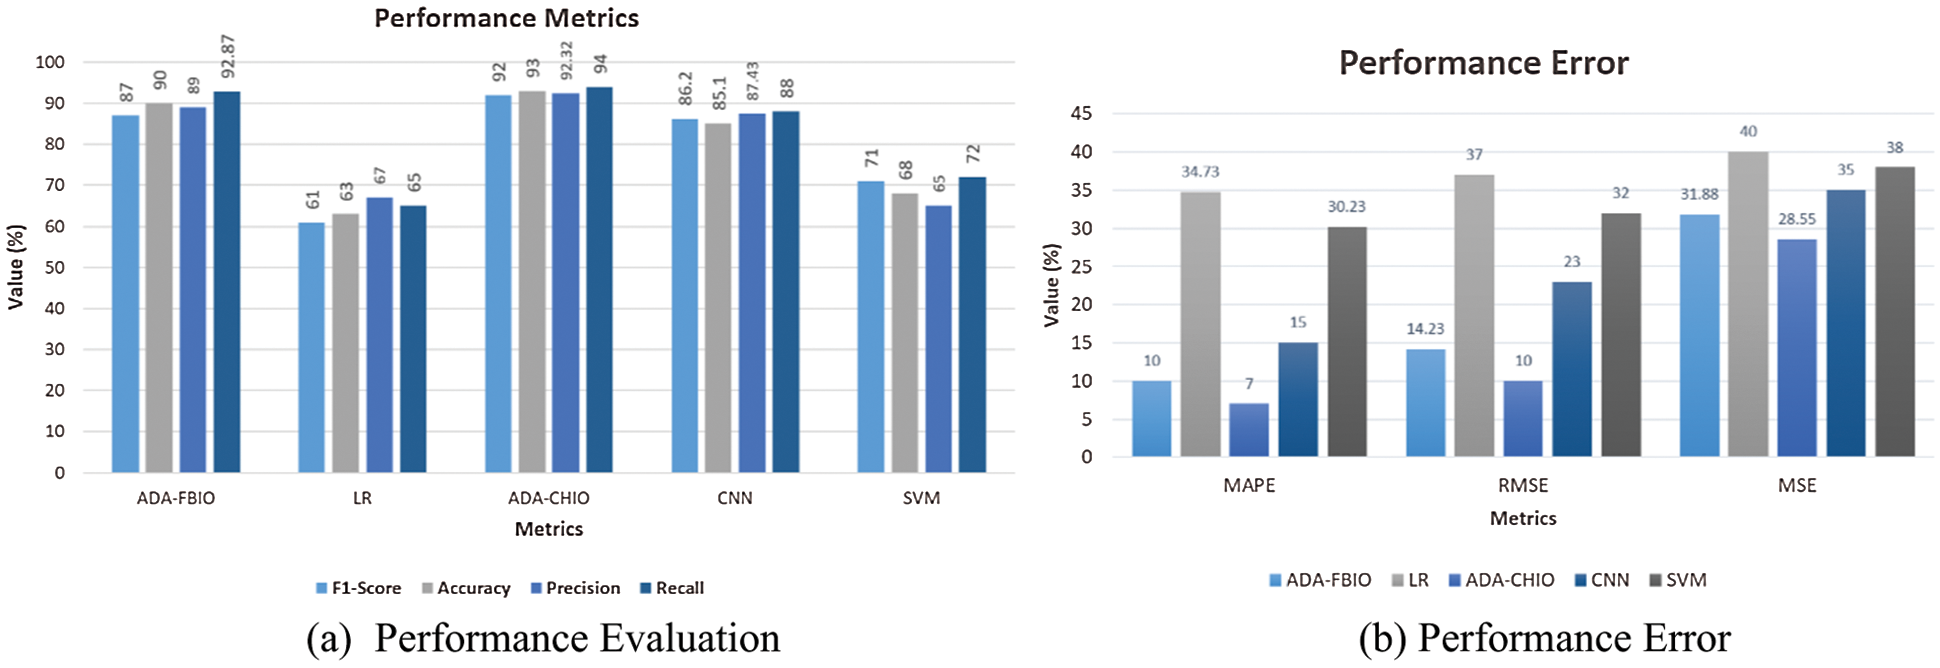
Figure 6: Proposed algorithm vs. benchmark algorithms
The lowest MAPE error and maximum accuracy are seen in the ADA-CHIO and ADA-FBIO. Fig. 6a depicts the methods’ accuracy bar. As indicated in Tab. 3, we also conducted a statistical study of the proposed approaches and benchmark techniques. In Tab. 3, the general range for a hypothesis is less than 0 and more than −1. It means when the statistical test value is greater than −1, the hypothesis is correct. If the value is less than 0 it is observed as a false hypothesis. We can see that our proposed model values are greater than −1, which means our hypothesis is correct.

In this article, we present two new algorithms namely: Ada-CHIO and Ada-FBIO to detect energy theft in AMI. It is based on the predictability of natural and malicious consumer consumption behavior. In addition to using the AdaBoost anomaly detector, the proposed algorithm relies on distribution transformer meters to detect NTL at the transformer stage and it uses a base learners scheme in the training model to distinguish the various distributions in the dataset. We have seen that these features give the algorithm a high level of performance and it helps for resistance to nonmalicious improvements in usage patterns and data intrusion attacks. In reality, it is observed that the performance requirements for ETDs can differ by region. However, it is concluded that by adding a delay to the detection algorithm, we can get an adjustment in performance to fit various goals. Simulation results show that the proposed algorithm has a high degree of accuracy/precision i.e., 93% and 90% and a low-performance error rate i.e., 7% and 10% on a real dataset.
The proposed model has maximum reliability, lower performance error and more sensitivity, but it does not guarantee that it will self-learn new patterns in power theft. We can't say how well our fine-tuned approach will manage numerous types of fraud and large data. This research might be expanded to find distinct patterns of power theft methods as a potential future research topic. To make the research more dependable and precise, researchers can collect additional data samples from real-time SG experts. To find different sorts of thieves patterns in the data, multiclass models may be used.
Funding Statement: The authors acknowledge the support from the Ministry of Education and the Deanship of Scientific Research, Najran University. Kingdom of Saudi Arabia, under Code Number NU/-/SERC/10/588.
Conflicts of Interest: The authors declare that they have no conflicts of interest to report regarding the present study.
1. H. Gul, N. Javaid, I. Ullah, A. M. Qamar, M. K. Afzal et al., “Detection of non-technical losses using SOSTLink and bidirectional gated recurrent unit to secure smart meter,” Applied Sciences, vol. 9, no. 10, pp. 3151–3172, 2020. [Google Scholar]
2. M. Adil, N. Javaid, U. Qasim, I. Ullah, M. Shafiq et al., “LSTM and bat-based RUSBoost approach for electricity theft detection,” Applied Sciences, vol. 10, no. 12, pp. 4378–4399, 2020. [Google Scholar]
3. M. A. Mirzaei, M. Z. Oskouei, B. Mohammadi-Ivatloo, A. Loni, K. Zare et al., “Integrated energy hub system based on power-to-gas and compressed air energy storage technologies in the presence of multiple shiftable loads,” IET Generation, Transmission & Distribution, vol. 14, no. 13, pp. 2510–2519, 2020. [Google Scholar]
4. M. Marzband, F. Azarinejadian, M. Savaghebi, E. Pouresmaeil, J. M. Guerrero et al., “Smart transactive energy framework in grid-connected multiple home microgrids under independent and coalition operations,” Renewable Energy, vol. 126, no. 3, pp. 95–106, 2018. [Google Scholar]
5. M. Jadidbonab, B. Mohammadi-Ivatloo, M. Marzband and P. Siano, “Short-term self-scheduling of virtual energy hub plant within thermal energy market,” IEEE Transactions on Industrial Electronics, vol. 68, no. 4 pp. 3124–3136, 2020. [Google Scholar]
6. H. R. Gholinejad, A. Loni, J. Adabi and M. Marzband, “A hierarchical energy management system for multiple home energy hubs in neighborhood grids,” Journal of Building Engineering, vol. 28, no. 1, pp. 101028, 2020. [Google Scholar]
7. M. A. Mirzaei, A. Sadeghi-Yazdankhah, B. Mohammadi-Ivatloo, M. Marzband, M. Shafie-khah et al., “Integration of emerging resources in IGDT-based robust scheduling of combined power and natural gas systems considering flexible ramping products,” Energy, vol. 189, no. 1, pp. 116195, 2019. [Google Scholar]
8. S. S. S. R. Depuru, L. Wang and V. Devabhaktuni, “Electricity theft: Overview, issues, prevention and a smart meter based approach to control theft,” Energy Policy, vol. 39, no. 2, pp. 1007–1015, 2011. [Google Scholar]
9. J. P. Navani, N. K. Sharma and S. Sapra, “Technical and non-technical losses in power system and its economic consequence in Indian economy,” International Journal of Electronics and Computer Science Engineering, vol. 1, no. 2, pp. 757–761, 2012. [Google Scholar]
10. S. McLaughlin, B. Holbert, A. Fawaz, R. Berthier and S. Zonouz, “A Multi-sensor energy theft detection framework for advanced metering infrastructures,” Journal on Selected Areas in Communications, vol. 31, no. 7, pp. 1319–1330, 2013. [Google Scholar]
11. T. Braun, B. C. M. Fung, F. Iqbal and B. Shah, “Security and privacy challenges in smart cities,” Sustainable Cities and Society, vol. 39, no. 1, pp. 499–507, 2018. [Google Scholar]
12. T. B. Smith, “Electricity theft: A comparative analysis,” Energy Policy, vol. 32, no. 1, pp. 2067–2076, 2004. [Google Scholar]
13. J. I. Guerrero, C. León, I. Monedero, F. Biscarri and J. Biscarri, “Improving knowledge-based systems with statistical techniques, text mining, and neural networks for non-technical loss detection,” Knowldge Based Systems, vol. 71, no. 1, pp. 376–388, 2014. [Google Scholar]
14. C. C. Ramos, A. N. Souza, G. Chiachia, A. X. Falcão and J. P. Papa, “A novel algorithm for feature selection using harmony search and its application for non-technical losses detection,” Computers & Electrical Engineering, vol. 37, no. 6, pp. 886–894, 2011. [Google Scholar]
15. P. Glauner, J. A. Meira, P. Valtchev, R. State and F. Bettinger, “The challenge of non-technical loss detection using artificial intelligence: A survey,” International Journal of Computational Intelligence Systems, vol. 10, no. 1, pp. 760–775, 2017. [Google Scholar]
16. S. C. Huang, Y. L. Lo and C. N. Lu, “Non-technical loss detection using state estimation and analysis of variance,” IEEE Transactions on Power Systems, vol. 28, no. 3, pp. 2959–2966, 2013. [Google Scholar]
17. O. Rahmati, H. R. Pourghasemi and A. M. Melesse, “Application of GIS-based data driven random forest and maximum entropy models for groundwater potential mapping: A case study at mehran region, Iran,” Catena, vol. 137, no. 1, pp. 360–372, 2016. [Google Scholar]
18. E. A. A. Neto and J. Coelho, “Probabilistic methodology for technical and non-technical losses estimation in distribution system,” Electric Power Systems Research, vol. 97, no. 1, pp. 93–99, 2013. [Google Scholar]
19. J. B. Leite and J. R. S. Mantovani, “Detecting and locating non-technical losses in modern distribution networks,” IEEE Transaction Smart Grid, vol. 9, no. 2, pp. 1023–1032, 2018. [Google Scholar]
20. S. Amin, G. A. Schwartz, A. A. Cardenas and S. S. Sastry, “Game-theoretic models of electricity theft detection in smart utility networks: Providing new capabilities with advanced metering infrastructure,” IEEE Control Systems Magazine, vol. 35, no. 1, pp. 66–81, 2015. [Google Scholar]
21. A. Afzal, N. K. Nair and S. Asharaf, “Deep kernel learning in extreme learning machines,” Pattern Analysis and Applications, vol. 24, no. 1, pp. 11–19, 2021. [Google Scholar]
22. J. Nagi, K. S. Yap, S. K. Tiong, S. K. Ahmed and M. Mohamad, “Nontechnical loss detection for metered customers in power utility using support vector machines,” IEEE Transactions on Power Delivery, vol. 25, no. 2, pp. 1162–1171, 2009. [Google Scholar]
23. E. W. S. Angelos, O. R. Saavedra, O. A. C. Cortés and A. N. de Souza, “Detection and identification of abnormalities in customer consumptions in power distribution systems,” IEEE Transactions on Power Delivery, vol. 26, no. 4, pp. 2436–2442, 2011. [Google Scholar]
24. K. A. Costa, L. A. Pereira, R. Y. Nakamura, C. R. Pereira, J. P. Papa et al., “A Nature-inspired approach to speed up optimum-path forest clustering and its application to intrusion detection in computer networks,” Information Sciences, vol. 294, no. 1, pp. 95–108, 2015. [Google Scholar]
25. M. M. Buzau, J. Tejedor-Aguilera, P. Cruz-Romero and A. Gómez-Expósito, “Hybrid deep neural networks for detection of non-technical losses in electricity smart meters,” IEEE Transactions on Power Systems, vol. 35, no. 2, pp. 1254–1263, 2019. [Google Scholar]
26. V. Chandola, A. Banerjee and V. Kumar, “Anomaly detection: A survey,” ACM Computing Surveys (CSUR), vol. 41, no. 3, pp. 1–58, 2009. [Google Scholar]
27. B. Sun, H. Chen, J. Wang and H. Xie, “Evolutionary under-sampling based bagging ensemble method for imbalanced data classification,” Frontiers of Computer Science, vol. 12, no. 2, pp. 331–350, 2018. [Google Scholar]
28. K. Bhargavi and B. S. B. Babu, “Application of convoluted neural network and its architectures for fungal plant disease detection,” In Artificial Intelligence and IoT-Based Technologies for Sustainable Farming and Smart Agriculture, vol. 19, no. 1, pp. 314–324, 2021. [Google Scholar]
29. A. K. Singh, B. Ganapathysubramanian, S. Sarkar and A. Singh, “Deep learning for plant stress phenotyping: Trends and future perspectives,” Trends in Plant Science, vol. 23, no. 10, pp. 883–898, 2018. [Google Scholar]
30. A. Khan, A. Sohail, U. Zahoora and A.S. Qureshi, “A survey of the recent architectures of deep convolutional neural networks,” Artificial Intelligence Review, vol. 53, no. 8, pp. 5455–5516, 2020. [Google Scholar]
31. A. Jamil, T. A. Alghamdi, Z. A. Khan, S. Javaid, A. Haseeb et al., “An innovative home energy management model with coordination among appliances using game theory,” Sustainability, vol. 11, no. 22, pp. 6287, 2019. [Google Scholar]
32. N. Ding, H. Ma, H. Gao, Y. Ma and G. Tan, “Real-time anomaly detection based on long short-term memory and Gaussian mixture model,” Computers & Electrical Engineering, vol. 79, no. 1, pp. 106458, 2019. [Google Scholar]
33. R. Punmiya and S. Choe, “Energy theft detection using gradient boosting theft detector with feature engineering-based preprocessing,” IEEE Transactions on Smart Grid, vol. 10, no. 2, pp. 2326–2329, 2019. [Google Scholar]
34. N. F. Avila, G. Figueroa and C. C. Chu, “NTL detection in electric distribution systems using the maximal overlap discrete wave-let-packet transform and random undersampling boosting,” IEEE Transactions on Power Systems, vol. 33, no. 6, pp. 7171–7180, 2018. [Google Scholar]
35. Y. Zhou, T. A. Mazzuchi and S. Sarkani, “M-adaBoost-a based ensemble system for network intrusion detection,” Expert Systems with Applications, vol. 162, no. 1, pp. 113864, 2020. [Google Scholar]
36. Electricity load and price dataset, “State Grid Corporation of China,” (Accessed 06 march 20212021, [Online]. Available: http://www.sgcc.com.cn/ywlm/index.shtml. [Google Scholar]
 | This work is licensed under a Creative Commons Attribution 4.0 International License, which permits unrestricted use, distribution, and reproduction in any medium, provided the original work is properly cited. |