DOI:10.32604/cmc.2022.024822

| Computers, Materials & Continua DOI:10.32604/cmc.2022.024822 |  |
| Article |
Dm-Health App: Diabetes Diagnosis Using Machine Learning with Smartphone
1Department of Software Engineering, Daffodil International University, Dhaka, 1207, Bangladesh
2Department of Computer Science, Najran University, Najran, 55461, Saudi Arabia
3Department of Computer Science and Engineering, Rajshahi University of Engineering and Technology, Rajshahi, 6204, Bangladesh
4Department of Computer Science and Engineering, Mawlana Bhashani Science and Technology University, Santosh, Tangail, 1902, Bangladesh
5Department of Computer Science and Engineering, BRAC University, Dhaka, 1212, Bangladesh
6Department of Computer Science and Engineering, World University Bangladesh, Dhaka, 1230, Bangladesh
*Corresponding Author: Sultan Almakdi. Email: saalmakdi@nu.edu.sa
Received: 01 November 2021; Accepted: 06 January 2022
Abstract: Diabetes Mellitus is one of the most severe diseases, and many studies have been conducted to anticipate diabetes. This research aimed to develop an intelligent mobile application based on machine learning to determine the diabetic, pre-diabetic, or non-diabetic without the assistance of any physician or medical tests. This study's methodology was classified into two the Diabetes Prediction Approach and the Proposed System Architecture Design. The Diabetes Prediction Approach uses a novel approach, Light Gradient Boosting Machine (LightGBM), to ensure a faster diagnosis. The Proposed System Architecture Design has been combined into seven modules; the Answering Question Module is a natural language processing Chabot that can answer all kinds of questions related to diabetes. The Doctor Consultation Module ensures free treatment related to diabetes. In this research, 90% accuracy was obtained by performing K-fold cross-validation on top of the K nearest neighbor's algorithm (KNN) & LightGBM. To evaluate the model's performance, Receiver Operating Characteristics (ROC) Curve and Area under the ROC Curve (AUC) were applied with a value of 0.948 and 0.936, respectively. This manuscript presents some exploratory data analysis, including a correlation matrix and survey report. Moreover, the proposed solution can be adjustable in the daily activities of a diabetic patient.
Keywords: Machine learning; diabetes-prediction; support vector machine (SVM); LightGBM; eHealth; ROC-AUC
Information has become the basis for more substantial business and innovations. The more data we have, the more we can organize ourselves optimally to produce the best results in diagnosing diseases in the healthcare sector. Various big data outlets in the healthcare sector include hospital reports, patient medical records, medical test outcomes, and applications of the Internet of Things (IoT). Large databases can be found in the healthcare industry; these databases might contain structured, semi-structured, or unstructured data [1]. Big data analytics is the method that analyzes enormous sets of data and exposes hidden data, hidden patterns to discover meaningful insight from the data. In recent years, Diabetic Mellitus (DM) has been a highly serious disorder. This is a Non-Communicable Disease (NCB), and numerous individuals are experiencing it. According to statistics in [2], from 2017, about 425 million individuals have diabetes. Diabetes causes between 2–5 million people to lose their lives each year. This is said to grow to 629 million by 2045 [2]. The shocking fact is almost one in ten adults in developing countries conveys diabetes.
Around 83 perent of people in developing countries are uninformed about their blood glucose levels, and they never search for diabetes most of the time. According to World Health Organization (WHO), deaths reached almost 5.09 percent of the developing countries, including Bangladesh, in diabetes, published data in 2017. Diabetes Mellitus (DM) refers to Type-1, Type-2, and Type-3 gestational diabetes. This type of diabetes is caused by the body's inability to create enough insulin, necessitating insulin injections. Non-Insulin-Dependent Diabetes Mellitus (NIDDM), or Type-2 Diabetes Mellitus, is a type of diabetes that is not dependent on insulin. This type of diabetes arises when body cells are unable to utilize insulin effectively. A spike characterizes type 3 gestational diabetes in blood sugar in pregnant women who do not have diabetes. This type of diabetes develops more quickly. Long-term problems are linked to diabetes mellitus. Diabetes are at a higher risk of developing a variety of health problems.
Recently, the computational approach [3] is being widely used in the healthcare sector. Predictive Analysis is a collection of machine learning algorithms, data mining techniques, and statistical methodologies for uncovering insights and forecasting future occurrences based on current and historical data. By applying predictive analytics to healthcare data, important decisions and predictions can be made. Predictive Analysis aims to accurately diagnose diseases, improve patient care, optimize resources, and improve clinical outcomes [2]. Machine learning is one of the most important aspects of artificial intelligence because it allows computers to learn from past experiences without being programmed [4,5]. Machine learning's realistic implementations drive business outcomes that can significantly impact the bottom line of a corporation. New techniques are increasingly emerging in the field and have extended Machine learning to almost limitless possibilities [6,7]. As of now, to detect diabetes, fasting blood glucose and the laboratory tests oral glucose tolerance. However, this procedure takes a long time.
According to [8], the android application has become increasingly popular in recent years. 62.3% of people across the world use mobile data and Wi-Fi. Besides, it is noted that when the design methods used in computers and humans are incorporated during the life cycle into the software development process, the projects developed are more successful, better quality, and more user-friendly.
In the last few years, there have been many systems that have been proposed to monitor diabetic patients. So, monitoring systems offer several advantages for diabetic patients, such as the quality of life of diabetic patients has improved, and the number of hospitalized diabetic patients has reduced [9]. Thus, the main goal of this app is for health-related issues, especially diabetes diseases using modern computation such as machine learning and android application. We have provided multiple packages in this research, and there are three contributions found in this proposed research:
• Firstly, this research has shown a novel technique for predicting diabetes through which it is possible to get very fast and promising accuracy, especially for diabetes prediction. While the LightGBM algorithm employs two innovative approaches named Gradient-Based One-Side Sampling (GOSS) and Exclusive Feature Bundling (EFB), which allow the algorithm to run faster while retaining excellent accuracy, we have classified it as a Novel technique.
• Secondly, the machine learning model has been integrated into an android application and shown the pipeline of model deployment separately, which will serve as a benchmark in the research community. This research shows a functional overview of how to connect the Machine Learning Model with Android Application details.
• Finally, before developing the mobile application for diabetes prediction, a survey was conducted online. Various suggestions have been taken from the users, especially for people with diabetes.
The paper is divided into five sections that are all interconnected. The results of the literature search and reviews and related debates are presented in section two. Section three shows the overall research methodology and proposed system analysis. Section four presents the result of the discussions. Finally, section five depicts the manuscript's conclusion.
2 Literature Reviews, Search and Discussion
This section is divided into three interconnected components: Literature Search Strategy, Literature Selection Criteria, and Literature Review. In this research, papers have been collected to review literature from all the databases, and the overall search strategy technique has been shown in the Literature Search Strategy section. The literature Selection Criteria section shows how to select related papers based on the selection criteria after collecting the article from the database. Finally, in the Literature Review part, the Literature Review is written in-depth based on the selected articles.
2.1 Literature Search Strategy
We have explored several electronic databases from 2010 to November 2020. IEEE Xplore, PubMed, National Center for Biotechnology Information (NCBI), Springer, Google Scholar, and Elsevier have been applied to recognize similar published research papers.
Following the steps in ‘An organized method to documenting a search strategy for publishing’, an instigated literature search approach was established [10]. Moreover, after the preliminary identification, each paper is scanned by following the Exclusion and Exclusion criteria. The suggested research's complete search and selection process is shown in Fig. 1.
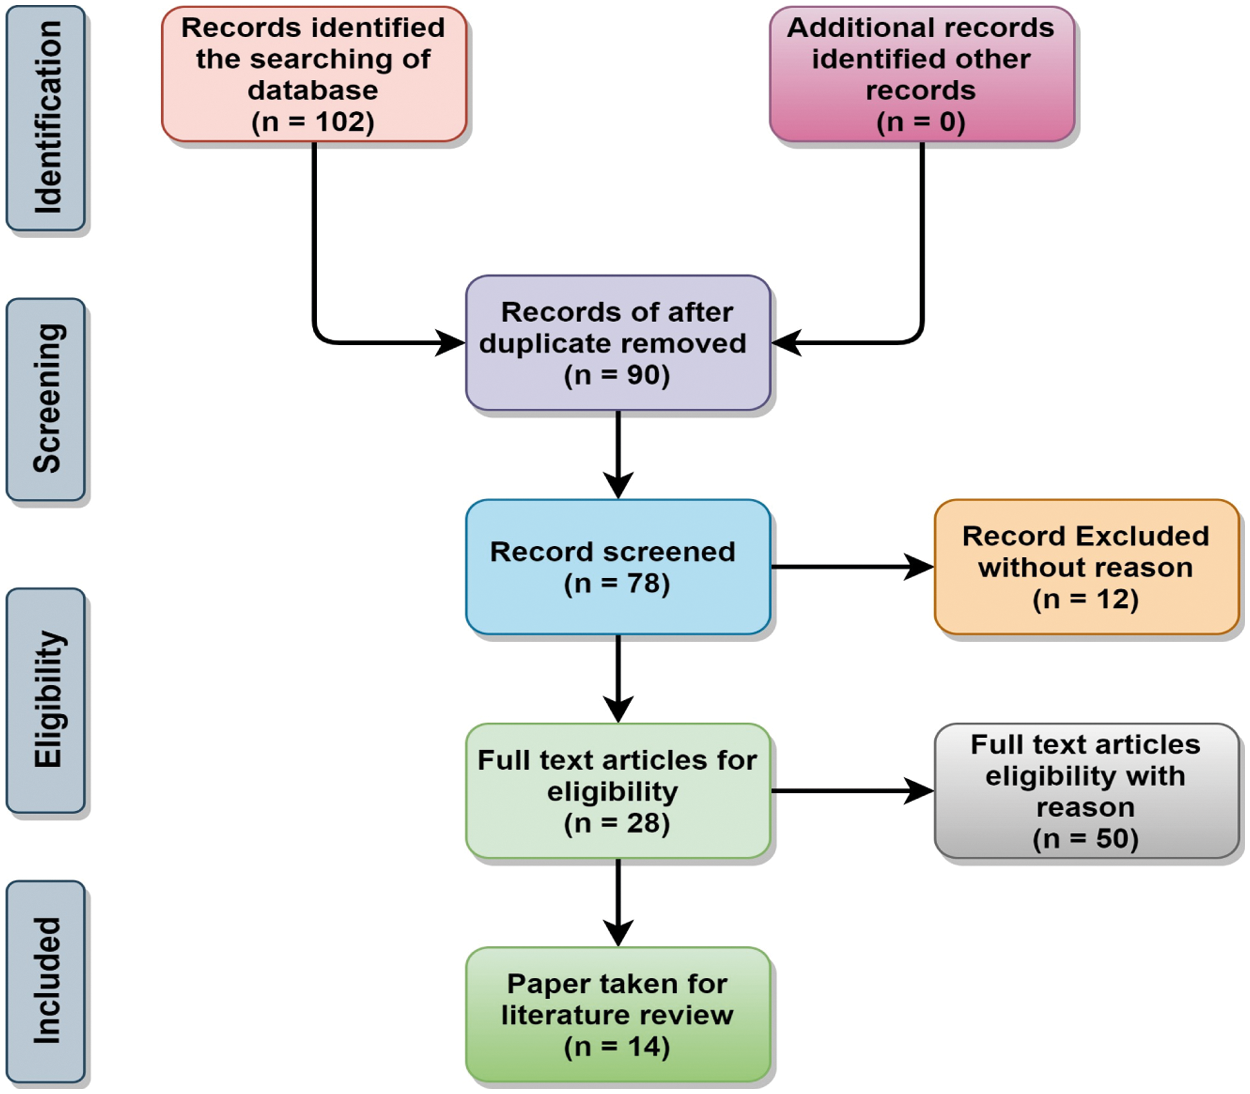
Figure 1: Block diagram of literature search & selection strategy of the proposed research
2.2 Literature Selection Criteria
Based on the following principal criteria, we have initialized our selection criteria for receiving a research article and have retrieved only those papers that meet the following requirements. Some criteria have been set for literature selection because everyone downloads papers randomly while reviewing literature and working there. In this way, the literature review section can be made much more substantial, making the quality of the paper much effective.
Inclusion Criteria
1. The research paper must be required to be a conference paper or journal article.
2. Machine learning-based model or program intended solely for diabetes purposes must be included in the research paper.
3. Each research study's goal must concentrate on diagnosing or screening patients with diabetes through Machine learning methods or a solution based on mobile applications.
4. The time frame for each scientific manuscript is 2010 to 30 November 2020.
Exclusion Criteria
1. Any research work that carried out as a preprint, early works, or not peer-reviewed.
2. Any comparative studies.
3. Editorials, Review Papers or Research Letters.
4. In the domain of diabetes prediction, no method based on machine learning has been discussed.
The paper “Usability Pitfalls of Diabetes mHealth Apps for the Elderly” [11] shows that increasing the usability of an app in a number of categories changes a small percentage of the total number. The paper [12] entitled is “Mobile Applications for Diabetes Self-Management: Status and Potential” provides an overview of smartphone technology and health apps. For the prediction of diabetes, the article [13] offered ANN, Random Forest (RF), and K-means approaches. The ANN technique gave the best accuracy of 75.7 percent and can help medical professionals with care decisions.
[14] Shows a model for predicting diabetes using classification algorithms. The algorithms Naive Bayes, Support Vector Machine (SVM), and Decision Tree (DT) have been proposed to complete the research. Performance evaluations on various measures as well as comparative analysis based on the accuracy of different models have been illustrated and finally achieved 76.30% accuracy through the Naïve Bayes algorithm. Another study [15] has been Ensemble approaches used to conduct towards Diabetes Prediction. The Bagging approach accurately categorized 95.59 percent of diabetes forms, while Decorate accurately categorized 98.53 percent.
The authors of this study [16] concentrate on developing a predictive model for diabetes prediction by applying Machine Learning (ML) algorithms and techniques of data quarrying. They have demonstrated the pipeline of diabetic prediction through the use of Boosting approach with various traditional ML algorithms and have increased the accuracy of classification algorithms. The paper [17] focused on developing risk assessment of diabetes among some individuals about their daily life and family history. A machine learning mechanism is adopted to train and validate the proposed model. In the paper [18], the authors utilized the Logistic Regression model to assess the risk of diabetes upon p-value and odds ratio. Four classifiers had been taken to predict the risk of diabetes.
The paper [19] aimed to implement an intelligent mHealth application based on an ML mechanism to predict diabetes and classify it into three categories: diabetes, prediabetes, and non-diabetes. The paper [20] had reflected on the execution of a scheme to analyze diabetes infection utilizing different types of ML algorithms.
These reviewed articles had only focused on the established model to predict diabetes disease, but no mechanisms to build a mobile application for diabetes patients had been proposed. This proposed study's key idea and motivation are to design a system that ensures the computer system and general people interaction by deploying the machine learning model into the Android Application and quickly predicted diabetes. Additionally, a table has been interpreted in this section to demonstrate the literature review summary that is illustrated in Tab. 1.

3 Methodology of the Proposed System
This section's methodology is divided into the Diabetes Prediction Approach and System Architecture Design. The Diabetes Prediction Approach part shows how the algorithm accomplishes diabetes prediction, and the overall system architecture design is described in the System Architecture Design section. Fig. 2 provides the number of algorithms used in this manuscript and the corresponding model architecture. In this proposed study, a mobile application has been developed for diabetes users to identify the possibility of diabetes through this application. This mobile application has a Health Module component, where the machine learning mechanism is integrated and analyzed to predict the probability of diabetes based on some interconnected parameters.
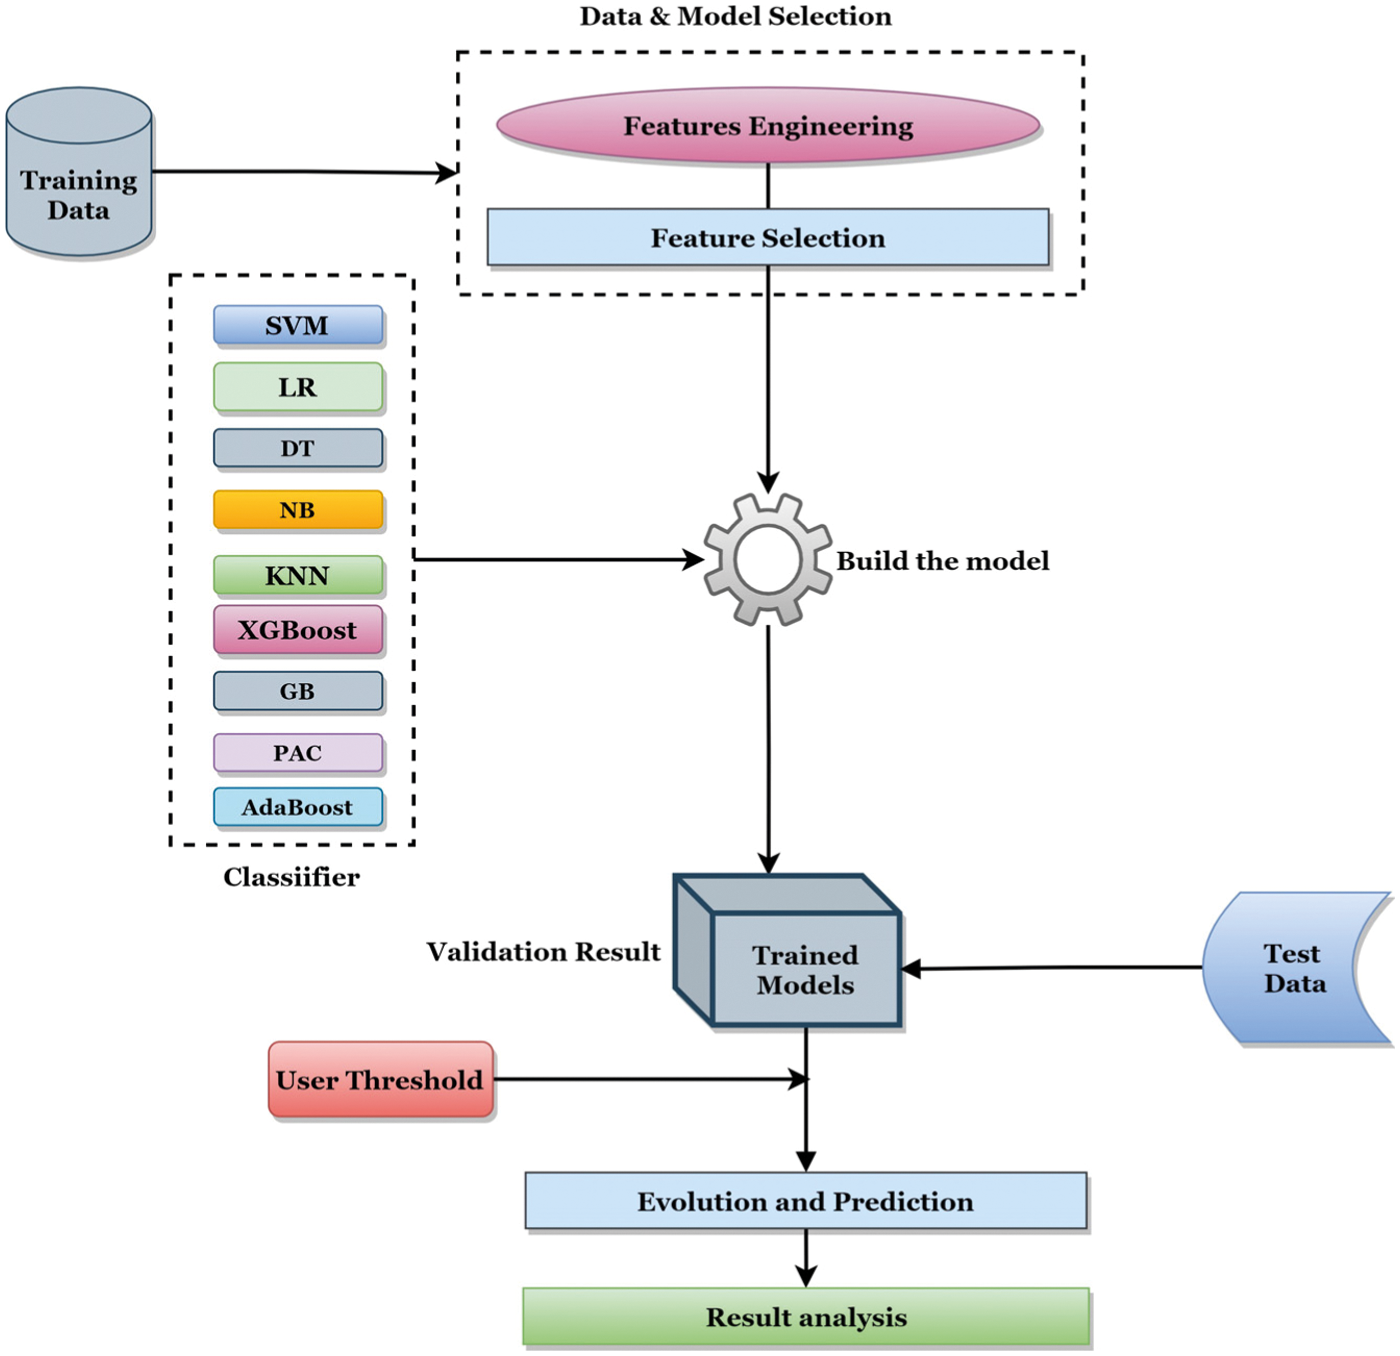
Figure 2: Algorithms and the corresponding model deployment
3.1 Diabetes Prediction Approach
The Diabetes Prediction Approach has been classified into four segments, to illustrate, Experimental Setup, Data Preprocessing, Algorithm Selection, and Model Deployment. The dataset has been used in this proposed research, which is explained in the Research Dataset Section. The data preprocessing pipeline is shown in detail in the Data Preprocessing section. All the machine learning algorithms used in this research are described in the Algorithm Selection. Finally, a model is deployed and communicates with a mobile application, explained in the model deployment part. There are many reasons to use various machine learning algorithms in this research, and there are specific algorithms that are frequently used for this particular work beforehand. Those who conduct research will quickly understand all these soft computing's performance in this type of work; then, there will be no problem during the model selection. Using this soft computing, we received an idea about algorithms’ computational cost while creating the model. Model selection is an essential issue during Disease Detection in the research community. It will be straightforward to select the model by looking at the interpretations of different types of algorithms.
The National Institute of Diabetes and Digestive and Kidney Diseases provided this data. The goal of the dataset is to use particular diagnostic metrics in the dataset to diagnose whether a patient has diabetes. Several other online portals from which a wide variety of datasets are commonly available such as Kaggle and UCL Machine Learning Repository are very popular. The goal of the National Institute of Diabetes and Digestive and Kidney Diseases (NIDDK)'s is to enhance people's wellbeing and excellence of life by undertaking and promoting medical studies and research training, as well as disseminating science-based knowledge on diabetes and other endocrine and metabolic diseases; digestive diseases, dietary disorders, obesity, kidney, urologic, and hematologic diseases. Since the information from NIDDK is very authentic, we have taken the dataset from this particular place because since this research has been carried out on essential issues like diabetes, accurate and authentic information is essential. The more authentic the information, the better the research quality and all the researchers worldwide will be able to believe our research's messages.
The selection of these examples from a larger database was subjected to a number of restrictions. All of the patients at this clinic are Pima Indian women who are at least 21 years old. Pima Indians in Arizona had the highest prevalence of type 2 diabetes (NIDDM) in the world in 1993. Scientists from the National Institutes of Health (NIH) studied this phenomenon for over 30 years. The majority of findings of the NIH suggest that both acquired (environmental) and genetic factors play a critical role in the development of type 2 diabetes (NIDDM) in this population. Disease complications in this group are disruptive or fatal, and further research into the causes and prevention of disease will be beneficial. There are various medical predictor factors in the dataset, as well as a target variable, Outcome. The predictor variables combine the patient's number of pregnancies, BMI, insulin levels, age, etc. We have collected the dataset from the Kaggle [21]. Tab. 2 shows the attribute of the proposed research dataset.

Data Preprocessing is divided into three sections, to illustrate, Data Cleaning, Data Transformation, and Data Reduction. Data preprocessing is essential in any data mining process because it directly affects the project's success rate. If there are attributes, attribute values, noise or outliers, and redundant or missing data, it is called data impurity. The presence of any of these will degrade the quality of the results. There can be several irrelevant and missing components of the results. Data cleaning is done to handle this portion. It includes taking missing data, noisy information, etc. The Data Transformation phase is kept in place to transform the data into formats that are acceptable for mining. This process combines Normalization, Attribute Selection, Discretization, and Concept Hierarchy Generation. When dealing with a large volume of data, analysis becomes more complicated when the data dimension is high. To get rid of this, the method of data reduction is used. It aims to increase the efficiency of storage and decrease the cost of data storage and analysis. Fig. 3 shows the missing value in our dataset when retrieved online and the disappeared value stage after the clean dataset was created at the end of preprocessing. So, data processing criteria have been accomplished through the discussed approaches.

Figure 3: (a) The combination of missing values before data preprocessing (b) The combination of clean data after preprocessing
Several classification algorithms of machine learning have been applied in the Diabetes Prediction Approach part. This section has highlighted the SVM, KNN, and Light GBM algorithm because they work well for this dataset. Thus, we have illustrated the mathematical interpretation of these algorithms in the following subsections.
(a) Support-vector Machines (SVM): In machine learning, SVMs are supervised learning models with related learning algorithms that examine classification and regression analysis data. A support vector machine generates a group of hyperplanes in an infinite or high-dimensional space to build the classifier. The hyperplanes also can be used for regression and other tasks, such as spotting outliers. Support vectors are the vectors or cases that contract the hyperplanes. Fig. 4 shows the linear SVM and its mathematical explanations. From this figure, we can illustrate that any hyperplane can be written as:
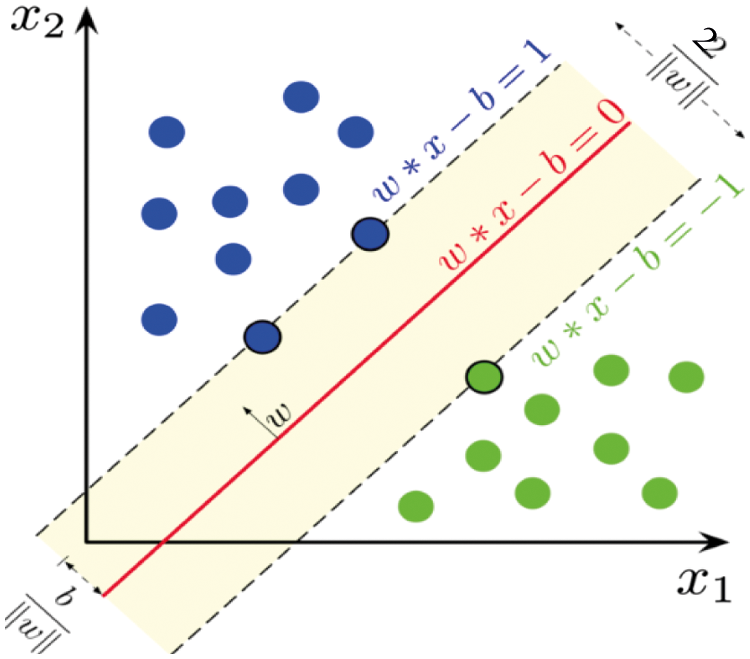
Figure 4: Hyperplanes with a maximum margin and SVM margins for samples of two classes trained
Here, w is the (not necessarily normalized) average vector to the hyperplane. The “margin” is the area or region bordered by these two hyperplanes, and the maximum margin hyperplane is the hyperplane that lies halfway between them. These hyperplanes can be defined by equations using a normalized or standardized dataset.
So, we can write the width or the margin of the two hyperplanes for data classification can be written as the following equations:
Radial Basis Function (RBF) Kernel Support Vector Machine (SVM):
The SVM has been shown to be effective on both linear and nonlinear data. The radial base function was introduced with this approach to categorizing nonlinear data. The kernel function is crucial for putting information into the function space [22]. For example, if we plot more than one variable in a typical scatter plot, in many cases, that plot cannot separate two or more data classes. The kernel of SVM is a unique sort of approach for converting lower-dimensional input into higher-dimensional space and distinguishing between classes. Linear kernels, polynomial kernels, and radial basis function kernels are some of the types of SVM kernels accessible. The radial basis function is also a kind of non-linear function. This function is the most popular function of the support vector machine. This kernel can map any input to infinite-dimensional space.
The Radial basis function (RBF) kernel is another name for a Gaussian function. In Fig. 4, the input space divided by feature map (Φ). By applying Eq. (1), we get:
By applying Eq. (3) in (4), we get a new function, where N represents the trained data.
(b) Light Gradient Boosting Machine (LightGBM) Algorithm
We employ the concept of [23] verdict trees to transfer a function, for example, from the input space X to the gradient space G. It is believed that a training set with instances like x1, x2, and up to xn is used, with each element being a vector of s dimensions in the space X. All negative gradients of a loss function about the output model are denoted as g1, g2, and up to gn in each repetition of a gradient boosting. The decision tree separates each node at the most revealing feature, giving rise to the greatest evidence gain.
Explanation, Let O represent a training dataset on a fixed node of a decision tree, and the variance gain of splitting measure j at a point d for a node is defined as:
Gradient One-Sided Sample, or GOSS, uses every case with a more significant gradient and performs random sampling on the many instances with small gradients. For each node of the Decision tree, the training dataset is represented by the notation O. The variance gain of j, or the dividing measure at node position d, is given by:
Where,
(c) K-nearest Neighbors Algorithm (KNN): The K Nearest Neighbor (KNN) said that the K-nearest neighbor of the unseen data point would find the K-nearest neighbor for a given K algorithm value and then allocate the class to the unspecified data point by making the class with the maximum number of individual points out of all K neighbor classes [24].
Finally, with the uppermost possibility, the input x is allocated to the class.
(d) Hyperparameters Tuning: Random search (RS) is a strategy for finding the optimal solution for a created model by using random combinations of hyperparameters. GridSearchCV, which calculates all potential combinations, is generally faster and more accurate than RS. We indicate the number of combinations we want with Random Grid. The following parameters have been tuned for the case of LightGBM:
Learning rate: The learning rate specifies how much each tree affects the final result. GBM works by starting with an initial estimate and updating it with each tree's output. The learning parameter controls the magnitude of this change in estimates.
N estimators: N estimators are the number of trees that have been estimated (or rounds), num leaves: the total number of leaves in the tree; the default is 31. Minimum child samples: the smallest number of data samples in a single leaf. Minimum child weight: smallest sum hessian in one leaf that has been used to deal with over-fitting. Subsample: choose a portion of data at random without resampling, maximum depth: It specifies the tree's maximum depth. This parameter is used to deal with overfitting in models. Colsample_bytree: if colsample bytree is less than 1.0, LightGBM will randomly select parts of features on each iteration. LightGBM, for example, will select 80 percent of features before training each tree if we set it to 0.8. Regularization (reg alpha) and regularization (reg lambda) were tuned properly.
Early stopping rounds: This parameter made our analysis go faster. If one metric of one validation data does not improve in the last early stopping round rounds, the model will cease training. Excessive iterations will be reduced as a result of this. On the other hand, for the case of knn, the best parameters obtained: {‘knn__n_neighbors’: 18}.
Machine Learning is a branch of AI that allows machines to learn, discover, and predict outcomes without the need for human interaction [25]. In numerous fields, machine learning has been applied and currently actively serves to make mobile apps. Tensorflow lite, which is continually changing, has produced new and exciting features for their mobile apps, simple for mobile developers. Robust machine learning mobile applications can exploit great business models and perform complex tasks such as face recognition or automated image captioning, all in actual time and without Internet access [26]. This research has come across a REST API called Retrofit. Java API, i.e., Retrofit, will send and receive a response from Python API. In this research, Retrofit is adopted as a Java API because it is easy enough to use. The most significant benefit is that it allows API calls as quickly as the Java method calls for everyone. As a result, developers have more flexibility in defining URLs to hit and determining request/response type parameters as Java classes. Retrofit made networking in Android applications a lot simpler. It includes various capabilities that help us to reduce boilerplate code in our application and easily consume web services, such as adding custom headers and request types, file uploads, simulating replies. However, details on how to integrate with Android apps by deploying machine learning models are shown in the Model Deployment section and shown in Fig. 5, along with diagrams.
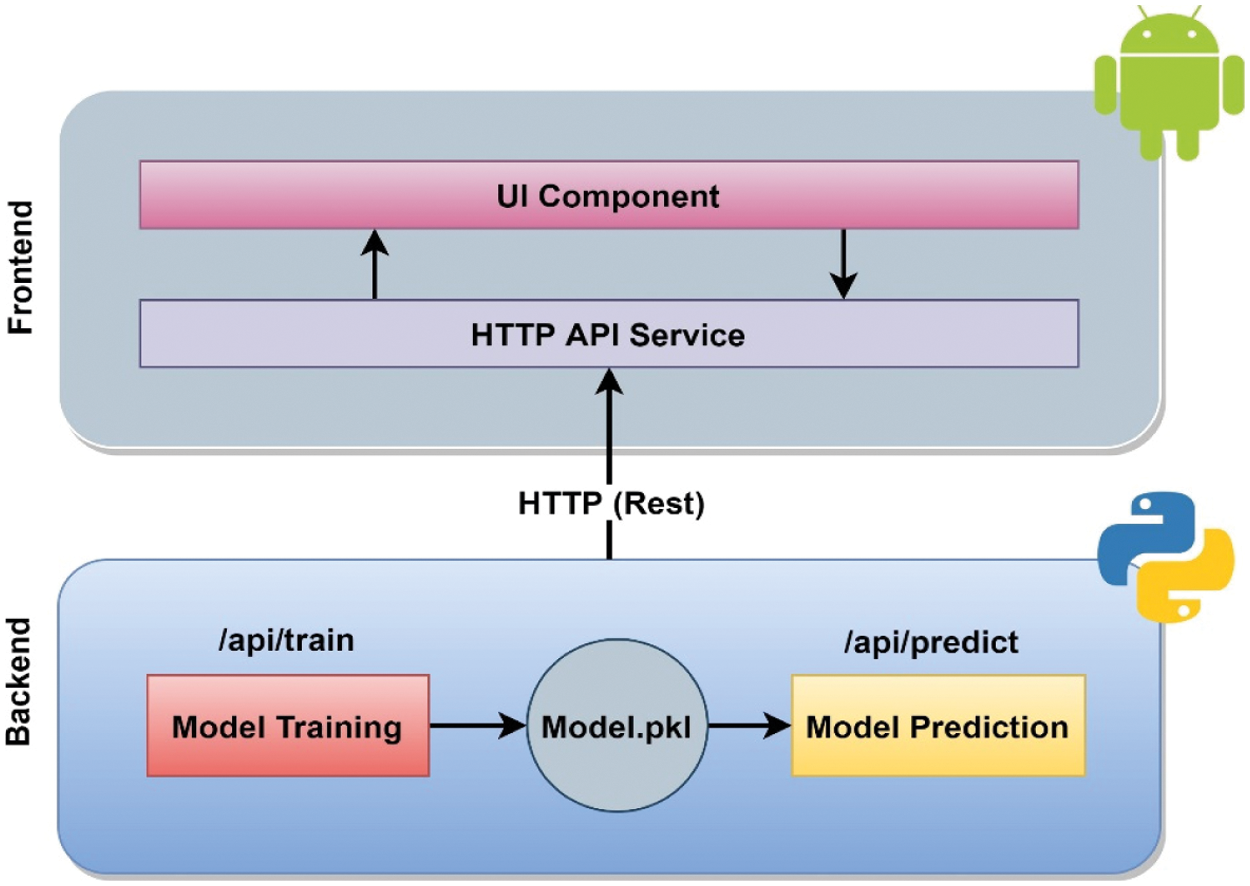
Figure 5: Architectural diagram for deploying machine learning model into mobile apps
Model Creation for Machine Learning includes a pipeline that begins with data collection, exploratory data analysis (EDA) and goes to the real world for model implementation. The model has been deployed in Heroku using the services of Flask Restplus. We used Heroku Server because it provides a free plan to learn and get started [27]. Heroku is a platform that assists developers in honing their skills to build feature-rich applications. Developers will benefit from the experience because they will have access to valuable resources for speeding up key development processes. Heroku's free version is suitable for smaller software projects. Developers may also select from a range of tier packages that are ideally tailored to large companies’ diverse needs. The user-friendly Heroku platform dashboard allows scaling, management, and application monitoring. Heroku has many more platforms as an alternative, but since it can be used primarily for free using various modules, we have selected this server for this research. The following approaches need to be taken after the Flask API's deployment to allow our Flask Application Programming Interface (API) to communicate with the Java Client. Flask is a Python web framework that includes features for creating web applications such as handling Hypertext Transfer Protocol (HTTP) requests and rendering templates. Flask has several alternatives, the most common of Django, Tornado, Express JS, Node.js, and React. As far as we are concerned, the flask's most significant benefit is its design, which is both lightweight and modular. It also has excellent community support and good documentation for developers to get started. Flask appears 100% compliant with Web Server Gateway Interface (WSGI) makes it easy to deploy for production. The details sequence and consequences are shown below:
• Create an object for Retrofit Class-This phase can be described as a ‘getApiClient’ generic method that returns a retrofit object. Besides, we have to mention BASE Uniform Resource Locator (URL) Endpoints in this process, pointing to our Flask URL.
• Create Interface with HTTP Operation-This interface will serve as a bridge to communicate with REST endpoints. A response from the Flask Endpoint to the Plain Old Java Object (POJO) class will be returned.
• Defining POJO Class to handle the response-This Class captures the return variables from Flask Endpoint. We have to define a key-value pair in a flask; those keys must be declared in the POJO class.
• Encapsulating the Steps in MainActivity.java-We have to construct an object for the interface at MainAcitivity.java; i.e., however, by applying this object, ApiInterface must call the procedure declared in the interface. Furthermore, it is essential to establish a callback interface. It has two strategies that are called on Response and On Failure. Moreover, if the Java API request is flourishing, the on Response method will be contacted. Otherwise, the on Failure process will be called. Finally, the Response method will allocate the POJO class to the Response object. We will be able to extract the response from POJO using the getter method.
Fig. 5 illustrates the Architectural diagram for deploying a machine learning model into the mobile application. The figure has been divided into two interconnected parts, for instance, Backend and Frontend. When a request comes from the Frontend, it reaches the Backend through HTTP API Service. After coming to the Backend, based on the input, it hits the model, and the model starts to predict and sends it to the User Interface(UI) component via HTTP (REST) and then the output is seen from the UI Component. Through this procedure, the machine learning model completes the prediction through integration with the mobile application shown in Fig. 5.
3.3 Proposed System Architecture Design
The Proposed System Architecture Design has been categorized into six modules, for instance, Food Recommendation Module, Health Module, Answering Question Module, Daily Movement Activities Module, Daily Awareness Module, and Medicine Reminder Module. This system has been developed by deciding all the possible problems and its solution regarding diabetes. This system would be a compact solution for diabetic patients. The Patient and Doctor will have the authorization to access this developed system. The modules of this system are connected through the Channel, which is the way of data communication. In the Data element portion, we have recorded the data coming through the proposed system. A detailed explanation of the proposed system's module and diagram are shown in Fig. 6.
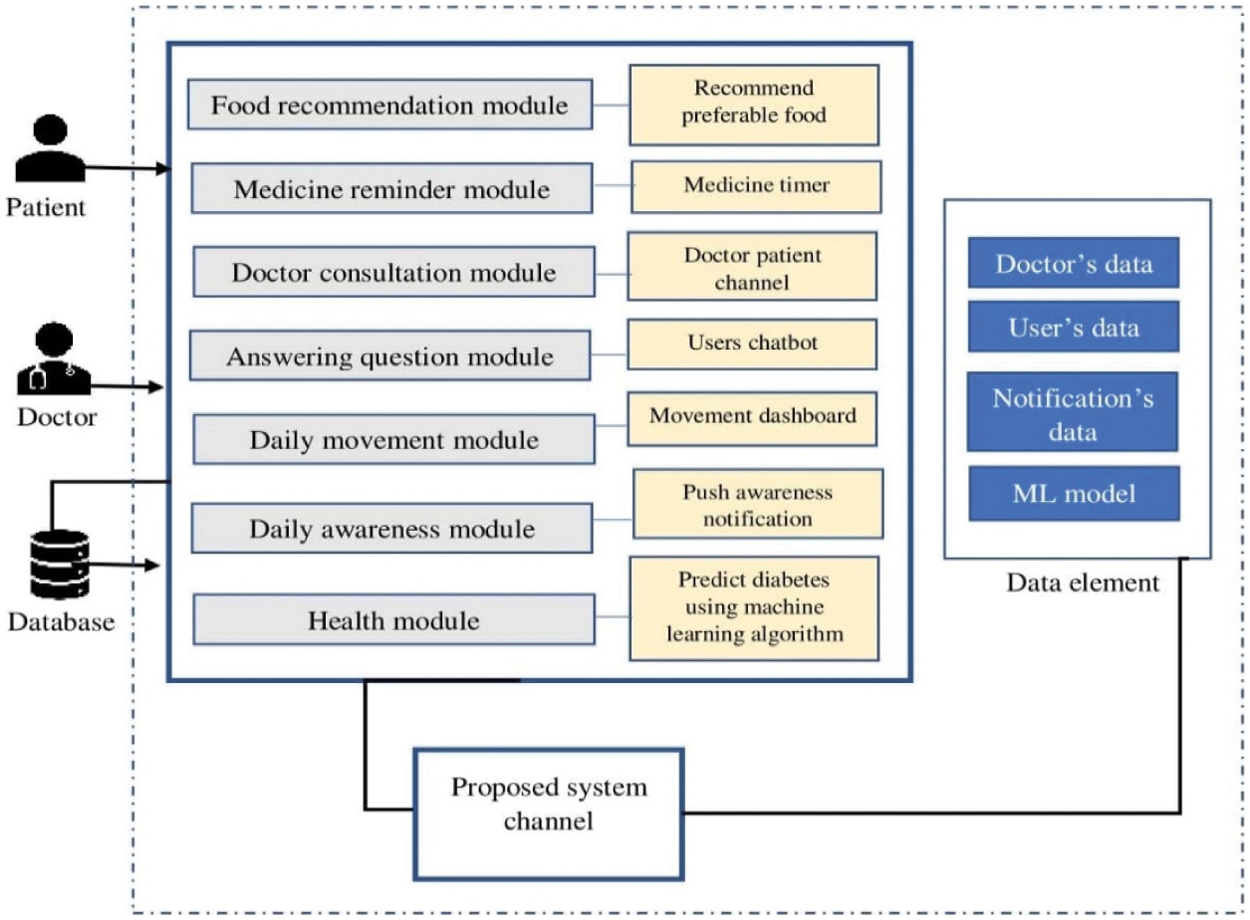
Figure 6: Proposed system architecture design
While developing this mobile application, we have considered everything in terms of health monitoring and diabetes prediction. To put it more simply, for the case of diabetes patients, it is important to avoid having a variety of foods. Also, it is not very difficult for people in first-world countries to get treatment from a doctor, Still, in third-world countries, it is a slightly difficult matter because low-income people find it problematic to see a doctor due to financial constraints. Therefore, to reduce hassle or financial cost, we have put all the following modules in the mobile application where all the problems related to diabetes can be solved. Nonetheless, we have provided multiple features for the case of diabetes and health monitoring.
3.3.1 Food Recommendation Module
A healthy body and mind truly depend on a healthy eating plan. This module aims to recommend to users about preferable food. We have collected some food lists for diabetes users from the National Institute of Diabetes and Digestive and Kidney Diseases [28]. After collecting the food list of diabetic patients, we have created a database, and it has been integrated into the mobile application. When users enter this module, they will be shown a list of foods through which they can be aware of what kind of food they should eat if they have diabetes. For specific individuals, awareness of diabetes can be about avoiding the onset of the disease. Healthy eating and more active lifestyles will avoid type 2 diabetes caused by obesity. Since this system has been developed in a user-friendly way with everyone in mind, through the Food Recommendation Module, anyone can get an idea of what kind of food they can eat if they have diabetes, which will be considered significant. The details sequence and consequence are shown in Fig. 7.
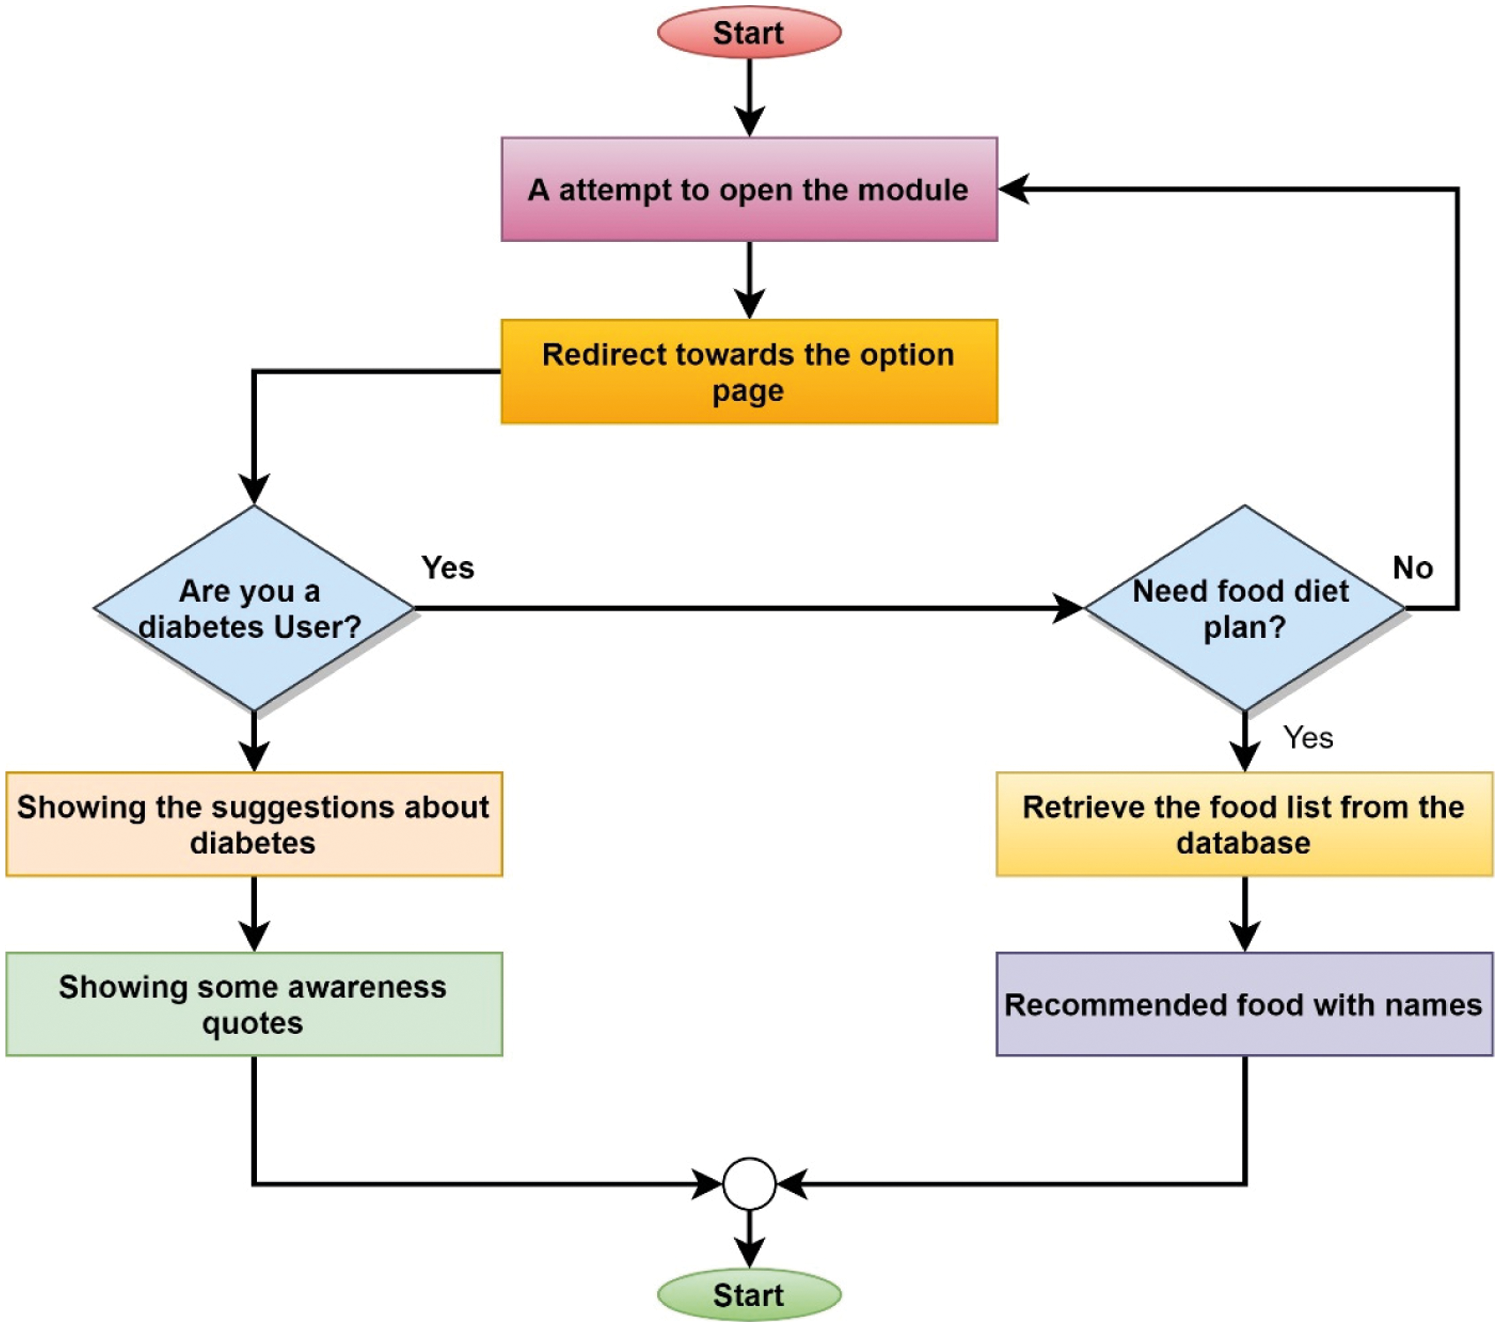
Figure 7: Flowchart of the food recommendation module
3.3.2 Medicine Reminder Module
People with diabetes have to remember a lot of things like taking medicine every day, diet control. However, people can't remember many things, so it will be convenient if there is a system that will automatically remind you to complete a task. A reminder module has been developed focusing on these issues. The system will remind diabetic patients through an alarm notification according to the particular time they have to take medicines, take food, etc. SQLite database has been used to do this because it is very popular as an offline database. When users provide input for their daily records, the data will be stored in the local database, and the application will notify the user at a particular time. The functionality of the Medicine Reminder Module is shown in Fig. 8.

Figure 8: Flow chart of the medicine reminder module
3.3.3 Answering Question Module
The answering Question Module has been integrated with a chatbot to answer relevant diabetes and health questions. Google Dialogflow API has been combined for accomplishing the task. Dialogflow is a platform for natural language understanding that makes it simple for a mobile app, web application, bot, interactive voice response system, etc., to design and incorporate a conversational user interface. Dialogflow can evaluate various user input forms, including text or audio (such as phone or voice recording) inputs. A few ways, either by text or through synthetic expression, can also respond. We have predefined some of the frequently asked questions to answer when users ask questions automatically. The working procedure of this proposed module is shown in Fig. 9.
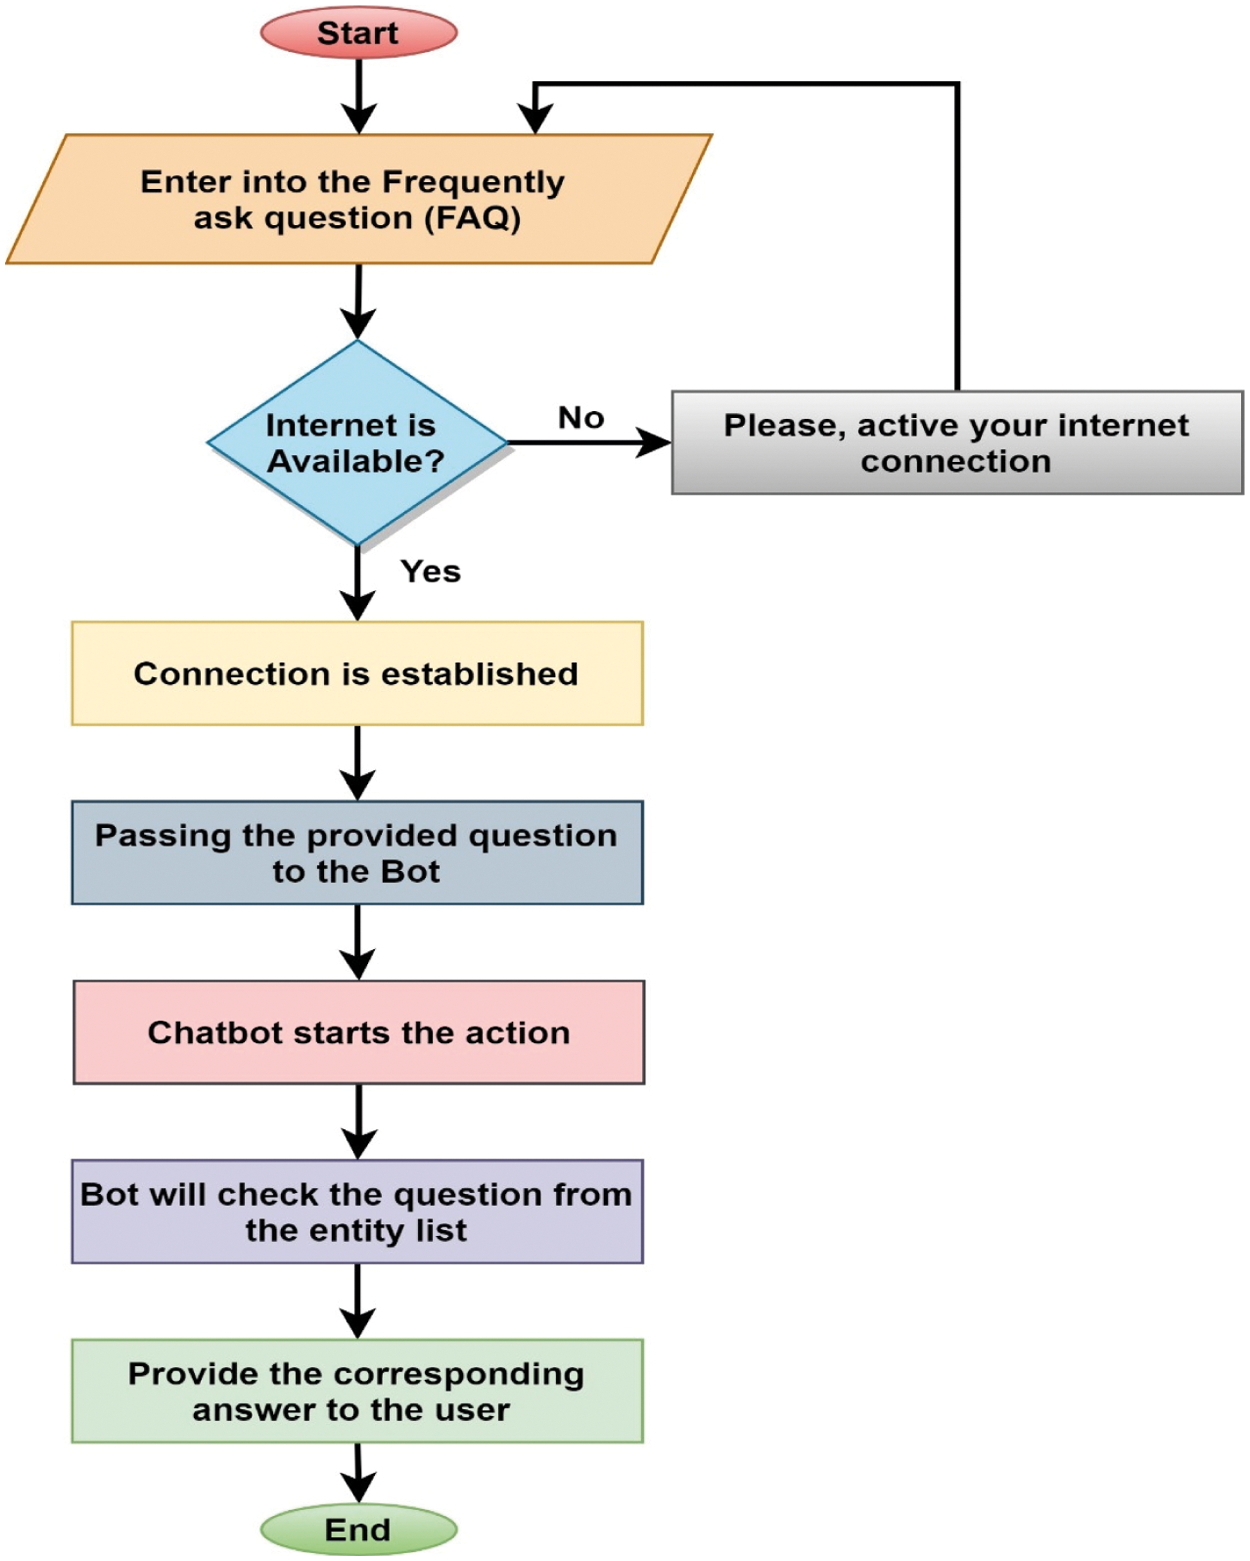
Figure 9: Flowchart of the answering question module
3.3.4 Daily Movement Activities Module
The Daily Movement Activities Module has been developed to visualize users’ daily movements and activities. Simply put, this module is designed to generate a report on how long someone is cycling or walking every day. Google Fit API has been integrated for this particular work & real-time tracking of the movement activities. To create smarter health and wellness apps, Google Fit provides Android and REST APIs. Google Fit APIs will help users find new ideas that they want to share with others. To help people exercise harder, eat healthy, stay calmer, and sleep better, use these experiences to create useful new features [29]. In addition to these, this module incorporates a shaking feature by integrating the accelerometer sensor, which will detect a user's current situation. Almost all smartphones have built-in accelerometer sensors, so combining them and using proper existing technology is good. To use the shaking feature, the user has to register some known numbers in the application. If there is any problem, double shaking the phone will send the location in the form of a message to the known person through current location tracking with Google map link. When people get older, they face various problems, especially diabetics who have to do regular activities such as morning walks, so it is crucial to track their location so that family members can be aware of their whereabouts. Fig. 10 shows the functional explanation of the Daily Movement Activities Module.
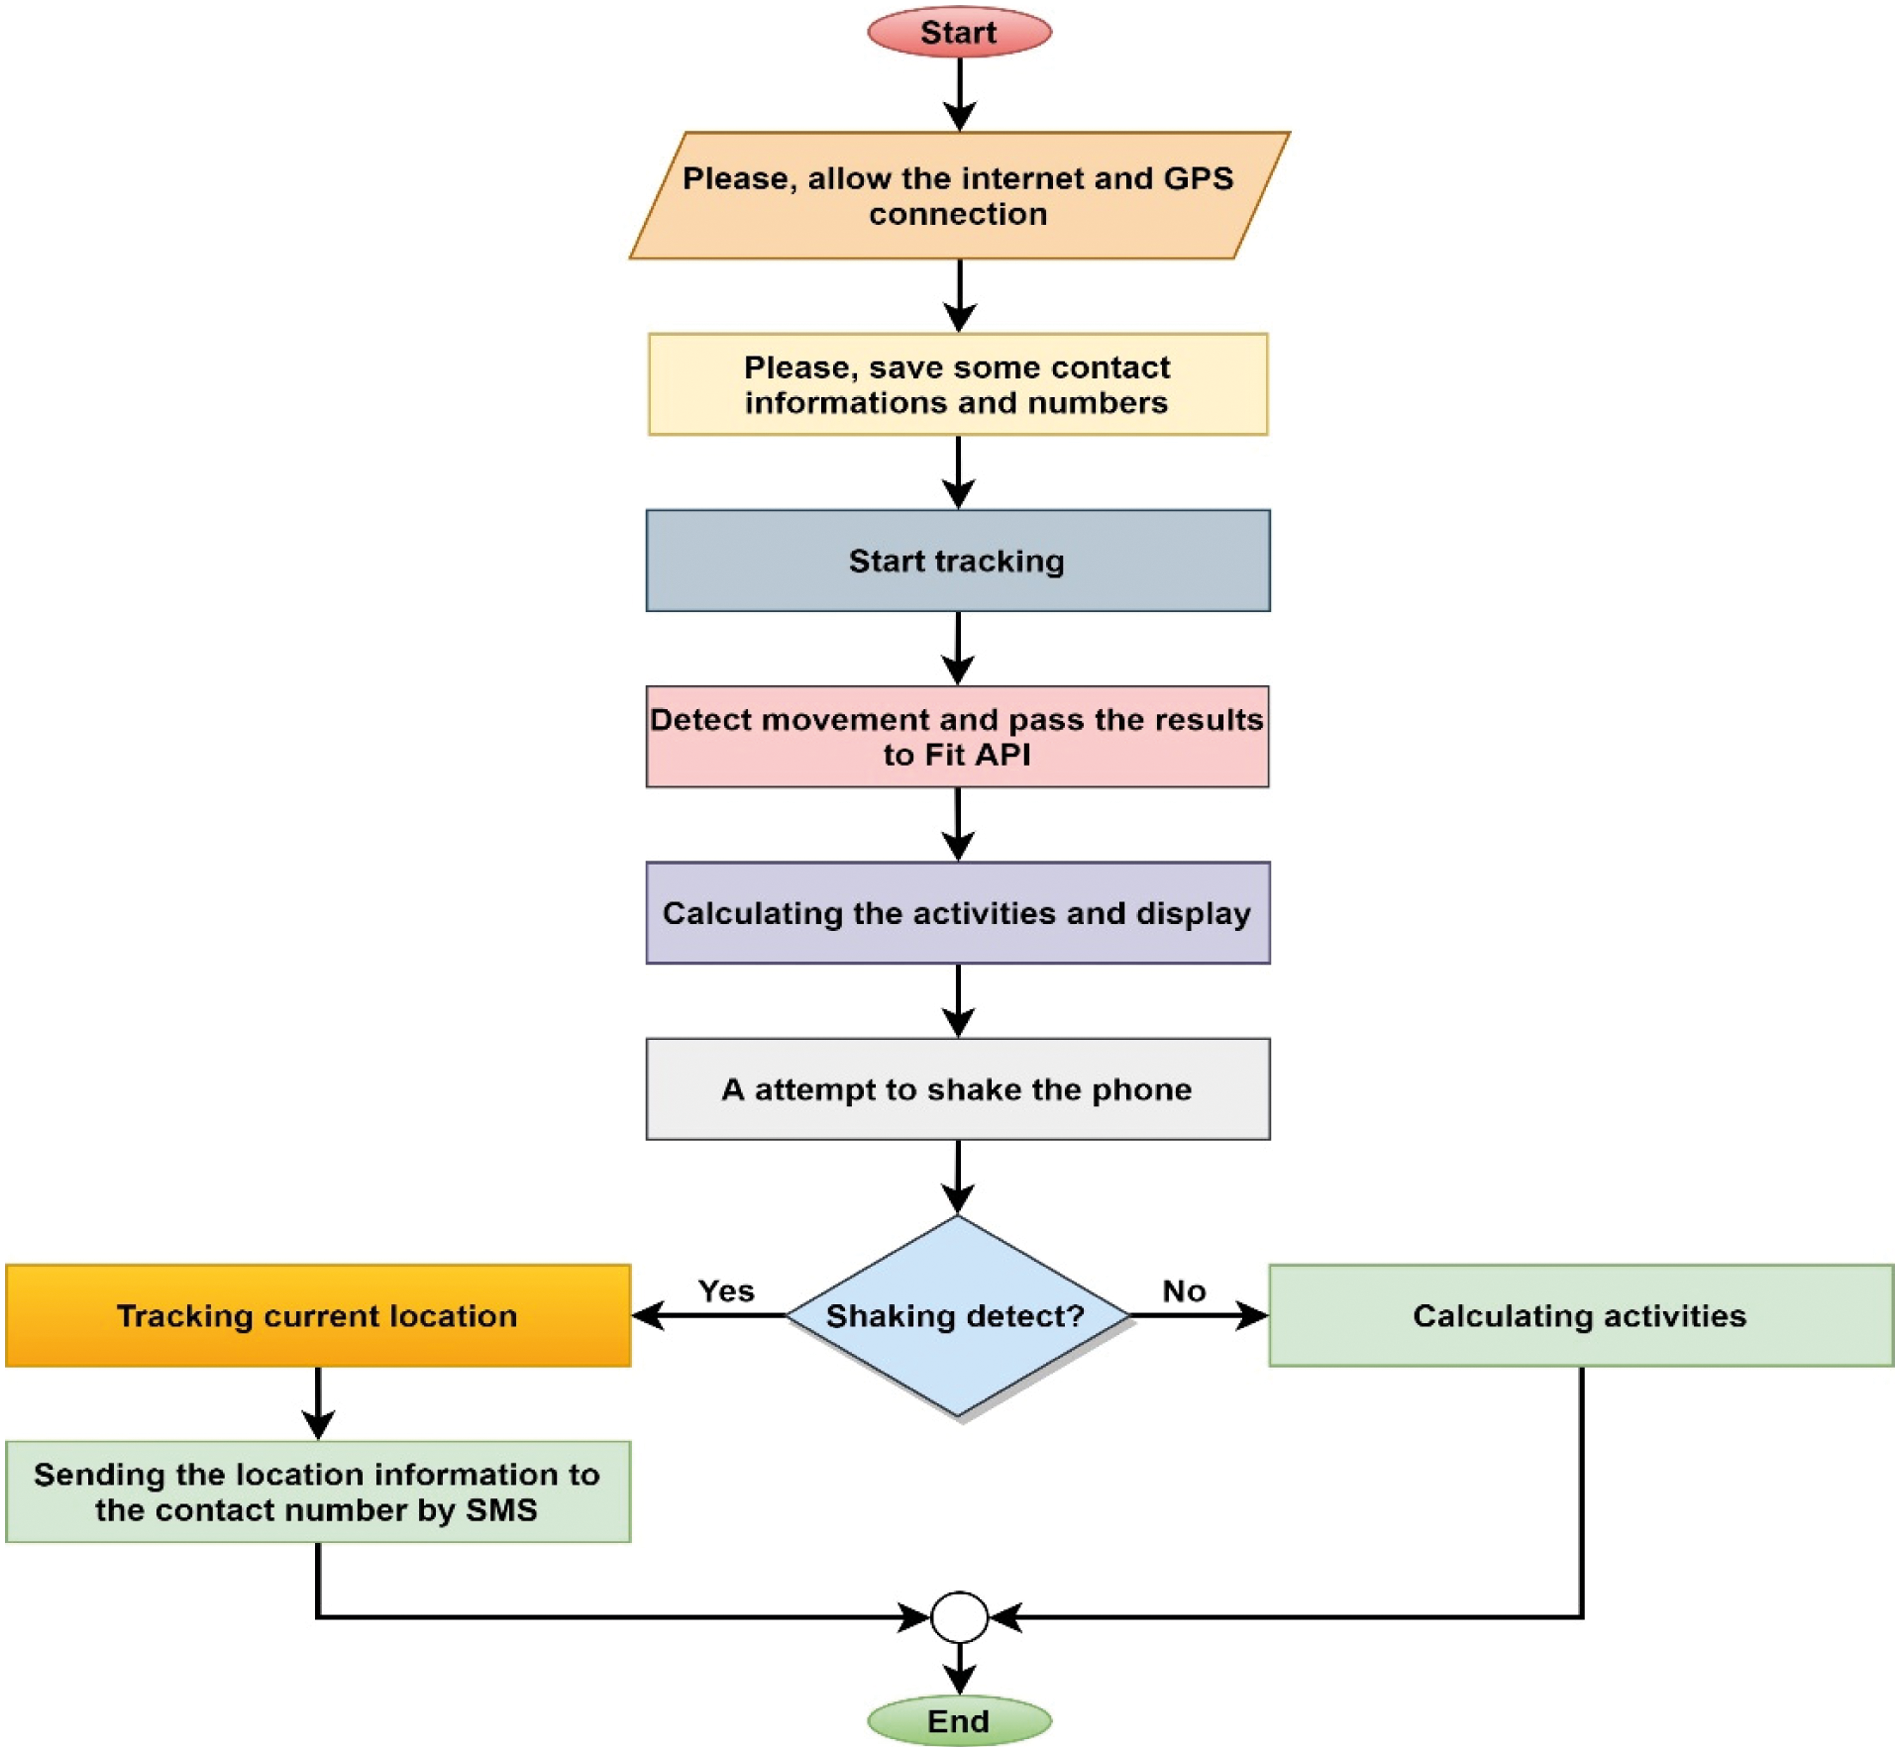
Figure 10: Flowchart of the daily movement activities module
Diabetes is spreading more and more, especially in children and adolescents, and it is present in both type 1 and type 2. This means that the public does not really know or care enough about the disease or is unaware of its harmful aspects. This module informs the user through daily push notifications and makes them aware of what kind of food should be avoided. This module integrated the push notification API for accomplishing this task. The purpose of the daily notification is to enhance awareness regarding diabetes. Users need to keep the Internet open to receive notifications because the system will communicate with the cloud via an Internet connection. This module's main objective is to inform people about diabetes, especially in rural areas, because rural people are less aware of significant diseases. The working procedure of this module is illustrated in Fig. 11.
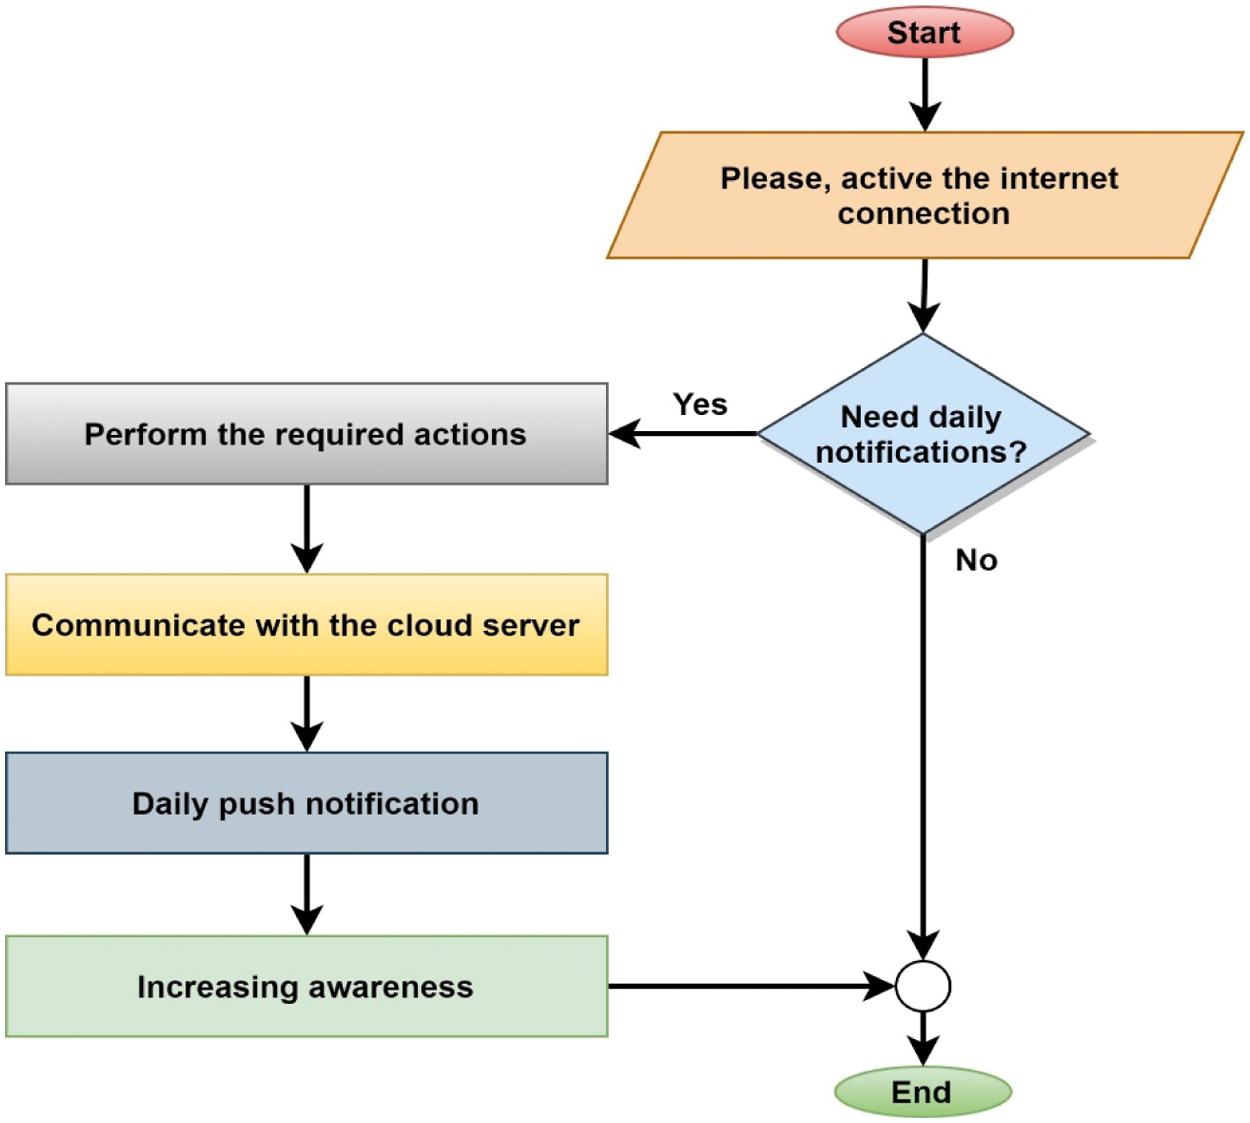
Figure 11: Flowchart of the daily awareness module
Fig. 12 illustrates the block diagram of diagnosis using Machine Learning. The figure is classified into three interconnected phases. Phase-1 provides a diagnosis of diabetes using experimental parameters. Phase-2 gives the data preprocessing methodology with data process, data resizing and data leveling. Eventually, Phase-3 focuses on the artificial diagnosis of diabetes using the traditional approaches. To predict diabetes, ML algorithms have been integrated into the Health Module. To put it more simply, this module has been trained through various machine learning algorithms. Finally, we have explored that the LightGBM & KNN Algorithm performs well with 90% accuracy for predicting diabetes of the individuals. The user has to enter their Age, Body mass index (BMI), Heart Rate, and Glucose. Our module will automatically notify whether anyone has diabetes. The prediction approach and how cooperates with mobile apps are shown in Fig. 13.

Figure 12: Block diagram of diagnosis using machine learning
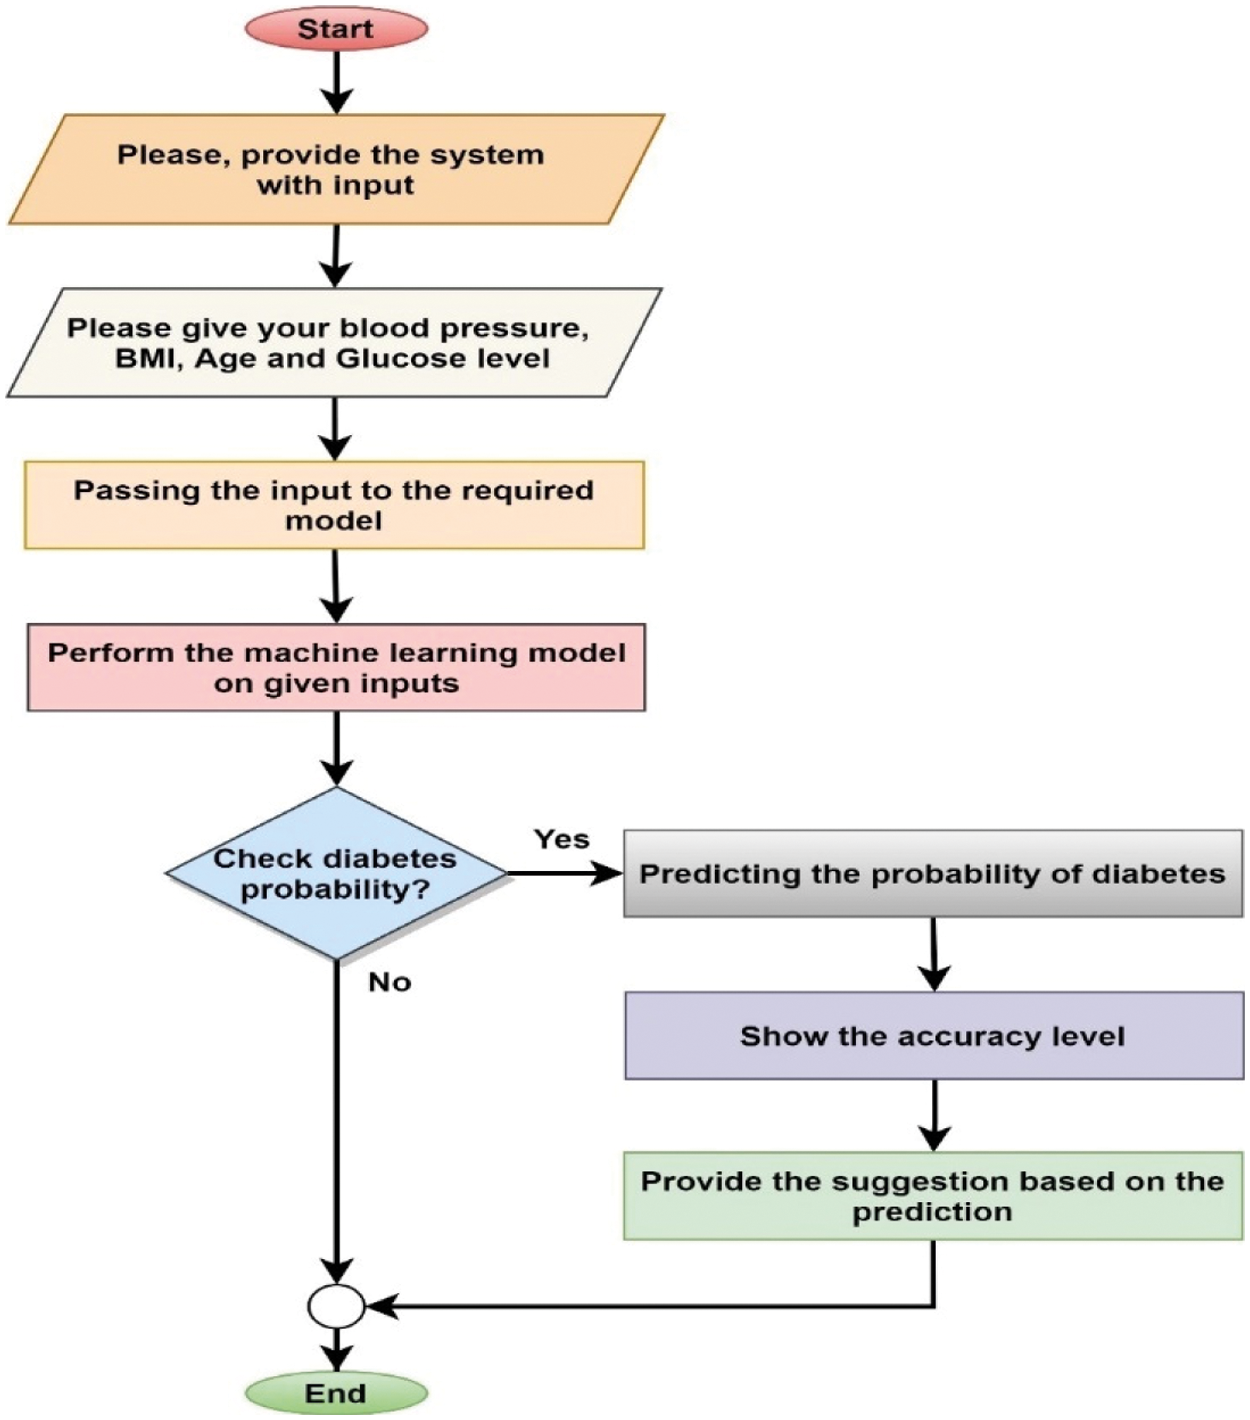
Figure 13: Working procedure of diabetes prediction using the Health Module
This section has been categorized into two parts, to illustrate, Observation of Machine Learning Approach (OMLA) and Observation of the Proposed System (OPS). The OMLA is further subdivided into five parts: Experimental Result, Model Performance, Comparative Analysis, Feature Importance, and Exploratory Data Analysis (EDA). The OPS is also sub-divided into three sections: Survey Data Analysis (SDA) and Developed System Interface (DSI).
4.1 Observation of Machine Learning Approach (OMLA)
The results obtained using the machine learning algorithm are discussed in this section. The subsection is classified into three interconnected parts.
The classification report that was obtained during model training was addressed in this section. Various classification algorithms were evaluated in this analysis. So, the precision, recall, and F1-score of the algorithms are shown in Tab. 3, where the accuracy “P” has been written. The recall is “R” the same way, and the F1-Score is “F1”, confusion matrix measures the accuracy of all types of classification algorithms. It's consists of four values: True positive, false positive, true negative, and False-negative [30]. Type 1 Error is defined as False Positive of the Confusion Matrix, and Type 2 Error is called False Negative [30]. To evaluate the accuracy of a model via the Confusion matrix, such approaches are applied. Eqs. (9)–(12) show the formula for finding Precision, Recall, F-1 scores, and Accuracy. Fig. 14 shows the visual representation of the accuracy score of Tab. 3.
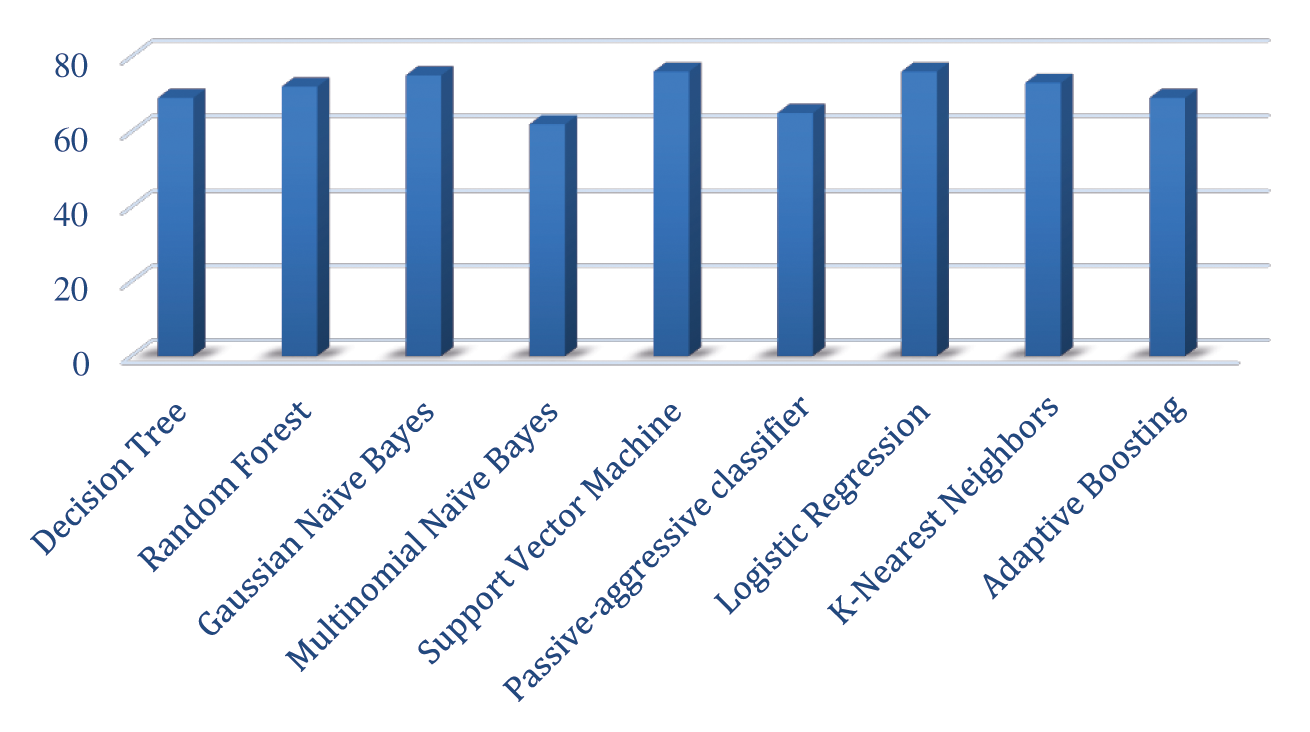
Figure 14: Visual representation of the Accuracy score

Precision: The number of correct positive outcomes is divided by the number of correct positive outcomes predicted by the classifier. It is articulated as—
Recall: The number of positive findings is accurate, split by all the related samples. It is given in mathematical form as—
F1 score: It is applied to calculate the accuracy of a test. The Harmonic Mean between accuracy and recall is the F1 score. For the F1 score, the range is [0,1]. It informs how accurate a classifier is and how robust it is. It is given, mathematically, as—
Confusion Matrix: It provides a matrix as output and defines the model's maximum efficiency.
Accuracy: How accurately the overall model can predict. It is possible to measure the matrix accuracy by taking the average values lying around the main diagonal. It is given as-
4.1.2 Evaluating Model Performance
Several elements are required to measure a model's performance, for instance, Confusion Matrix, Precision-Recall Curve, ROC Curve, and Cross-Validation. To begin, the Confusion Matrix, often known as the error matrix, is a tool for visualizing the performance of an algorithm. True positive (TP), True negative (TN), False positive (FP), and False negative (FN) are the four parameters. Let us discuss it as an example. Diabetic correctly identified as diabetic is True positive. Healthy people who are accurately identified as healthy are True negative, healthy people who are wrongly identified as diabetic are False positive, and diabetic people who are incorrectly identified as healthy are False-negative. We have already explained the Confusion Matrix in the Experimental Results section and described the mathematical equations of Precision, Recall, and F1-Score in the Eqs. (3)–(6), respectively. Precision quantifies the number of positive predictions for the class that is presently classified as positive. The recall is a measurement of how many positive class predictions were produced from all positive examples in the dataset. F-Measure provides a single score that takes into account both the accuracy and the number of recalls. Plotting the true positive rate (TPR) vs. the false positive rate (FPR) at various threshold values yields the ROC Curve example. In another case, Precision-Recall Curve shows the tradeoff between precision and recall for the different thresholds to train and test the algorithm.
Furthermore, the original sample is randomly partitioned into k equal-sized subsamples in k-fold cross-validation. A single subsample from the k subsamples is kept as validation data for testing the model, while the remaining k-1 subsamples are used as training data. The cross-validation procedure is then performed k times, with each of the k subsamples serving as validation data exactly once. Then, to get a single estimation, the results from each k performance will be averaged. The main goal of repeated random subsampling is to use all observations for both training and validation and to verify each statement only once. There are several advantages of k-fold cross-validation; for example, the different output is available for different folds, so it is known how well the model will function overall, and K fold cross-validation can be used to avoid overfitting. A significant step in the production of a model is model assessment [31]. It helps to select the best model for representing our data and forecasting the selected model's future performance. However, it is not good to evaluate model output on the data used for training in data science because this can lead to over-optimistic and over fitted models [32]. Therefore, it is essential to measure the performance of the model. The above performance indicators are an essential and effective approach in data science, so we have assessed the model's performance by following these criteria.
In our proposed research, Light Gradient Boosting Machine (LightGBM) is applied, a gradient boosting framework that uses tree-based learning algorithms. LightGBM, based on decision tree algorithms, is a fast, distributed, high-performance gradient boosting method used for ranking, classification, prediction, and many other machine learning tasks [33,34]. It can manage large quantities of information and have greater precision than different decision tree gradient boosting models such as eXtreme Gradient Boosting (XGBoosting) [35]. LightGBM can be used to address several issues, including binary classification, multi-classification, regression, and several others. The reason for including it in this study is that it has specific functionalities that are not seen in traditional algorithms. Faster training speed, higher performance, capacity to manage large-scale data, support for parallel and Graphics Processing Unit (GPU) learning, lower memory use, and enhanced accuracy are just a few of its characteristics. Since this research is included in the binary classification, the LightGBM has been considered for this, and accuracy has come in handy for its unique features.
The average score of the ROC-AUC curve over LightGBM is marked as 0.948, and the average accuracy of cross-validation (5 folds) is seen as 0.89. On the other hand, the average score of the ROC-AUC curve on KNN is 0.936, and the average accuracy after cross-validation (5 folds) is 0.90. There is no particular formula for calculating K's value to the best of our knowledge, but it is a good idea to keep 10. A random function is applied to divide data into these many folds For example, suppose we have 10 data points in the data set, and K = 5 is specified, then 10/5 = 2, so there will be 2 points that will be kept for testing for each fold and rest in training. Fig. 15a shows the Model performance report of LightGBM (5 folds), Fig. 15b shows the Model performance report of LightGBM & KNN. The detailed report of the model is shown in Fig. 15.
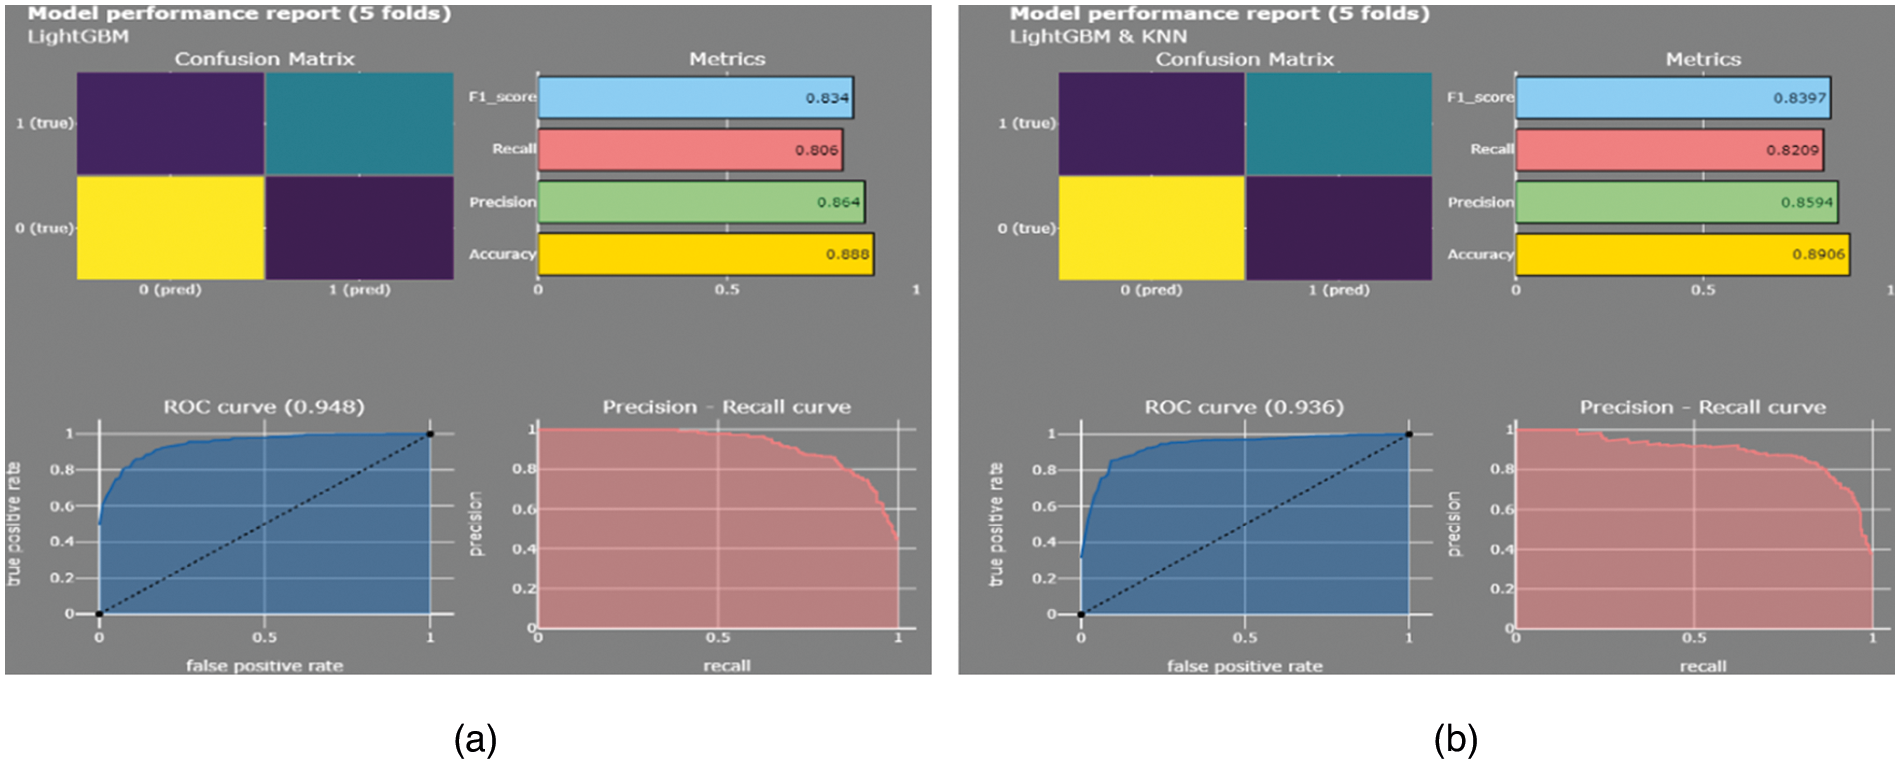
Figure 15: (a) Model performance report of light gradient boosting machine(LightGBM) (b) Model performance report of LightGBM & K-nearest neighbor(KNN)
Tab. 4 shows the cross-validation (5 folds) report of the LightGBM & KNN. Reports for LightGBM and KNN are generated individually by K (5) fold cross-validation and mean, and the standard deviation is found at the end of each fold experiment. Mean and standard deviations have also been made by cross-validating the top of the ROC-AUC curve. ROC stands for Receiver Operating Curve, and AUC stands for Area under Curve. Another method of determining how good the performance of different classification models is the ROC-AUC curve.

Figs. 16 and 17 show the Discrimination threshold plot for LightGBM and Voting Classifier. The threshold of discrimination is a visualization of accuracy, recall, f1 ranking, and queue rate with respect to a binary classifier's discrimination threshold. The discrimination threshold is the probability or score at which the positive class is chosen above the negative. Vote Classifier is a meta-classifier that uses majority or plurality voting to categorize comparable or conceptually dissimilar machine learning classifiers.
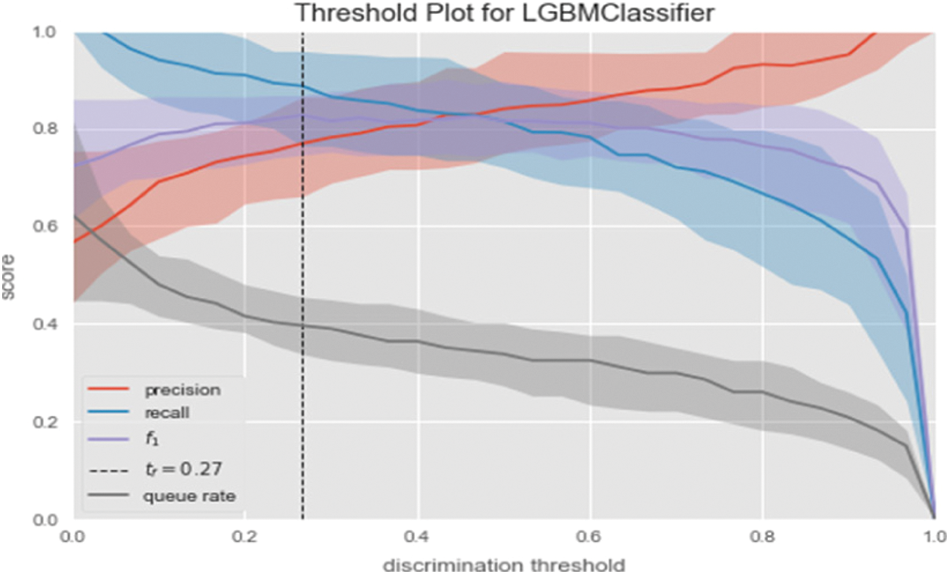
Figure 16: Discrimination threshold plot for LightGBM

Figure 17: Discrimination threshold plot for voting classifier
In this section, the result obtained by experimenting with several machine learning algorithms was compared with the previous research using the Pima Indian dataset. Tab. 5 shows the comparative study of associated diabetes detection studies with the proposed dataset. The Table is divided based on some criteria such as Method, Accuracy, LightGBM approach, Integrating Mobile Apps, and Deployment Pipeline. We have compared our obtained accuracy with the previous study based on predicting diabetes. In this study, Light Gradient Boosting Machine (LightGBM) & KNN performs efficiently with 90% accuracy. By taking a close look at Tab. 5, it can be identified that the performance of the previously published model is comparatively less than the model proposed in this research. In another case, we have indicated that all studies based on diabetes prediction have been completed in the past. They were primarily limited to simulations; however, there is no pipeline on predicting diabetes through mobile applications, and adequate research has not been completed yet.

Through this comparison, we have tried to highlight a few more things, such as the research that has been done in the past on diabetes prediction, especially on this dataset, to find information about their working methods. Many state-of-the-art techniques are currently playing a vital role in data science, so it is essential to find the previous work's performance so that researchers can develop new solutions to the work in this particular field.
We have used LightGBM, followed by the novel approach, and obtained 90% accuracy, so the previously published investigation was conducted based on traditional methods. No novel techniques have been used there. In addition to the other things we have analyzed through Comparison, the previous research has worked with a particular algorithm. Still, not all the possible algorithms have been explained in detail. We have designed our research as a benchmark; thus, it will be fruitful for the research community. The details sequence and consequence are shown in Tab. 5.
Feature choice is the process of reducing the number of input variables when creating a predictive model. It is advisable to scale the number of input variables to reduce the cost of modeling calculations and, in some cases, to increase the model's effectiveness. The statistics-based feature selection method uses statistics for each input variable and target variable and selects the input variables with a substantial correlation to the target variable [44,45]. Various feature choice techniques are available, such as Univariate Selection, Feature Significance, and Correlation Matrix with Heatmap. Several other online portals from which a wide variety of datasets are commonly available such as Kaggle and UCI Machine learning repository. Feature Importance provides a score to each of the data's features; the higher the score, the more significant the feature is to the output variable. Tree-Based Classifiers have an inbuilt class called Feature Importance. Feature selection is a fundamental principle in traditional ML that profoundly affects the model's efficiency [46,47]. The data attributes utilized for training machine learning models have a big impact on the final output. Model output may be harmed by features that are insignificant or only partially significant. Fig. 18 shows the Feature importance of the input variables.

Figure 18: Feature significance of the input variables
4.1.5 Exploratory Data Analysis
Blood sugar and hypertension can be related terms for diabetic patients. It's necessary to measure the blood sugar level along with blood pressure. There are three ways to increase blood pressure concerning the corresponding glucose level. The first one, when the blood vessels become losing their capability to stretch. The second one, the body's fluid, will be increased if the diabetes is already affected by the kidneys. The third one is related to insulin resistance, which is also liable to increase hypertension risk. Again, Fig. 19 shows a scattered diagram of Glucose level vs. Body Mass Index (BMI) of our experimental data analysis Fig. 20 presents the experimental prediction of the diabetic patient and healthy person. In our experiment, we have defined a threshold value for both glucose level and blood pressure. The experimental data shows 268 patients have a potential risk of diabetes of 92.2%.

Figure 19: Data analysis based on glucose vs. BMI
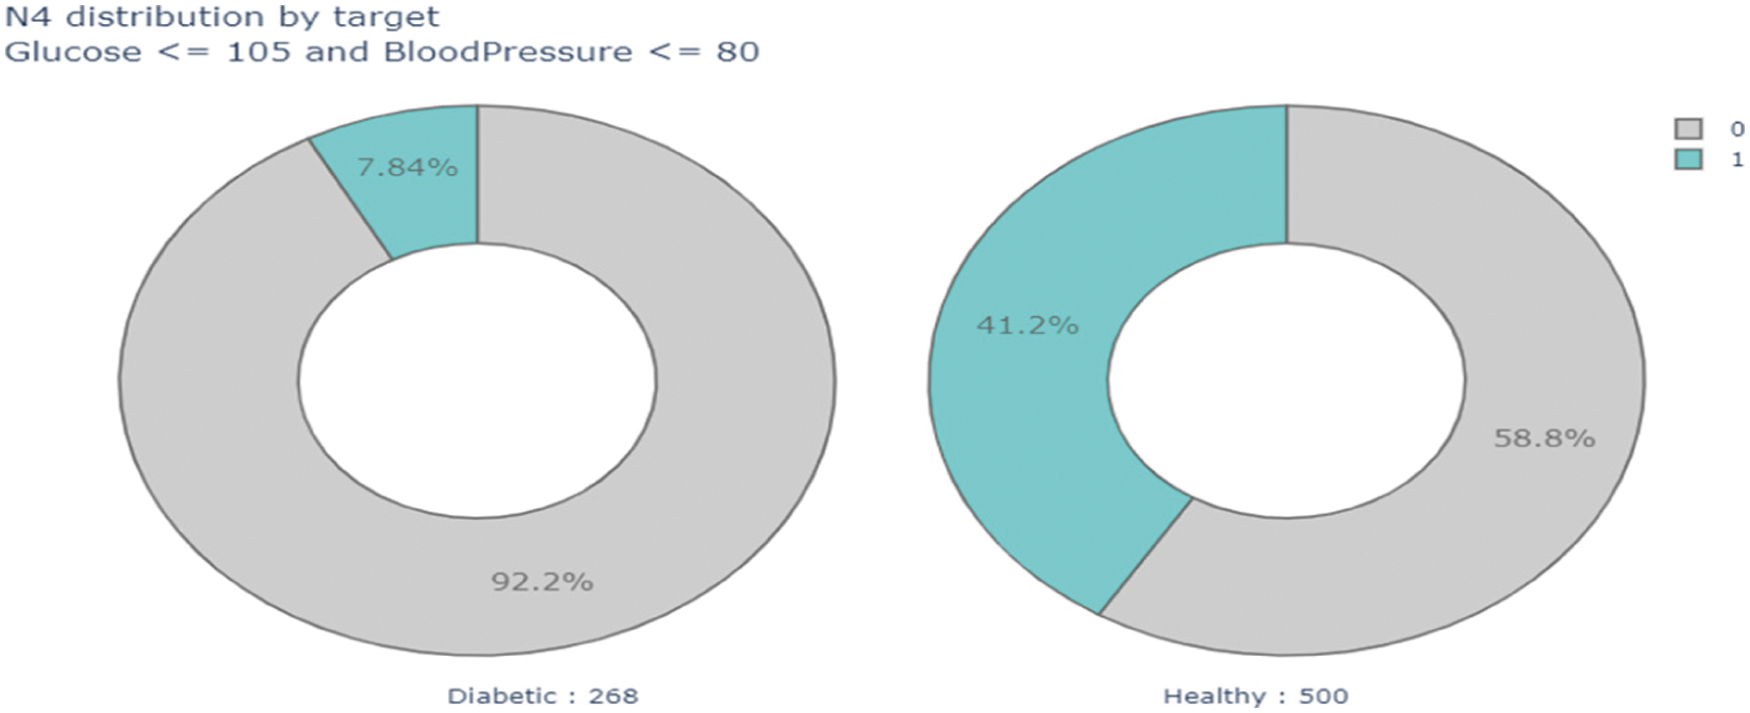
Figure 20: Data analysis based on glucose and blood pressure
On the other hand, 500 patients have less risk of diabetes than the previous one. Thus, we can mark them as healthy person.
4.2 Observation of the Proposed System (OPS)
The upper Tab. 6 shows the portion of answered questions’ responses and analyzing data with different criteria, Necessity and Impactful, which filter survey data. Fig. 21 shows a pie shows the result of the survey with the features of Necessity and Impactful. Again, we have calculated votes on which features are found most useful for diabetes patients. After successfully evaluating the voices from 158 responses, we have tracked out that almost 100% of people think about diet plan features. More than 80% of people endorse doctors, and around 80% of people believe in consultation, and so on. We have examined that “track activities” are less popular than any other proposed solution features. Fig. 22 shows the corresponding results of the survey.

4.2.2 Developed System Interface (DSI)
The manuscript also ensures the embodiment of the proposed solution. We have first designed the User Interface (UI) design of the proposed mobile application in our development process. After that, we have collected a dataset from the website, and a machine learning design was performed. After that, we have analyzed the experimental data and interpreted it accordingly. Fig. 23 shows some interfaces of our proposed developed mobile application.

Figure 21: Pie chart based on the average response of the survey
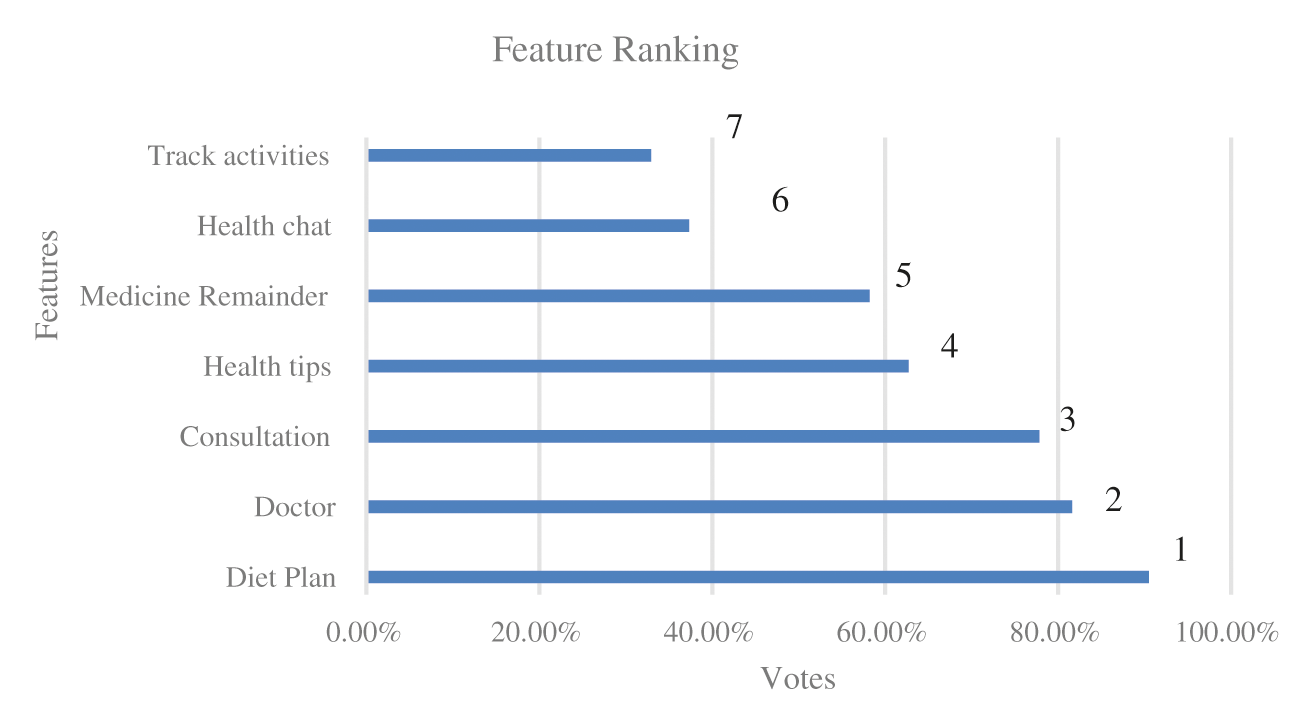
Figure 22: Measuring the feature ranking by conducting the survey

Figure 23: Interface of the proposed mobile application
Health is more important than other activities. However, many developing countries suffer from low-quality health services because they allocate a smaller portion of their budget to the health sector. Consequently, the citizen of these countries cannot concentrate on their work because of these difficulties. This work proposes a mobile application based on modern computation, which is straightforward to predict diabetes. The proposed model has been enriched with one of the most emergent technologies, such as a Machine Learning based system to find accurate prediction levels on diabetes. To accomplish this goal, some data preprocessing operations have been interpreted on the dataset. Also, several machine learning algorithms have been utilized in this work to track better accuracy in the diagnosis of diabetes diseases. The proposed model has 90% accuracy on the K nearest neighbors algorithm (KNN) & Light Gradient Boosting Machine (LightGBM). A comparison of the accuracy of the machine learning algorithms has been enumerated with the existing study to ensure this work's novelty. The research has further performed a survey data analysis on consciousness and awareness of public health-related mobile applications and diabetes. The associated resulting data has also been in this manuscript. Though the proposed work has better accuracy in predicting a patient's diabetes, the model also has a set of limitations. First of all, the dataset utilized in this study needs to bring many more data preprocessing changes to increase the model's accuracy. Second, this application has been designed only for educated people on the clinical trial. In the future, this research will overcome these two issues and present a common platform for both educated and uneducated people. Also, this research will present the effectiveness of public health with the developed application through System Usability Scale (SUS). However, this research's objective is achieved, and the proposed solution can be adjustable in the daily activities of a diabetic patient.
Funding Statement: The authors received no specific funding for this study.
Conflicts of Interest: The authors of this study declare that they have no conflict of interest.
1. A. Banan, A. Nasiri and A. Taheri-Garavand, “Deep learning-based appearance features extraction for automated carp species identification,” Aquacultural Engineering, vol. 89, no. 0144−8609, pp. 102053, 2020. [Google Scholar]
2. G. D. Kalyankar, S. R. Poojara and N. V. Dharwadkar, “Predictive analysis of diabetic patient data using machine learning and Hadoop,” in The 2017 Int. Conf. on I-SMAC (IoT in Social, Mobile, Analytics and Cloud) (I-SMAC), Coimbatore, Tamilnadu, India, pp. 619–624, 2017. [Google Scholar]
3. S. F. Ardabili, B. Najafi, S. Shamshirband, B. M. Bidgoli, R. C. Deo et al., “Computational intelligence approach for modeling hydrogen production: A review,” Engineering Applications of Computational Fluid Mechanics, vol. 12, no. 1, pp. 438–458, 2018. [Google Scholar]
4. R. Taormina and K. -W. Chau, “ANN-Based interval forecasting of streamflow discharges using the LUBE method and MOFIPS,” Engineering Applications of Artificial Intelligence, vol. 45, pp. 429–440, 2015. [Google Scholar]
5. B. Choubin, M. Borji, F. S. Hosseini, A. Mosavi and A. A. Dineva, “Mass wasting susceptibility assessment of snow avalanches using machine learning models,” Scientific Reports, vol. 10, no. 1, pp. 1–13, 2020. [Google Scholar]
6. S. Shamshirband, T. Rabczuk and K. -W. Chau, “A survey of deep learning techniques: Application in wind and solar energy resources,” IEEE Access, vol. 7, pp. 164650–164666, 2019. [Google Scholar]
7. A. Mosavi, F. Hosseini, B. Choubin, F. Taromideh, M. Ghodsi et al., “Susceptibility mapping of groundwater salinity using machine learning models,” Environmental Science and Pollution Research, vol. 28, no. 9, pp. 10804–10817, 2021. [Google Scholar]
8. S. Ahmed, Z. Abdullah, D. R. Palit and D. Rokonuzzaman, “A study of mobile application usage in Bangladesh,” International Journal of Computer Science and Software Engineering, vol. 2, no. 4, pp. 1–13, 2015. [Google Scholar]
9. A. Rghioui, J. Lloret, S. Sendra and A. Oumnad, “A smart architecture for diabetic patient monitoring using machine learning algorithms,” Healthcare, vol. 8, no. 3, pp. 348, 2020. [Google Scholar]
10. A. K. Kable, J. Pich and S. E. Maslin-Prothero, “A structured approach to documenting a search strategy for publication: A 12 step guideline for authors,” Nurse Education Today, vol. 32, no. 8, pp. 878–886, 2012. [Google Scholar]
11. M. Isaković, U. Sedlar, M. Volk and J. Bešter, “Usability pitfalls of diabetes mHealth apps for the elderly,” Journal of Diabetes Research, vol. 2016, pp. 2314–6745, 2016. [Google Scholar]
12. O. El-Gayar, P. Timsina, N. Nawar and W. Eid, “Mobile applications for diabetes self-management: Status and potential,” Journal of Diabetes Science and Technology, vol. 7, no. 1, pp. 247–262, 2013. [Google Scholar]
13. T. M. Alam, M. A. Iqbal, Y. Ali, A. Wahab, S. Ijaz et al., “A model for early prediction of diabetes,” Informatics in Medicine Unlocked, vol. 16, no. 2352−9148, pp. 100204, 2019. [Google Scholar]
14. D. Sisodia and D. S. Sisodia, “Prediction of diabetes using classification algorithms,” Procedia Computer Science, vol. 132, pp. 1578–1585, 2018. [Google Scholar]
15. M. Islam, M. Raihan, S. R. I. Akash, F. Farzana and N. Aktar, “Diabetes mellitus prediction using ensemble machine learning techniques,” in Proc. Int. Conf. on Computational Intelligence, Security and Internet of Things, Singapore, pp. 453–467, 2019. [Google Scholar]
16. A. Mujumdar and V. Vaidehi, “Diabetes prediction using machine learning algorithms,” Procedia Computer Science, vol. 165, pp. 292–299, 2019. [Google Scholar]
17. N. P. Tigga and S. Garg, “Prediction of type 2 diabetes using machine learning classification methods,” Procedia Computer Science, vol. 167, pp. 706–716, 2020. [Google Scholar]
18. M. Maniruzzaman, M. J. Rahman, B. Ahammed and M. M. Abedin, “Classification and prediction of diabetes disease using machine learning paradigm,” Health Information Science and Systems, vol. 8, no. 1, pp. 1–14, 2020. [Google Scholar]
19. N. S. Khan, M. H. Muaz, A. Kabir and M. N. Islam, “Diabetes predicting mhealth application using machine learning,” in Proc. 2017 IEEE Int. WIE Conf. on Electrical and Computer Engineering (WIECON-ECE), Dehradun, Uttarkhand, India, pp. 237–240, 2017. [Google Scholar]
20. P. Sonar and K. JayaMalini, “Diabetes prediction using different machine learning approaches,” in The 2019 3rd Int. Conf. on Computing Methodologies and Communication (ICCMC), 3rd ed., Erode, Tamil Nadu, India, pp. 367–371, 2019. [Google Scholar]
21. U. M. Learning, “Pima Indians Diabetes Database,” 2017. [Online]. Available: https://www.kaggle.com/uciml/pima-indians-diabetes-database. [Google Scholar]
22. C. L. Wu and K. -W. Chau, “Prediction of rainfall time series using modular soft computingmethods,” Engineering Applications of Artificial Intelligence, vol. 26, no. 3, pp. 997–1007, 2013. [Google Scholar]
23. B. S. Ahamed and S. Arya, “LGBM classifier based technique for predicting type-2 diabetes,” European Journal of Molecular & Clinical Medicine, vol. 8, no. 3, pp. 454–467, 2021. [Google Scholar]
24. G. Guo, H. Wang, D. Bell, Y. Bi and K. Greer, “KNN Model-based approach in classification,” in Proc. OTM Confederated Int. Conferences on the Move to Meaningful Internet Systems Lecture Notes Computer Science, Springer, Berlin Heidelberg, pp. 986–996, 2003. [Google Scholar]
25. I. H. Sarker, “Machine learning: Algorithms, real-world applications and research directions,” SN Computuer Science, vol. 2, no. 3, pp. 1–21, 2021. [Google Scholar]
26. A. Miklosik and N. Evans, “Impact of big data and machine learning on digital transformation in marketing: A literature review,” IEEE Access, vol. 8, pp. 101284–101292, 2020. [Google Scholar]
27. P. Kalyan, “A Complete Guide on Machine Learning Model Deployment Using Heroku,” 2021. [Online]. Available: https://www.analyticsvidhya.com/blog/2021/10/a-complete-guide-on-machine-learning-model-deployment-using-heroku/. [Google Scholar]
28. NIDK, “National Institute of Diabetes and Digestive and Kidney Diseases.” [Online]. Available: https://www.niddk.nih.gov/. [Google Scholar]
29. “Google Fit.” [Online]. Available: https://developers.google.com/fit. [Google Scholar]
30. A. Bhandari, “Everything you Should Know about Confusion Matrix for Machine Learning,” 2020. [Online]. Available: https://www.analyticsvidhya.com/blog/2020/04/confusion-matrix-machine-learning/. [Google Scholar]
31. K. J. Danjuma, “Performance evaluation of machine learning algorithms in post-operative life expectancy in the lung cancer patients,” IJCSI International Journal of Computer Science Issues, vol. 12, pp. 1694–0784, 2015. [Google Scholar]
32. R. Roelofs, S. Fridovich-Keil, J. Miller, V. Shankar, M. Hardt et al., “A Meta-analysis of overfitting in machine learning,” in Proc. 33rd Int. Conf. on Neural Information Processing Systems, Vancouver, Canada, pp. 9179–9189, 2019. [Google Scholar]
33. A. Natekin and A. Knoll, “Gradient boosting machines, a tutorial,” Frontiers in Neurorobotics, vol. 7, pp. 21, 2013. [Google Scholar]
34. A. V. Konstantinov and L. V. Utkin, “Interpretable machine learning with an ensemble of gradient boosting machines,” Knowledge-Based Systems, vol. 222, pp. 106993, 2021. [Google Scholar]
35. G. Ke, Q. Meng, T. Finley, T. Wang, W. Chen et al., “Lightgbm: A highly efficient gradient boosting decision tree,” in Proc. 31st Int. Conf. on Neural Information Processing Systems, Long Beach, California, USA, vol. 30, pp. 3146–3154, 2017. [Google Scholar]
36. R. Haritha, D. S. Babu and P. Sammulal, “A hybrid approach for prediction of type-1 and type-2 diabetes using firefly and cuckoo search algorithms,” International Journal of Applied Engineering Research, vol. 13, no. 2, pp. 896–907, 2018. [Google Scholar]
37. Y. Zhang, Z. Lin, Y. Kang, R. Ning and Y. Meng, “A Feed-forward neural network model for the accurate prediction of diabetes mellitus,” International Journal of Scientific and Technology Research, vol. 7, no. 8, pp. 151–155, 2018. [Google Scholar]
38. A. Iyer, S. Jeyalatha and R. Sumbaly, “Diagnosis of diabetes using classification mining techniques,” International Journal of Data Mining and Knowledge Management Process, vol. 5, pp. 1–14, 2015. [Google Scholar]
39. V. A. Kumari and R. Chitra, “Classification of diabetes disease using support vector machine,” International Journal of Engineering Research and Applications, vol. 3, no. 2, pp. 1797–1801, 2013. [Google Scholar]
40. D. Çalişir and E. Doğantekin, “An automatic diabetes diagnosis system based on LDA-wavelet support vector machine classifier,” Expert Systems with Applications, vol. 38, no. 7, pp. 8311–8315, 2011. [Google Scholar]
41. S. M. Dadgar and M. Kaardaan, “A hybrid method of feature selection and neural network with genetic algorithm to predict diabetes,” International Journal of Mechatronics, Electrical and Computer Technology (IJMEC), vol. 7, no. 24, pp. 3397–3404, 2017. [Google Scholar]
42. W. Chen, S. Chen, H. Zhang and T. Wu, “A hybrid prediction model for type 2 diabetes using K-means and decision tree,” in Proc. 2017 8th IEEE Int. Conf. on Software Engineering and Service Science (ICSESS), China Hall of Science and Technology, Beijing, China, pp. 386–390, 2017. [Google Scholar]
43. R. N. Patil and S. Tamane, “A novel scheme for predicting type 2 diabetes in women: Using kmeans with PCA as dimensionality reduction,” International Journal of Computer Engineering and Application, vol. XI, no. VIII, pp. 76–87, 2017. [Google Scholar]
44. J. Brownlee, “How to Choose a Feature Selection Method For Machine Learning,” 2019. [Online]. Available: https://machinelearningmastery.com/feature-selection-with-real-and-categorical-data/. [Google Scholar]
45. N. Islam, A. Shaikh, A. Qaiser, Y. Asiri, S. Almakdi et al., “Ternion: An autonomous model for fake news detection,” Applied Sciences, vol. 11(19pp. 9292, 2021. [Google Scholar]
46. T. Alelyani, A. Shaikh, A. Sulaiman, Y. Asiri, H. Alshahrani et al., “Research challenges and opportunities towards a holistic view of telemedicine systems: A systematic review,” Enhanced Telemedicine and E-Health: Advanced IoT Enabled Soft Computing Framework, vol. 410, pp. 3–26, 2021. [Google Scholar]
47. A. Alazeb, M. Alshehri and S. Almakdi, “Review on data science and prediction,” in 2nd Int. Conf. on Computing and Data Science (CDS), IEEE, pp. 548–555, 2021. [Google Scholar]
 | This work is licensed under a Creative Commons Attribution 4.0 International License, which permits unrestricted use, distribution, and reproduction in any medium, provided the original work is properly cited. |