DOI:10.32604/cmc.2022.024267
| Computers, Materials & Continua DOI:10.32604/cmc.2022.024267 | |
| Article |
Pandemic Analysis and Prediction of COVID-19 Using Gaussian Doubling Times
1Department of Information Technology, College of Computer, Qassim University, Buraydah, Saudi Arabia
2Department of Computer Science, University of Engineering and Technology, Taxila, Pakistan
3Department of Computer Science and Engineering, Oakland University, MI, USA
4Department of Computer and Electrical Engineering, University of Michigan, Dearborn, USA
*Corresponding Author: Saleh Albahli. Email: salbahli@qu.edu.sa
Received: 11 October 2021; Accepted: 24 December 2021
Abstract: COVID-19 has become a pandemic, with cases all over the world, with widespread disruption in some countries, such as Italy, US, India, South Korea, and Japan. Early and reliable detection of COVID-19 is mandatory to control the spread of infection. Moreover, prediction of COVID-19 spread in near future is also crucial to better plan for the disease control. For this purpose, we proposed a robust framework for the analysis, prediction, and detection of COVID-19. We make reliable estimates on key pandemic parameters and make predictions on the point of inflection and possible washout time for various countries around the world. The estimates, analysis and predictions are based on the data gathered from Johns Hopkins Center during the time span of April 21 to June 27, 2020. We use the normal distribution for simple and quick predictions of the coronavirus pandemic model and estimate the parameters of Gaussian curves using the least square parameter curve fitting for several countries in different continents. The predictions rely on the possible outcomes of Gaussian time evolution with the central limit theorem of statistics the predictions to be well justified. The parameters of Gaussian distribution, i.e., maximum time and width, are determined through a statistical χ2-fit for the purpose of doubling times after April 21, 2020. For COVID-19 detection, we proposed a novel method based on the Histogram of Oriented Gradients (HOG) and CNN in multi-class classification scenario i.e., Normal, COVID-19, viral pneumonia etc. Experimental results show the effectiveness of our framework for reliable prediction and detection of COVID-19.
Keywords: Prediction; coronavirus; time-series prediction; gaussian; mathematical model; pandemic spreading
The COVID-19 pandemic, which is also known as the new corona virus disease 2019, has been a focus of global health concerns since its emergence in December 2019. It is a potentially serious disease which can lead to death, with the current reported mortality rate of 2%. The acute onset of the disease might lead to death due to extensive respiratory system failure [1]. During January 2020, COVID-19 rapidly disseminated to many places of China, resulting in more than 7,000 infections by the end of the month. The total count of cases in the first calendar month of COVID-19 exceeded the SARS cases reported in 2002–2003, indicating that this new virus can transmit more rapidly than the SARS virus. The early prediction of COVID-19 may be helpful for states to provide appropriate recommendations and take necessary measures to prevent boosting of the infection rate when healthcare systems become saturated [2].
As of early March 2020, the total number of infections worldwide reached 97,000 cases, with a total of 3,400 deaths [2]. The World Health Organization (WHO) declared the virus outbreak as a pandemic on March 11th and defined the COVID-19 occurrence as a Public Health Emergency International Concern (PHEIC) [3] when the virus had been transmitted to 114 countries, including the United States [3], Thailand [4], South Korea [5], and Japan [6]. A total of 118,000 people were infected and 4,300 people had died [3]. Later on, it was reported that up to 32% of the COVID-19 cases carried a risk of critical consequences [7,8]. In addition, an unexpected death rate of 61.5% in serious infected cases was recorded, with the observation that the mortality rate was correlated with age, as well as patients with concomitant diseases [2]. Caring for the infected people and the seriousness of their cases created significant demands for medical care that led to the straining of hospitals and medical services worldwide.
Strict implementation of social-distancing measures is considered to be a primary step towards interrupting the spread of the pandemic. In early March 2020, mandatory lockdowns were imposed in various countries around the world, with charges and fines for people who did not follow the prescribed Standard Operating Procedures (SOPs) [9]. Common measures for social-distancing were imposed around the world, including closure of educational institutions and businesses which were considered non-essential, to prevent public gatherings and crowdy events, limiting meetings to online platforms, etc.
Several models have been proposed for predicting infectious diseases which spread similarly to the corona virus. Recently, the susceptible-infected-removed (SIR) model [10,11] was used to estimate the spread and mortality rate of COVID-19. Different versions of these models seem to be either so simple that they cannot produce accurate predictions or are very difficult to understand. Predictions of specific features of COVID-19, such as the maximum number of cases, mortality rate in a day or predicting the peak number, time and date for newly extreme sick individuals per day (SSPs) are considered to be of vital importance for every country in world, particularly those which are at the beginning of exponential growth. In particular, rapid and reliable predictions of the coronavirus pandemic are vital for policymakers to improve their monitoring of the disease trend and to take proper measures to avoid scarcity of life-saving resources in hospitals and throughout the healthcare system. To have an influence on the development of infectious disease models, this article presents the development and use of a Gaussian Model (GM) as a useful, easy and successful explanation of deaths caused by the COVID-19 pandemic over time, as well as recent studies in the United States [12] and Germany [13]. In contrast to earlier research, we prefer to employ the informed regular death rates logarithm [14] as tested input data, as an alternative to cumulative infections, and we also present the gaussian doubling times principle as a measure of the rate of increase [15]. Gaussian distribution function analysis plays an instrumental role in resolving numerous glitches in plasma kinetic theory, called drift-maxwellian [16] or counter streaming bi-maxwellian [17] velocity distribution functions. These terms are referred to as statistical physics or plasma physics.
Early and accurate COVID-19 detection is vital to control the spread of COVID-19 among the people. After the confirmed cases of COVID-19 in vaccinated people, it has become more important to detect the infected people so they can quarantine themselves and control the spread of disease. PT-PCR is considered to be the standard technique for COVID-19 detection, but it generates a large number of false negatives due to numerous reasons such as disease stages, method of gathering specimens, methodological drawbacks, which delay the detection and control. The specificity and sensitivity of PT-PCR for COVID-19 detection have been discouraged in numerous studies [18–21]. Therefore, we need an alternative automated diagnostic technique that can prevent the fast spread of COVID-19 [22].
Apart from the medical effects the COVID-19 has, the world experienced an economic meltdown when the pandemic broke out. Till today, the world is still found it to recover from these adverse effects which lead to compulsory virtual meetings, reduction of interactions and reduction of business opportunities. Medically, COVID-19 posed the greatest threat in that the world was faced with a dangerous disaster which led to a lot of commotion and death. This led us to finding a way to detect this COVID-19 so as to ensure this outbreak doesn't happen again, this experiment is also aimed at finding a way to control such disasters in the future. Catching COVID-19 at its early stage is crucial to recovery because once it gets to a certain stage, the effects are deadly and irreversible, detecting it early will help the patient and the specialists take the necessary actions to mitigate and cure it.
Several governments including China, South Korea, Bahrain and United Arab Emirates, imposed some of the strictest measures such as imposing curfews and suspended air transport based on the data gotten from Johns Hopkins University data. This goes to show the relevance and importance of setting up artificial intelligence as a shield for COVID-19 across the world.
To address the challenges associated with the prediction and detection of COVID-19 at early stage, we proposed a robust framework for reliable analysis, prediction and detection of COVID-19. The proposed system is able to successfully detect the viral pneumonia, and other infections along with the COVID-19. The major contributions of this research work are as under:
• We employed gaussian doubling times to better analyze and predict the COVID-19 worldwide.
• We proposed a robust COVID-19 detection method by employing the HOG and CNN.
• Our COVID-19 detection method is capable of detecting the normal, COVID-19, viral pneumonia and other lung infected patients.
• Detailed experiments were performed to demonstrate the efficacy of the proposed framework for COVID-19 detection and prediction.
The application of deep learning algorithms has been exponentially increasing in numerous fields such as cancer detection [23–26], tumors detection [27–31], medicines [32–35], and heart diseases [24,25]. Research community has also explored various deep learning techniques [36–41] to detect COVID-19 using lung x-rays. In [32], COVID-Net a CNN-based model was designed to detect COVID-19 patients. An accuracy of 83.3% was yielded. In [37], various deep learning pre-trained models such as ResNet-50, VGG-19, GoogleNet, AlexNet were used to detect COVID-19. ResNet-50 performed well among the other pre-trained models. However, small amount of data was used, and the model was not evaluated in multi-class environment such as three classes (COVID-19, viral pneumonia, bacterial pneumonia) to detect COVID-19. In [34], a deep learning model based on xception neural network was design to diagnose the COVID-19 patients. An accuracy of 89.6% was obtained. In [22], three CNN models such as Inception-v3, Inception-ResNet-v2, and ResNet-50 were employed using 5-fold cross validation to detect COVID-19 patients. 100 X-ray images were used, half of which belonged to healthy persons and half belonged to COVID-19 patients. RestNet-50 yielded maximum accuracy of 98%. Similarly, in [39], eleven deep learning algorithms were employed such as DenseNet-201, XceptionNet, Inception-ResNet-v2, Inception-v3, ResNet-101, ResNet-50, ResNet-18, GoogleNet, VGG16, VGG19, and AlexNet to detect COVID-19 patients. Two datasets were used comprising of 50 and 266 images, respectively. An accuracy of 95.38% was obtained using the ResNet-50 and SVM. In [40], a framework was designed named COVIDX-Net, which can help the radiologists to detect COVID-19 patients using x-rays images. Dataset comprising of 50 images was used for experiments. Dataset was divided into two classes such as COVID-19 and normal. Each class has 25, 25 images and were resized to 224 × 224 pixels. Seven deep learning models such as ResNet-v2, modified VGG19, DenseNet, Inception-v3, Xception, Inception, and MobileNet were employed to design COVIDX-Net. Among the seven deep learning models, VGG19 performed the best and yielded the F1-score of 91% for Covid-19 patients. In [41], multi-level thresholding and SVM based COVID-19 detection framework was designed using the x-ray images and achieved an accuracy of 97.48% on a small dataset of 40 images.
The limitation of the existing works is the same for all, the problem of inadequate and imbalanced dataset due to the fact that COVID-19 came into existence is the ending of 2019 and so there have not been enough dataset gather to enable researcher create effective deep learning models. Deep learning models require large amounts of data to function as expected so until much more data is gotten, most experimental works will always be in the improving stage.
The tasks of creating a model that uses recorded data to detect the presence of COVID-19 is one that is necessary today, considering how the pandemic caused chaos. However, there were certain areas which served as hinderances to the execution of the task thereby threatening the efficiency of the system. These are discussed below:
• Inadequate dataset: considering the fact that the COVID-19 happened barely a year and a half ago, the dataset gathered is relatively small. This constitutes a problem because deep learning models require an enormous amount of data to yield effective results with high accuracy.
• Imbalanced dataset: even the gathered dataset contains parts that are not relevant to the task at hand, this leads to outliers which produce overfitting or underfitting.
This section presents a detailed overview of the models for COVID-19 prediction globally. Moreover, we have also discussed the details of our deep learning based COVID-19 detection method.
Data was gathered via real-time enquiry from Johns Hopkins University data and other sources, such as the world health organization, in order to examine and predict the coronavirus pandemic for the worst affected countries. Nowadays, all COVID-19 data are collected from different sources: online news reports, media reports, government reports, etc. It turns out to be very important to take the data from all sources, organize it and examine it to get a full and complete picture of the pandemic and its significances.
2.2 Formulation of Mathematical Model
Earlier literature and data [1] show that the spread of pandemics in terms of the number of infected people increases exponentially at first, followed by a peak and rapid decrease [42]. Thus, we adopt a Gaussian curve to model the evolution of the pandemic. If Itdenotes the number of infected people per day t, then it is modelled by the gaussian curve in Eq. (1)
where I0 is the maximum number of cases per day-on-day E, and Δ is the standard deviation of the curve.
The rate of change of infections can be derived by differentiating I(t) with respect to t. Thus, the relative rate of change P(t) is given by Eq. (2)
2.3 Expression for Doubling Time
In terms of doubling time D, the observed cases per day can be expressed as follows:
The relative change can be expressed similarly, as follows:
Using the results of Eqs. (2) and (4), it can be seen that the doubling time in terms of E and Δ can be expressed as:
Then at t = 0,
Thus, to get the Gaussian equation, we need to find the doubling time, through which we can find the values of E and Δ.
The doubling time is calculated by using expression (4):
where C(X) is the number of cases on X Day, and T is the rolling window. A rolling window of 7 was used for this paper.
2.4 Doubling Time for Global Cases
The doubling rate for global cases from 21th April, 2021 is shown in Fig. 1. This date was chosen as the starting point because this was when reliable data was available onward as more and more countries make the data public. The observation was carried out up until 27th June, 2021. The assumed error on the observed data was 20% which denotes the percentage of the data that was wrongly recorded or inaccurate. The dataset is described in the Section 2.1. To get the value of E, we look at the observed doubling rate when
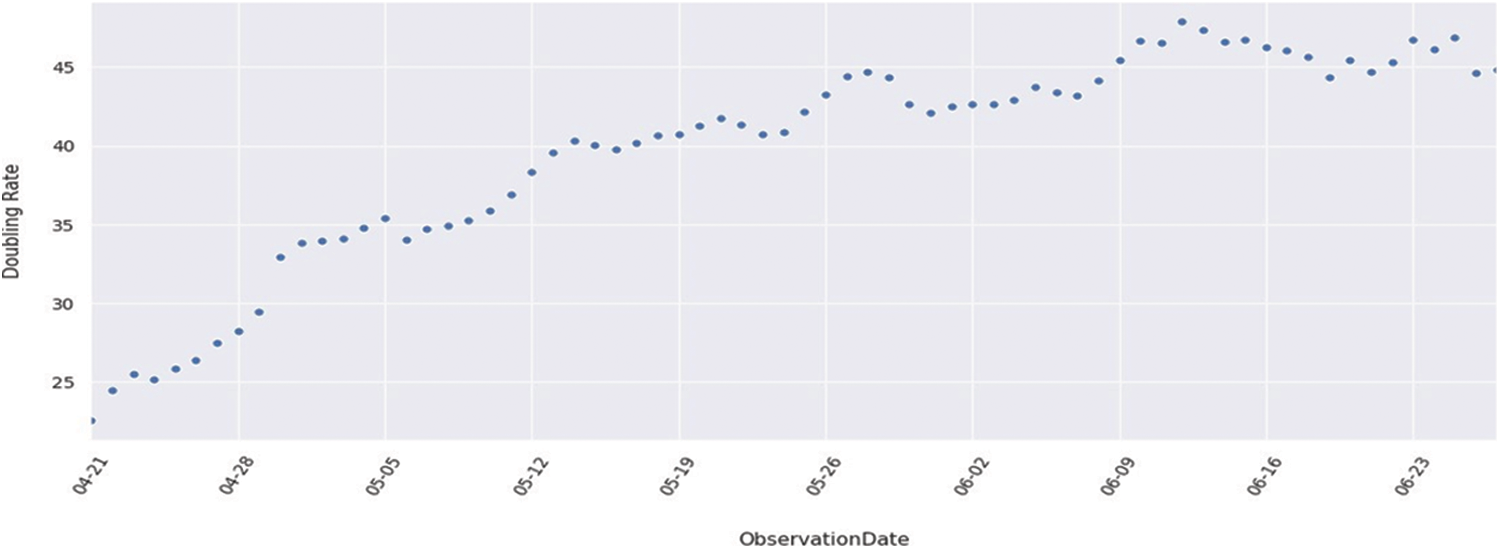
Figure 1: Doubling rate of global cases
This is the Gaussian model global doubling rate. Fig. 2 shows the doubling rate from 21 April 2020 to 27 June 2020, with error bars with 20% error.
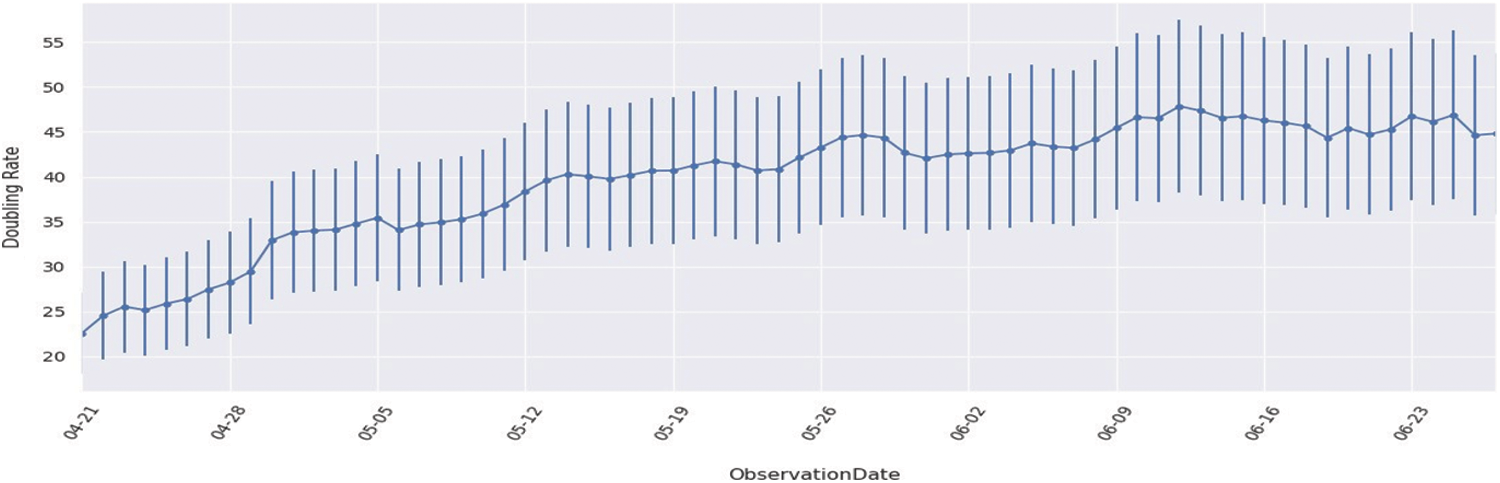
Figure 2: Doubling rates of global cases
3.1 Gaussian Predictive Analysis Method
The main idea of predictive analysis is to imagine, examine and predict the statistical behavior of worldwide COVID-19 datasets, which can be helpful to understand the pandemic's development around the globe. Gaussian predictive analysis will help to predict how coronavirus may grow in countries with severe confirmed cases and infected people with casualties. Two methods that have been implemented for analysis of data gathered through the above-mentioned resources will be discussed in this paper. The first is a simple, Python-based, data analysis library, known as Facebook prophet library, which is open-source and available in python: it is adopted to provide predictive analysis of the data.
The second method that is used for this purpose is a parameterized model from different countries, using the gaussian kernel method. A gaussian-based parameterized model is developed with the help of least-squares minimization on the data available till June 27, 2020. Assuming that the tuple (
Here,
where a is considered to be the peak of the predictive curve, while
We used a standard dataset COVID-19 CHEST X-RAY DATABASE for experimentation purpose that is publicly available [40]. This dataset was developed by a team of researchers from various countries such as University of Dhaka, Bangladesh, university of Qatar, Doha, Qatar, Malaysia, and Pakistan with their collaborators (medical doctors). Dataset comprises of images belong to four classes such as viral pneumonia patients, normal persons, lung opacity (non-Covid infections), and COVID-19 patients. We used the second version of this dataset, which has 3,616 images of COVID-19 patients, 6012 of lung opacity, 10,192 of normal persons, and 1,345 of viral pneumonia patients. All the images of the dataset are in portable network graphic (PNG) format with the resolution of 299 × 299.
3.3.1 Histogram of Oriented Gradients (HOG)
Histogram of oriented gradients (HOG) algorithm was designed in [43] to represent an image based on the gradient direction. HOG is a feature descriptor used in computer vision and image processing to detect objects and image classification. The main idea of the HOG is to compute the histogram of oriented gradient in patches of local images. As shown in Fig. 3 and 4 an input image is divided into different small, and connected regions called blocks. Blocks are further divided into cells and histogram of gradient directions. We computed the HOG features as follow. Initially, we divided the image patch of the sample (48 × 48 pixels) into small cells of equal size (8 × 8 pixels) and then computed the gradient histogram of the pixels in each cell by dividing the orientations into 9 bins. Instead of using the gradient of each pixel as a feature, computation of nine bins histogram for each cell makes the representation more robust and compact to noise. The gradient components of x-ray images were computed using 1-dim centered technique in both directions such as vertical and horizontal. We computed gradient components as follows:
where H(x, y) is the value of the pixel,
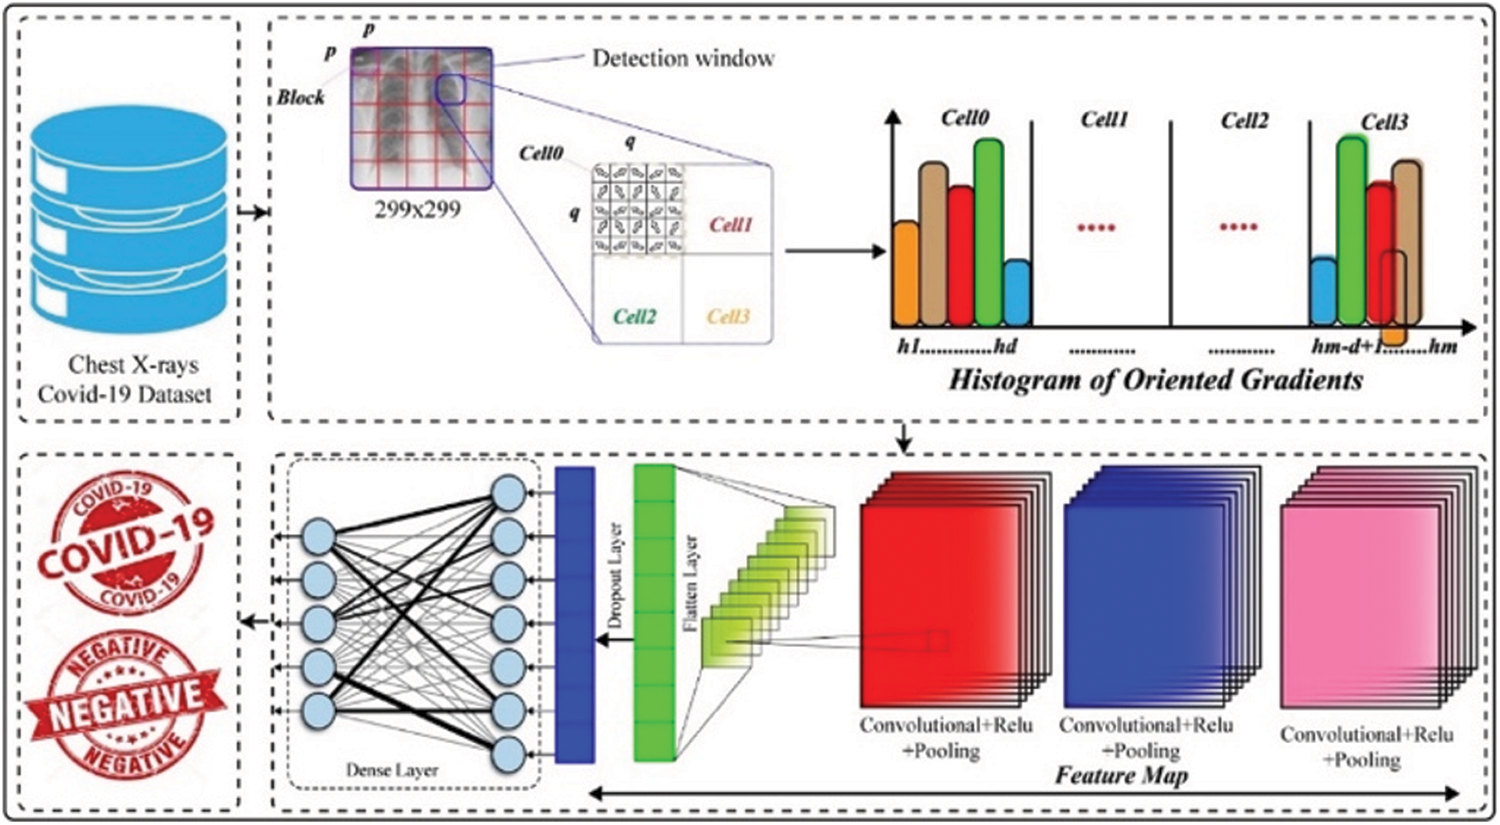
Figure 3: Framework of the proposed system
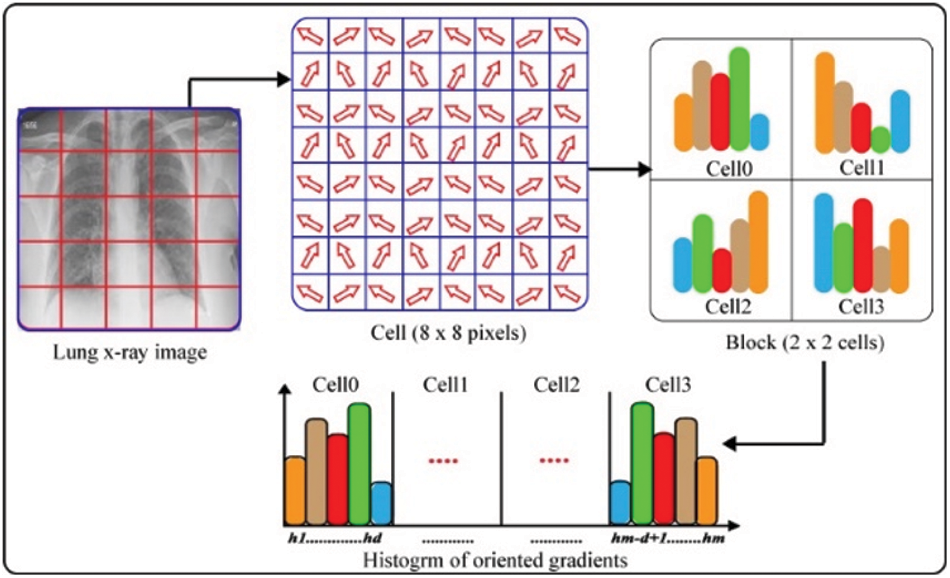
Figure 4: Histogram of oriented gradients
The range of orientation is (0°–180°) for gradients. We computed the magnitude and orientation of gradients for each pixel in cells. Finally, we computed a normalized histogram for each cell and concatenated all the histograms to represent a block. The set of block histograms represent the HOG feature descriptor of the lung x-ray image. The advantage of HOG feature descriptor is that it preserves the spatial information of an image.
3.3.2 Convolutional Neural Networks (CNN)
CNNs are popular due to their enhanced performance for image classification. Convolution layers of CNN along with various filters such as 3 × 3, 5 × 5, 7 × 7, etc., help in extracting the temporal and spatial features from an image. These layers have weight sharing method that helps in minimizing the computation efforts [44]. We fed the HOG representation of size 48 × 48 into the CNN. Our CNN model comprises of three different building blocks such as convolutional layers, max-pooling layers (sub-sampling) is to down sample an image and minimize the dimension, henceforth, reduce the computational efforts and costs, and at the end dense layer. There are three convolutional layers, and each layer is followed by max-pooling layer. Initial two convolutional layers have 5 × 5 kernels while the third layer has 3 × 3 kernel. All the three convolutional layers are followed by max-pooling layers of 2 × 2. We added a dense layer, which is followed by a drop out layer of 0.5 to reduce overfitting. Finally, we used a dense layer for classification purpose for two classes, three classes, and four classes. The proposed architectural overview of our CNN model is shown in the Fig. 5.
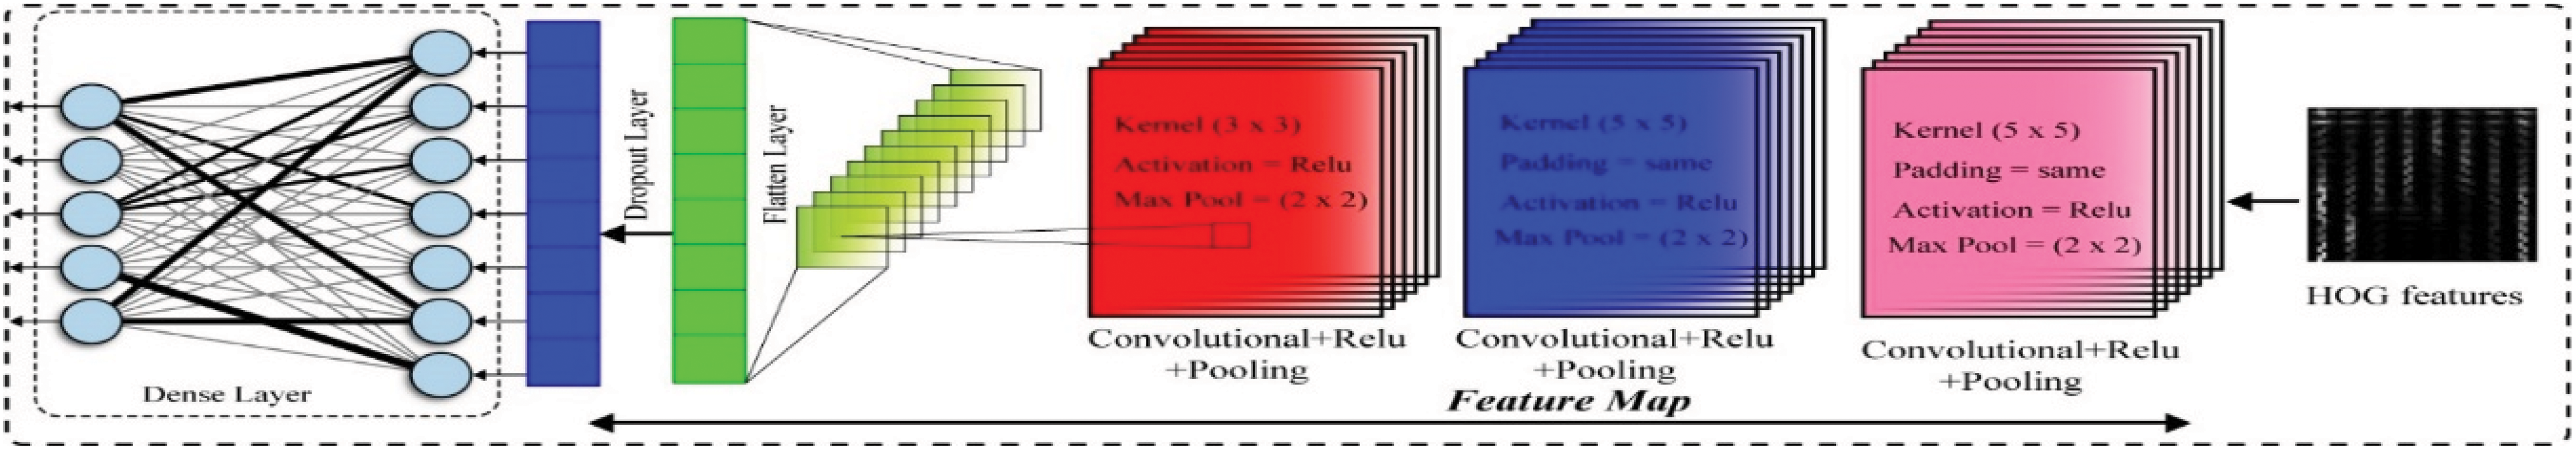
Figure 5: Architecture of the convolutional neural network
This section provides the results and discussion of different experiments conducted to measure the performance of our method.
4.1 Detection Performance of COVID-19
We designed a multistage experiment to detect COVID-19 using lung x-ray images for different classes such as two classes i.e., Normal vs. COVID-19, three classes i.e., Normal, COVID-19, and Viral Pneumonia, four classes i.e., Normal, COVID-19, Viral Pneumonia, and Lung opacity. We employed HOG feature descriptor and feed HOG features into CNN to detect COVID-19 patients, viral pneumonia, and non-COVID infection of lungs (Lung opacity).
In initial stage of the experiment, we measured the performance of the proposed system on two classes such as normal and COVID-19 to detect COVID-19 patients. For this purpose, we used 10,192 lung x-ray images of normal persons and 3616 lung x-ray images of COVID-19 to discriminate COVID-19 patient and normal person. Initially, we split the data into 80/20 and employed HOG feature descriptor on both the training and testing sets. The training set comprises of 80% (11,047 images) while the testing set comprises of 20% (2761 images) data. As shown in Fig. 6, we achieved an accuracy of 95.40%, precision of 96.89%, recall of 96.42%, and F1-score of 96.65%. We conclude from the results that our method is effective to detect COVID-19 patients and can be used for reliably as the precision rate is higher than PT-PCR tests.
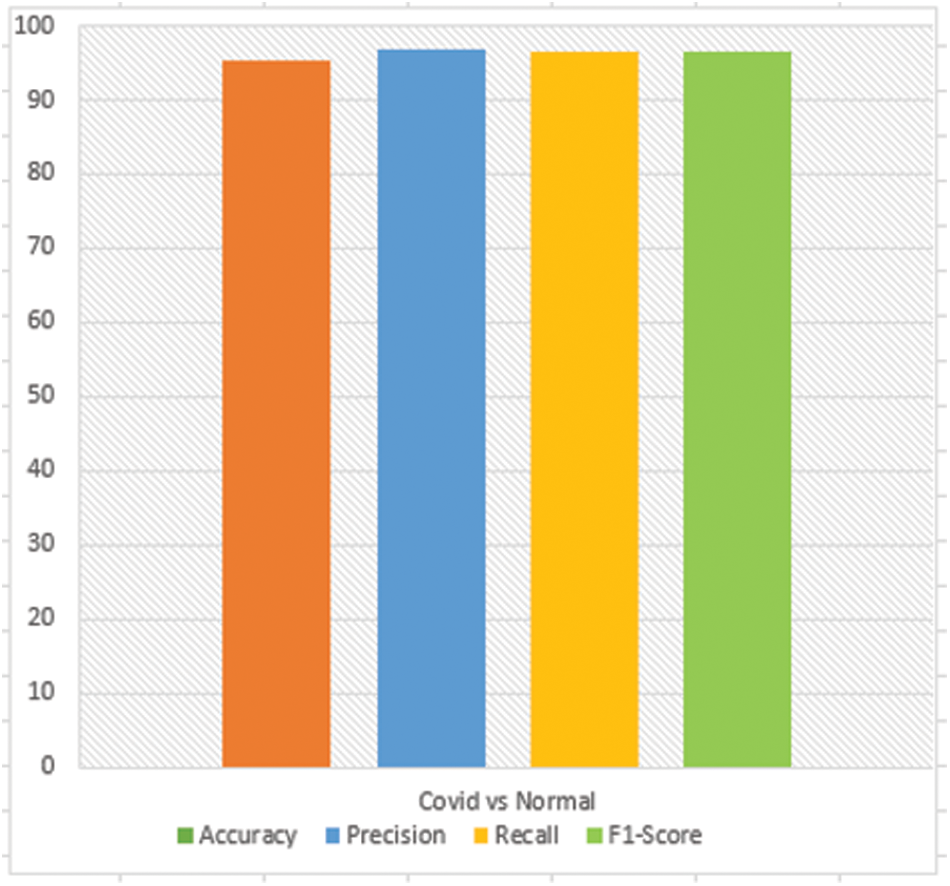
Figure 6: COVID vs. normal
In second stage of the experiment, we measured the performance of the proposed system on three classes such as normal, COVID-19, and viral pneumonia to distinguish viral pneumonia, COVID-19, and healthy person. For this, we used 1345, 10192, and 3,616 images of viral pneumonia, normal, and COVID-19, respectively. We split the data into two sets such as training set and testing set. We used 80% (12,122 images) data of three classes for training the model and 20% (3,031 images) data of three classes for testing the model. We extracted HOG features from the three classes and fed to the CNN to discriminate Normal, COVID-19 patients, and Viral pneumonia patients. Fig. 7 shows the results obtained of the proposed system. Our method yielded an accuracy of 91.55%, precision of 88.44%, recall of 90.19%, and F1-score of 89.31% for the three classes. We can conclude from the results that our method has successfully discriminated normal, COVID-19 patients, and viral pneumonia patients. Experimental results show the superiority of our method to distinguish the healthy person, COVID-19, and viral pneumonia.
In third stage of the experiment, we measured the performance of the proposed system on four classes such as normal, COVID-19, viral pneumonia, and non-Covid infection of the lungs (lung opacity) to show the robustness of our method for multi-class problem. For this, we used the same number of images that was used for experiments of two and three classes of normal, COVID-19 patients, and viral pneumonia patients. We added 6,012 lung x-ray images of other infections of lungs to training and testing set. We split the data of four classes into 80/20 and used 80% (16,932 images) for training while 20% (4,233 images) for testing purpose. We extracted HOG features from both the training and testing set, which we fed to the CNN to distinguish the lung opacity (other infections), normal, COVID-19, and viral pneumonia patients. Fig. 8 illustrates the results of the proposed method on multiclass problem. We can observe that our method achieved an accuracy of 85.41%, precision of 84.93%, recall of 85.49%, and F1-score 85.16%, which indicates the reliability of our method for accurate classification of COVID-19, viral pneumonia and other infections in multiclass environment.
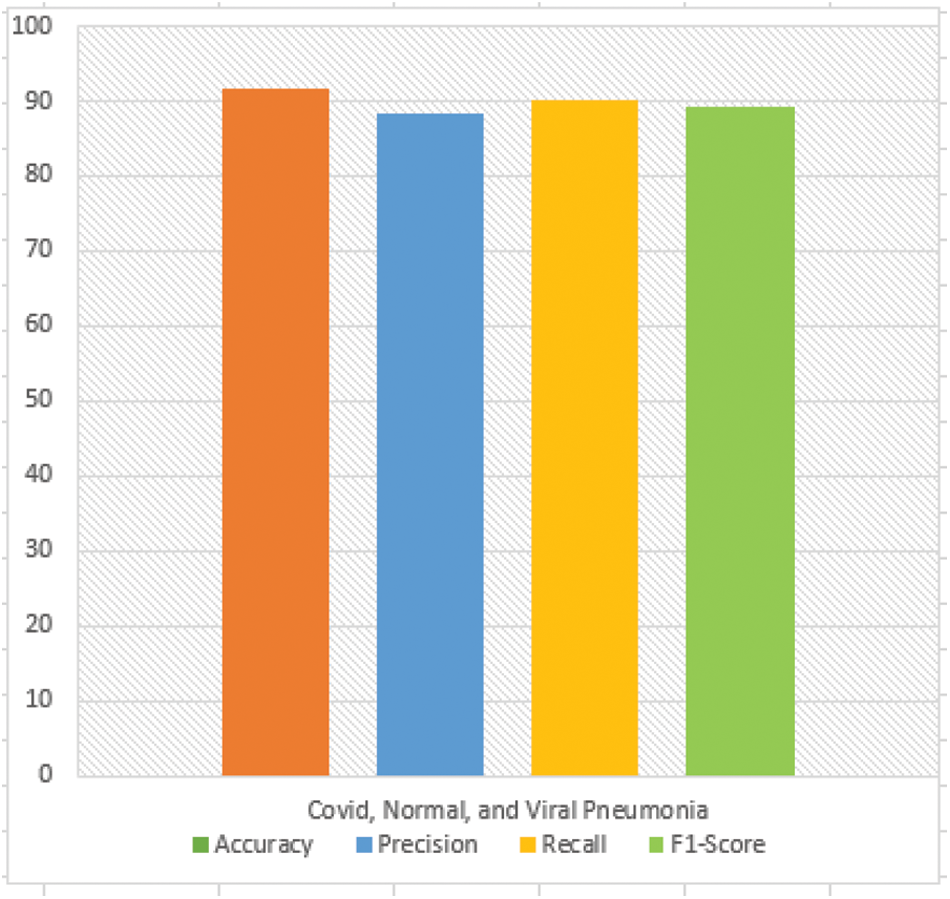
Figure 7: Normal, COVID, and viral pneumonia
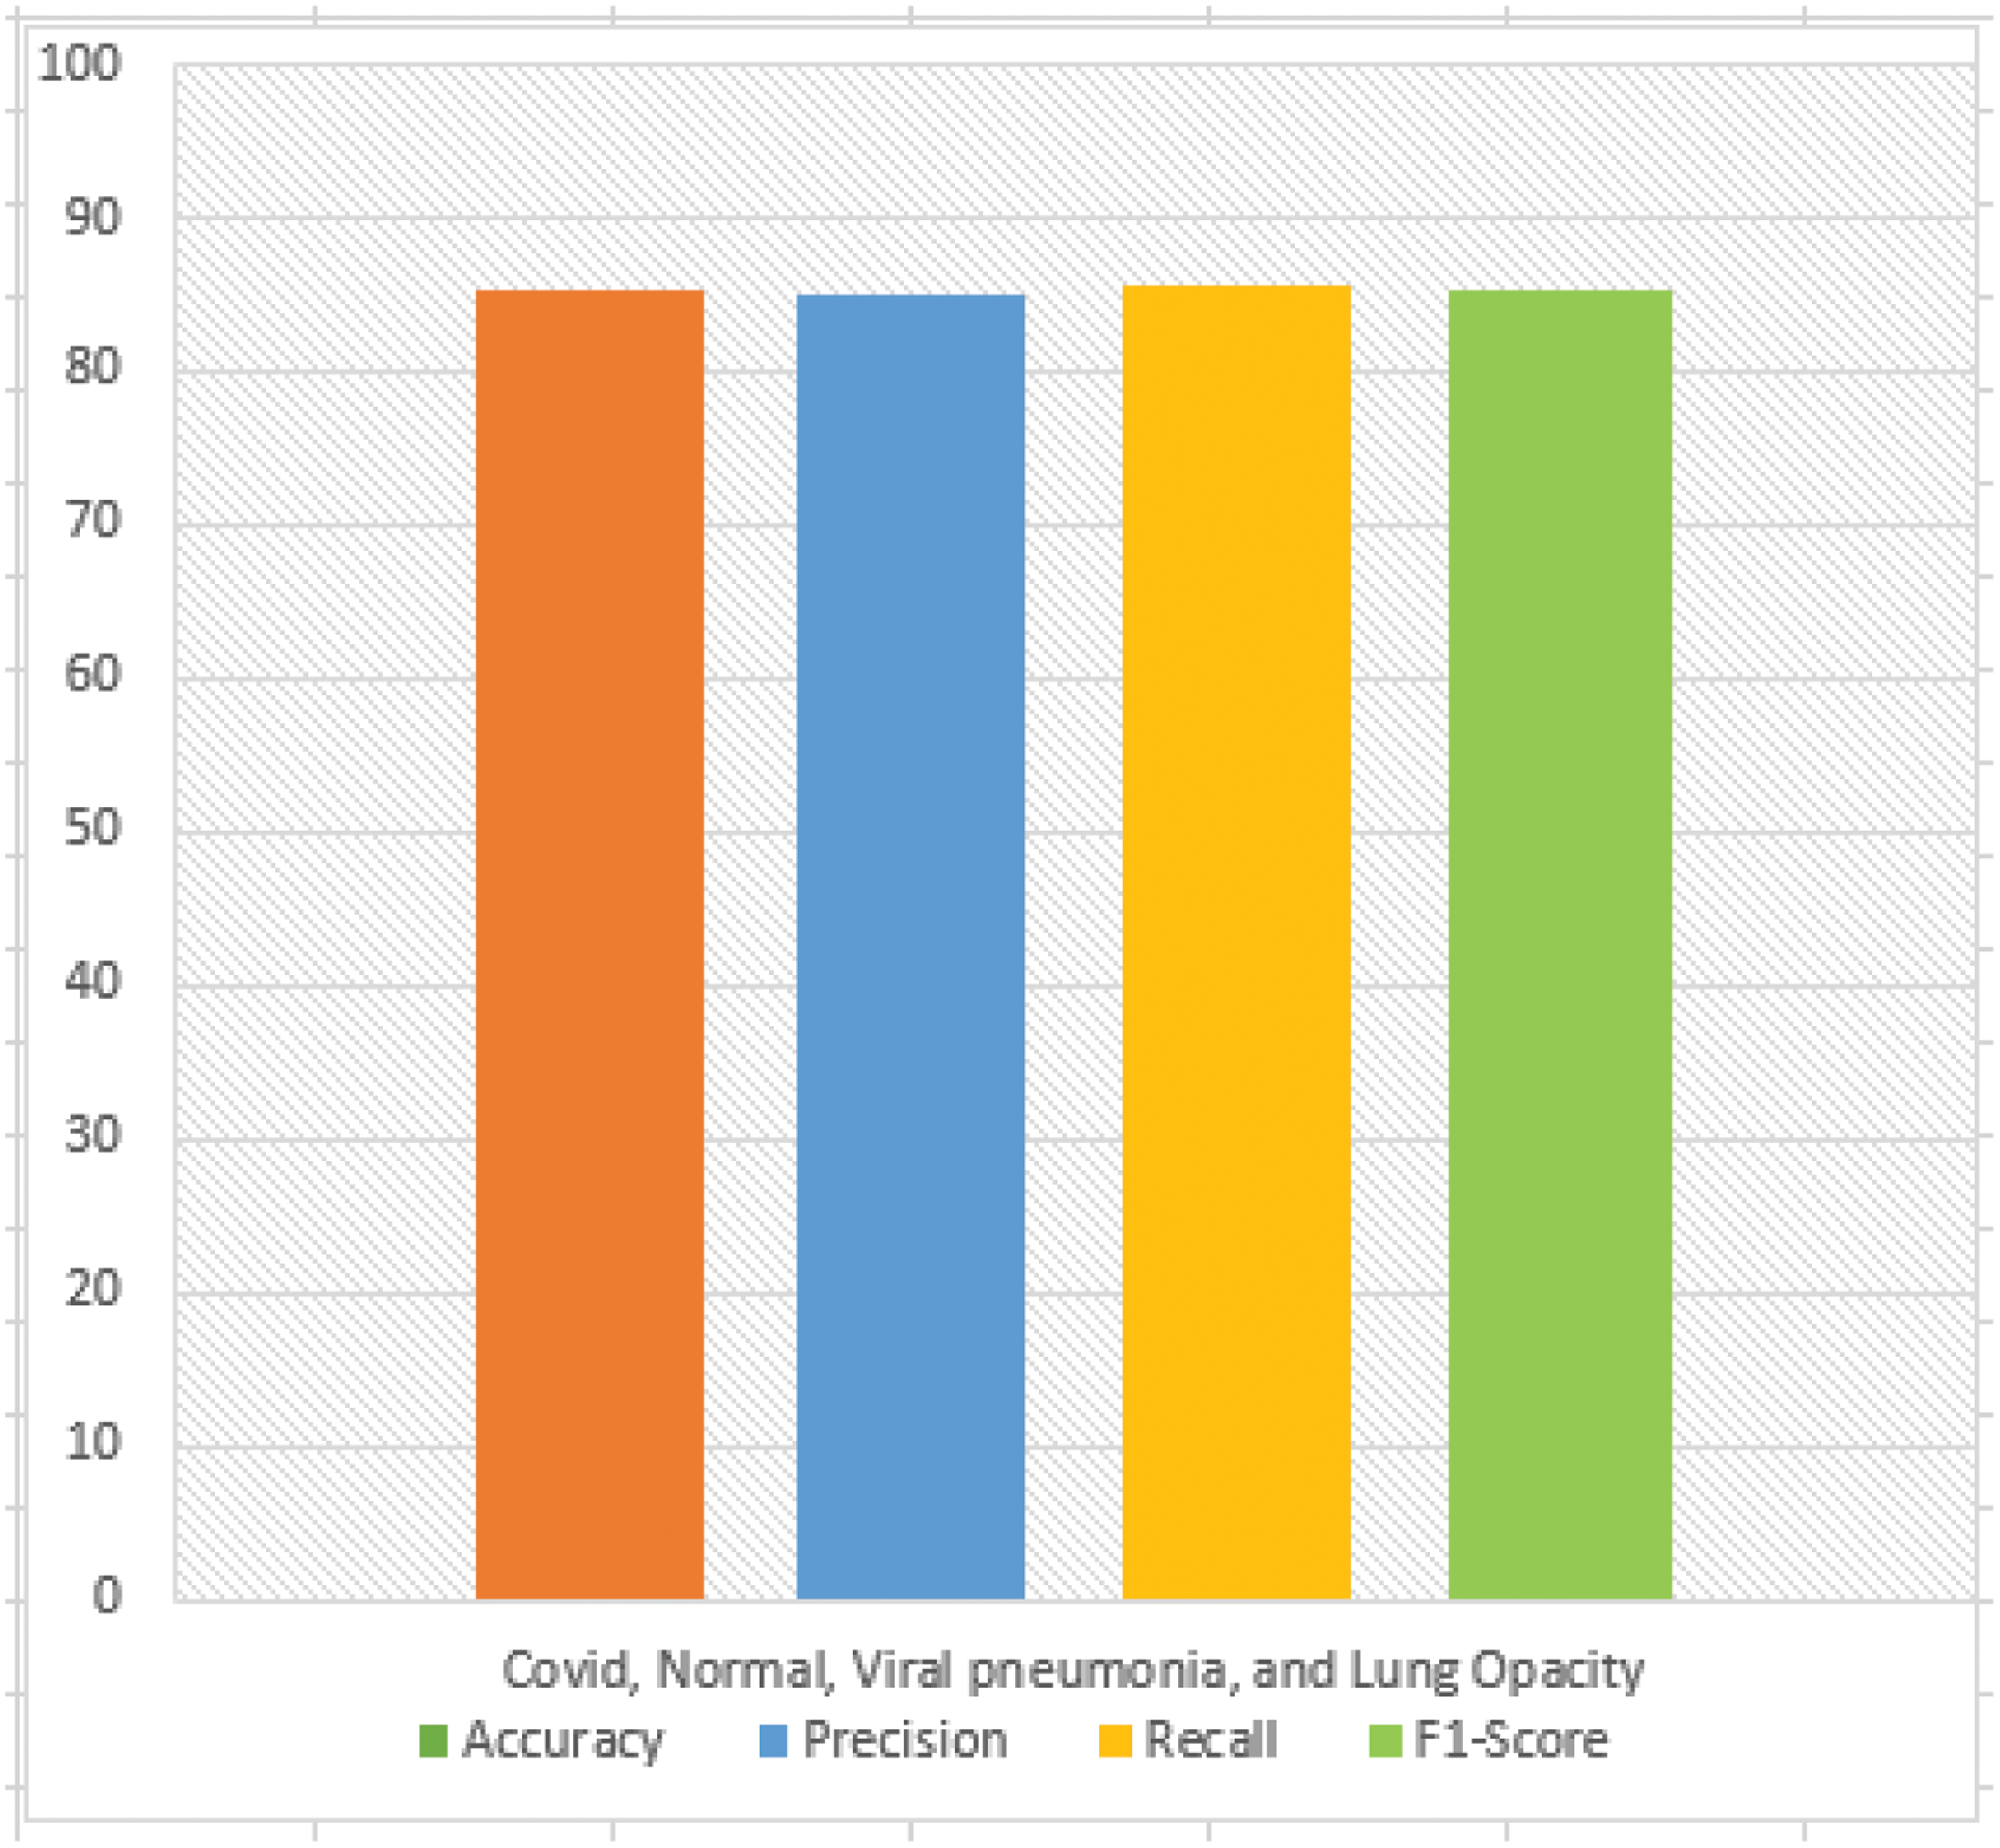
Figure 8: COVID, normal, viral pneumonia, and lung opacity
The confusion matrix is designed to represent the classification performance of our model in terms of incorrect and correct projection for each class of the dataset. Keeping in mind these facts, we also designed multi-stage experiment for two, three, and four classes of COVID-19 CHEST X-RAY DATABASE to better visualize the evaluation of the proposed system.
In initial stage of the experiment, we have designed a confusion matrix to show performance of the proposed system for two classes i.e., COVID-19 and Normal person as shown in Fig. 9. From the Fig. 9, we observe that the proposed system detected 64 healthy persons as COVID-19 patients out of 6,96 while 74 healthy people as COVID-19 patients out of 2,068. The FP rate of proposed system is 3.11% while the FN rate is 3.58%. This precision and recall rates show the effectiveness of our method to accurately detect COVID-19 patients. Experimental results show that the proposed method can reliably be used over the PT-PCR tests as these tests have lower precision rate ranges from 80%–85%.
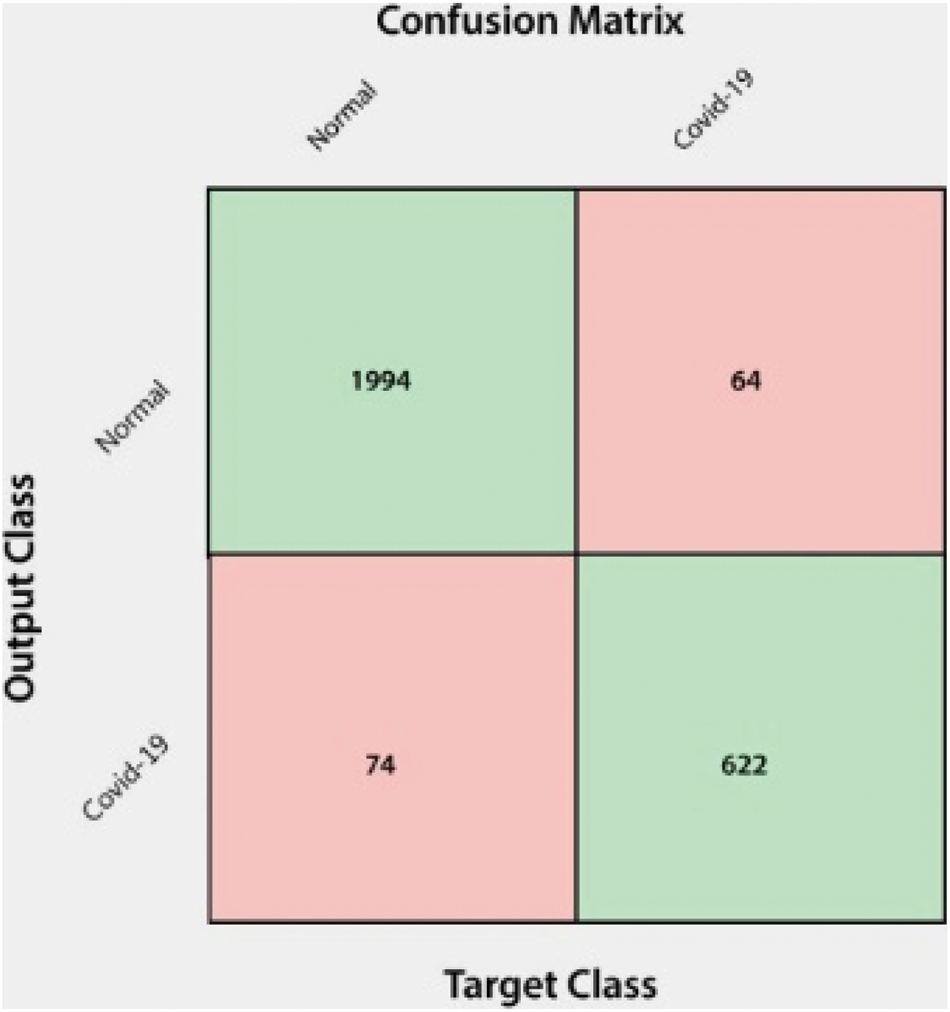
Figure 9: Confusion matrix for two classes
In the second stage of this experiment, we designed a confusion matrix to visualize the performance of our system on multiclass problem such as for three classes i.e., Normal persons, COVID-19 patients, and Viral pneumonia patients as shown in the Fig. 10. From the confusion matrix for three classes, we observe that there are 46 FP out of 1,039, 68 FP out of 341, and 14 FP out of 136 for normal persons, COVID-19 patients, and Viral pneumonia patients, respectively. There are 73 FN out of 1,066, 43 FN out of 315, and 12 FN out of 134 for normal, COVID-19 patients, and Viral pneumonia patients, respectively. The FP rates of our system are 4.42%, 19.94%, and 10.29% for normal, COVID-19 patients, and Viral pneumonia patients, respectively while the FN rates of the proposed system are 6.84%, 13.65%, and 8.95%, respectively. Overall, our system achieved FP rate of 11.55% while FN rate of 9.81%. These experimental results show the superiority of the proposed system for effective detection of normal persons, COVID-19 patients, and viral pneumonia patients.
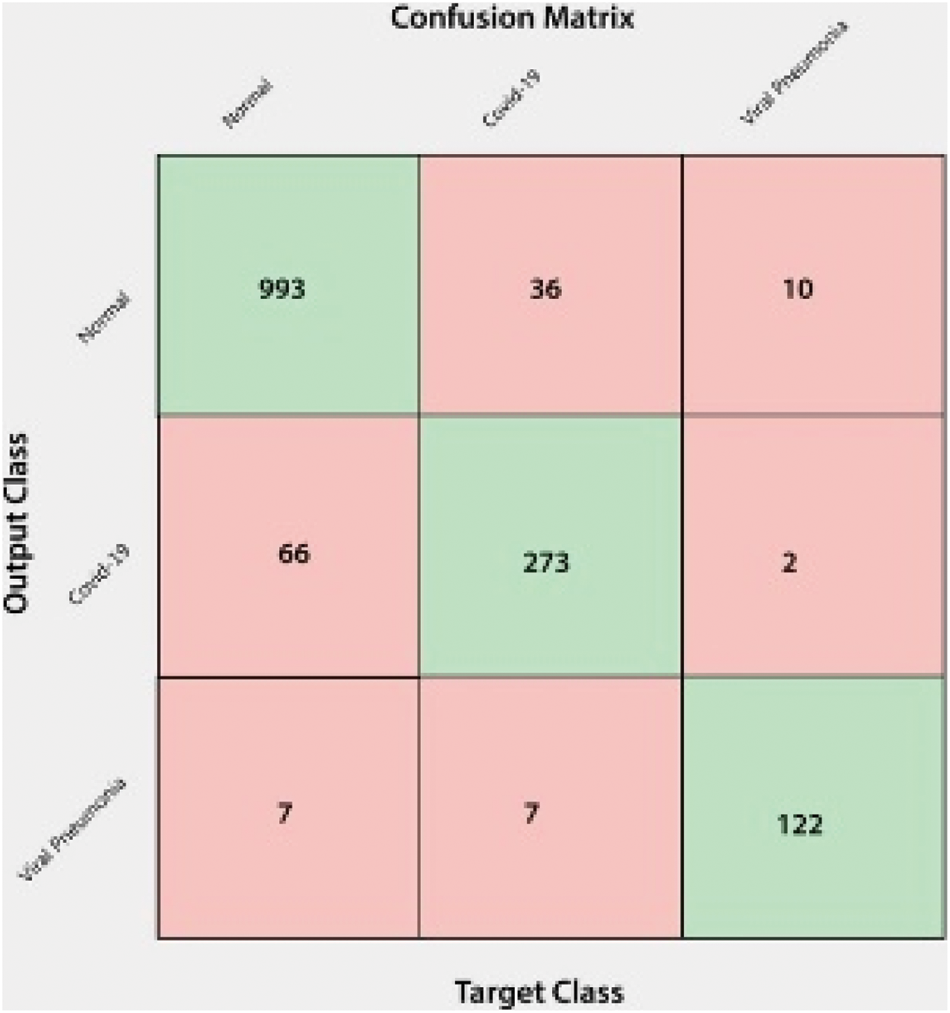
Figure 10: Confusion matrix for three classes
In the last stage of this experiment, we designed a confusion matrix for four classes such as normal, COVID-19 patients, Viral pneumonia patients, lung opacity and to visualize the performance of the proposed system to detect COVID-19 patients in multiclass problem as shown in Fig. 11. From the Fig. 11, we observe that there are total 133 FP out of 601, 105 FP out of 1,041, 55 FP out of 364, 16 FP out 125 of while 89 FN out of 557, 133 FN out of 1,056, 75 FN out of 384, and 12 FN out of 121 for normal persons, COVID-19 patients, viral pneumonia patients, and non-COVID-19 lungs infection. The FP rates of the proposed system are 22.12%, 10.08%, 15.10%, and 12.8% while the FN rates are 15.97%, 12.59%, 19.53%, and 9.91% for normal persons, COVID-19 patients, viral pneumonia, and non-COVID infection, respectively. Our system incorrectly classified 90 COVID-19 patients, 40 viral pneumonia patients, and 3 non-COVID-19 infections as normal persons while 64 normal, 32 viral pneumonia patients, and 9 non-COVID-19 infections as COVID-19 patients. The system also misclassified 20 normal persons, 35 COVID-19 patients, and zero non-COVID-19 infections as viral pneumonia patients while 5 normal, 8 COVID-19, and 3 viral pneumonia patients as non-Covid infections.
The fatal COVID-19 pandemic expanded to over 210 countries, producing over 3 million infected persons and 230,000 fatalities around the globe by the end of April, 2020 (with a few countries of Asia, Europe and, now, the US suffering the most). This work is based on the development, investigation and simulation of a novel approach for facilitating in-depth analysis of the spreading and overcoming of COVID-19 in the environment.
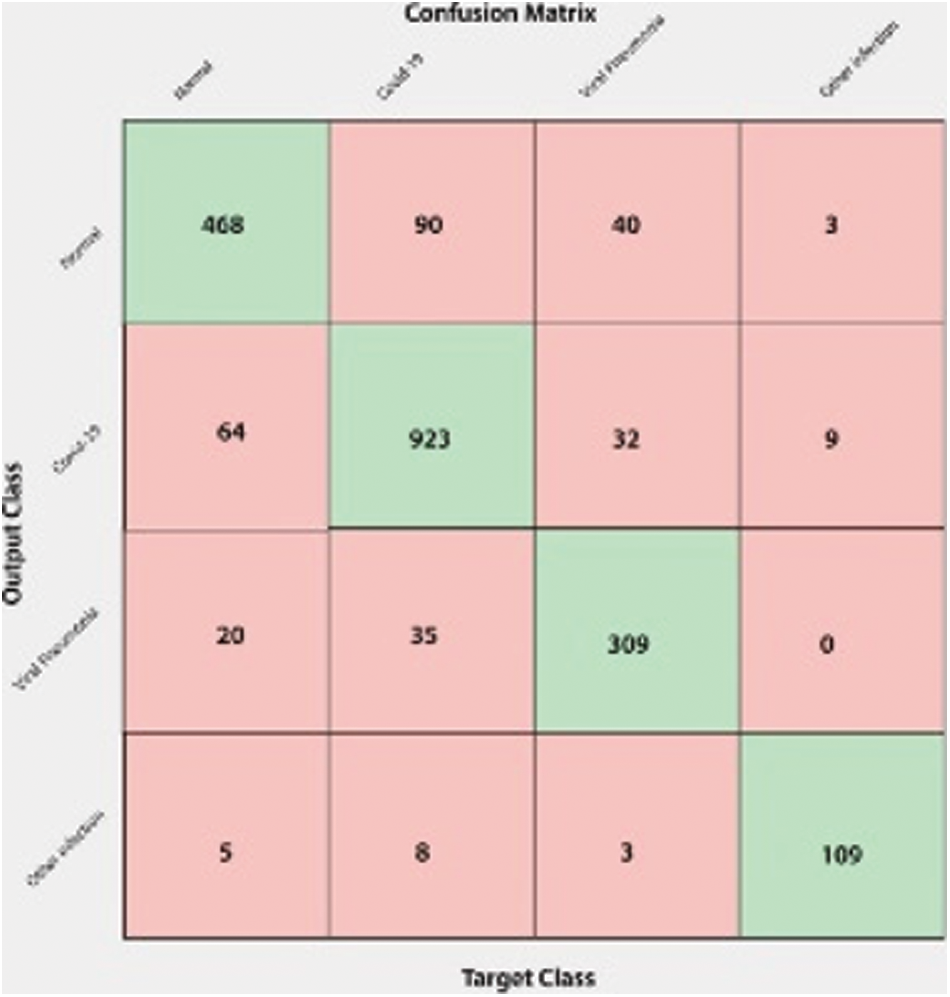
Figure 11: Confusion matrix for four classes
The proposed gaussian model allows unpretentious predictions of the imminent progression of the COVID-19 sickness and we have presented a first indication that a gaussian model is intelligent enough to apprehend the time evolution of the day-to-day mortalities and infections per country. Suitable models present past data, as well as data from China. The proposed model is so adaptable that it can be replicated and practiced without thorough knowledge of epidemiology, statistics or programming languages. There are numerous countries not yet severely affected by COVID-19, which will likely vary over the coming weeks. Thus, the gaussian model may apply to such nations, as soon as adequate data is available. Using the formula presented here, interested readers are in the position to obtain estimates for the shape of the Gaussian curve for their country so that governments and public bodies may apply this model to compute further measures of interest, such as estimating the maximum quantity of respiratory machines required and the date of this maximum requirement. Predicting the time of extreme rush days for SSPs, the total number and distribution of SSPs may allow the administration and health agencies in these countries to enhance the management of disease waves by taking efficient, time-limited, drastic measures. Additionally, as our analysis shows here, the peak time of the virus wave varies between countries. Recognition of these peak times and related timeframes helps other countries to benefit those who reach the height of the tendency for a brief, predictable period with respiratory equipment and skilled medical staff at a slightly later time. We also expect to raise community awareness of the gaussian or sigmoidal complexity resulting from infections with COVID-19, parallel to the various recent deliberations on exponential functions.
Moreover, this paper has also presented a reliable framework for COVID-19 detection. We extracted HOG features from lung x-ray images and employed CNN for two classes i.e., COVID vs. Normal, three classes i.e., COVID-19 vs. Normal vs. Viral Pneumonia, and four classes i.e., COVID-19, Normal, Viral Pneumonia, and Lung opacity to detect COVID-19 patients. The higher precision rate shows the superiority and effectiveness of the proposed COVID detection system. Experimental results on all the classes signify that our method performed well and effectively detected the COVID-19 patients in two classes as well as in multiclass environment. In future, we aim to perform cross dataset experiments to show the generalizability and strength of the proposed system for COVID detection.
Acknowledgement: We would like to thank the Deanship of Scientific Research, Qassim University for covering the publication of this project.
Funding Statement: The authors received no specific funding for this study.
Conflicts of Interest: The authors declare that they have no conflicts of interest to report regarding the present study.
1. S. Albahli, “A deep neural network to distinguish covid-19 from other chest diseases using x-ray images,” Current Medical Imaging, vol. 17, no. 1, pp. 100–109, 2021. [Google Scholar]
2. World Health Organization, WHO Statement on the second meeting of the International Health Regulations. Emergency Committee Regarding the Outbreak of Novel Coronavirus (2019-nCoV). Geneva, Swiss. Accessed, 2020. [Online]. Available: https://www.who.int/news-room/detail/30-03-2020-statement-on-the-second-meeting-of-the-international-health-regulations-(2005)-emergency-committee-regarding-the-outbreak-of-novel-coronavirus-(2019-ncov). [Google Scholar]
3. Centers for disease control and prevention. CDC first travel-related case of 2019 novel coronavirus detected in United States. Accessed: March 27, 2020. [Online]. Available: https://www.cdc.gov/media/releases/2020/p0121-novel-coronavirus-travel-case.html. [Google Scholar]
4. World Health Organization, WHO novel coronavirus-Thailand (ex-China). Geneva, Swiss. Accessed: March 27, 2020. [Online]. Available: http://www.who.int/csr/don/27-march-2020-novel-coronavirus-thailand/en/. [Google Scholar]
5. World Health Organization, WHO novel coronavirus-republic of Korea (ex-China). Geneva, Swiss. Accessed: March 27, 2020. [Online]. Available: http://www.who.int/csr/don/27-march-2020-novel-coronavirus-republic-of-korea-ex-china/en/. [Google Scholar]
6. World Health Organization, WHO novel coronavirus-Japan (ex-China). Geneva, Swiss. Accessed: March 27, 2020. [Online]. Available: http://www.who.int/csr/don/27-march-2020-novel-coronavirus-japan-ex-china/en/. [Google Scholar]
7. H. Chaolin, Y. Wang, X. Li, L. Ren, J. Zhao et al., “Clinical features of patients infected with 2019 novel coronavirus in Wuhan, China,” The Lancet, vol. 395, no. 23, pp. 497–506, 2020. [Google Scholar]
8. C. Nanshan, M. Zhou, X. Dong, J. Qu, F. Gong et al., “Epidemiological and clinical characteristics of 99 cases of 2019 novel coronavirus pneumonia in Wuhan, China: A descriptive study,” The Lancet, vol. 395, no. 10223, pp. 507–513, 2020. [Google Scholar]
9. S. Albahli, “Efficient GAN-based chest radiographs (CXR) augmentation to diagnose coronavirus disease pneumonia,” International Journal of Medical Sciences, vol. 17, no. 10, pp. 1439–1448, 2020. [Google Scholar]
10. D. Ensheng, D. Hongru and G. Lauren, “An interactive web-based dashboard to track COVID-19 in real time,” The Lancet Infectious Diseases, vol. 20, no. 5, pp. 533–534, 2020. [Google Scholar]
11. B. David, Q. Xiaolong, N. Karin, M. Didier, P. Leo et al., “Real estimates of mortality following COVID-19 infection,” The Lancet Infectious Diseases, vol. 20, no. 7, pp. 773, 2020. [Google Scholar]
12. S. Janik, S. Reinhard, S. Frank and K. Martin, “Covid-19 predictions using a Gaussian model, based on data from April 2,” Physics, vol. 2, no. 2, pp. 197–212, 2020. [Google Scholar]
13. S. Reinhard and S. Frank, “A Gaussian model for the time development of the Sars-Cov-2 corona pandemic disease. Predictions for Germany made on 30 March 2020,” Physics, vol. 2, no. 2, pp. 164–170, 2020. [Google Scholar]
14. C. Ignazio and A. Paolozzi, “Mathematical prediction of the time evolution of the COVID-19 pandemic in Italy by a Gaussian error function and monte carlo simulations,” The European Physical Journal Plus, vol. 135, no. 4, pp. 335, 2020. [Google Scholar]
15. Doubling time: Analysis, 2020. (2020, June 23). Retrieved from https://www.japanmacroadvisors.com/page/category/economic-indicators/covid19related/covid19-days-for-deaths-to-double/. [Google Scholar]
16. C. K. Birdsall and A. B. Langdon, “Plasma physics via computer simulation,” in The CRC press, 1st ed., vol. 1. Henderson, USA, CRC, pp. 1–504, 2018. [Google Scholar]
17. I. David, L. Marian, M. Michno and R. Schlickeiser, “Towards a complete parametrization of the ordinary-mode electromagnetic instability in counterstreaming plasmas. I. Minimizing ion dynamics,” Physics of Plasmas, vol. 20, no. 1, pp. 103, 2013. [Google Scholar]
18. D. Navneet and B. Triggs, “D AI-driven deep CNN approach for multi-label pathology classification using chest X-rays,” in The IEEE Computer Society Conf. on Computer Vision and Pattern Recognition (CVPR'05), Honolulu, HI, USA, vol. 1, no. 2, pp. 886–893, 2017. [Google Scholar]
19. K. A. Iqbal, L. S. Junaid and M. Bhat, “CoroNet: A deep neural network for detection and diagnosis of COVID-19 from chest x-ray images,” Computer Methods and Programs in Biomedicine, vol. 196, no. 2, pp. 581–595, 2020. [Google Scholar]
20. J. Rachna, M. Gupta, A. Taneja, and J. Hemanth, “Deep learning based detection and analysis of COVID-19 on chest X-ray images,” Applied Intelligence, vol. 15, no. 3, pp. 1690–1700, 2021. [Google Scholar]
21. S. Wang, B. Kang, J. Ma, X. Zeng, M. Xiao et al., “A deep learning algorithm using CT images to screen for Corona Virus Disease (COVID-19),” medRxiv, vol. 44, no. 3, pp. 171–201, 2020. [Google Scholar]
22. F. Jiang, L. Deng, L. Zhang, Y. Cai, C. W. Cheung et al., “Review of the clinical characteristics of coronavirus disease 2019 (COVID-19),” Journal of General Internal Medicine, vol. 32, no. 5, pp. 1–5, 2020. [Google Scholar]
23. A. Narin, C. Kaya and Z. Pamuk, “Automatic detection of coronavirus disease (COVID-19) using X-ray images and deep convolutional neural networks,” Pattern Analysis and Applications, vol. 12, no. 4, pp. 604–616, 2021. [Google Scholar]
24. W. Dayong, A. Khosla, R. Gargeya, H. Irshad and A. H. Beck, “Deep learning for identifying metastatic breast cancer,” IEEE ACCESS, vol. 16, no. 6, pp. 718–731, 2016. [Google Scholar]
25. Z. Wan, L. Xie, J. Han and X. Guo, “The application of deep learning in cancer prognosis prediction,” Cancers, vol. 12, no. 3, pp. 603–620, 2020. [Google Scholar]
26. C. Nicolas. P. S. Ocampo, T. Sakellaropoulos and N. Narula, “Classification and mutation prediction from non–small cell lung cancer histopathology images using deep learning,” Nature Medicine, vol. 24, no. 10, pp. 1559–1567, 2018. [Google Scholar]
27. E. Shkolyar, X. Jia, T. C. Chang, D. Trivedi, K. E. Mach et al., “Augmented bladder tumor detection using deep learning,” European Urology, vol. 76, no. 6, pp. 714–718, 2021. [Google Scholar]
28. T. Saba, A. S. Mohamed, M. El-Affendi, M. Amin and M. Sharif, “Brain tumor detection using fusion of hand crafted and deep learning features,” Cognitive Systems Research, vol. 59, no. 2, pp. 221–230, 2020. [Google Scholar]
29. S. Albahli and G. N. A. Hassan, “Fast and accurate detection of COVID-19 along with 14 other chest pathologies using a multi-level classification: Algorithm development and validation study,” Journal of Medical Internet Research, vol. 23, no. 2, pp. 134–150, 2021. [Google Scholar]
30. A. Ari and D. Hanbay, “Deep learning based brain tumor classification and detection system,” Turkish Journal of Electrical Engineering & Computer Sciences, vol. 26, no. 5, pp. 2275–2286, 2018. [Google Scholar]
31. C. Zhantao, L. Duan, G. Yang, T. Yue, Q. Chen et al., “Breast tumor detection in ultrasound images using deep learning,” in Int. Workshop on Patch-Based Techniques in Medical Imaging, Quebec, QC, Canada, vol. 88, no. 2, pp. 121–128, 2017. [Google Scholar]
32. A. Mesleh, “Lung cancer detection using multiLayer neural networks with independent component analysis: A comparative study of training algorithms,” Jordan Journal of Biological Sciences, vol. 10, no. 3, pp. 144–156, 2017. [Google Scholar]
33. A. Mesleh, D. Skopin, S. Baglikov and A. Quteishat, “Heart rate extraction from vowel speech signals,” Journal of Computer Science and Technology, vol. 27, no. 8, pp. 1243–1251, 2012. [Google Scholar]
34. A. Narin, C. Kaya and Z. Pamuk, “Automatic detection of coronavirus disease (COVID-19) using X-ray images and deep convolutional neural networks,” Pattern Analysis and Applications, vol. 13, no. 4, pp. 1–14, 2020. [Google Scholar]
35. F. Wang, L. Peter and D. Khullar, “Deep learning in medicine—promise, progress, and challenges,” JAMA Internal Medicine, vol. 179, no. 3, pp. 293–299, 2019. [Google Scholar]
36. L. Wang and A. Wong, “COVID-Net: A tailored deep convolutional neural network design for detection of COVID-19 cases from chest radiography images,” Scientific Reports, vol. 10, no. 3, pp. 1–12, 2020. [Google Scholar]
37. O. Tulin, M. Talo and E. A. Yildirim, “Automatic detection of COVID-19 cases using deep neural networks with X-ray images,” Computers in Biology and Medicine, vol. 121, no. 4, pp. 765–778, 2020. [Google Scholar]
38. W. Albattah, M. Nawaz, A. Javed, M. Masood and S. Albahli, “A novel deep learning method for detection and classification of plant diseases,” Complex & Intelligent Systems, vol. 41, no. 6, pp. 1–18, 2021. [Google Scholar]
39. S. Albahli, H. T. Rauf, M. Arif, M. D. Tabrez and A. Algosaibi, “Identification of thoracic diseases by exploiting deep neural networks,” Computers, Materials & Continua, vol. 5, no. 6, pp. 205–222, 2021. [Google Scholar]
40. A. Kassania, S. Hosseinzadeh, P. H. Kassanib, J. Michal, K. A. Schneidera et al., “Automatic detection of coronavirus disease (COVID-19) in X-ray and CT images: A machine learning based approach,” Biocybernetics and Biomedical Engineering, vol. 41, no. 3, pp. 867–879, 2021. [Google Scholar]
41. K. M. Esmail, E. A. Hemdan and M. E. Shouman, “Cascaded deep learning classifiers for computer-aided diagnosis of COVID-19 and pneumonia diseases in X-ray scans,” Complex & Intelligent Systems, vol. 7, no. 1, pp. 109–121, 2021. [Google Scholar]
42. S. Reinhard and S. Frank, “A Gaussian model for the time development of the Sars-Cov-2 corona pandemic disease. Predictions for Germany made on 30 march 2020,” Physics, vol. 2, no. 2, pp. 164–170, 2020. [Google Scholar]
43. S. Thattapon, I. Takahiro, C. Cheng, C. Wang and P. Y. Sheng, “Histogram of oriented gradients for human detection in video,” in 2018 5th Int. Conf. on Business and Industrial Research (ICBIR), Bangkok, Thailand, vol. 76, no. 2, pp. 172–279, 2018. [Google Scholar]
44. S. Albahli, H. T. Rauf, A. Algosaibi and V. E. Balas, “AI-Driven deep CNN approach for multi-label pathology classification using chest X-rays,” PeerJ Computer Science, vol. 7, no. 1, pp. e495, 2021. [Google Scholar]
 | This work is licensed under a Creative Commons Attribution 4.0 International License, which permits unrestricted use, distribution, and reproduction in any medium, provided the original work is properly cited. |