DOI:10.32604/cmc.2022.024085
| Computers, Materials & Continua DOI:10.32604/cmc.2022.024085 | |
| Article |
Hybrid GrabCut Hidden Markov Model for Segmentation
1Department of Software Engineering, UniversitiTeknologi Malaysia-UTM, 81310, Malaysia
2School of Computer Science and Engineering, SCE Taylor's University, Subang Jaya, 47500, Malaysia
3Department of Engineering and Technology, Mohak College, Alberta, Canada
4Department of Computer Science, College of Computers and Information Technology, Taif University, Taif, 21944, Saudi Arabia
5Department of Information Technology, College of Computers and Information Technology, Taif University, Taif, 21944, Saudi Arabia
*Corresponding Author: Soobia Saeed. Email: saeed.soobia@graduate.utm.my
Received: 03 October 2021; Accepted: 16 December 2021
Abstract: Diagnosing data or object detection in medical images is one of the important parts of image segmentation especially those data which is less effective to identify in MRI such as low-grade tumors or cerebral spinal fluid (CSF) leaks in the brain. The aim of the study is to address the problems associated with detecting the low-grade tumor and CSF in brain is difficult in magnetic resonance imaging (MRI) images and another problem also relates to efficiency and less execution time for segmentation of medical images. For tumor and CSF segmentation using trained light field database (LFD) datasets of MRI images. This research proposed the new framework of the hybrid k-Nearest Neighbors (k-NN) model that is a combination of hybridization of Graph Cut and Support Vector Machine (GCSVM) and Hidden Markov Model of k-Mean Clustering Algorithm (HMMkC). There are four different methods are used in this research namely (1) SVM, (2) GrabCut segmentation, (3) HMM, and (4) k-mean clustering algorithm. In this framework, on the one hand, phase one is to perform the classification of SVM and Graph Cut algorithm to create the maximum margin distance. This research use GrabCut segmentation method which is the application of the graph cut algorithm and extract the data with the help of scale-invariant features transform. On the other hand, in phase two, segment the low-grade tumors and CSF using a method adapted for HMkC and extract the information of tumor or CSF fluid by GCHMkC including iterative conditional maximizing mode (ICMM) with identifying the range of distant. Comparative evaluation is also performing by the comparison of existing techniques in this research. In conclusion, our proposed model gives better results than existing. This proposed model helps to common man and doctor that can identify their condition of brain easily. In future, this will model will use for other brain related diseases.
Keywords: SVM; tumor; CSF; k-NN; MRI; grabcut segmentation; HMM
The concept of “K-Nearest Neighbor (k-NN)” is one of the simplest, easy-to-understand, and interprets non-parametric machine learning algorithms. It gives relatively high and competitive results. It is a multipurpose algorithm and can be used to figure out the classification as well as regression issues. New records are identified by k-NN by combining most historical records of “k” [1,2]. For the last four decades, it is the widely used as a statistical method in pattern recognition because of its simplicity and easiness. It is a very popular algorithm for text categorization and is used in various research strategies. To implement the k-NN algorithm we have to determine the following:
i. The distance between the new and the training samples,
ii. The nearest K neighbors,
iii. The classification of the new sample,
If all samples possess a similar category, then every new sample will be grouped in this category or else, a new category is to be determined for each new sample following certain rules. It is assumed that neighboring data points feature similarity that is why the nearest neighbor method is used for prediction. Fundamentally, the nearest neighbor algorithm concept defines the “k” points which are nearest to the unidentified sample in the multidimensional space, sorts them, and assigns a class based on how closely it matches the k points [3]. These k points are labeled as the k-nearest neighbors of the unknown samples. It is assumed in this algorithm that in multidimensional space, every instance resembles other points. The Euclidean distance is used to evaluate the nearest neighbor of any instance along with recalculating the new group “k” points [4,5]. To find the nearest distance, we repeat this strategy until the “k” point selection. In this research, we use three techniques that rendered a lot in solving the k-NN missing data problem. The most common technique in k-NN algorithm is the support vector machine (SVM). In machine learning (ML), kNN and SVM illustrate various crucial transactions [6,7]. Even if the list of input variables, the SVM approach predicts exactly for all new observations. Hence, SVM is one instant and ready-to-use approach that many technicians use for brain imaging. Many inputs but small sample sizes will be used for two application domains. SVM is a frequently operating technique to fulfill the fundamentals of k-NN algorithm that enhances the gap or difference between the categories and leads to efficient overall performance. Comparability comparison is used for various categories in SVM. Therefore, to find accuracy and clarity in classification we have used SVM in this research. Here this research extends the method by using the HMM so that the tumor classification based on previous and subsequent segmentation results will be concluded. This approach uses probabilistic reasoning over time and space for brain tumor segmentation from 4D MRI [8–12]. The diagnosis of brain tumor and CSF liquid usually requires image segmentation to evaluate tumor detection in brain images. Since the structural changes of the tumor interact with other normal tissues, separately segmenting each target and then combining them to build up whole-brain images would not be efficient for the three-dimensional (3D) segmentation method [13]. On the other hand, it is assumed that multi-dimensional (4D) segmentation has been widely used in the image segmentation field and proven to be effective [13–15].
This research aims to examine whether the CSF leakage fluid and low-grade tumor (initial stage of the brain tumor) images are helpful to improve the quality of images using the GrabCut algorithm of MRI images in terms of both accuracy and quality. The datasets used in this research is a series of chronological low quality MRI images of brain tumor (cancer) and CSF fluid leakage in patient's brain images. In addition, the previous research contribution is based on the 3D segmentation method that tried to enhance the quality of images to gain a higher resolution and remove the noise or existing errors [16]. Therefore, the traditional method (3D) is not enough to enhance the accuracy of poor images of fluid as CT myelography or MR Myelography is more significant than MRI in identifying the area of CSF leak as if it arises from a considerable tear [17–22].
In addition, the problem associated with this research also reduces k-NN missing imputation in poor MRI images as the K-NN algorithm is susceptible to outliers because its selection criteria are based on distance neighbors for the closet point [23]. Essentially, k-NN cannot address the problem of missing imputation. The k-NN algorithm tries to achieve optimal searching factors to address the missing values, whereas other algorithms fail [24–26]. Generally, this research needs more consequences about the outcomes of hybrid k-NN algorithms, which can reflect the improvement in accuracy using the 4D images segmentation method [27–31].
Many other researchers and scholars used hybrid k-NN algorithm for classification of brain tumor of both malignant and benign. The researcher used hybrid ensemble method of random forest (RF) with combination of k-NN and decision tree (KNNRF-DT) based on majority voting method. The researchers focus the area of tumor and classify the both type of tumor, in the starting section segmentation were performed using the Otsu's threshold method. Feature extraction is performed by Stationary Wavelet Transform (SWT), Principle Component Analysis (PCA), and Gray Level Co-occurrence Matrix (GLCM), which provide the thirteen features for classification of hybrid k-NN ensemble classifier [32,33]. One of the other researches is relevant to brain tumor which improve the performance of hybrid k-NN algorithm by the combination of SVM with k-NN for segmentation of brain tumor and increase the accuracy. The main contribution of this research is based on detecting the tumor region based on MRI was highlighted by the dim scale and symmetrical method and then applied hybrid k-NN algorithm to increase the performance of MRI and accuracy of the images [34–37].
Our proposed approach is different than others as this research focus the low-grade tumor which is in sizable form and CSF fluid through hybrid k-NN model which is the combination of four different techniques. These techniques are not only maintained the accuracy and quality of images but increase the performance of proposed hybrid k-NN model. The combination these techniques namely GCHMkC which enhance the accuracy of the images that can tumor or fluid can easily identified in the images. The experimental results show the improve performance of this novel proposed model that enhance the quality and accuracy of this model. The structure and organization of this research work are detailed as follows: Section 1 interprets the research done previously, the current body of literature on this research's main topics, and presents the related work. It also describes the writings on the application of 4D image of LFT segmentation and k-NN algorithm in different fields of research. Section 2 presents our approach, methodology, and a brief review of the framework adopted. Section 3 shows the experimental results and discussion of our proposed methods; Section 4 shows the proposed algorithm, and Section 5 show the conclusion and future work.
The Proposed Hybrid Graph Cut Hidden Markov Model of k-mean Cluster (GCHMMkC) technique in the k-NN model that we have developed consists of two main components: Graph-Cut Support Vector Machine (GCSVM) technique and Hidden Markov Model of k-mean cluster (HMkC) approach as illustrated in Fig. 1. The proposed techniques are based on multiple phases to implement in MRI images that are sufficient for the segmentation and classification of all types of images. The first component of the proposed model is based on the GCSVM technique, which consists of three phases: (1) Graph cut algorithm (2) GrabCut segmentation, and (3) SVM classification. These phases perform operations such as preparing the images for the classification of regression methods for training and labeling the datasets to enhance the accuracy of the images by the use of SVM. Graph cut algorithm transforms the data to generate the new elements of datasets. Furthermore, GrabCut segmentation's results are link with the scale-invariantfeature transform (SIFT) function to identify the pixel size and range of fluid or tumor and connect to the second phase of the technique. The second component of our proposed model is the HMM and k-mean clustering algorithm (HMkC) technique, which consists of two phases: (1) HMM, and (2) k-mean clustering algorithm. These phases perform operations such as refining and reconstructing images using iterated conditional maximizing mode (ICMM) to join the probability of the trained dataset's images with statistical confidence interval (d). The above two methods show the range of specified probabilities of HMM joined together, and statistical confidence intervals arrange the constructed images using ICMM to generate the same sequence form. In the end, the k-mean cluster is used to store the data for the classification of trained datasets. The explanation of the proposed technique is given below in detail in the next subsection.
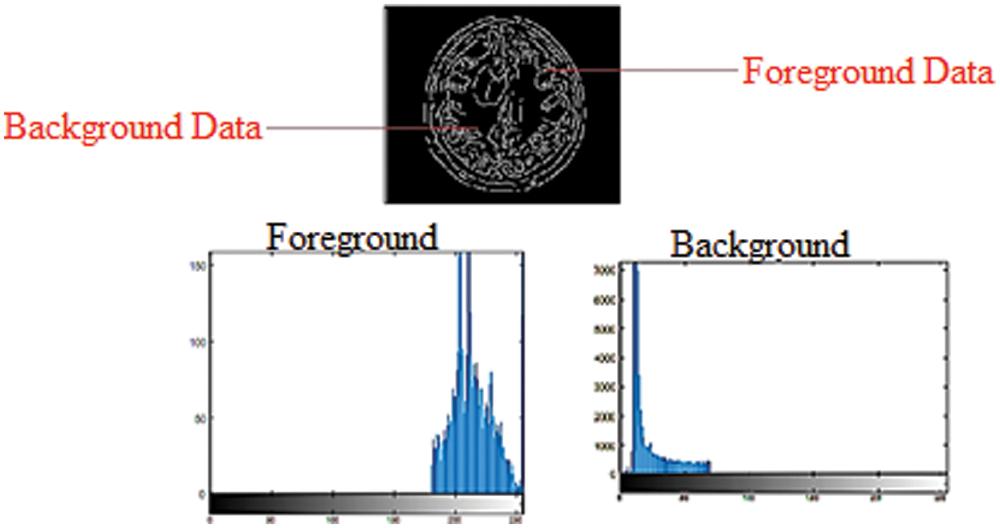
Figure 1: Foreground and background histogram models in a grayscale image
Quality is one of the most common issues in medical image datasets, which is subject to various factors such as noise in the images, irrelevant features, or missing boundaries. These issues need to be addressed before any segmentation method or classification of medical images is performed. Therefore, the proposed technique, explained next, reduces noise and irrelevant features in the images by the SVM and graph cut segmentation method and also apply a k-mean clustering algorithm to store the data for multi-classification of SVM. Firstly, SVM selects the images for training sample data and calculates the feature vectors of the trained datasets. SVM calculates feature vectors of the MRI image pixel point and gets them classified. In the second step, the previously selected sample points of the datasets from the target image are applied to the trained SVM to classify these image points. Furthermore, enhance the interested region points which are obtained in the second step to achieve the classification of an image and use the graph cut algorithm to help segment the tumor and CSF fluid in the images by using the segmentation technique of GrabCut segmentation method. In this research, the graph cut algorithm using the segmentation technique of GrabCut is combined with the SVM known as GCSVM hybridization. GCSVM increases the resolution of an image for training and labels the trained datasets. The image is treated as a graph structure with vertices and edges to define the structure of the image. Each pixel is represented by a vertex and neighboring pixels are linked by a weighted edge based on their similarity. In the case of multi-label image segmentation, each label has a unique vertex known as a terminal. The probability of the label assignment determines the vertices of pixels linked to all terminals and their edge weights. The solution to finding the minimum amount of energy lies in obtaining the segmentation that cuts on the graph at a minimum cost that a min-cut/max-flow algorithm can solve. Each vertex is connected after cutting the single terminal, which means the corresponding label is assigned to the corresponding pixel. This technique works on a combination of graph cut and SVM techniques. It maximizes the margin to become a max-margin graph cut for training the datasets in machine learning algorithms. This improves the hybrid GCSVM technique's efficiency due to reducing the time and space complexity during the segmentation process for the SVM and graph cut algorithm to create the max-margin distance.
GrabCut is a segmentation technique that uses graph cuts to perform segmentation for encapsulating the information in images. Most techniques use either edge detection or region detection, but GrabCut detects both of them. This information is used to create energy functions to be minimized and produce segments. To segment images, a graph is constructed with nodes representing pixels in the images. Additionally, two special nodes are created. These are known as “sink” and “source” nodes because they are linked to every pixel node in the graph. The sink node represents the image's background, while the source node represents the image's foreground. Both nodes must be separated from each other to segment the image. The energy function combines weights between pixel nodes as well as weights between pixel and source and sinks nodes in the graph. The weight between the pixel nodes determines the edge information in the image. These illustrate the edge between two pixels, such as a significant difference in pixel color resulting in a very small weight difference between two-pixel nodes. The weight between the Source and Sink nodes and pixel nodes are determined by the region information. These weights are determined by determining whether a pixel node is in the background or foreground region.
In the GrabCut segmentation process, a few pixels are labeled before the segmentation as foreground or background, which is needed to create the regions. This study selects pixels that are set apart during the clue marking stage and uses them to display model region data by constructing foreground and background histograms. Histograms are generated by noticing the frequency with which a pixel appears within a group of pixels. The intensity of grayscale images can range between 0 and 255 for each pixel. For grayscale images, a histogram with 256 bins is created, with each bin containing the frequency at which pixels with the intensity of the bin number occur in an image. Fig. 1 depicts the use of foreground and background information to create histograms in a grayscale image. The probability of the pixel node lies between the weight on it, and the source node determines the foreground histogram. Furthermore, the probability determined by the weight between the pixel node and the sink node lies inside the background histogram.
Fig. 1 shows that pixels with a high-intensity value have a higher probability of appearing in the background histogram than in the foreground histogram. The edge weight between the pixel node and the Sink node is stronger than the edge weight between the pixel node and the Source node. Pixels with a low-intensity value have a higher probability of appearing in the foreground histogram than in the background histogram, so the edge weight between the pixel node and the Source node will be more grounded than the edge weight between the pixel node and the Sink node. Both foreground and background histograms are utilized as a resulting set of inputs for MRI image segmentation. This research applied binary labels 446 × 2 and 48761 × 2 set to foreground and background. These binary labels values of both background and foreground construct the graph structure such as G = (vertex, ε), where the vertex is the set of pixels or vertices, and ε is the set of assembly edges for the closest four connected pixels to each other. To find the vertex label with a minimum energy function, this research uses maximum-flow and minimum-cut methods. In the min-max cut algorithm, each image region was labeled to pixel intensity using the binary transformation function and stores the values of sink and source nodes.
The aim of this section is to evaluate the predictive analysis of MRI data for the classification of tumor or CSF fluid leak after utilizing the technique of hybrid GCSVM to solve the classification problem. The image is transformed and is assigned the new data elements after classification for labeling the categories in terms of a binary classifier to receive the optimized solution. This proposed technique fulfils the requirement of segmentation's outcomes and enhances the quality of images. The hybrid GCSVM technique classifies between these two classes, which are constructed by a hyper plane in 4-dimensional features utilized by the classification. In the end, SVM transforms the medical images datasets by the proposed hybrid GCSVM technique as input and produces the output as a classification of two classes as positive samples and others as a negative sample. The SVM classification for both classes is represented in Eqs. (1) and (2) are:
Is positive and,
where
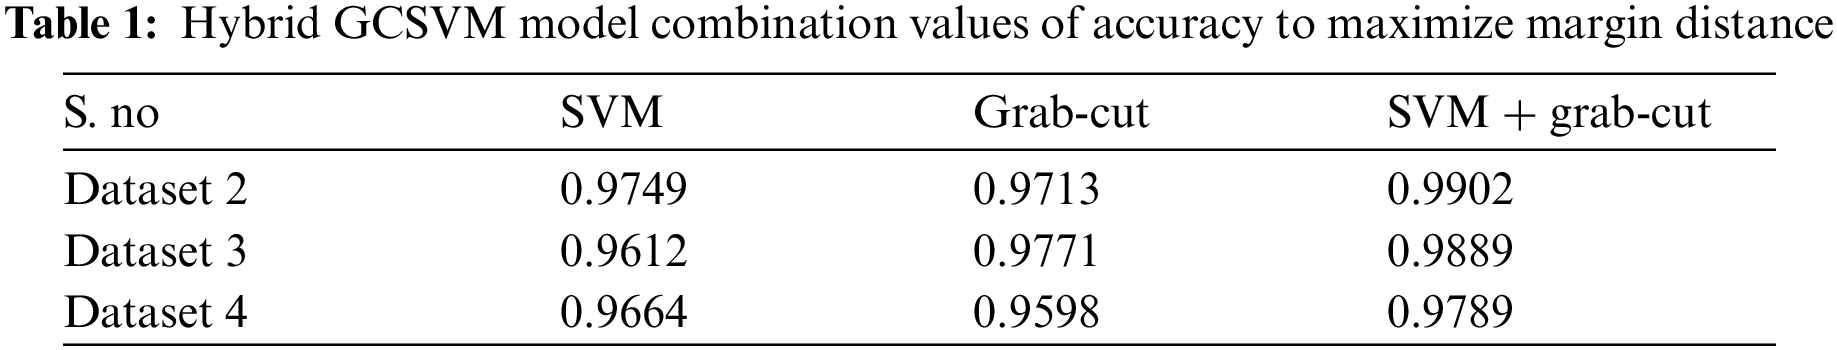
The above Tab. 1 show the accuracy values of hybrid GCSVM segmentation method which shows the three datasets values including CSF fluid Leak, Low Grade Tumor, and CSF with low-grade tumor. In addition, the Training datasets of the hybrid GCSVM technique uses weight matrix and bias for each label of images to represent the hyper plane decision boundaries. In addition, hyper plane dimension is dependent on the number of features of data points in SVM classification. Hence, the proposed GCSVM technique is to develop the accuracy in images for the segmentation and preprocessing method etc., which improves not only the quality of images but reduces the redundancy which is the actual energy minimization in the segmentation process. Essentially, SVM calculates the hyper plane's distance and generates the results in either a positive or negative class after detecting whether the CSF fluid and low-grade tumor are present or not in the datasets. In addition, features were extracted from the preprocessed image for further processing in this research. Each MRI image has its unique identification, and the system would match various features like shape, color, and intensity if the tumor or fluid in the images is present or not. All these features were extracted using SIFT. The SIFT works well, but still, there is some lack of identification to the nature of low-grade tumors or fluid. However, SIFT is able to show the sizes and features of the images but finding the range of fluid or un-shapeable tumors is hard to identify. This section prefers to apply the proposed HMkC approach to diagnose the process of tumor and CSF fluid.
2.4 Hidden Markov Model (HMM) and K-mean Approach
Tumor or fluid detection in medical MRI images is another problem of MRI images because identifying the CSF fluid (deposit the CSF fluid initially in the brain is unknown), and the low-grade tumor is not visible properly in the images. MRI is less effective in identifying the fluid or small size tumor in the brain until it stems from a sizable part. This problem is to be solved by the HMM, which is extended to the previous section. The HMM classifier is used to track the GCSVM technique to detect the CSF fluid and low-grade tumor that uses the spatial method of HMM. HMM combines probabilistic reasoning over time and space to the segment of the trained MRI datasets. In addition, the k-mean clustering algorithm also plays an important role in this section. The k-mean is used to store the classes of datasets in a cluster form in terms of classification. The proposed HMM approach creates the Markov chain and distributes the probability observed by the original state of the image. This section defines the transition state of HMM as HMM is the best approach for identifying the fluid in the images. In this section, ICMM is applied to the length of the interval of sequence depending on the iteration condition to join the probability and calculate the probability range. After calculating the observed data, detection of CSF fluid in the image is obvious since the flow of CSF fluid leaks in one direction due to the nature of the liquid, and the tumor is located in different places of the brain. In this section, the area of fluid or tumor is identified by an iterated maximizing mode which finds the border of tumor or fluid in the construction of the image to detect it. In this research, the HMM classifier approach is combined with the GSVM technique in the k-NN algorithm to enhance the quality of the images. This approach develops the strategy of the k-NN algorithm to pick the nearest location of the “k” neighbor in terms of the k-mean cluster of the proposed technique. The hybrid GCSVM technique is to increase the quality of the images, and the feature vectors of the images consider the HMM of trained MRI images datasets statistically. This approach provides the best solution to check the availability and non-availability of tumor or Fluid by using the two transition states S = (S1, S2) such S1 show the presence of tumor or fluid and S2 show the absence of tumor or fluid. The method would be started in one of these two states and proceed smoothly from one state to another and generate an output of the probabilities of sequencing which belong to one category and the other category due to applying the condition of ICMM. If the Markov chain were presently in state S1, then it would continue to the next state S2 with a specific probability. In order to procedure the Markov Transition matrix, this research firstly observe each of the given images by developing the ICMM to show the length of tumor (size) or range of fluid during the process of joining the probability. These probabilities identify the shape, size and range of fluid or low grade of tumor such as t, t + d, t + 2d, t + 3d, …, t + nd. Here, d is the length of sequence which shows the presence of tumor or fluid state. This transition state represents the probability of the state of the voxel at time strategy with the implementation of ICMM (maximum or minimum values sequentially depending upon the state condition) to the given state “t”. This HMM approach develops the main contribution with the utilization of the condition of the transition matrix such as the possible state of a voxel that has identified the Fluid or tumor or non-identified.
3 Experimental Results and Discussion
The experiments are conducted to evaluate the set research objectives. This chapter presents the simulation results and classification analysis of the proposed techniques of hybrid k-NN algorithm model. Different simulations are carried out to evaluate the performance of the proposed techniques to comparison of existing work and performance metrics. The efficiency of the proposed techniques is also compared with previous state-of-the-art k-NN algorithm. This section presents and discusses the results of the simulation formulated technique with statistical significance analysis. To evaluate the performance of the proposed hybrid GCSVM technique for classification of SVM and graph cut algorithm technique and image segmentation to diagnosing the tumor or CSF fluid in the image which is given below:
Figs. 2a–2c show the features of pixels corresponding to background, white matter, grey matter, tumor, and CSF Fluid in MRI images which is develop by the strategy of SVM and k-mean algorithm. This strategy is for classification of SVM using Gaussian radial basis kernel function which generates the values of healthy brain, CSF Fluid leak, Low-Grade tumors, CSF with Low-Grade tumors, and High-Grade tumors. Thus, simulation has been performed with various numbers of trained LFD datasets of MRI images from the range of 200 to 3000. Fig. 2d shows the histogram of these simulation results of LFD datasets which indicate the range of CSF Fluid leakage in brain and Low-and High-grade tumors with CSF. The consequence of this outcome is that the proposed SVM classification would support the next simulation technique to minimize the energy function of graph cut. The proposed SVM create the maximize the margin of classification that can SVM increase the efficiency of images while using the k-mean algorithm.
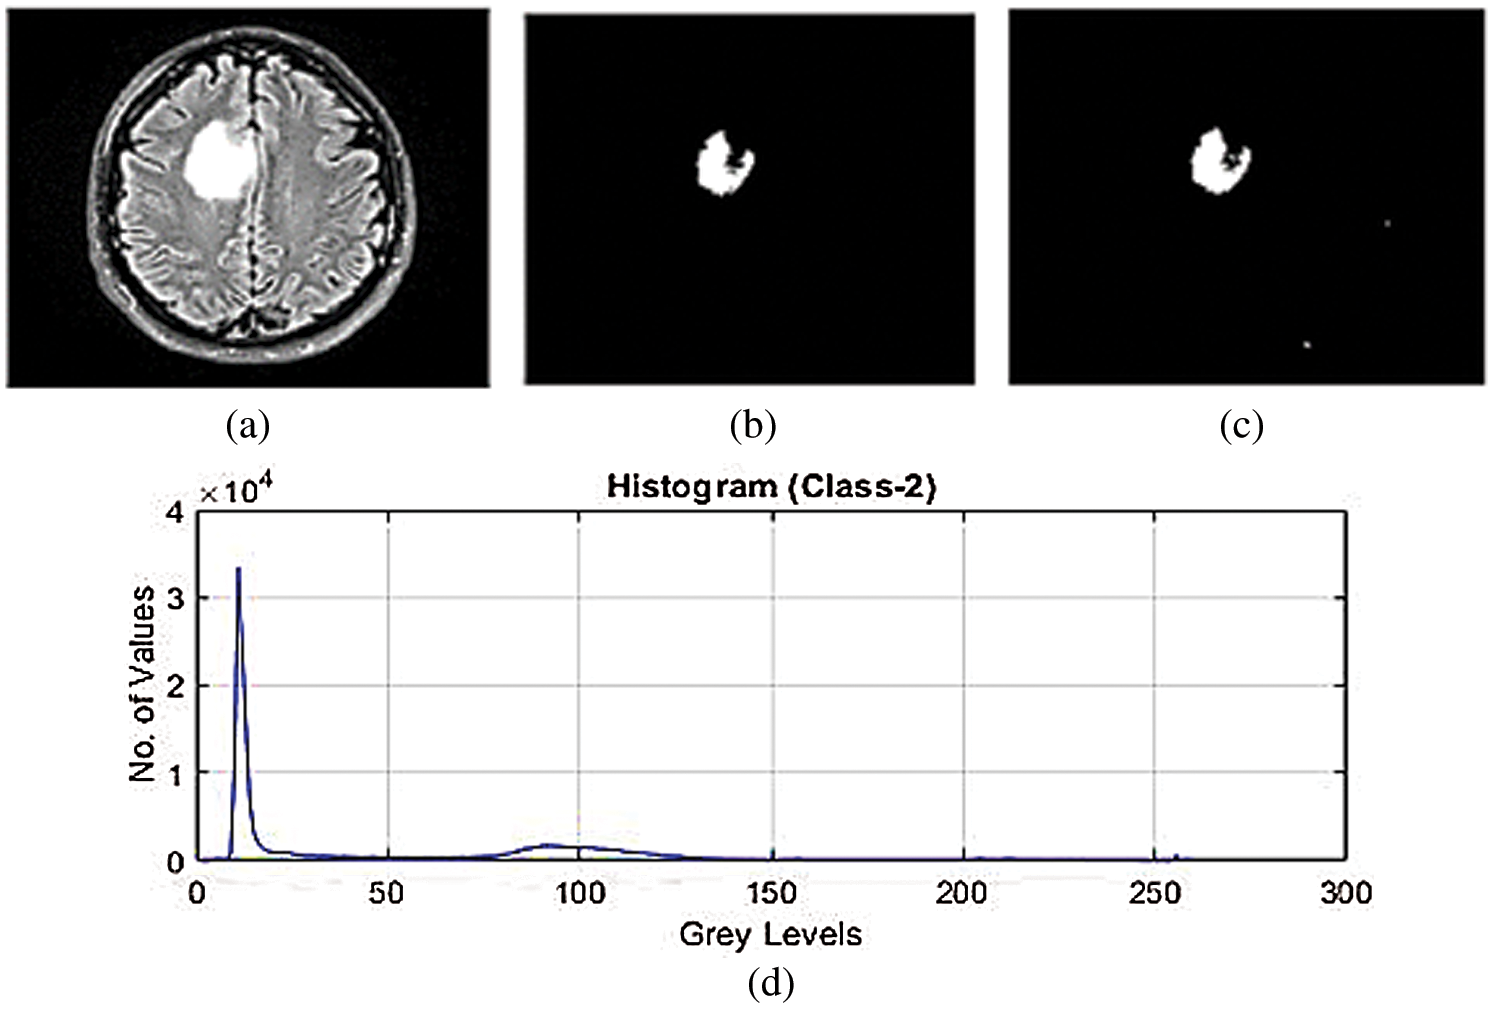
Figure 2: (a)–(c) SVM classification for feature extraction of low-grade tumor with CSF fluid leak MRI datasets (d) histogram of SVM classification for feature extraction of low-grade tumor with CSF fluid leak MRI datasets
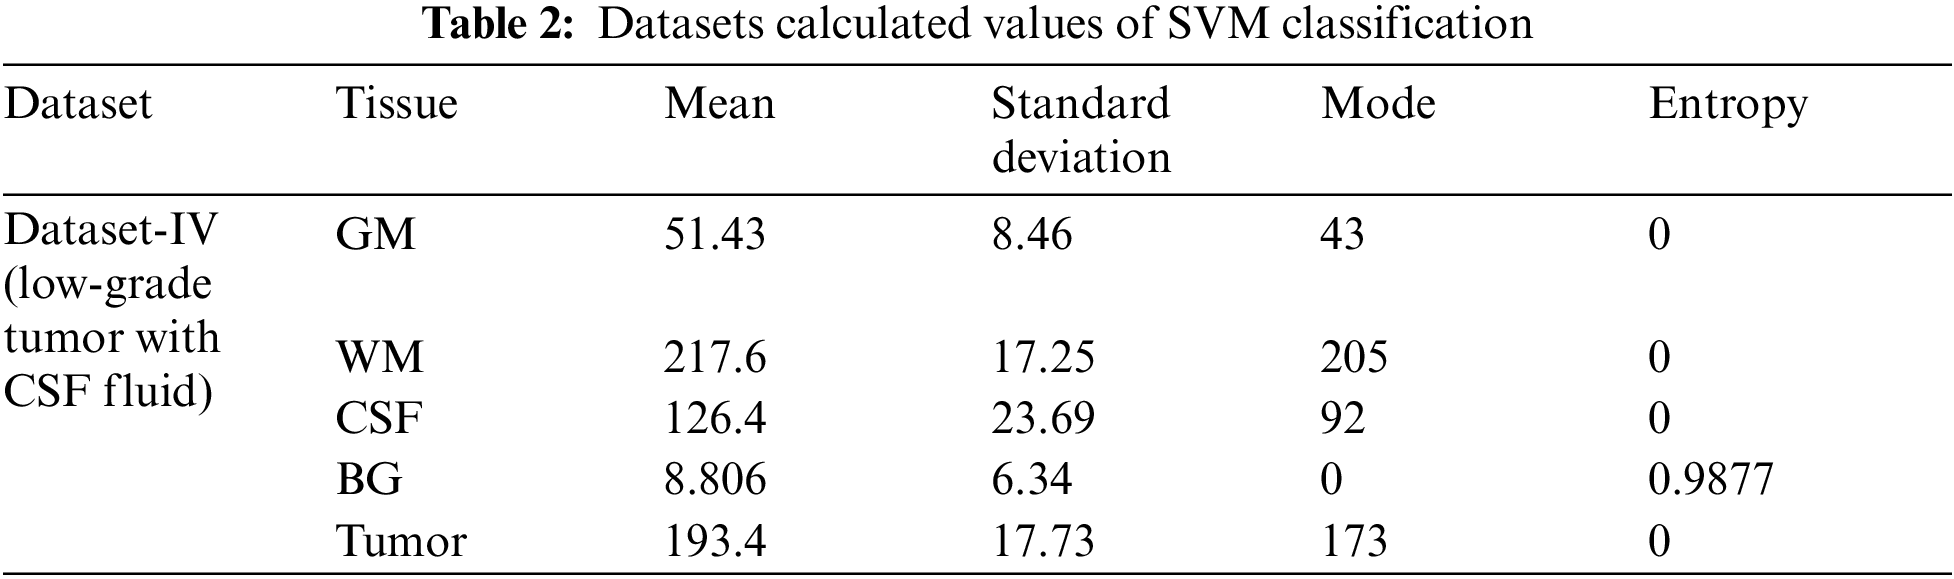
The above Tab. 2 shows the SVM classification simulation results values which maintain the quality of the images using the light field database images. Tab. 2 show the brain tissue classification results of background, WM, GM, Tumor, and CSF in terms of Jaccard Similarity Coefficients for the simulated brain MRI images.
3.1 Implementation of Hybrid GCSVM Technique
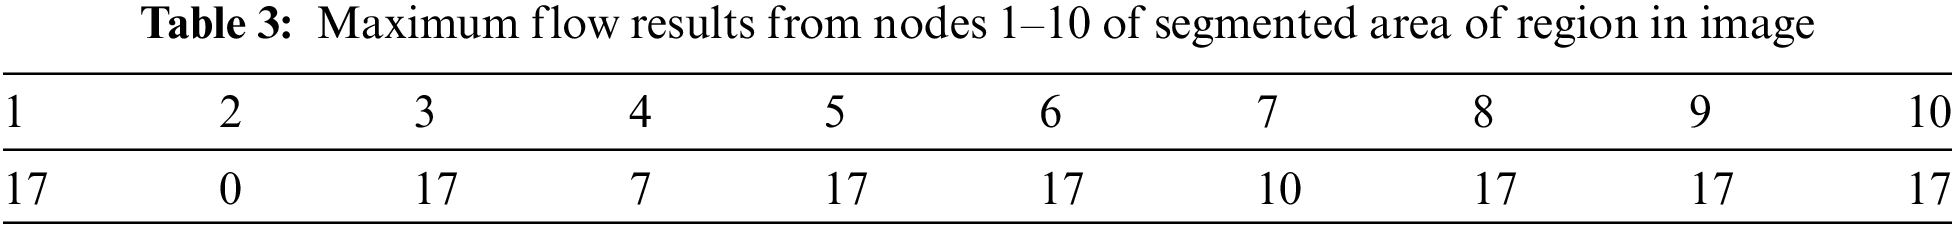
The simulation results of the max-flow/min-cut algorithms were used for the GrabCut segmentation method to detect both edges and regions. To perform segmentation, a graph is constructed, with nodes representing pixels in the images. The canny edge detection function (I, canny) was used in this study for edge detection in both the normalized cuts and the min cut/max flow algorithms. Firstly, the images get turned into 4D to 2D for noise removal and a median filter was applied to remove the impulses, as the images needed to smooth through a nonlinear 2D media filter with the help of ‘MEDFILT1(I)’ Including size 3 × 3. In addition, to segment the images, both nodes including sink and source nodes must be separated to each other and calculated the pixel's values by determining the probability of the pixel node being part of the background or foreground region. Pixels in the same set as the source are labeled white, while pixels in the sink's set are labeled black. For an input image of size 446 × 2 and 48761 × 2 for foreground and background, respectively, obtained by scaling the original image (see Figs. 3a–3c) by a factor of 0.1 and removing the edges and convolving the images to obtain boundaries for connected and non-connected nodes. After developing the histogram, the number of connected nodes in the CSF fluid (CSF tissues) range was identified. Obtaining a binary image requires one threshold (T1) value that is required to segment between the white, grey matter and the grey matter of the CSF region. In min-max cut algorithm each region of the image was labeled to pixel intensity using the function of BWlabel. Furthermore, after calculating the sink and source nodes values need to be storing the values in “T and S” where T represents the sink node values and S represent the source node values as shown in the Tab. 2. Furthermore, Fig. 3 show the implementation results of all of three datasets of images with area of region, histogram of foreground and background values of all connected nodes, edge node detection values from sink and source node, Computation of Label Matrix (L) values result and, directed graph (g) node network connectivity, and also running time with complete details are mentioned as given below:
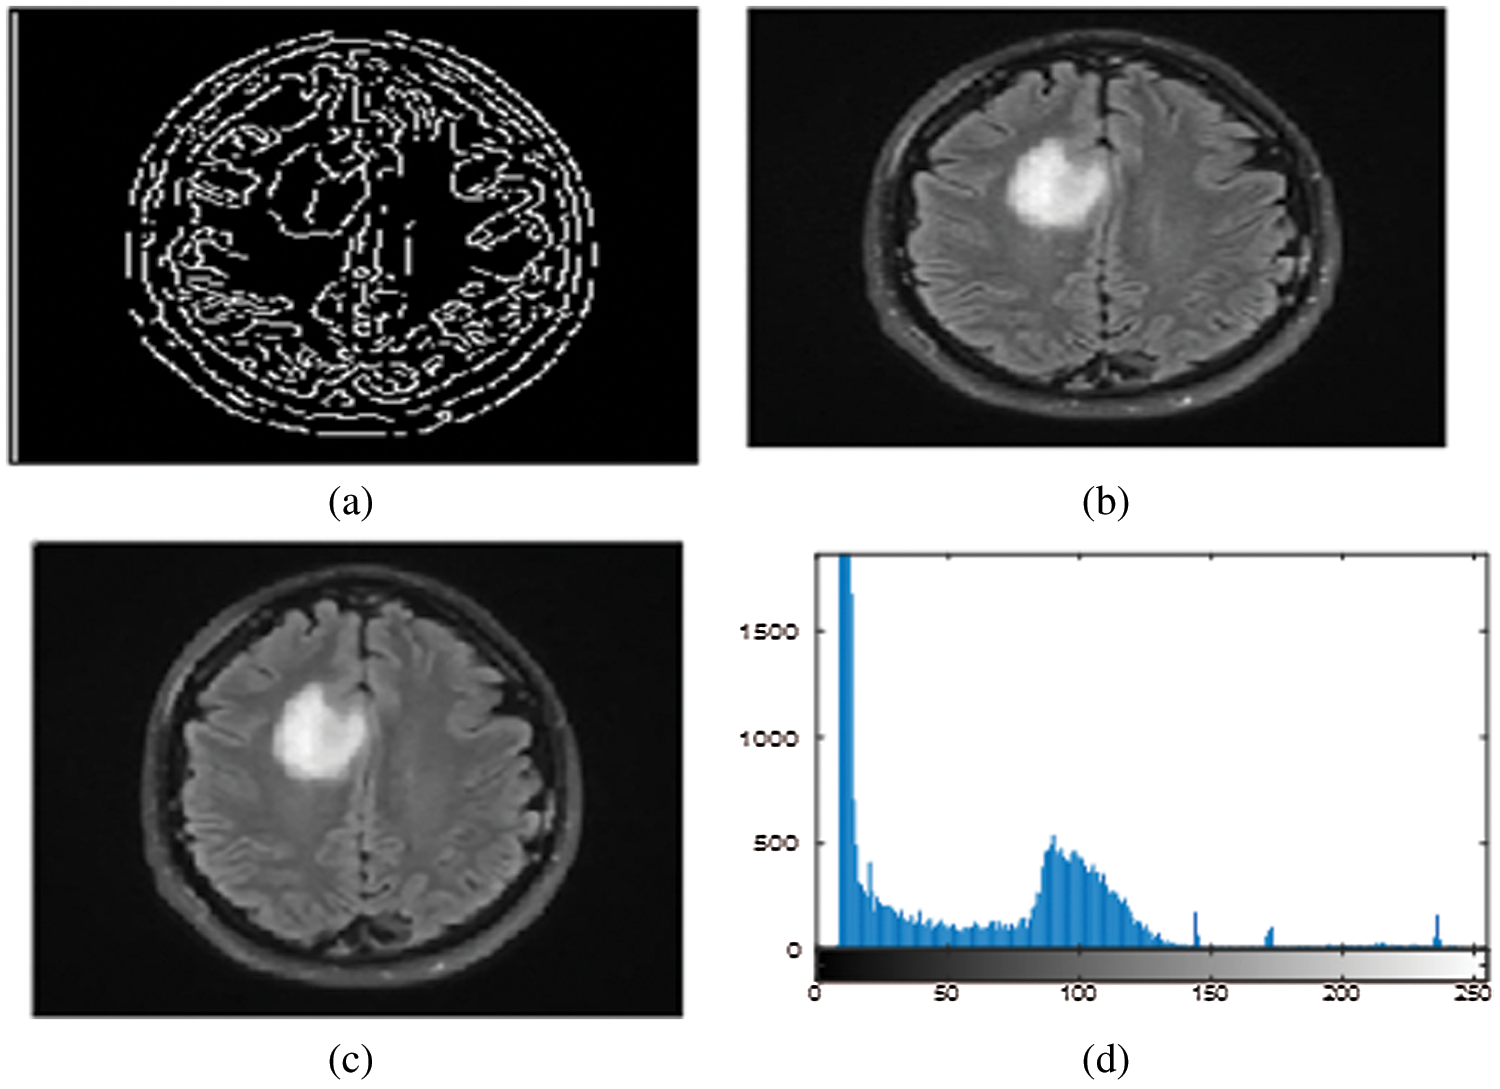
Figure 3: (a)–(d) Calculated pixels’ values foreground and background sink and source nodes
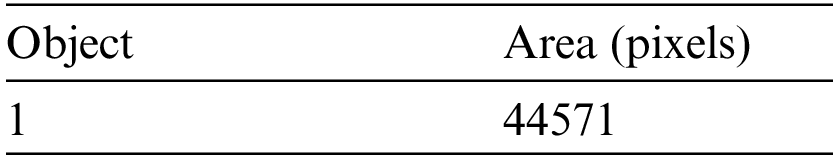
The above area of region segmented values depends on the calculation of area of pixel targeted in the image for detection of the size of object in the image as this image indicate the value is high as per the targeted values of CSF fluid deposit in the brain as mentioned the detail in Tab. 3.
3.2 Running Times of Trained Datasets
Tab. 4 shows the running times of the max-min cut flow algorithm, as shown in Figs. 2–4 for various input sizes obtained by scaling down the input image. The scale factor refers to the image's scale in one dimension, and rescale the image values is 0.1, so the actual scale down will be the square of the scale factor. This research considers the running times in milliseconds when tabulating the results of these experiments. The running time does not include the times for input and output. To better visualize the results, this research develops the table to plot the running times against the number of nodes in log scale as shown in Fig. 5.
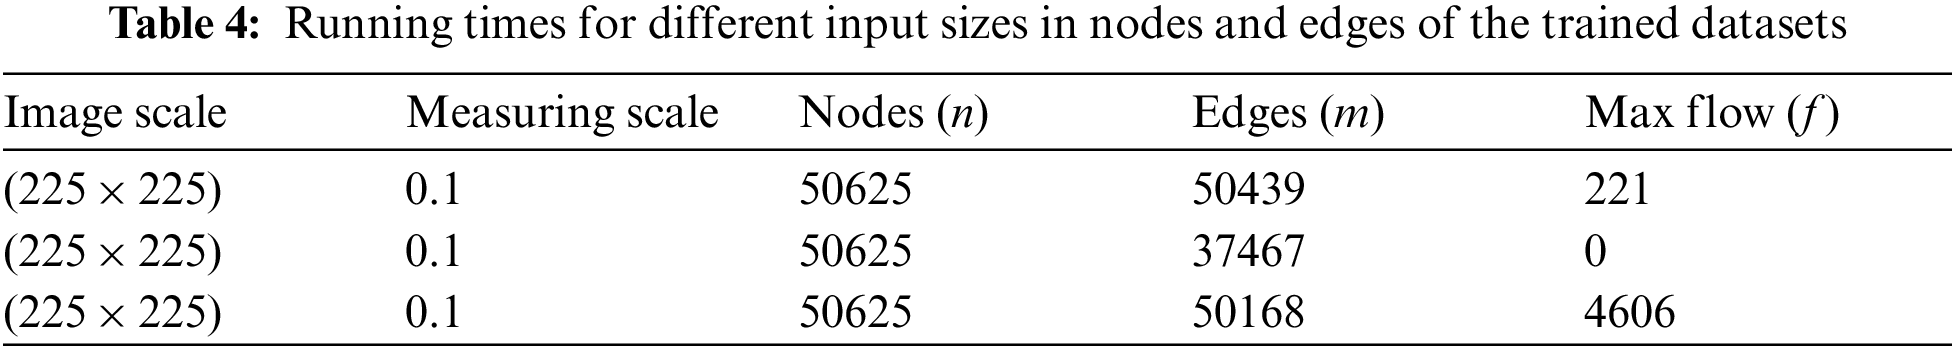

Figure 4: Tumor identifies using the foreground and background sinks and source nodes
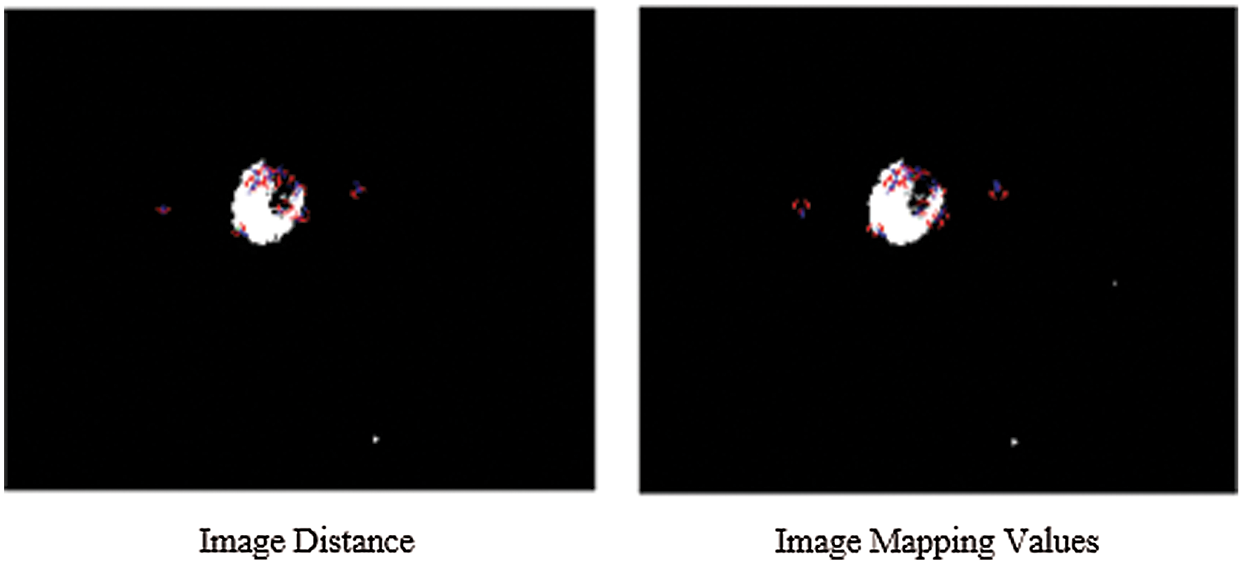
Figure 5: The SIFT key-points for both the images are stored in features and identifying the object location of CSF fluid images datasets
3.3 Implementation Results of Scale Invariant Feature Transform of Hybrid GCSVM Technique
The simulated results of SIFT show the scale space of the initial images are repeated to select the trained datasets images by the use of the function of convolution of a variable-scale Gaussian, G (x, y, σ) with the input image (I). These results generate by the process of convolved with Gaussian's function to produce the set of scale space images which shows on the left side. The adjacent Gaussian images are subtracted to produce the difference-of-Gaussian images on the right side and process is repeated after the Gaussian image is down sampled by a factor of 2. The below Figs. 5 and 6 show their distance mapping and calculated values by comparing the pixel marked values of maximum and minimum difference of the Gaussian function images were detected to128 feature values and its neighbors in 3 × 3 at the recent region of the adjacent scale.
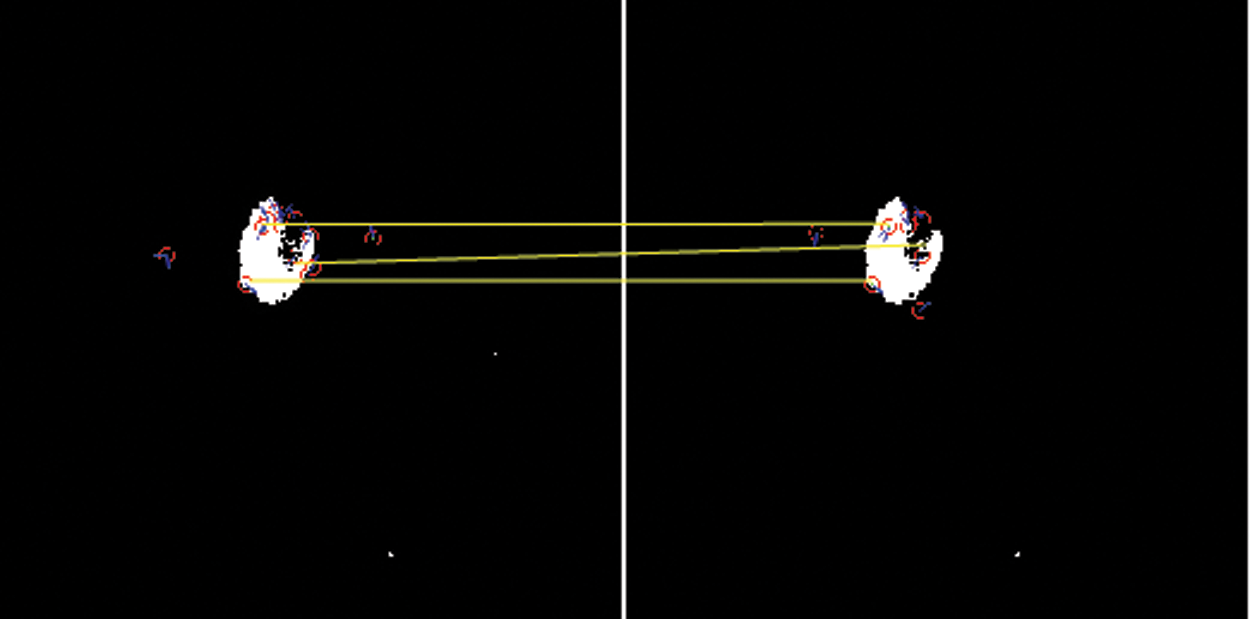
Figure 6: Scale-invariant distance mapping point of object location of CSF fluid images datasets
From the above Figs. 5 and 6 show the SIFT is feature detection algorithm to detect and describe the local features of the images. The key-points or the points of interest are first selected. The 128-valued feature descriptor is used to match and recognize the object of interest in a new image based on the 128-valued feature descriptor already stored in the database. The Euclidean distance is used to determine the best matching points between the two images of their distance and mapping values of selected three database trained MRI images.
3.4 Hidden Markov Model of k-mean Clustering Algorithm (HMk-NN) Technique
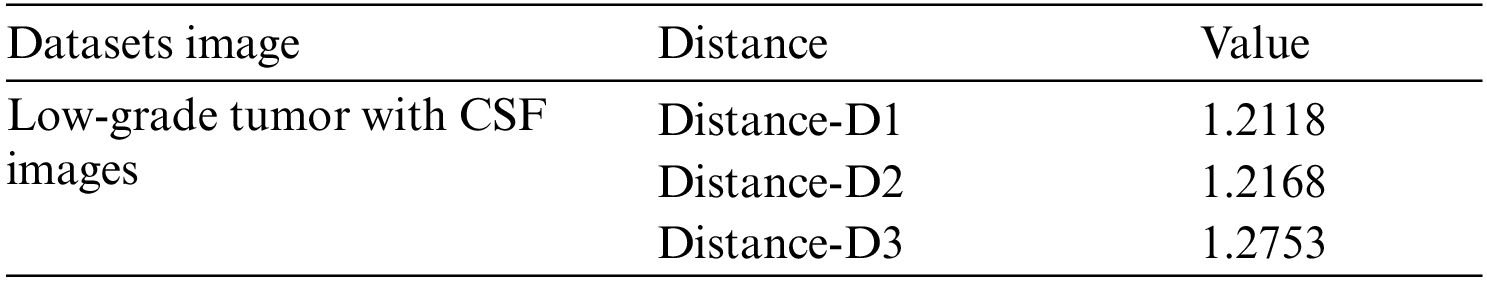
The simulation results of the HMMkC used to detect the range of CSF fluid and low-grade tumor located place in MRI images. Fig. 7 shows all of three datasets of images with the combination of hybrid GCSVM technique to merge with HMMkC technique to show the presence of tumor and CSF fluid that indicate the range of fluid and located the place of low-grade tumor. The classification of HMM for object detection is to consider each state of voxel of 4D MRI datasets to show the tumor or CSF fluid current situation with possible values of presence and absence. For instance, HMM is applied to tracking the segmentation over the time and space can be modeled with the help of transition matrix of both of two states. Fig. 7 represent that the voxel was classified as a low-grade tumor size and CSF fluid leak range at the time (t − 1) and the probability of the low-grade tumor and CSF fluid indicate that the time t is D1 = 0.96, D2 = 0.997, and D3 = 0.993 size. In addition, the HMM compute the posterior distribution of the transition state which is represented by filtering process. One shows the calculate the compute distance and other show the pixel intensity of both as an P(Xt/Xt + 1). The pixel intensity state is applied for the classification of pixel intensity values at the time (t + 1) and show the accuracy values of both tumor and CSF fluid leak in the brain are mentioned in Tab. 5. Furthermore, ICMM are applied over HMM to retrieves the hidden information in the noisy images of trained datasets. The ICMM obtains datasets of images to estimate the ideal coefficients and therefore enables the selection of less visible images after linking the probabilities to each other with the transition matrix variable. Fig. 10 show the simulation results of ICMM to show the clear vision of low-grade tumor and CSF occur in the MRI images after extracting the data in the images. Tab. 6 show the compute accuracy values of ICMM over the HMM results of trained datasets which shows the improve results of the proposed technique. Below the given Figs. 7 and 8 show the experimental results of ICMM over HMM.
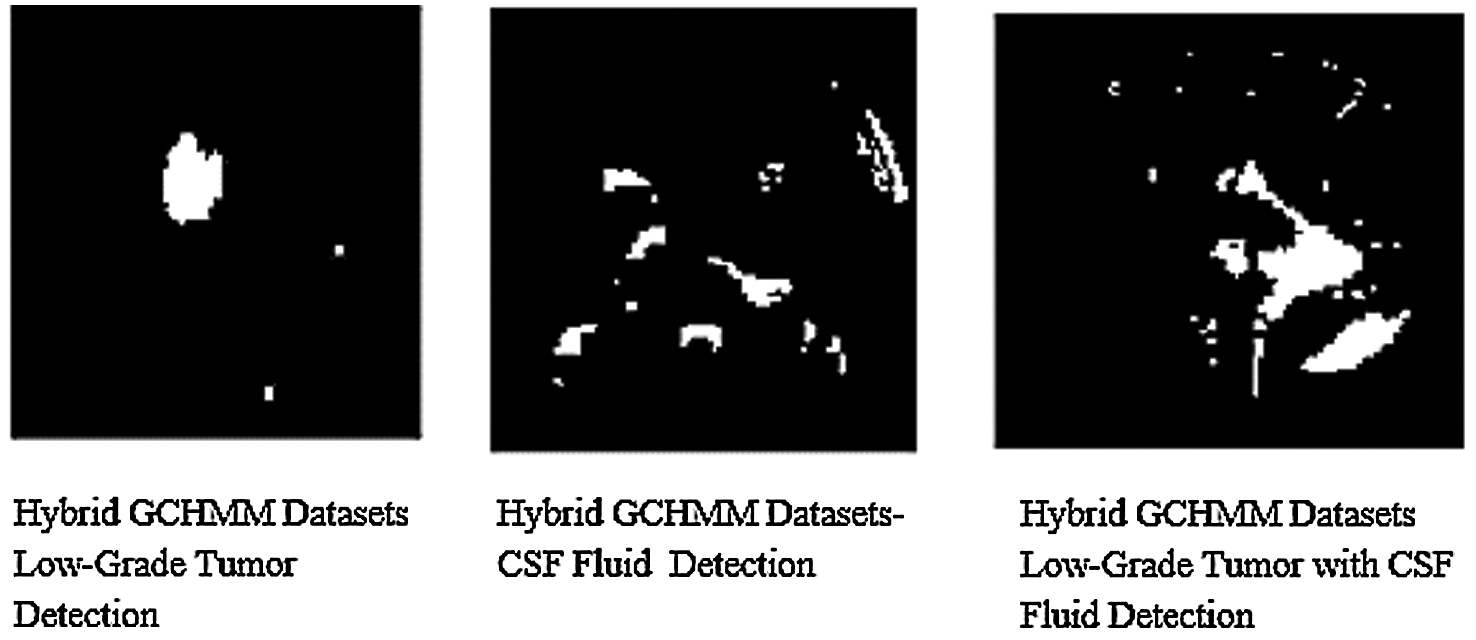
Figure 7: Combination of hybrid GCHMM Low-Grade tumor or CSF fluid detection in MRI images
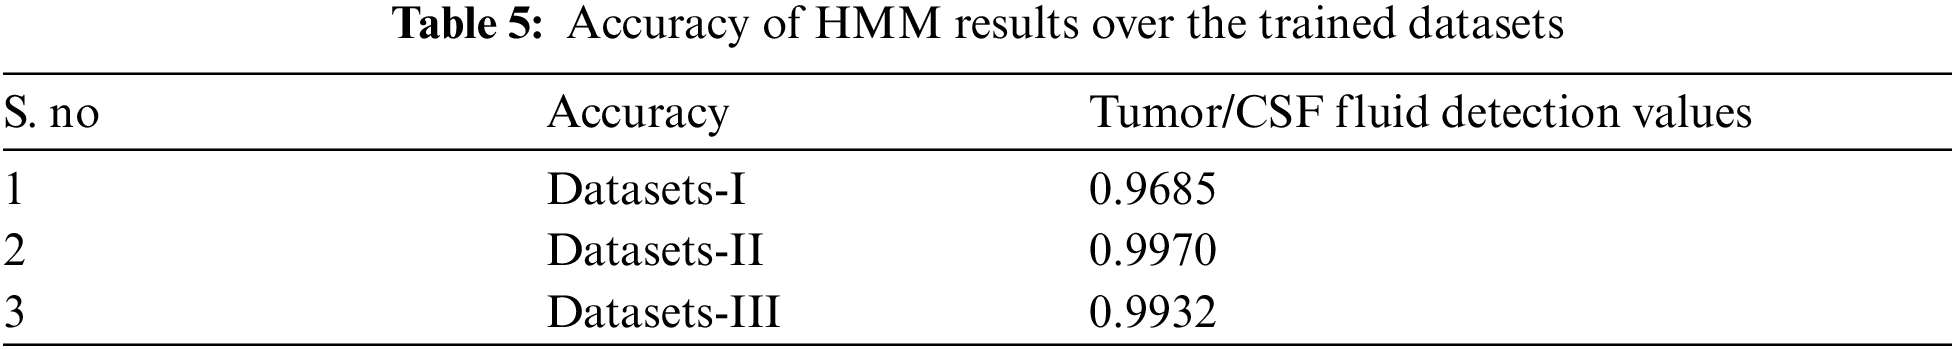
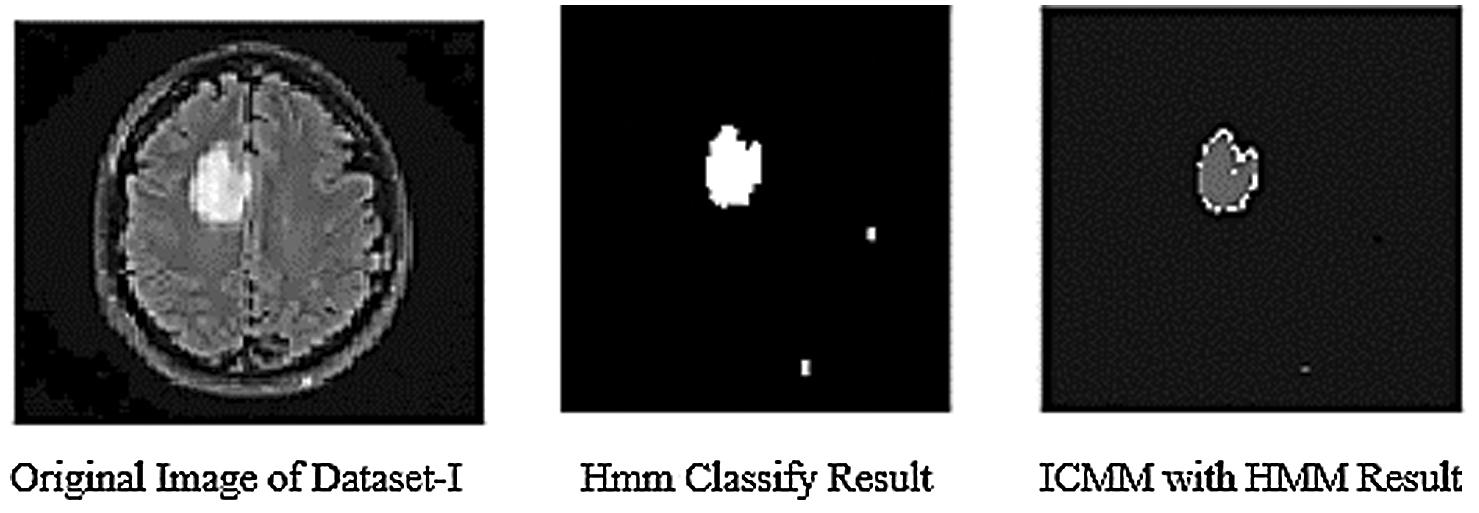
Figure 8: Results of ICMM over HMM classification of datasets
3.5 Proposed Hybrid K-NN Algorithm
The simulation results of the proposed hybrid k-NN algorithm classification of trained MRI datasets. The section of this research is used k-NN method for classification of hybrid GCHMkC technique for test sampling and training the samples of all datasets results. These results obtain the nearest neighbor location to conducting the k-NN classification of proposed hybrid technique. In k-NN algorithm, the values are assigning to the test samples with labels of selected nearest neighbor for each test sample by the setting of the optimal value of k in the training datasets. It is applied for fixed the value of k for all test sample of proposed hybrid technique that have been focused the different value of k with different samples results generate. Below the Tab. 6 show the accuracy, sensitivity and specificity, and computational results mentioned are given below:
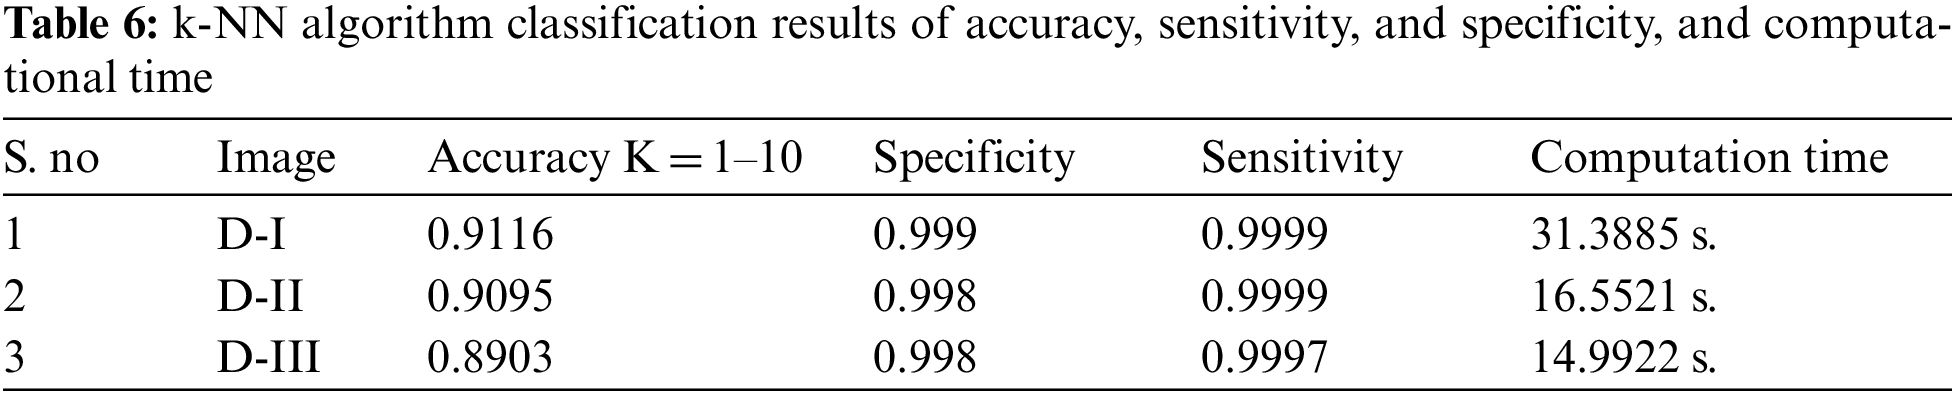
The given below Fig. 9 show the results of all of three database images results which show the k-NN classification with better results.
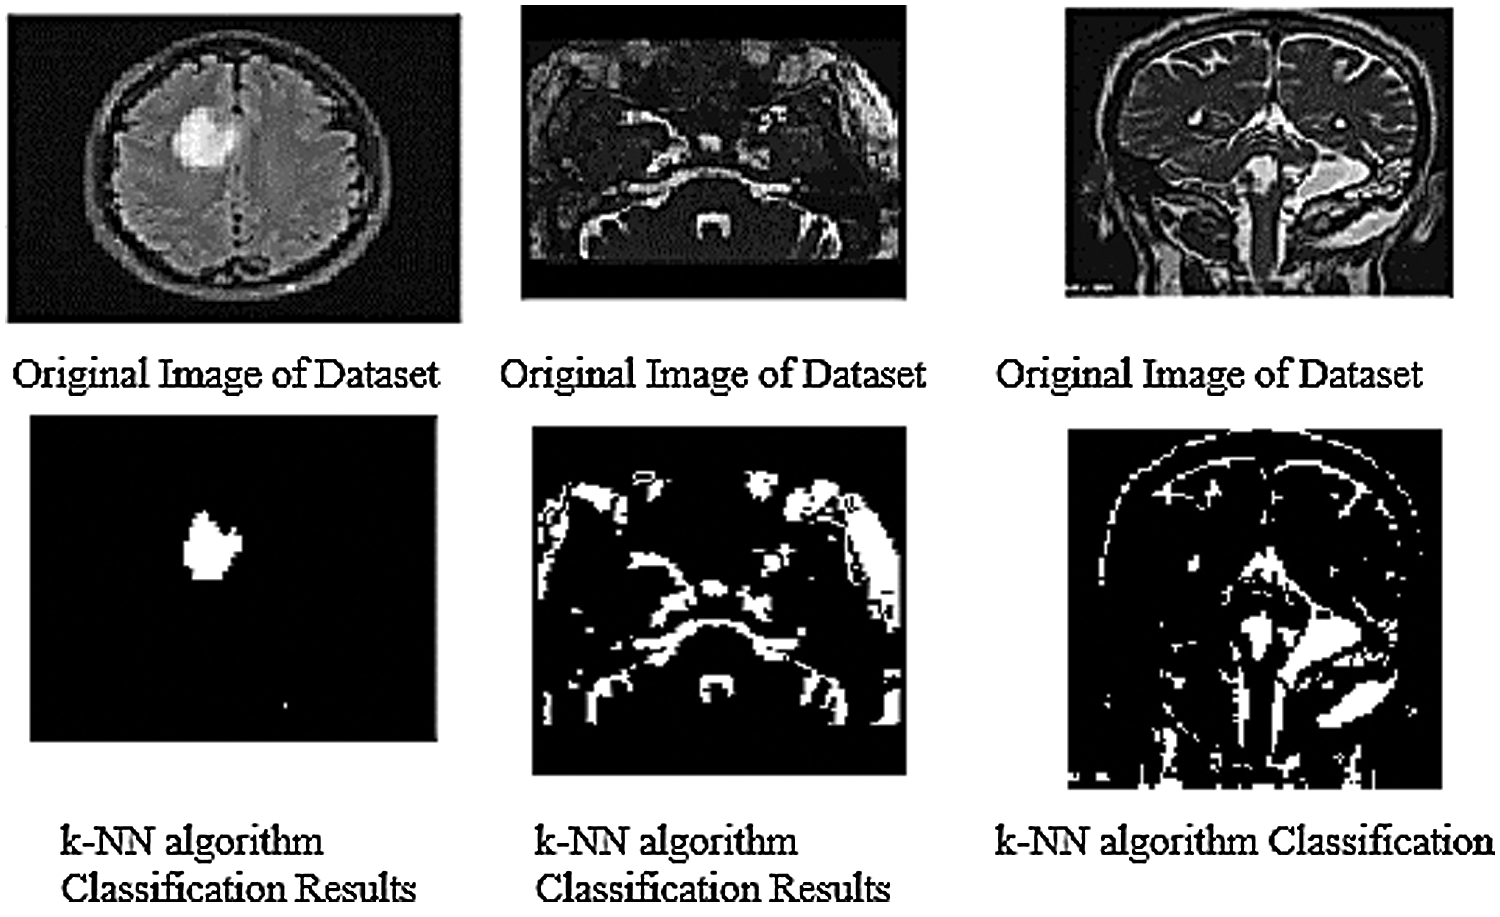
Figure 9: k-NN algorithm classification results of trained datasets images
The above Fig. 10 shows the combination of hybrid GCHMkC technique including four different methods such as SVM classification; Grabcut segmentation, Hidden Markov Model, and k-mean clustering algorithm that is combine together and convert into hybrid model. This hybrid model creates the novel results of hybrid k-NN algorithm classification of low-grade tumor and CSF fluid leak MRI images of accuracy of 91.1%, sensitivity of 99.9%, specificity of 99.9%, and computational time is 14.99 s. These results generate the better accuracy compare than the previous results. These parameters detect tumor, tumor size, identify the location CSF inside the brain. This hybrid model helps them both common man and doctors as well to get easily identify the low-grade tumor and CSF inside the brain and diagnose the tumor in the early stage that will try to save the human life.
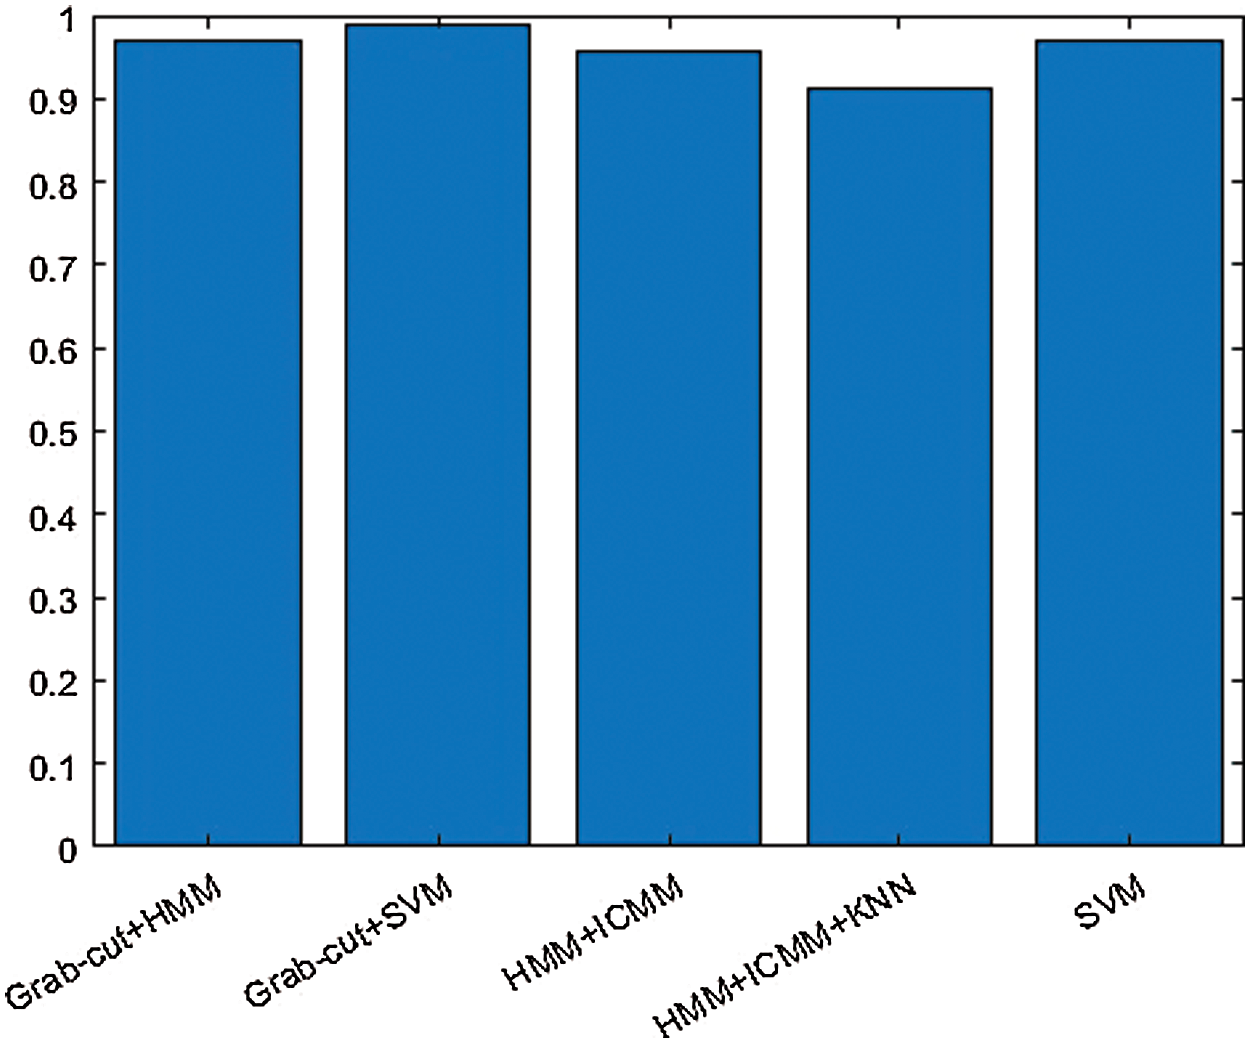
Figure 10: Hybrid k-NN algorithm of proposed technique of GCHMkC
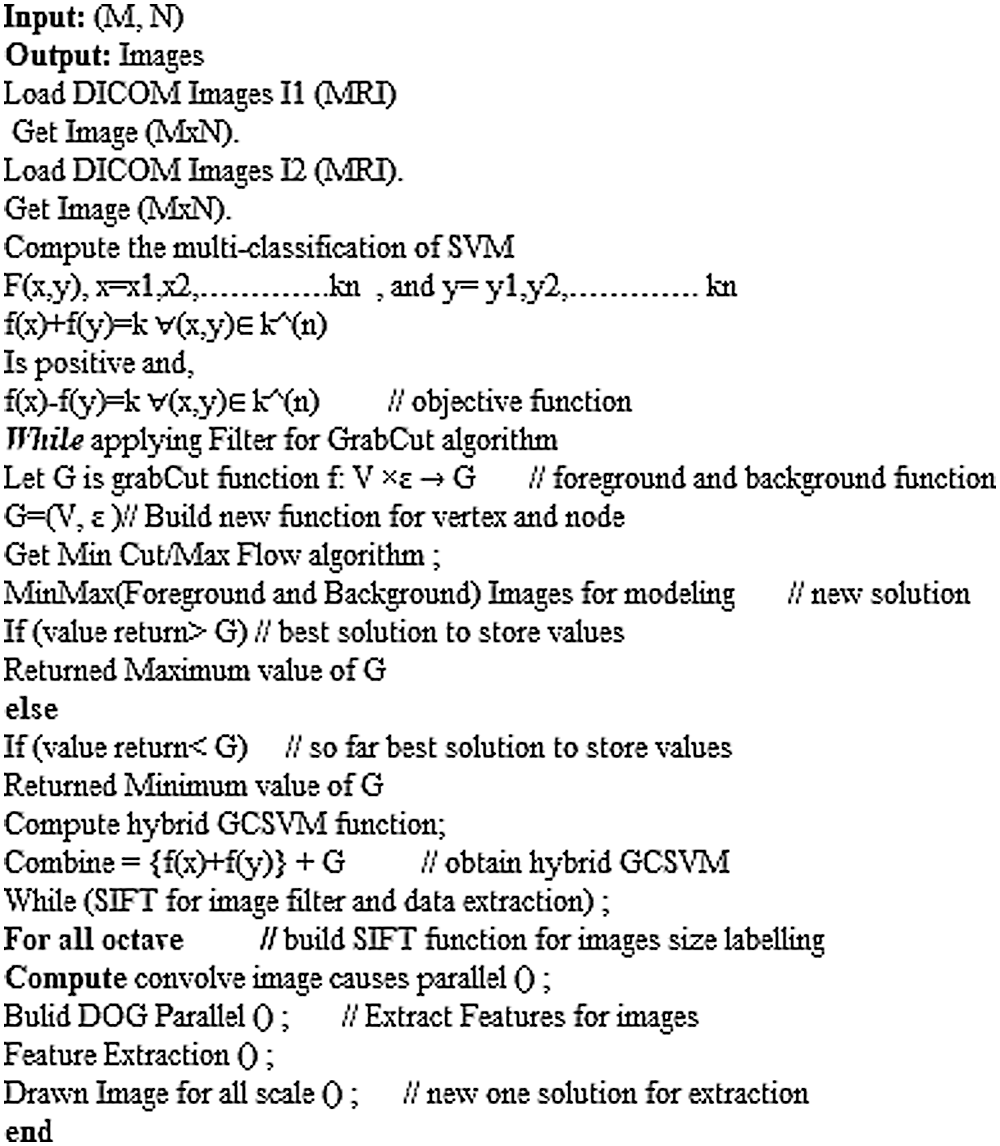
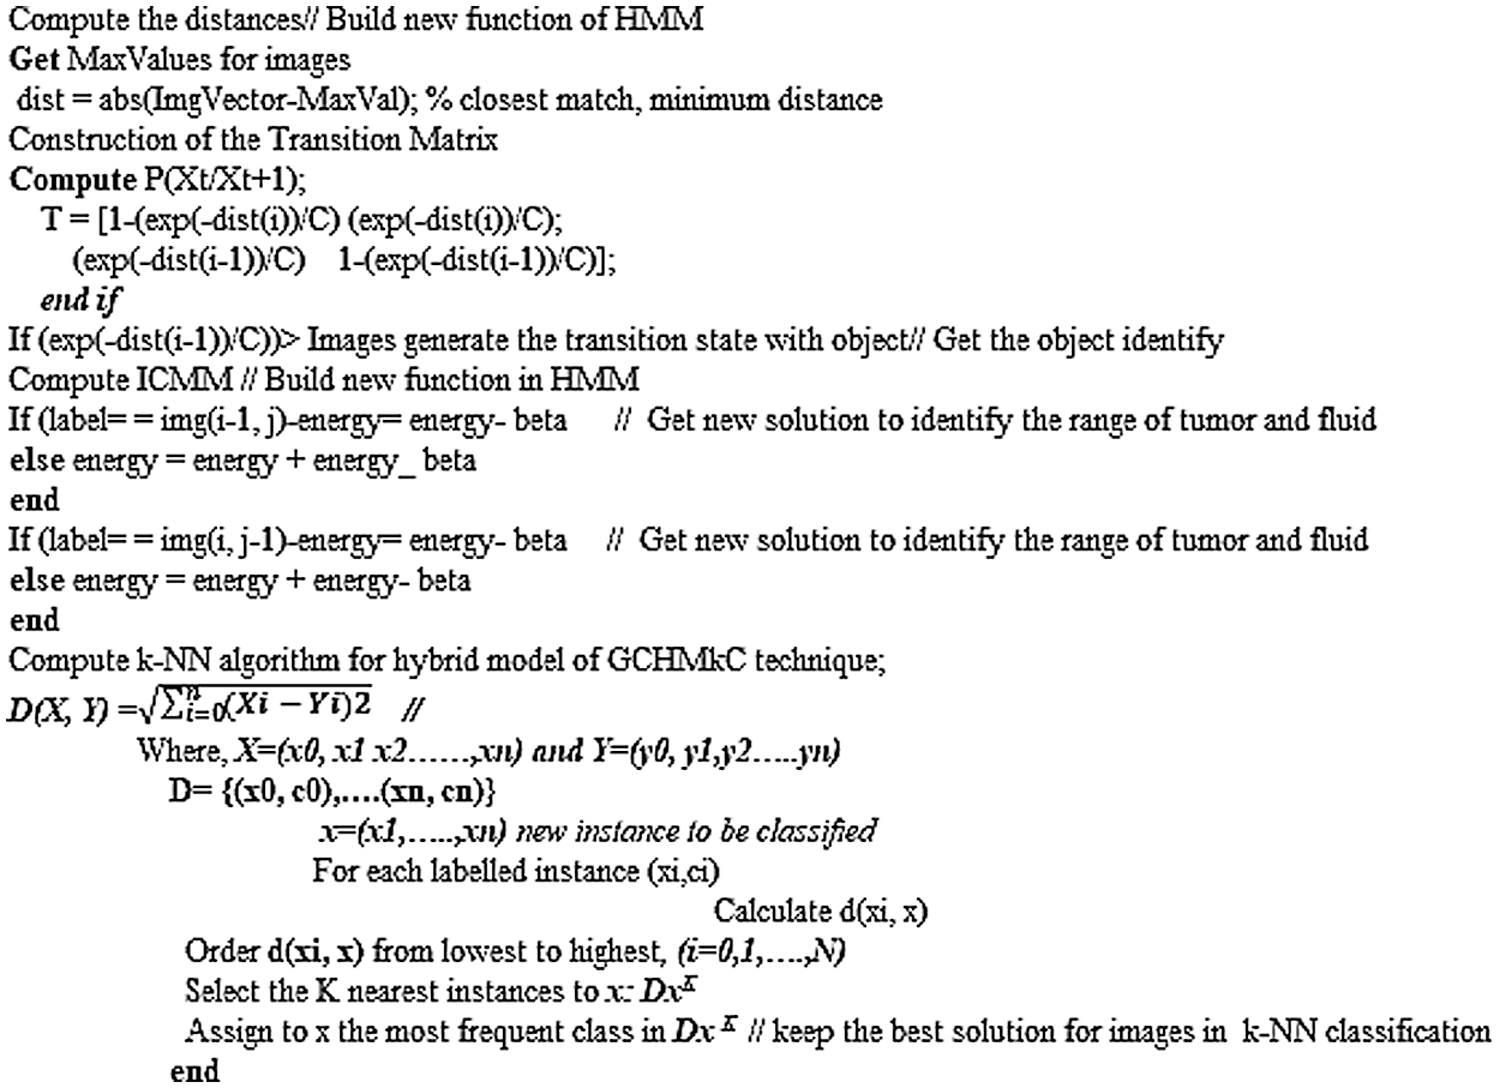
4 Pseudo Code of Hybrid GCHMkC Technique in k-NN Algorithm
The pseudo code of hybrid GCHMkC technique in k-NN algorithm is based on four different methods that combine together in this algorithm to develop this GCHMkC technique is given below:
The technique was implemented on the MRI images of CSF fluid with low-grade tumor to improve the performance on the trained datasets by the proposed technique. The experimental simulations for GCSVM implemented on GrabCut segmentation in trained MRI images and using scale invariant feature transform to extract the data that can HMM refine and reconstruct the images. However, the experimental simulations for HMkC are implemented with ICMM to generate the sequence in the images and join the HMM probability that can identify the range of low grade tumor or CSF fluid liquid in HMM whereas the k-mean store the data of trained MRI images. Furthermore, k-NN algorithm for classification of hybrid GCHMkC technique for test sampling and training the samples of all datasets results which gives the better results which help to pick the nearest position of tumor and CSF fluid easily after implementing this novel technique. The motive of this research is to develop the unique model to identify the low-grade tumor and CSF fluid leak in the initial phase of starting the brain cancer. The sensitivity and specificity is conducted by the method of prevalence of diseases and computational time is the execution time of software which generates these results.
Funding Statement: Taif University Researchers Supporting Project Number (TURSP-2020/98), Taif University, Taif, Saudi Arabia.
Conflicts of Interest: The authors declare that they have no conflicts of interest to report regarding the present study.
1. N. Ali, N. Daniel and T. Paul, “Evaluation of k-nearest neighbor classifier performance for heterogeneous data sets,” SN Applied Sciences, vol. 1, no. 12, pp. 1–15, 2019. [Google Scholar]
2. P. Brynolfsson, N. David, T. Turid, A. Thomas, K. C. Thellenberg et al., “Haralick texture features from apparent diffusion coefficient (ADC) MRI images depend on imaging and pre-processing parameters,” Scientific Reports, vol. 7, no. 1, pp. 1–11, 2017. [Google Scholar]
3. Cruz, S. Shaina, D. Ivo, H. M. Megan, Z. Clio González et al., “Imputation strategy for reliable regional MRI morphological measurements,” Neuroinformatics, vol. 18, no. 1, pp. 59–70, 2020. [Google Scholar]
4. P. Dini and S. Sergio, “Analysis, design, and comparison of machine-learning techniques for networking intrusion detection,” Designs, vol. 5, no. 1, pp. 9, 2001. [Google Scholar]
5. E. Dritsas, T. Maria, G. Panagiotis and S. Spyros, “Trajectory clustering and k-NN for robust privacy preserving spatiotemporal databases,” Algorithms, vol. 11, no. 12, pp. 207–2010, 2020. [Google Scholar]
6. T. Gessert, Nils, “Deep learning with multi-dimensional medical image data,” Ph.D. Thesis, TechnischeUniversität Hamburg, pp. 1–187, 2020. [Google Scholar]
7. S. Soobia, A. Afnizanfaizal and N. Z. Jhanjhi, “Investigation of a brain cancer with interfacing of 3-dimensional image processing,” Indian Journal of Science & Technology, vol. 12, no. 32, pp. 1–6, 2019. [Google Scholar]
8. M. Ibrahim and A. Adnan, “The role of machine learning algorithms for diagnosing diseases,” Journal of Applied Science and Technology Trends, vol. 2, no. 1, pp. 10–19, 2021. [Google Scholar]
9. G. K. Peter, M. D. Michael, A. J. Timothy and G. Linda, “Update on the diagnosis and treatment of spontaneous intracranial hypotension,” Current Pain and Headache Reports, vol. 21, no. 8, pp. 1–8, 2017. [Google Scholar]
10. N. Maleki, Z. Yasser and N. T. A. Seyed, “A k-NN method for lung cancer prognosis with the use of a genetic algorithm for feature selection,” Expert Systems with Applications, vol. 164, no. 1, pp. 113981, 2021. [Google Scholar]
11. E. N. George, S. Debzbrata, K. Manji, F. J. Al-Amr, “Elementary methods for generating three-dimensional coordinate estimation and image reconstruction from series of two-dimensional images,” Mathematical Problems in Engineering, vol.1, no.1, pp. 1–11, 2021. [Google Scholar]
12. G. Niranjana and C. Deya, “Security and privacy issues in biomedical AI systems and potential solutions,” in Handbook of Artificial Intelligence in Biomedical Engineering, vol. 1, no. 1, Apple Academic Press, pp. 289–309, 2021. [Google Scholar]
13. L. Po, B. Nikos, D. Federico and P. George, “Linked data visualization: Techniques, tools, and big data,” Synthesis Lectures on Semantic Web: Theory and Technology, vol. 10, no. 1, pp. 1–157, 2020. [Google Scholar]
14. Osman, H. Ahmed and A. M. Hani, “Diabetes disease diagnosis method based on feature extraction using K-SVM,” International Journal of Advanced Computer Science and Applications, vol. 8, no. 1, pp. 97–102, 2017. [Google Scholar]
15. S. Soobia and A. Afnizanfaizal, “Investigation of a brain cancer with interfacing of 3-dimensional image processing,” in Proc. Int. Conf. on Information Science and Communication Technology (ICISCT), Karachi, Pakistan, pp. 1–12, 2019. [Google Scholar]
16. A. J. Valdes, “Deep Learning in Medical Image Analysis: Alzheimer's Disease Classification & Whole Fetal Brain Segmentation,” Tecnológico de EstudiosSuperiores de Monterrey Ph.D. Thesis, pp. 1–150, 2019. [Google Scholar]
17. S. Zhang, M. Zong, K. Sun, Y. Liu and D. Cheng, “Efficient kNN algorithm based on graph sparse reconstruction,” Advanced Data Mining and Applications, vol.1, no.1, pp. 356–369, 2014. [Google Scholar]
18. H. A. Ramzi, D. Mohamad and M. Mehedi, “An enhanced k-means clustering algorithm for pattern discovery in healthcare data,” International Journal of Distributed Sensor Networks, vol. 11, no. 6, pp. 1–11, 2015. [Google Scholar]
19. J. Liu and L. Guo, “A new brain MRI image segmentation strategy based on k-means clustering and SVM,” in Proc. 7th Int. Conf. on Intelligent Human-Machine Systems and Cybernetics, NW Washington, DC, United States, vol. 2, no. 1, pp. 270–273, 2015. [Google Scholar]
20. L. Yin, S. Jian, T. Chi-Keung and S. Heung-Yeung, “Lazy snapping,” ACM Transactions on Graphics, vol. 23, no. 3, pp. 303–308, 2004. [Google Scholar]
21. S. Soobia, A. Afnizanfaizal and N. Z. Jhanjhi, “Implementation of fourier transformation with brain cancer and CSF images,” Indian Journal of Science & Technology, vol. 12, no. 37, pp. 1–9, 2019. [Google Scholar]
22. A. Sedghi, L. J. O. Donnell, T. Kapur, E. Miller et al., “Image registration: Maximum likelihood, minimum entropy and deep learning,” Medical Image Analysis, vol. 69, no. 1, pp. 101–939, 2021. [Google Scholar]
23. S. N. N. Htun, T. T. Zin and P. Tin, “Image processing technique and hidden markov model for an elderly care monitoring system,” Journal of Imaging, vol. 6, no. 6, pp. 49, 2020. [Google Scholar]
24. C. Chatfield and H. Xing, “The analysis of time series: An introduction with R,” Chapman and Hall/CRC, vol. 7, no. 1, pp. 25–45, 2019. [Google Scholar]
25. S. A. Rahman, Y. Huang, J. Claassen, N. Heintzman and S. Kleinberg, “Combining Fourier and lagged k-nearest neighbor imputation for biomedical time series data,” Journal of Biomedical Informatics, vol. 58, no. 1, pp. 198–207, 2015. [Google Scholar]
26. M. Pazhoohesh, Z. Pourmirza and S. Walker, “A comparison of methods for missing data treatment in building sensor data,” in Proc. 2019 IEEE 7th Int. Conf. on Smart Energy Grid Engineering, Oshawa, Canada, pp. 255–259, 2019. [Google Scholar]
27. G. Guo, H. Wang, D. Bell, Y. Bi and K. Greer, “KNN Model-based approach in classification,” in Proc. OTM Confederated Int. Conf. on the Move to Meaningful Internet Systems, Berlin, Heidelberg, Springer, pp. 986–996, 2003. [Google Scholar]
28. F. N. Al-Wesabi, S. Alzahrani, F. Alyarimi, M. Abdul, N. Nemri et al., “A reliable NLP scheme for English text watermarking based on contents interrelationship,” Computer Systems Science and Engineering, vol. 37, no. 3, pp. 297–311, 2021. [Google Scholar]
29. M. Negar, Y. Zeinali, and S. T. A. Niaki, “A k-NN method for lung cancer prognosis with the use of a genetic algorithm for feature selection,” Expert Systems with Applications, vol. 164, no. 1, pp. 113981, 2021. [Google Scholar]
30. M. A. Khan, A. Ullah, S. Khan, M. Ali, S. Khan et al., “A novel fractional-order variational approach for image restoration based on fuzzy membership degrees,” IEEE Communications Magazine, IEEE Access, vol. 9, no. 1, pp. 43574–43600, 2021. [Google Scholar]
31. K. Machhale, H. B. Nandpuru, V. Kapur and L. Kosta, “MRI brain cancer classification using hybrid classifier (SVM-KNN),” in 2015 Int. Conf. on Industrial Instrumentation and Control (ICIC), Pune, India, IEEE, pp. 60–65, 2015. [Google Scholar]
32. M. J. Leo, “MRI brain image segmentation and detection using K-NN classification,” in Journal of Physics: Conf. Series, vol. 362, no. 1, pp. 1–12, 2019. [Google Scholar]
33. G. Garg and R. Garg, “Brain tumor detection and classification based on hybrid ensemble classifier,” ArXiv Preprint arXiv, vol. 6, no. 1, pp. 1–16, 2021. [Google Scholar]
34. M. Negar, Z. Yasser and A. N. Seyed, “A k-NN method for lung cancer prognosis with the use of a genetic algorithm for feature selection,” Expert Systems with Applications, vol. 164, no. 1, pp. 11–39, 2021. [Google Scholar]
35. Z. Yu, H. Chen, J. Liu, J. You, H. Leung et al., “Hybrid k-nearest neighbor classifier,” IEEE Transactions on Cybernetics, vol. 46, no. 6, pp. 1263–1275, 2015. [Google Scholar]
36. P. Nair and I. Kashyap, “Optimization of kNN classifier using hybrid preprocessing model for handling imbalanced data,” International Journal of Engineering Research and Technology, vol. 12, no. 5, pp. 697–704, 2019. [Google Scholar]
37. N. Salari, S. Shohaimi, F. Najafi, M. Nallappan, and I. Karishnarajah, “A novel hybrid classification model of genetic algorithms, modified k-nearest neighbor and developed back propagation neural network,” PLoS One, vol. 9, no. 11, pp. 1–14, 2017. [Google Scholar]
 | This work is licensed under a Creative Commons Attribution 4.0 International License, which permits unrestricted use, distribution, and reproduction in any medium, provided the original work is properly cited. |