DOI:10.32604/cmc.2022.023935
| Computers, Materials & Continua DOI:10.32604/cmc.2022.023935 | |
| Article |
An Adaptive Classifier Based Approach for Crowd Anomaly Detection
School of Computer Science and Engineering, Vellore Institute of Technology, Chennai, 600 127, India
*Corresponding Author: P. S. Nithya Darisini. Email: psnithyadarisini@vit.ac.in
Received: 27 September 2021; Accepted: 20 December 2021
Abstract: Crowd Anomaly Detection has become a challenge in intelligent video surveillance system and security. Intelligent video surveillance systems make extensive use of data mining, machine learning and deep learning methods. In this paper a novel approach is proposed to identify abnormal occurrences in crowded situations using deep learning. In this approach, Adaptive GoogleNet Neural Network Classifier with Multi-Objective Whale Optimization Algorithm are applied to predict the abnormal video frames in the crowded scenes. We use multiple instance learning (MIL) to dynamically develop a deep anomalous ranking framework. This technique predicts higher anomalous values for abnormal video frames by treating regular and irregular video bags and video sections. We use the multi-objective whale optimization algorithm to optimize the entire process and get the best results. The performance parameters such as accuracy, precision, recall, and F-score are considered to evaluate the proposed technique using the Python simulation tool. Our simulation results show that the proposed method performs better than the conventional methods on the public live video dataset.
Keywords: Abnormal event detection; adaptive GoogleNet neural network classifier; multiple instance learning; multi-objective whale optimization algorithm
Conventional video monitoring techniques depend on a human operator to monitor and control the situations for unexpected and abnormal occurrences. Hence, a lot of effort has gone into anomalous incident identification in video monitoring. The modern improvements have positive effect on cost saving in labor [1]. Because of the rising concerns about social security and protection, anomalous incident identification is extensively investigated in computer vision as one of the essential methodologies in smart video sequences. Surveillance cameras are installed in several public places, like campuses, shopping centers, airports, railway stations, subways, and plazas for safety and security reasons. Automatic monitoring techniques are frequently utilized to extricate object-level characteristics like location, size, velocity, and trajectories for every moving object to identify irregularities in places with dense populations of moving objects. The strange entity is then determined based on these characteristics. The efficiency of machine-learning algorithms suffers in congested areas because of the momentary losses of an object as it is hidden from camera vision. Effective extraction of features of the obstacles or hinderances is a significant issue in object-level approaches. We need a strategy that can continue to function well in crowded systems with varying over crowdedness of the target environment [2].
The necessity for automatic detection and segmentation of sequences of relevance has arisen. Current technology necessitates a significant amount of configuration work on every video feed just before implementing the video analysis phase. Those occurrences are focused on predetermined heuristic algorithms complicating the detection approach and making it tougher to generalize it to the various surveillance scenarios [3]. The growing interest in video surveillance systems for public security has prompted researchers to look into crowd abnormality detection [4]. There are two fundamental reasons why detecting abnormalities are complex. For instance, the number of databases having ground truth anomaly data is limited. It's especially true for deep-learning-based algorithms that have demonstrated substantial efficiency gains in various other classification methods but are data-hungry. The lack of a precise and accurate description of abnormalities is the second cause. Furthermore, those two issues are linked since anomaly definition variability renders anomaly ground truth collection which is very difficult [5]. Hence, this article proposes a unique method for anomalous incident identification in crowded scenes employing deep learning approaches.
The remaining portion of the article is structured as follows: Section 2 provides the literary works associated with this paper. Section 3 describes the proposed flow. Section 4 analyzes the behavior of the recommended approach and compares it with the conventional methodologies. And, finally, Section 5 concludes the overall objective of the paper.
In [6] the author proposed a new notion called reference event, which denotes probable event sequences in ordinary video occurrences. Regular occurrences are more likely to resemble such reference events than strange happenings. Smoothness regularization, on the contrary, is used to characterize the relations between video occurrences. Resemblances in the feature space and spatial arrangement in the surveillance videos are utilized to form the associations. Video occurrences that are connected are more prone to having interpretations in this situation. An incremental update technique is used to optimize the hierarchical dictionary and sparse representation parameters. During the testing stage, strange occurrences are recognized as examples that the learnt vocabulary cannot adequately represent. In paper [7], Ramchandran presented an efficient untrained deep learning architecture for video abnormality identification. Raw image patterns are mixed with edge image sequence and fed into the Conv LSTM model of the convolutional autoencoder. The suggested approach is evaluated experimentally using three independent benchmark datasets. In contrast to conventional techniques, the presented technique of Hybrid Deep Learning Architecture for Video Anomaly Detection (HDLVAD) achieves higher efficiency. The next step in the research is to look into video streaming in the context of big data.
In surveillance videos, the authors in the paper [8] suggested a hybrid swarm intelligence-dependent technique to address the challenge of abnormal incident identification in congested surroundings. As a result, the 2D variance plane is partitioned into salient and non-salient clusters using an enhanced Ant Colony Optimization (ACO) clustering technique. Lastly, a unique predator-prey method is devised, in which attackers are directed over the prey scores in the chosen cluster to estimate the Histogram of Swarm (HOS) for a video sequence. In their trials, the suggested methodology outperformed the recent advancements on two widely employed sets of data namely the UMN crowd abnormality database and the UCF web database. Zhang in his paper [9] established a novel Low-Rank and Compact Coefficient Dictionary Learning (LRCCDL) approach for anomalous activity identification in populated settings. To identify malicious frames, a Reconstruction Cost (RC) is implemented. Experimental tests demonstrate the efficacy of this method on both international and domestic anomalous action recognition. The suggested approach produces comparable detection results as compared to the conventional techniques utilizing multiple criteria. Beya in his paper [10] developed an automatic vision-based monitoring strategy for abnormal events identification and localization in congested areas. The Deep One-Class (DOC) framework, developed by the authors in [11] is a revolutionary end-to-end design that incorporates the one-class Support Vector Machine (SVM) into a Convolutional Neural Network (CNN). To improve the characteristics of such a system, a stable loss function generated from a one-class SVM is presented. In contrast to hierarchical models, this design not only reduces the complexities of the procedure but also achieves the worldwide optimum solution for the entire process.
Wang in his paper [12] presented the Abnormal Event Detection network (AED-Net), a self-supervised architecture consisting of a Principal Component Analysis Network (PCANet) and kernel principal component analysis (kPCA). The PCANet is developed to retrieve higher-level semantics of the crowd's scenario utilizing surveillance footage sequence from multiple scenes as raw data. Then, to find abnormalities in the image, kPCA, a one-class classifier, is developed. Unlike specific deep learning techniques, this architecture is self-trained as it only uses video frames from everyday life. Moreover, they proposed that the initial AED-Net can be modified by incorporating the Local Response Normalization (LRN) layer. The experiments demonstrated that the proposed version outperforms the original by enhancing the framework's generalization ability. Lee in his paper [13] introduced a novel Spatio-Temporal Adversarial Network-based anomalous event detection approach (STAN). They created a Spatio-temporal generator that uses bidirectional Conv LSTM to synthesize an inter-frame by evaluating Spatio-temporal properties. With 3D convolutional layers, the suggested Spatio-temporal discriminator decides if an incoming frame is normal or not. Those two networks are trained to successfully encode Spatio-temporal aspects of stable structures in an adversarial manner. The generator and discriminator shall be utilized as identifiers after the learning process. They detect variations from the already taught regular structures concluding as anomalies.
Chen in his paper [14] described a new approach for detecting aberrant behavior in crowded environments. The motion energy framework depicts the local motion pattern in the crowd statistical data of low-level characteristic flow that effectively represents body motion. The framework emphasizes the contrast between normal and aberrant behaviors by examining the Sum of Square Differences (SSD) measure of movement information in the central and nearby blocks. Nevertheless, a rising data rate is employed to eliminate aberrations and attain boundary values between anomalous and typical movement patterns. Aberrant behavior is recognized in this framework if the chance of the abnormality occurring is more than a predetermined threshold, i.e., the motion energy score of the associated block is higher than the usual one.
Ma in his paper [15] suggested a partially supervised learning method for video anomalous event identification and positioning that only uses regular samples to train the detection algorithm. Considering that the propagation of every typical instance is Gaussian, the abnormal model may appear in this Gaussian distribution with a reduced probability. The method depends on the Variational Auto Encoder (VAE) that restricts the hidden unit representations of the regular sample to a Gaussian distribution utilizing an end-to-end deep learning model. The variational autoencoder is used to derive the test sample's hidden layer representations that indicate the likelihood of conforming to the Gaussian distribution. The recognition threshold determines whether it is abnormal or normal event.
To identify abnormal occurrences, the authors in [16] suggested an Anomaly-introduced Learning (AL) technique. With regular and aberrant video data, a graph-dependent Multi-Instance Learning (MIL) framework is created. The MIL approach generates a set of possibly aberrant examples by a simple classifier. Such samples are utilized to increase dictionary learning also referred to as Anchor Dictionary Learning (ADL). The anomaly is measured using the Sparse Reconstruction Cost (SRC). At first, they leverage aberrant data and secondly prune testing samples with coarse filtering. This lowers the time cost of estimating SRC when compared to the existing techniques. Experiments show how the suggested ADL technique affects competitive results. Anomalous incident identification was defined as a one-vs.-rest binary categorization issue by Khan in his paper [17]. They make a two-fold commitment. Initially, they present an unsupervised feature learning system that encodes both movement and aesthetic data using object-centric convolutional auto-encoders. Secondly, they offer a trained categorization method depending on its normality by grouping the training instances. The normalcy clusters are then separated from the rest using a one-vs.-all aberrant event classifier. The other groups serve as dummy abnormalities for the classifier's training. If the best classification value provided by the one-vs.-rest classifiers is negative, an item is designated as aberrant during interpretation.
To solve the challenge of abnormal action recognition, Ding in his paper [18] suggested an unsupervised architecture. Lower-level characteristics and Optical Flows (OF) of surveillance videos are collected to describe motion data in the video frame. Furthermore, aberrant events frequently take place in local places and are spatially connected to their surroundings. Its initial stage is to compute OF patterns and partition them into a series of non-overlapping sub-maps to obtain higher-level data from local areas and represent the relationships in the feature space. Related PCANet models are trained after utilizing the sub-maps in the OF maps at the same spatial position. A series of one-class classifiers are developed to forecast the abnormal values of test frames using the block-wise histograms derived by the PCANet model. The architecture is entirely uncontrolled since it uses regular films. In the paper [19] the network is trained by using a transfer learning method. To learn spatial level appearance characteristics for abnormal and normal patterns, a CNN-based VGG16 pre-trained model was employed. Anomalies may be discovered using either a homogeneous or a hybrid method. Pre-trained networks are used to fine-tune CNN for each dataset in a homogenous manner. Pre-trained networks are used to fine-tune CNN on one dataset, whereas hybrid approaches employ them to fine-tune CNN on the second dataset as well.
Poor contrast, noise, and the tiny size of the flaws may make finding individuals difficult. In order to measure the quality of detection, it is necessary to have complete information about the defect's geometry. In the paper [20] the method of detecting and tracking unexpected occurrences in scenes is made easier with the development of the two new techniques. First, they used the Gaussian Mixture Model (GMM) method to gather statistical models of the element for each person throughout the temporal monitoring of several individuals. Later they enhanced this technique for seeking and tracking large crowds namely Improved Gaussian Mixture Model (IGMM). The authors have used two techniques for optical flow representation namely the Lucas and Kanade (LK) differential method and the Horn Schunck (HS) optical flow estimate method. The authors developed a new descriptor called the Distribution of Magnitude of Optical Flow (DMOF) to detect abnormal occurrences in video surveillance footages. In [21] the authors proposed to extract spatiotemporal characteristics from video sequences and utilize the deep learning method to identify anomalous events. Saliency Information (SI) of video frames represents the features in the spatial domain since human eyes are drawn to aberrant occurrences in video sequences. The temporal domain Optical Flow (OF) of the video sequences is considered essential. Multi-scale Histogram Optical Flow (MHOF) via OF may be used to derive precise motion information. The spatiotemporal characteristics of the video frames are created by fusing MHOF and SI. When it comes to anomalous event detection, a deep learning network called PCANet is used. It has been observed that UMN dataset [22] has been implemented in most of the above works which includes the proposed work as well.
Anomaly detection has grown in importance in the computer vision and pattern recognition fields in recent years. The primary problem is the wide variety of anomalous event settings. Determining an interface that spans the range of potential anomalous occurrences is challenging. As a result, the statistical processing of unusual occurrences may be defined as those that exhibit deviation from the regular expectations and are not consistent with the normal samples, which is a typical solution. Anomaly detection techniques may be generally split into two stages namely event representation and anomaly detection model. In event representation, relevant elements are extracted from the video to depict the occasion. As a result of the ambiguity in event description, the event may be classified as having either object-level or pixel-level properties. Images of sports history and sports energy are examples of the former, which utilize object trajectory features and object appearance traits to signify an event. There are a lot of obstacles that obstruct each other's view when using object-level features, which makes it tough to manage busy scenes. Pixel-level characteristics, such as Spatio Temporal Gradient (STG), Histograms of Optical Flow (HOF), and a Mixture of Dynamic Textures (MDT), are often derived from two-dimensional image blocks or three-dimensional video cubes according to their representation.
A model for anomaly detection must be constructed once the event characteristics have been obtained. Detecting anomalies requires creating rules or models for everyday occurrences. When a test result deviates from the model or violates the guidelines, it is deemed as an exception. Cluster-based detection models, state inference detection models, and sparse reconstruction detection models are some of the examples. The cluster-based detection approach, for instance, groups together normal events that are related in some way. As a result, during the testing phase, samples located outside of the cluster centers are deemed anomalous. The assumption is that the state inference model predicts a constant shift in normal occurrences for a longer duration. According to sparse reconstruction detection models, the fundamental concept is that normal events have a modest inaccuracy in comparison to abnormal occurrences. These approaches have shown promise in earlier research. However, there is a design flaw in such approaches since the event representation and anomaly detection models were developed independently. These procedures require a great deal of study time and effort to develop them individually, yet the techniques frequently fail. Generalization ability is weak when the video picture changes. Object identification, object detection, behavior recognition and health diagnosis have all been benefited greatly from the overwhelming performance of the deep learning methodology. Since the two stages of feature representation and pattern recognition are intertwined, deep learning techniques are most successful when they are used in conjunction with each other to maximize the performance of the model. It has the potential to enhance the method's generalizability in many situations. Researchers started to use deep learning in abnormal event detection due to its effectiveness and its efficiency. Hence, we propose a novel approach for abnormal event detection in crowded scenes using an Adaptive Google Net Neural Network classifier. Also, to enhance the accuracy in this abnormal event detection, we employ Multi-Objective Whale Optimization Algorithm. Our contributions in this work are:
• A novel classification approach for detection of abnormal events in crowded scenes using Adaptive Google Net Neural Network classifier.
• Integration of a multi-objective whale optimization algorithm for accurate detection of the abnormal frames classified by the classifier.
This section explains the flow of the proposed work. The schematic representation of the proposed work is depicted in Fig. 1. In this approach, for frame-level evaluation indicators, initially the abnormal features are classified using the Adaptive Google Net Neural Network Classifier followed by the Multi-Objective Whale Optimization Algorithm for its identification.
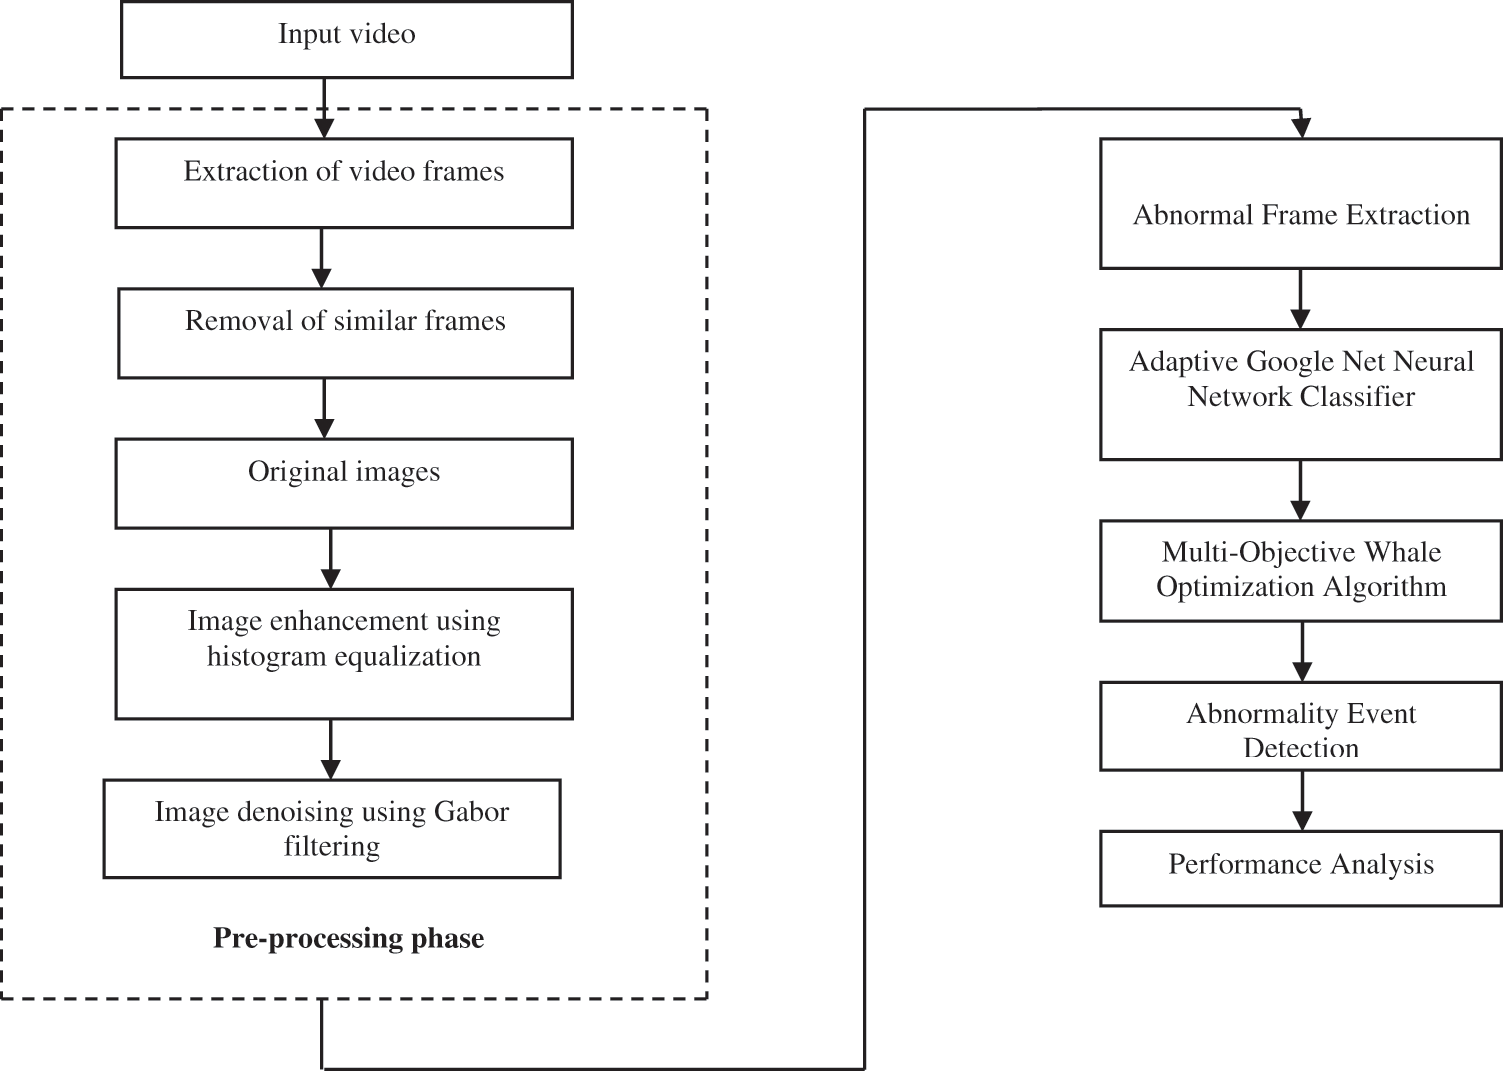
Figure 1: Flow of the proposed method
A histogram is a visual representation of the probability density function of a specific type of information. An image histogram is a graphical depiction of the spectral propagation of grey values in a digitized image. The histogram can determine the frequency of existence of the different grey values in the pictures. The histogram of a digitized image with luminance degree in the interval [0, L – 1] is a continuous function. It is provided by,
Here
where
Here, j = 0, 1,…, t and
Here j = (t + 1), (t + 2),…, (J − 1) and
Transform functions concerning cumulative density functions:
Transform function of the images is given by Transform Function (TF):
The above-indicated image with a Transform Function (TF) is later processed through a Gabor filter for denoising, leading to a final enhanced image. Gabor filters are especially effective in representing and discriminating between different textures. Gabor filters exhibit optimum localization properties in both spatial and frequency domain. Hence, they are used for motion analysis in abnormal event detection. The Gabor filter effectively defines images energy transfer and denoising because it utilizes frequencies and directional representations to differentiate and define the image texture. The Gabor filter of the
Here, c indicates the scale parameter,
where (a, b) represents the input matrix of the low-frequency component. Now, the Gabor energy of every scale
3.2 Adaptive Google Net Neural Network Classifier
The current deep learning framework increases the neural network's efficacy by extending the layers. The computational complexity of this concept increases dramatically as the layer goes more profound, which is a severe flaw. Google proposed the inception architecture known as Google Net. The interior surface of the neural networks was expanded to output numerous correlation propagations. The heart of this architecture is built on the notion that obtaining diverse likelihood functions with significant correlation with the input data optimizes the neural network outputs of every layer. The results are pooled into a unified data set in the fundamental inception v1 component whereas here the input data is given into four distinct stages (1 × 1, 3 × 3, 5 × 5 convolution units, and 3 × 3 max pooling unit).
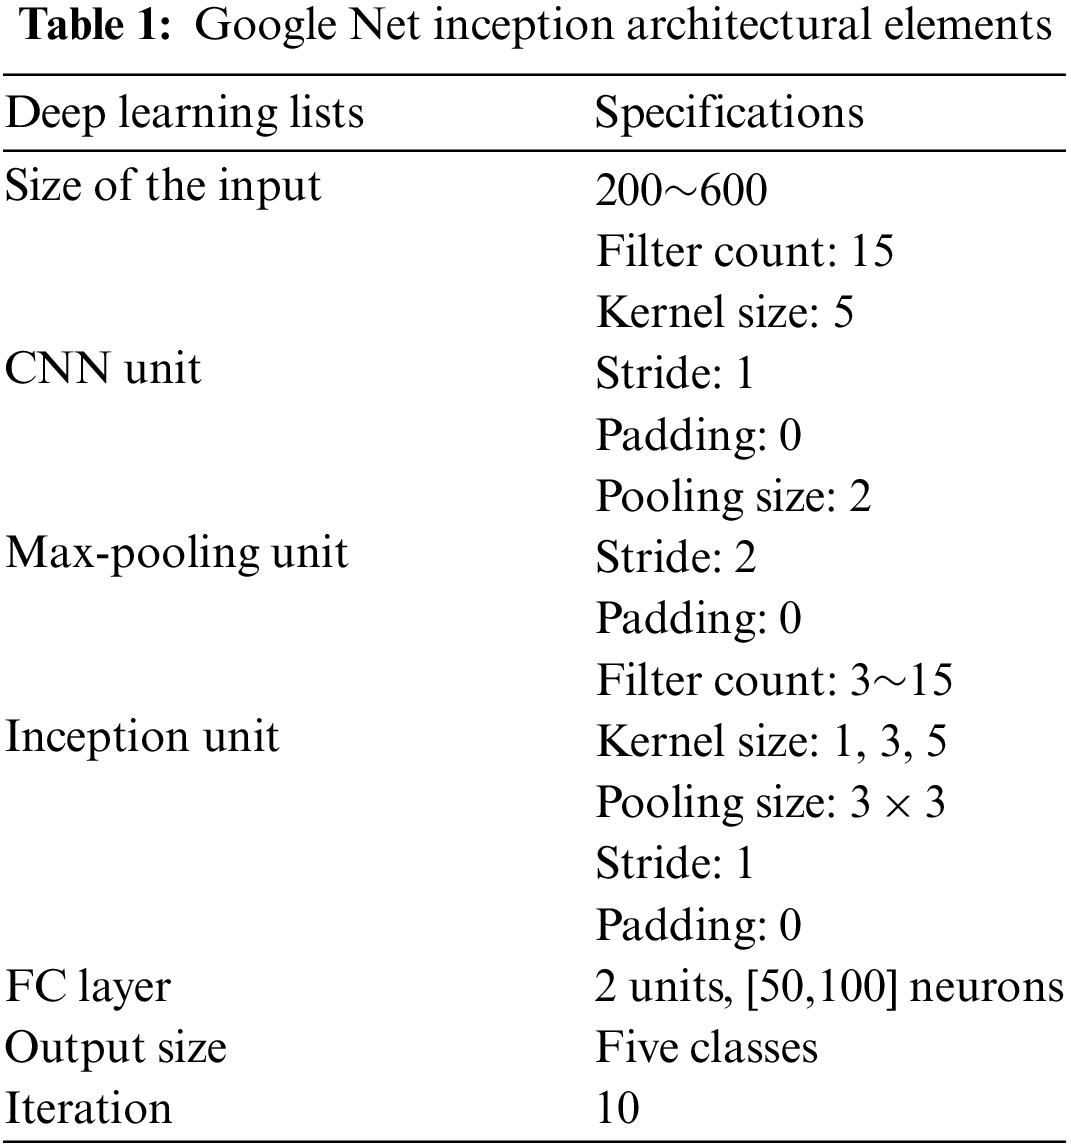
There are totally eleven layers in the proposed architecture of adaptive GoogleNet neural network classifier. The layers include one layer for input, four convolution layers, three pooling layers, one mapping layer, one-fully connected layer and one output layer. The convolutional units collect diverse spatial data from the input information, while the max-pooling unit reduces the channels and sizes of the input information to extract discrete characteristics. The inception component is a means of extricating massive data into a small depth. The inception architecture has been changed to version 4 at this time. V1 has a slightly elongated form. This method uses the v1 framework to build three CNN units, an activation unit, and a max-pooling unit. In this classifier, the abnormal frames and the normal frames are passed into a number of layers, where they are verified and checked for abnormalities. This classifier helps to classify the abnormal frame by using the adaptive inception unit which can identify the abnormality in the video frames. The processing time of this classifier is very fast and the abnormalities can be detected rapidly. The frame is classified as an abnormal frame even if it contains at least one abnormal pixel in the test sample. The architecture of the adaptable Google Net Neural Network Classifier is shown in Fig. 2. Tab. 1 presents the developed incessant model's aggregate characteristics and the pooling layer's specifications. The system with the most extensive accuracy parameter is the one wherein the kernel size was increased to nine inception components.
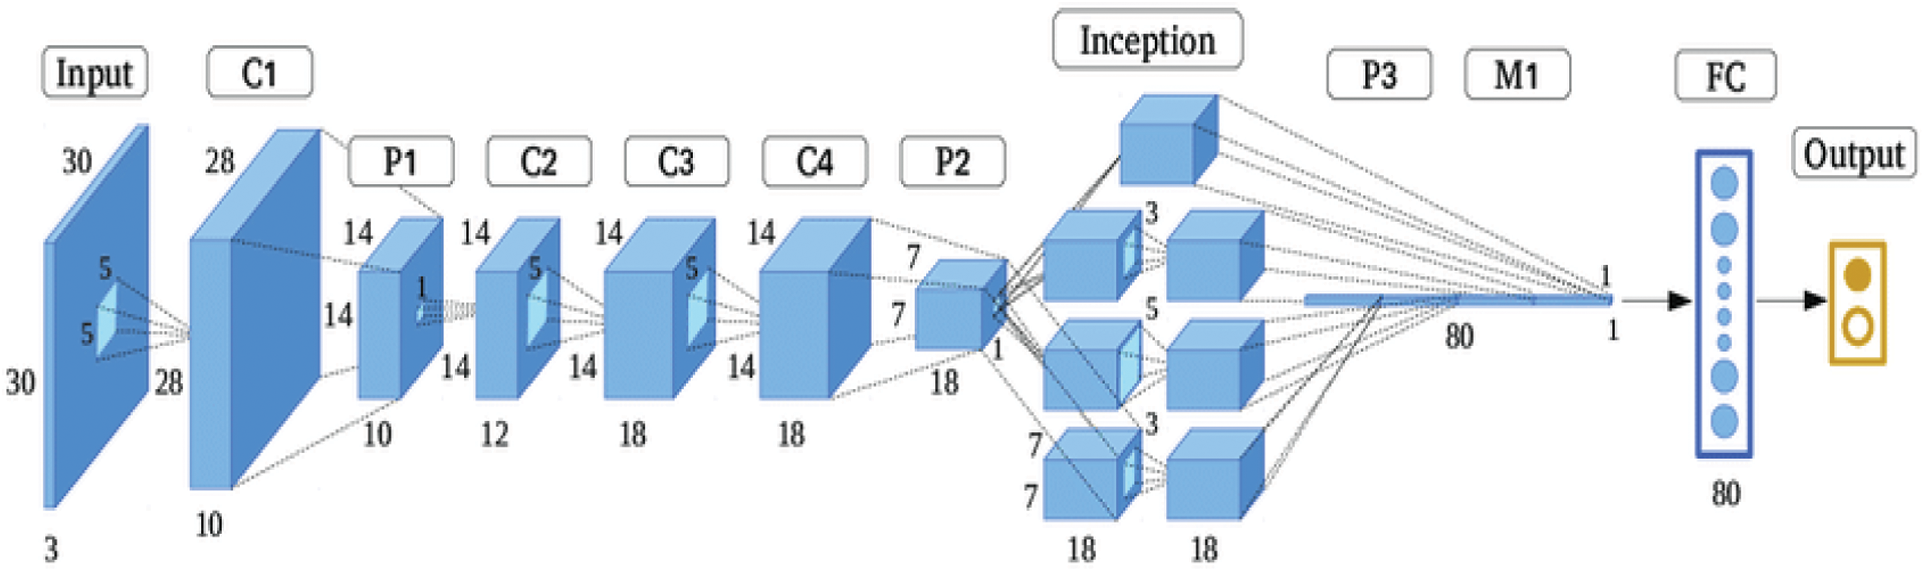
Figure 2: Architecture of adaptive Google Net neural network classifier
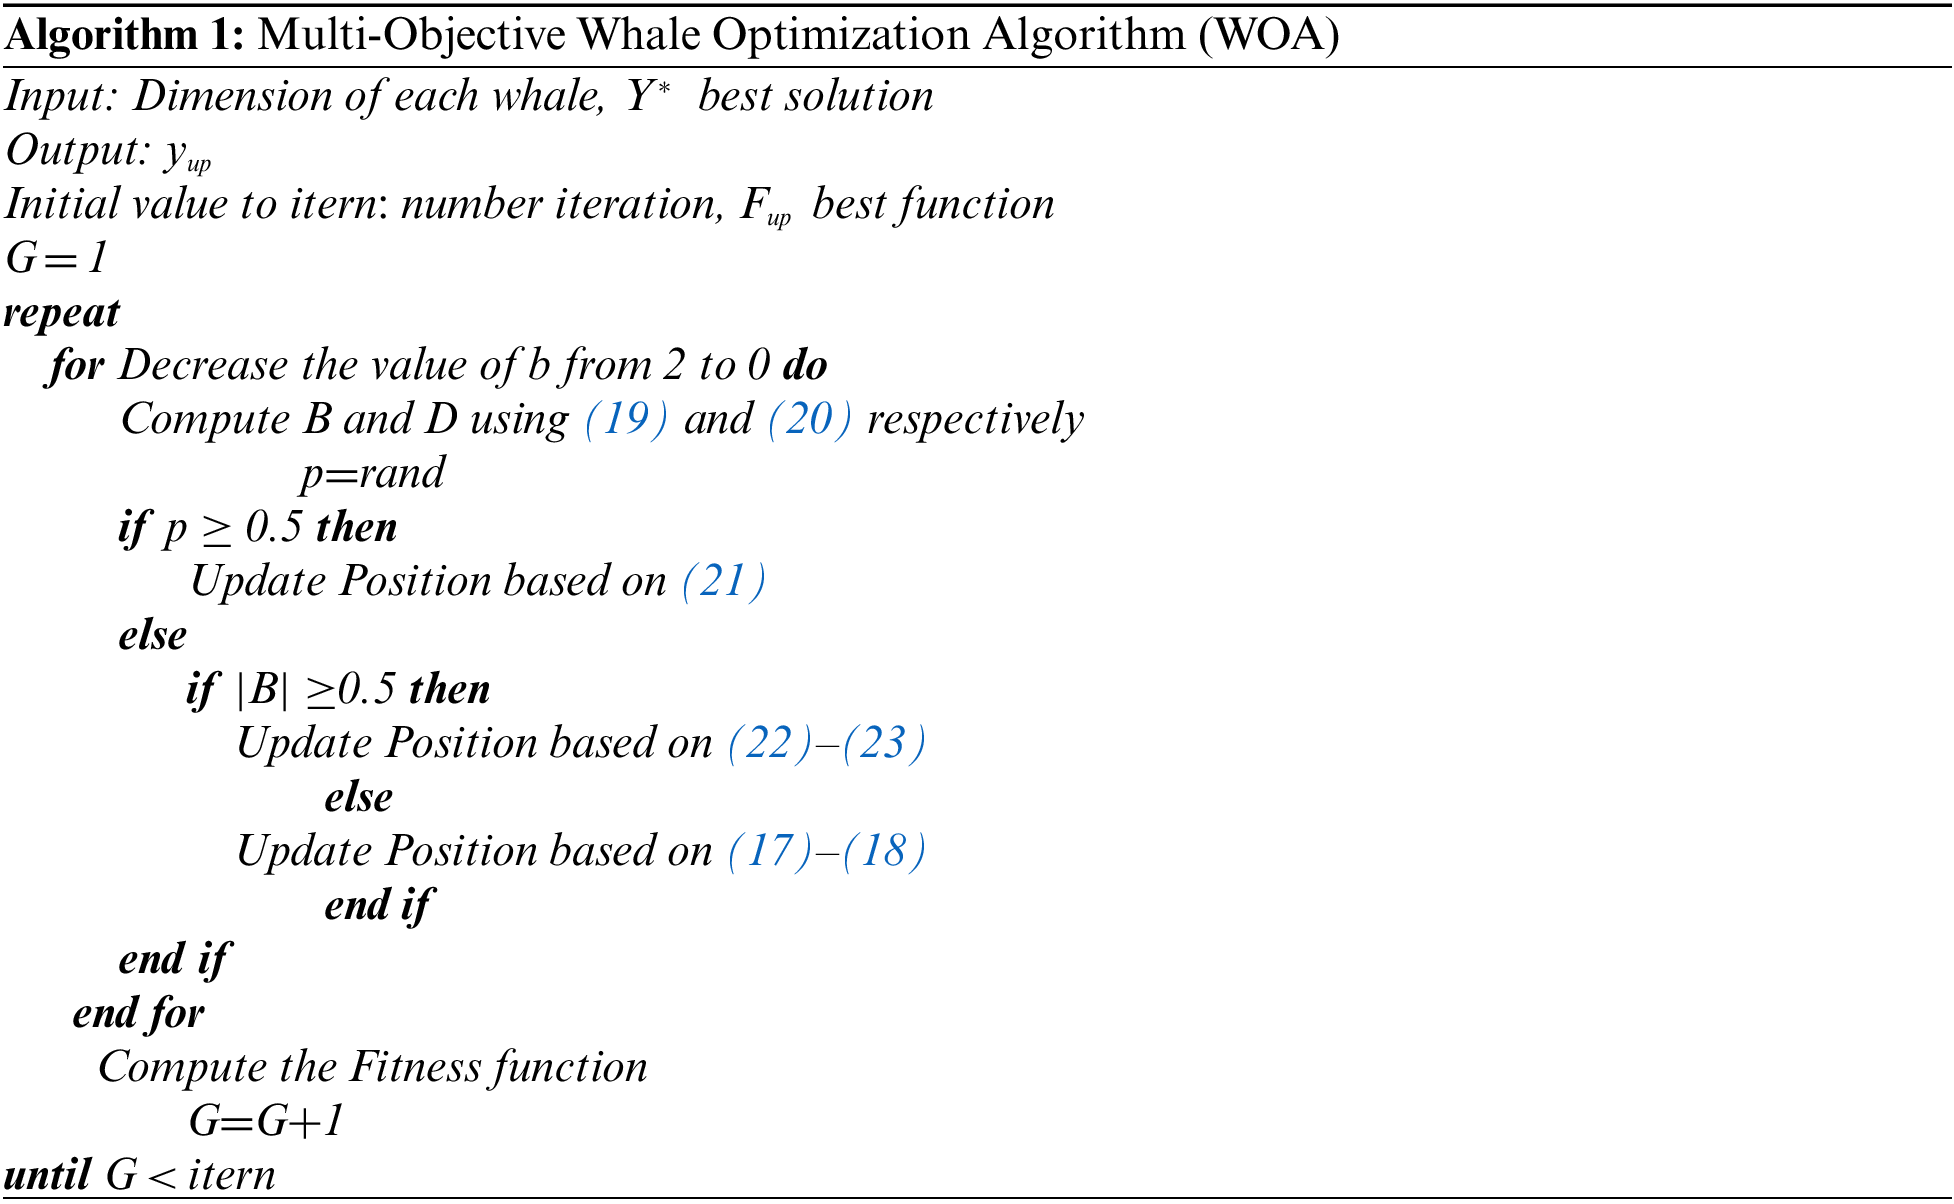
3.3 Multi-Objective Whale Optimization Algorithm
The primary objective of inclusion of whale optimization algorithm in the proposed work is to improve the performance of the abnormal event detection in terms of its accuracy. The main principle of Multi-Objective Problems (MOP) is presented in this section. The MOPs are designed to reduce or increase many competing goal functionalities. Considering the reduction issue with numerous functions fj(a), j = 1, 2,…, N (in which N represents the overall count of operations) as in (13) to derive the MOP:
subject to,
In which x denotes the vector of solutions,
where,
The Whale Optimization Algorithm (WOA) is a novel meta-heuristic algorithm that models humpback whales. The quest in WOA begins with the generation of a random set of whales. The whales approach their targets using bubble-net or encircling techniques. The whales adjust their posture in the encircling activity according to their ideal position:
where E denotes the distance between the prey
In which r random vector ∈ [0, 1], and the score of b is linearly reduced from 2 to 0 as repetitions continue.
The bubble-net behavior shall be simulated using two methods. The initial one is the shrinking encircling, which is achieved by lowering the score of b in (19), which also reduces value of B. The next is the spiral upgrading location by (21) which is used to simulate the humpback whales’ helical structure motion around its prey:
where
Such whales may swim about their prey in a diminishing circle and along a spiral course simultaneously.
where p ∈ [0, 1] denotes a randomized integer that indicates the likelihood of selecting the shrinking encircling procedure or the spiral design to upgrade the location of whales.
Moreover, the humpback whales find an unexpected way to attack the prey. The position of a whale is upgraded by selecting an accidental search agent rather than the optimal search agent, as shown below:
where
UMN dataset [22] consists of a crowd escaping in panic situation. This dataset consists of 11 videos with three scenes. The videos are at a normal starting section with abnormality at the ending section. The video size is of 320 × 240 pixels.
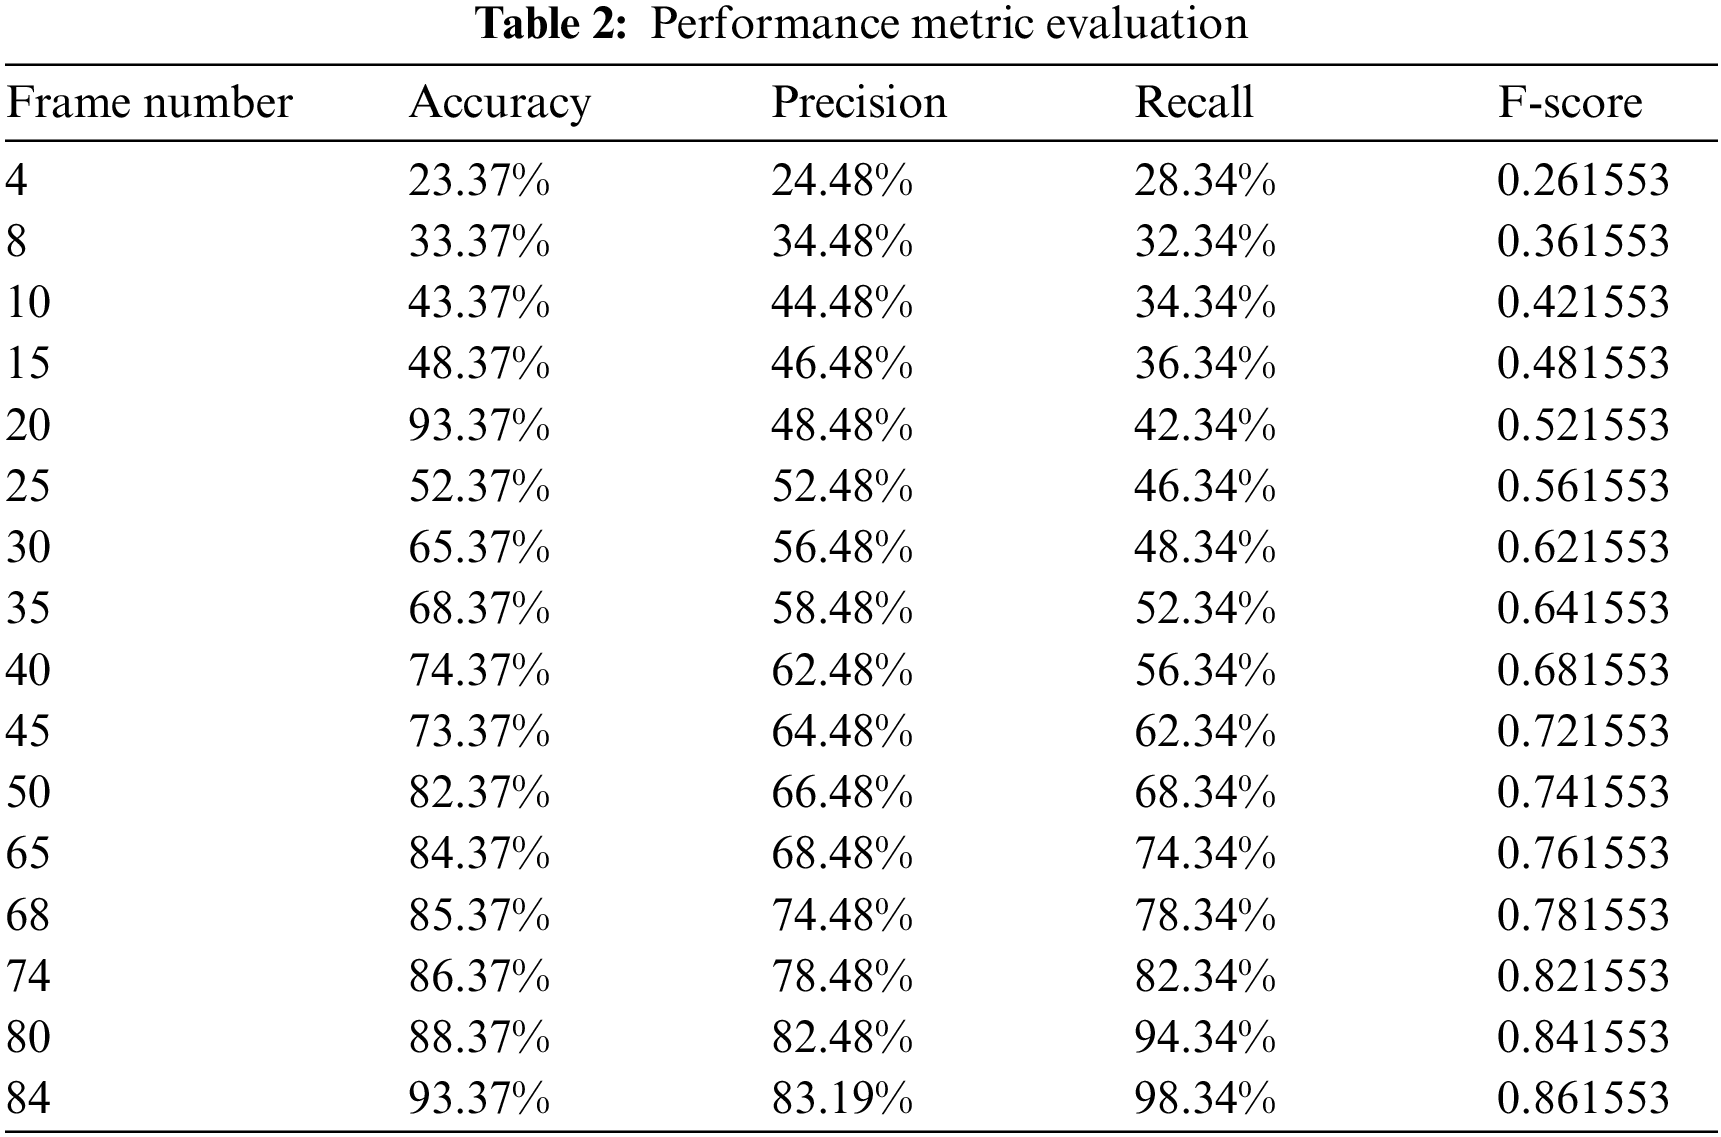
The proposed method is simulated utilizing the Python simulation tool, and the behavioral metrics are analyzed. The suggested technique is contrasted and compared with the existing approaches based on the performance metrics like accuracy, precision, recall and F-score. Criteria such as True Positive (TP), True Negative (TN), False Positive (FP), and False Negative (FN) are considered for its evaluation. The pixel numbers that the algorithm correctly detects as positive are referred to as True Positive (TP). The pixel numbers that the system correctly detects as unfavorable are referred to as True Negative (TN). The pixel numbers that are identified as positive but not exact are known as False Positive (FP). The pixel numbers that are recognized as unfavorable but not the exact ones are referred to as False Negative (FN). Tab. 2 displays the performance metric values of the proposed work.
It determines the number of samples which were successfully detected. It determines how closely the outcome corresponds to the initial result. Fig. 3 shows the graph for accuracy attained for various video frames.
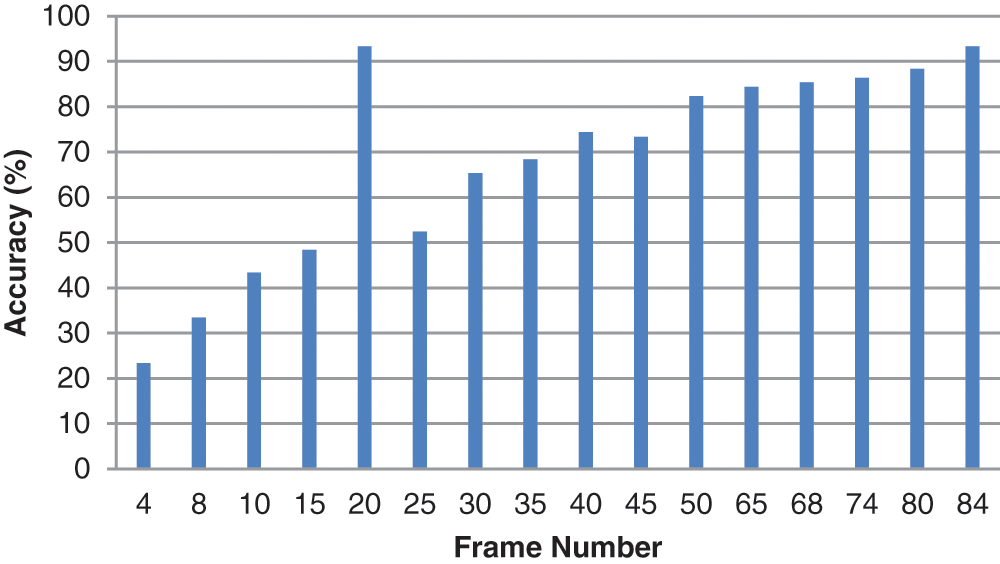
Figure 3: Number of frames vs. accuracy (%)
Precision refers to a model's ability to recognize only critical ones. It's the proportion of positive predictions that are accurate. Fig. 4 shows the graph for precision attained for various video frames.
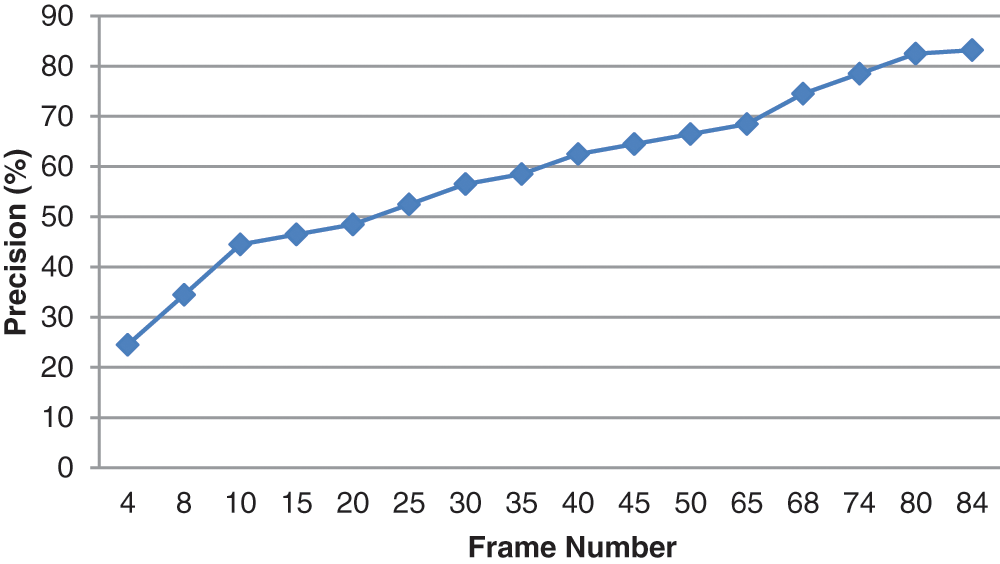
Figure 4: Number of frames vs. precision (%)
The potential of a system to identify every relevant object is known as recall. It's the proportion of optimistic expectations that are correct from all the available ground truths. Fig. 5 shows the graph for recall attained for various video frames.
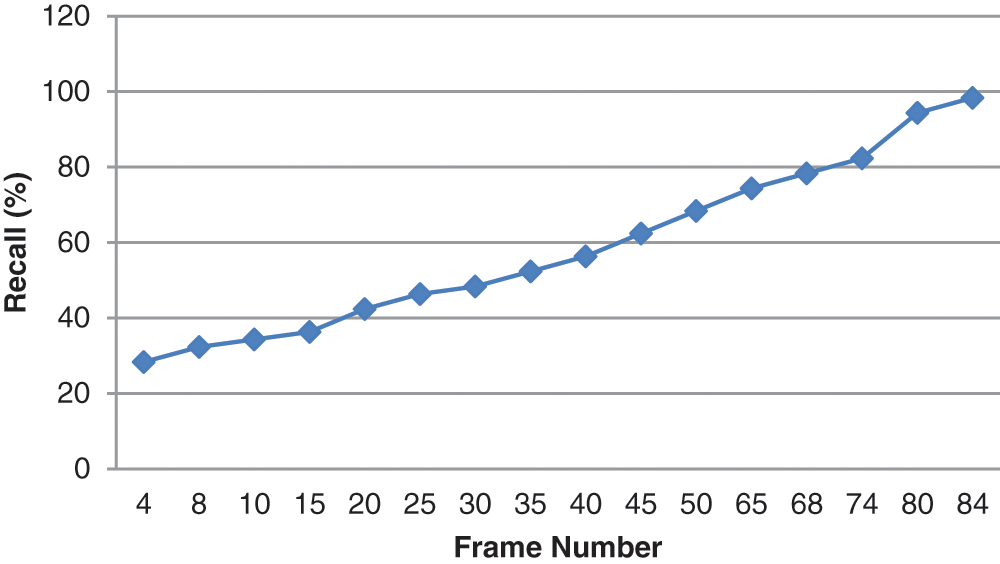
Figure 5: Number of frames vs. recall (%)
The F-score, also termed as F1-score, measures the efficiency of a framework for a given dataset. It is utilized to assess binary categorization algorithms that classify samples as either “Positive” or “Negative”. The F-score is described as the harmonic average of the recall and precision of the system. It is also a method which integrates them. The F-score for various frame numbers is shown in Fig. 6.
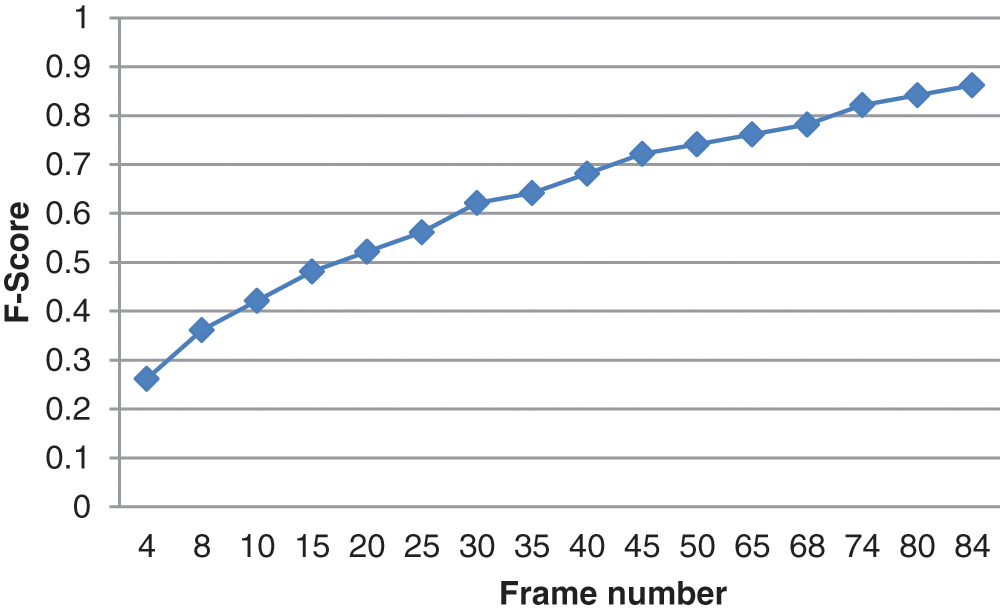
Figure 6: Number of frames vs. F-score
Fig. 7 shows the comparative analysis of performance metrics for the existing and the proposed method. The inference from the graph is evident that the method which is proposed in our work is better than the traditional approaches [20,21].
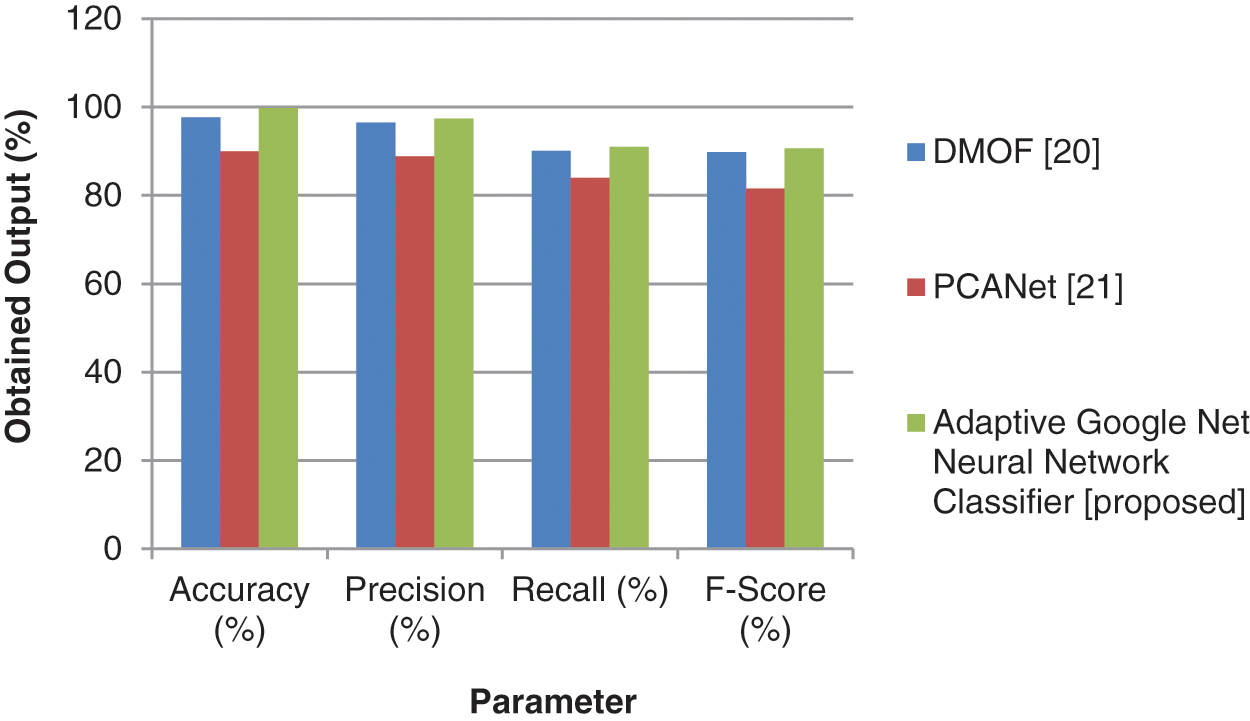
Figure 7: Comparison of existing vs. proposed methods
The above figure depicts various anomaly frames in which anomaly of the crowded scene is detected. Figs. 8a–8d show the detection steps of anomaly frames. Multiple detection with a bounding box occurs in each anomaly frame. Reduction in processing time is observed in the process. The detection covers maximum number of people in a single frame. After extracting the spatio-temporal feature vectors, a minimum distance matrix over the mega blocks is constructed. The value of an element in the matrix is defined by the minimum Euclidean distance. The distance is calculated between a feature vector of the current test frame and the codewords in the corresponding block. The values in a minimum distance matrix are compared against the threshold value (5.83682407063e−05). The current frame is classified as unusual if the highest value is larger than the threshold and less unusual if lesser.
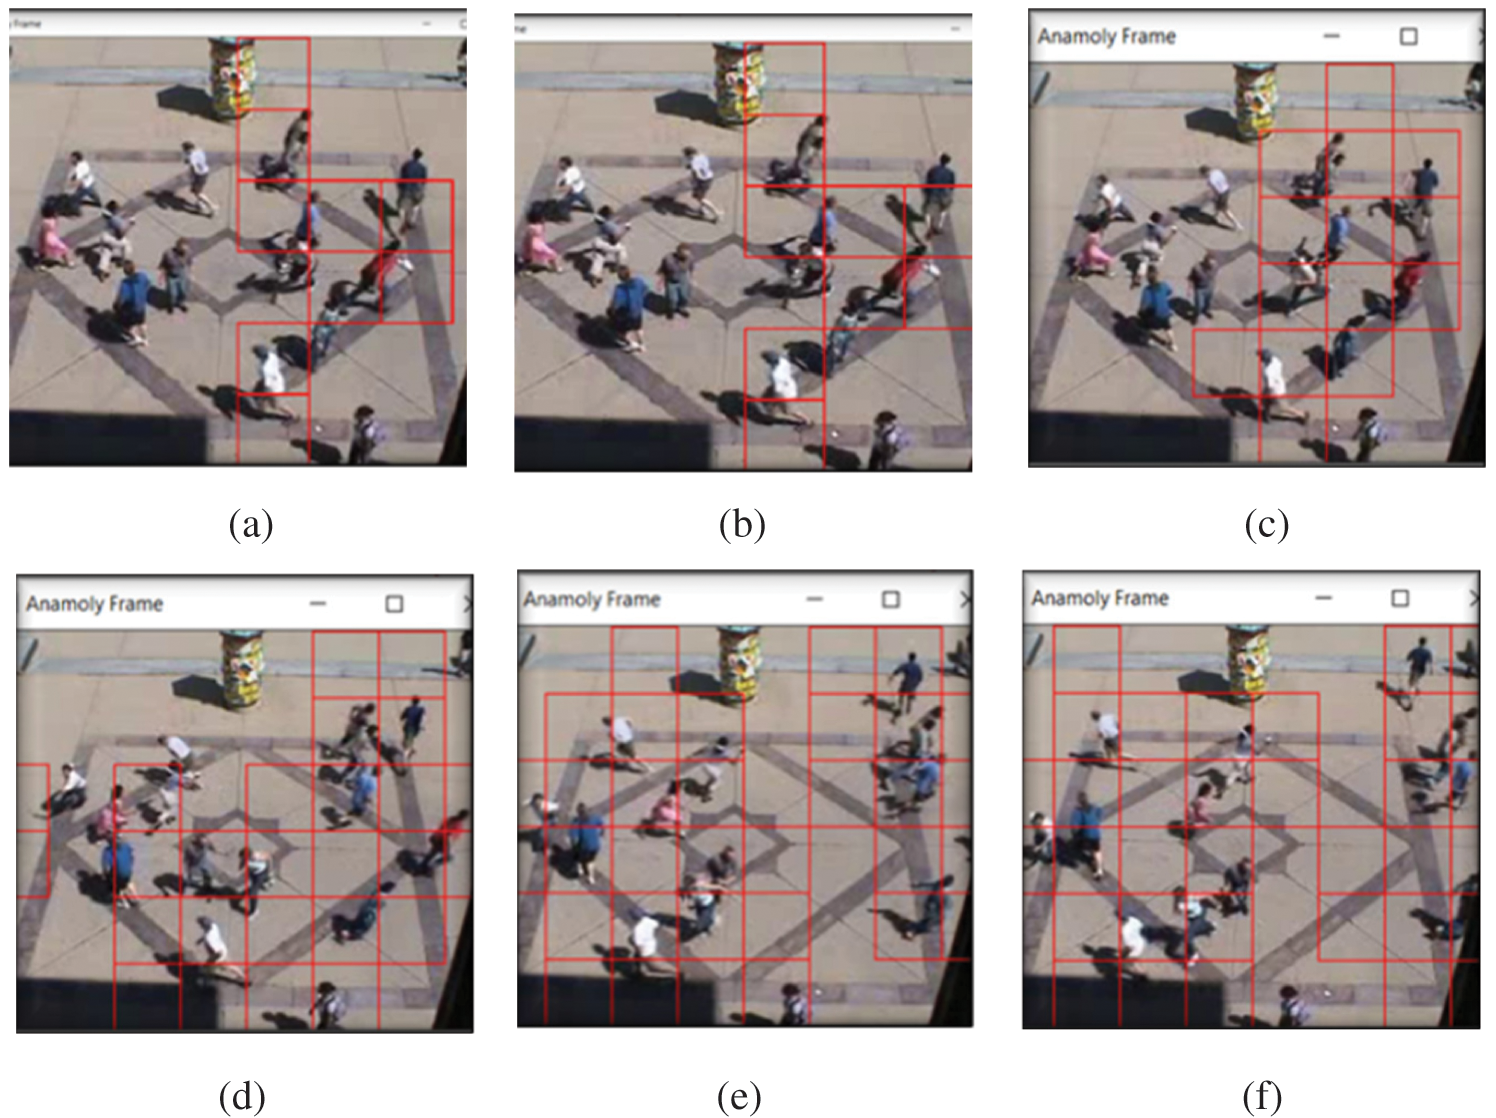
Figure 8: Detection output steps for anomaly frames. Frames (a)–(f) denote the sequence of anomaly detection events in progressive steps
In this paper we have used a new strategy for identifying anomalous occurrences in crowded situations. This technique of Adaptive Google Net Neural Network Classifier uses Multiple Instances Learning (MIL) to dynamically develop a deep anomaly ranking framework. A multi-objective whale optimization algorithm is employed to obtain a more accurate determination of visual abnormalities. This predicts high anomalous values for abnormal video frames. The experiments revealed that the suggested strategy outperforms the conventional algorithms in detecting anomalous occurrences in crowded settings based on the metrics in the UMN dataset. The proposed method gives better results in comparison to the existing approaches based on its detection accuracy and the processing time. Our future work is to incorporate and implement contextual anomaly detection and localization in the crowded scenarios which will give more semantic and meaningful results to the proposed crowd anomaly detection technique. Hence more improvement in performance and quality can be achieved with such enhancements in our model.
Funding Statement: The authors received no specific funding for this study.
Conflicts of Interest: The authors declare that they have no conflicts of interest to report regarding the present study.
1. X. Hu, Y. Huang, Q. Duan, W. Ci, J. Dai et al., “Abnormal event detection in crowded scenes using histogram of oriented contextual gradient descriptor,” EURASIP Journal on Advances in Signal Processing, vol. 54, pp. 1–15, 2018. [Google Scholar]
2. S. Amraee, A. Vafaei, K. Jamshidi and P. Adibi, “Abnormal event detection in crowded scenes using one-class SVM,” Signal Image and Video Preprocessing, vol. 12, pp. 1115–1123, 2018. [Google Scholar]
3. Y. S. Chong and Y. H. Tay, “Abnormal event detection in videos using spatiotemporal autoencoder,” in Proc. ISSN, Hokkaido, Japan, pp. 189–196, 2017. [Google Scholar]
4. Y. Yu, W. Shen, H. Huang and Z. Zhang, “Abnormal event detection in crowded scenes using two sparse dictionaries with saliency,” Journal of Electronic Imaging, vol. 26, no. 3, pp. 033013(1–92017. [Google Scholar]
5. M. Ravanbaksh, M. Nabi, E. Sangineto, L. Marcenaro, C. Regazzoni et al.., “Abnormal event detection in videos using generative adversarial nets,” in Proc. ICIP, Beijing, China, pp. 1577–1581, 2017. [Google Scholar]
6. Y. Yuan, Y. Feng and X. Lu, “Structured dictionary learning for abnormal event detection in crowded scenes,” Pattern Recognition, vol. 73, pp. 99–110, 2018. [Google Scholar]
7. A. Ramachandran and A. K. Sangaiah, “Unsupervised deep learning system for local anomaly event detection in crowded scenes,” Multimedia Tools and Applications, vol. 79, pp. 35275–35295, 2020. [Google Scholar]
8. T. Qasim and N. Bhatti, “A hybrid swarm intelligence-based approach for abnormal event detection in crowded environments,” Pattern Recognition Letters, vol. 128, pp. 220–225, 2019. [Google Scholar]
9. A. Li, Z. Miao, Y. Cen, X. P. Zhang et al., “Abnormal event detection in surveillance videos based on low-rank and compact coefficient dictionary learning,” Pattern Recognition, vol. 108, pp. 107355(1–162020. [Google Scholar]
10. F. Harrou, M. M. Hittawe, Y. Sun and O. Beya, “Malicious attacks detection in crowded areas using deep-learning based approach,” IEEE Instrumentation & Measurement Magazine, vol. 23, no. 5, pp. 57–62, 2020. [Google Scholar]
11. J. Sun, J. Shao and C. He, “Abnormal event detection for video surveillance using deep one-class learning,” Multimedia Tools and Applications, vol. 78, pp. 3633–3647, 2019. [Google Scholar]
12. T. Wang, Z. Miao, Y. Chen, Y. Zhou, G. Shan et al., “AED-Net: An abnormal event detection network,” Engineering, vol. 5, pp. 930–939, 2019. [Google Scholar]
13. S. Lee, H. G. Kim and Y. M. Ro, “STAN: Spatio-temporal adversarial networks for abnormal event detection,” in Proc. ICASSP, Calgary, AB, Canada, pp. 1323–1327, 2018. [Google Scholar]
14. T. Chen, C. Hou, Z. Wang and H. Chen, “Anomaly detection in crowded scenes using motion energy model,” Multimedia Tools and Applications, vol. 77, pp. 14137–14152, 2018. [Google Scholar]
15. Q. Ma, “Abnormal event detection in videos based on deep neural networks,” Scientific Programming, vol. 2021, pp. 1–8, 2021. [Google Scholar]
16. C. He, J. Sho and J. Sun, “An anomaly-introduced learning method for abnormal event detection,” Multimedia Tools and Applications, vol. 77, pp. 29573–29588, 2018. [Google Scholar]
17. R. T. Ionescu, F. S. Khan, M. I. Georgescu and L. Shao, “Object-centric auto-encoders and dummy anomalies for abnormal event detection in video,” in Proc. CVPR, Long Beach, CA, USA, pp. 7834–7843, 2019. [Google Scholar]
18. T. Bao, S. Karmoshi, C. Ding and M. Zhu, “Abnormal event detection and localization in crowded scenesbased on PCANet,” Multimedia Tools and Applications, vol. 7, pp. 23213–23224, 2017. [Google Scholar]
19. S. Bansod and A. Nandedkar, “Transfer learning for video anomaly detection,” Journal of Intelligent & Fuzzy Systems, vol. 36, no. 3, pp. 1967–1975, 2019. [Google Scholar]
20. M. Gnouma, R. Ejbali and M. Zaied, “Abnormal events’ detection in crowded scenes,” Multimedia Tools and Applications, vol. 77, pp. 24843–24864, 2018. [Google Scholar]
21. Z. Fang, F. Fei, Y. Fang, C. Lee, N. Xiong et al.., “Abnormal event detection in crowded scenes based on deep learning,” Multimedia Tools and Applications, vol. 75, pp. 14617–14639, 2016. [Google Scholar]
22. R. Mehran, A. Oyama, and M. Shah, “Abnormal crowd behavior detection using social force model,” in Proc. IEEE (CVPR), Miami, pp. 935–942, 2009. http://mha.cs.umn.edu/proj_events.shtml#crowd/crowd-activity-all.avi. [Google Scholar]
 | This work is licensed under a Creative Commons Attribution 4.0 International License, which permits unrestricted use, distribution, and reproduction in any medium, provided the original work is properly cited. |