DOI:10.32604/cmc.2022.023886
| Computers, Materials & Continua DOI:10.32604/cmc.2022.023886 | |
| Article |
Dimensionality and Angular Disparity Influence Mental Rotation in Computer Gaming
1Department of Biosciences and Biomedical Engineering, Indian Institute of Technology Indore, Indore, 453552, India
2Department of Electrical Engineering, Indian Institute of Technology Indore, Indore, 453552, India
3Discipline of Psychology, Indian Institute of Technology Indore, Indore, 453552, India
4Center for Electric Vehicles and Intelligent Transport Systems, Indian Institute of Technology Indore, Indore, 453552, India
*Corresponding Author: Akanksha Tiwari. Email: phd1501171006@iiti.ac.in
Received: 25 September 2021; Accepted: 24 December 2021
Abstract: Computer gaming is one of the most common activities that individuals are indulged in their usual activities concerning interactive system-based entertainment. Visuospatial processing is an essential aspect of mental rotation (MR) in playing computer-games. Previous studies have explored how objects’ features affect the MR process; however, non-isomorphic 2D and 3D objects lack a fair comparison. In addition, the effects of these features on brain activation during the MR in computer-games have been less investigated. This study investigates how dimensionality and angular disparity affect brain activation during MR in computer-games. EEG (electroencephalogram) data were recorded from sixty healthy adults while playing an MR-based computer game. Isomorphic 2D and 3D visual objects with convex and reflex angular disparity were presented in the game. Cluster-based permutation tests were applied on EEG spectral power for frequency range 3.5–30 Hz to identify significant spatio-spectral changes. Also, the band-specific hemispheric lateralization was evaluated to investigate task-specific asymmetry. The results indicated higher alpha desynchronization in the left hemisphere during MR compared to baseline. The fronto-parietal areas showed neural activations during the game with convex angular disparities and 3D objects, for a frequency range of 7.8–14.2 Hz and 7.8–10.5 Hz, respectively. These areas also showed activations during the game with reflex angular disparities and 2D objects, but for narrower frequency bands, i.e., 8.0–10.0 Hz and 11.0–11.7 Hz, respectively. Left hemispheric dominance was observed for alpha and beta frequencies. However, the right parietal region was notably more dominant for convex angular disparity and 3D objects. Overall, the results showed higher neural activities elicited by convex angular disparities and 3D objects in the game compared to the reflex angles and 2D objects. The findings suggest future applications, such as cognitive modeling and controlled MR training using computer games.
Keywords: Computer-based games; angular disparity; dimensionality; mental rotation; EEG; hemispheric laterality
When individuals play computer-games, information processed by them is primarily visuospatial in nature. Visuospatial processing involves perceiving, analyzing, manipulating, and transforming visual patterns or images in order to understand them in the task context. Mental rotation (MR) is one of the most important aspects of visuospatial processing, which facilitates transformation, rotation, comparison, judgment, and other spatial manipulation on a mental image to process the object characteristics (e.g., dimensions, angles, directions, reference frames). Even in day-to-day activities in our lives, it plays a crucial role, especially in the tasks requiring fast manipulation of the visual contents, such as learning geometry or navigating a map. Therefore, it is a crucial component of visuospatial processing concerning learning, reasoning, decision making, and visual perception tasks as well [1–4].
In MR, the characteristics of the visual objects affect task execution. One of these important characteristics (parameters) is angular disparity at which an individual has to rotate the mental images [5–9]. It is the angular difference between the two objects, whose mental images are being compared during an MR task. Shepard and Metzler suggested an ‘inverted V’ shaped plot between angular disparity and reaction time during the MR task [5]. Later other studies also reported the same trend of angular disparity on response time in the MR task [6–8]. Another crucial parameter that may affect the performance during an MR task is dimensionality of the presented images/objects. Studies have explored dimensionality of the object in 2D and 3D categories and reported performance dependency on the dimensionality of the image or object during the MR processes [6–8]. Also, the differences in mechanism followed by the human brain while processing 2D and 3D objects in MR tasks are discussed earlier. Piecemeal processing is elicited by complex unfamiliar shapes, such as torus shapes, requiring rotation in-depth, whereas holistic processing is elicited by familiar 2D stimuli, such as alphanumeric characters, requiring rotation in the picture plane [9–11]. Studies have suggested that the stimulus category, task environment, and spatial reference frames also play an important role in selecting the strategy to process the information during MR.
Previous studies have examined dimensionality in MR, where the investigators have used different types of objects for 2D and 3D, whereby the use of isomorphic stimuli is missing [12,13]. This aspect is an important concern because the object category (stimulus type) could also influence the strategy selection to process MR. The current study has used isomorphic objects, allowing better experimental control in studying the 2D vs. 3D aspects of dimensionality. The point is that if objects are non-isomorphic, the effect may not be only because of dimensionality, but also the factor concerning non-isomorphic objects itself could play a role. In the context of the current study, the investigators have categorized angular disparity into convex angular disparity (CA) and reflex angular disparity (RA).
The behavioral and neuroimaging MR studies have used various tasks to measure or train MR abilities. Most of them have utilized paper-pencil-based tasks and visual slides based on parity judgment; however, few studies have also used real-world situations, video games, or computer-based tasks [14–16]. Computer-games composed of complex visuospatial information with patterns requiring rotation usually require fast responses, and the MR ability plays an important role in efficiently executing the task. Though these games have been growing in recent years primarily for entertainment, recent studies have been supporting their usefulness and effectiveness in assessing and training cognitive abilities (e.g., [16–21]. Cherney investigated the effects of playing video games on MR abilities and suggested improved performance on MR tasks [20]. Recently, Milani et al. reported improvements in MR abilities by playing video games [16]. Hence, computer-games requiring MR could effectively train the spatial abilities, considering their fast-growing access to everyone through smartphones and other multimedia devices. So, in order to present the MR processing in an interactive and impactful manner, this study has utilized the computer-game environment and presented the MR in the form of a computer-game to the participants.
Previous studies have investigated the neural activities during MR tasks using different neuroimaging techniques [22–25]. Zacks reviewed several MR studies with neuroimaging methods and suggested the increased activity in the intraparietal sulcus and adjacent regions during MR tasks. The study also suggested neural activities in the medial superior precentral cortex, especially with the stimuli favoring the motor simulation, which indicates the MR dependence sometimes also on motor simulation [26]. Further, the effects of spatial reference frames in MR tasks have also been discussed by Thomas et al., showing the increased EEG coherence for allocentric reference frames during the MR task [27].
The frequency bands of EEG rhythms are differently associated with the mental states. The exhibition of stronger alpha-blocking with the use of an allocentric reference frame is suggested by previous studies. Further, the desynchronization (loss in power) in alpha rhythms arises with increasing engagement of the cortical network, which depends on one's attentional demand for the visuospatial tasks [22]. Due to the task being allocentric, alpha desynchronization is expected in the brain areas associated with the task. Also, since CA and 2D were found more challenging than RA and 3D in the previous study [28], it is expected to reflect higher active areas as no. of clusters for CA and 2D. Further, the object characteristics in the task also affect the strategy selection during the MR process; therefore, the cortical activation may vary depending on whether an individual selects a piecemeal or holistic approach [29]. The right hemisphere dominates in the holistic approach, whereas the left dominates in the piecemeal approach. The rotation process may approach different strategies with a smaller and larger angle of rotation [30]. It is suggested in the previous study that rotation through a smaller angle is a holistic process, whereas rotation with a larger angle is a piecemeal process. Further, 2D object processing in MR is found more complex than 3D if the objects are isomorphic. Therefore, the difference in hemispheric laterality is expected between groups, reflecting right-hemispheric laterality for CA and 3D, however left-hemispheric laterality for RA and 2D.
Oei et al. suggested that the frequent training of a specific cognitive skill also reflects in another task if they share common underlying demands [21]. A similar phenomenon was also reported by Meneghetti et al., suggesting the transfer effects of MR training in the task requiring spatial skill [31]. Understanding the driving parameters in the MR process would certainly help to improve a computer-game for training the MR abilities. The neural correlates of these parameters may also help to understand its effect on other cognitive skills and design games for brain entrainment. Interestingly, it can provide a covert tool to train a cognitive skill silently behind a computer-game. This motivated us to investigate how the driving components of an MR process in a computer-game impact the human brain.
The investigators have used a parity task in the current study. The parity tasks are the most commonly used in the previous MR studies, where an individual had to find the pair of given visual patterns from the given choices by mentally rotating them; see Fig. 1. We designed a parity judgment-based computer-game using the Unity3D game engine [28]. Multi-arms 3D models (similar to [5]) and their isomorphic 2D models were utilized, referred to as objects, to invoke mental rotation in the game. These models were presented with either of the convex (0°–180°) or reflex (180°–360°) angular disparities. At each stage (trial), the player had to make parity judgment from multiple similar-looking objects, and the difficulty level was systematically raised by increasing the number of arms in the object from 4 to 7. Four groups of fifteen healthy adults played either of the four sections of the game with a unique combination of angular disparity and dimensionality. Continuous scalp EEG data at ten sites from the frontal, central and parietal regions were recorded while participants played the computer-game. Using standard routines in the MNE-Python toolbox, the raw EEG data were preprocessed. Then, the power spectral density was computed for the preprocessed data from all the participants, using the multitaper method in the FieldTrip toolbox. Further, a clustering-based permutation test was applied on the EEG power spectra to find the brain region with significant activation due to changes in the game parameters. Also, the hemispheric laterality was evaluated to show the hemispheric dominance correlated with angular disparity and dimensionality conditions.
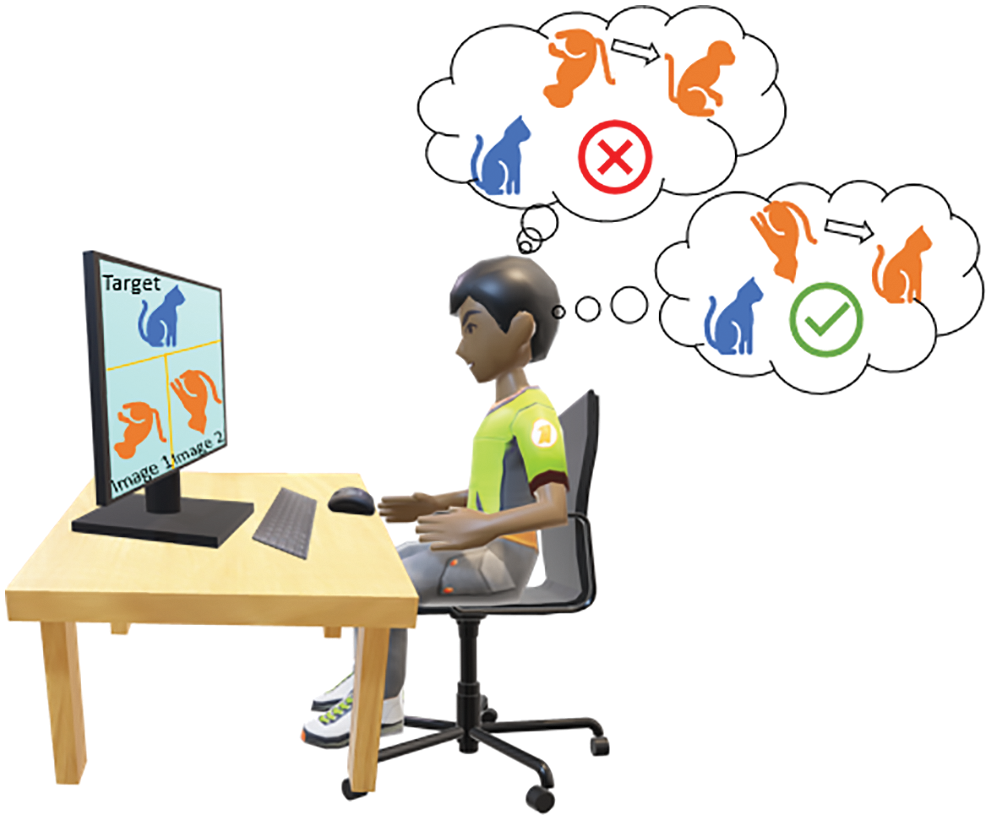
Figure 1: A typical MR process in a parity task for finding the target-match from image 1 and 2
2.1 Experimental Design and MR Gaming Task
This experiment employs a factorial design with angular disparity (AD) and dimensionality (D) having two conditions each, i.e., 2 (AD: convex vs. reflex range) × 2 (D: 2D vs. 3D objects) between-groups design. As shown in Fig. 2, there are four groups and, in each group, objects from four categories of the varying number of arms (4, 5, 6, and 7 arms) were presented twice for each of the four angles of rotation. Therefore, each of the four groups included 32 (4: arms × 2: repetitions × 4: angular disparities) trials altogether. The computer-game involving the above-mentioned MR tasks was designed in the Unity3D game engine [32]. The isomorphic 2D and 3D multi-arms objects, like the previous studies [5,8], were designed using Blender [33]. The 2D objects were obtained by removing the depth of their 3D counterparts. The game was developed for the Windows platform and presented on a 24-inch display with a 1920 × 1080 screen resolution. The gaming task had multiple successive trials, and in each trial, the player had to identify a multi-arms object presented on the left side of the monitor and from a group of five look-alike objects (distractors) on the right side. The distractors were rotated at a fixed angle. Based on the angle of rotation and dimensionality of the objects presented, the complete game was divided into four sections:
1. CA2D: 2D objects with convex angular disparities;
2. CA3D: 3D objects with convex angular disparities;
3. RA2D: 2D objects with reflex angular disparities;
4. RA3D: 3D objects with reflex angular disparities.
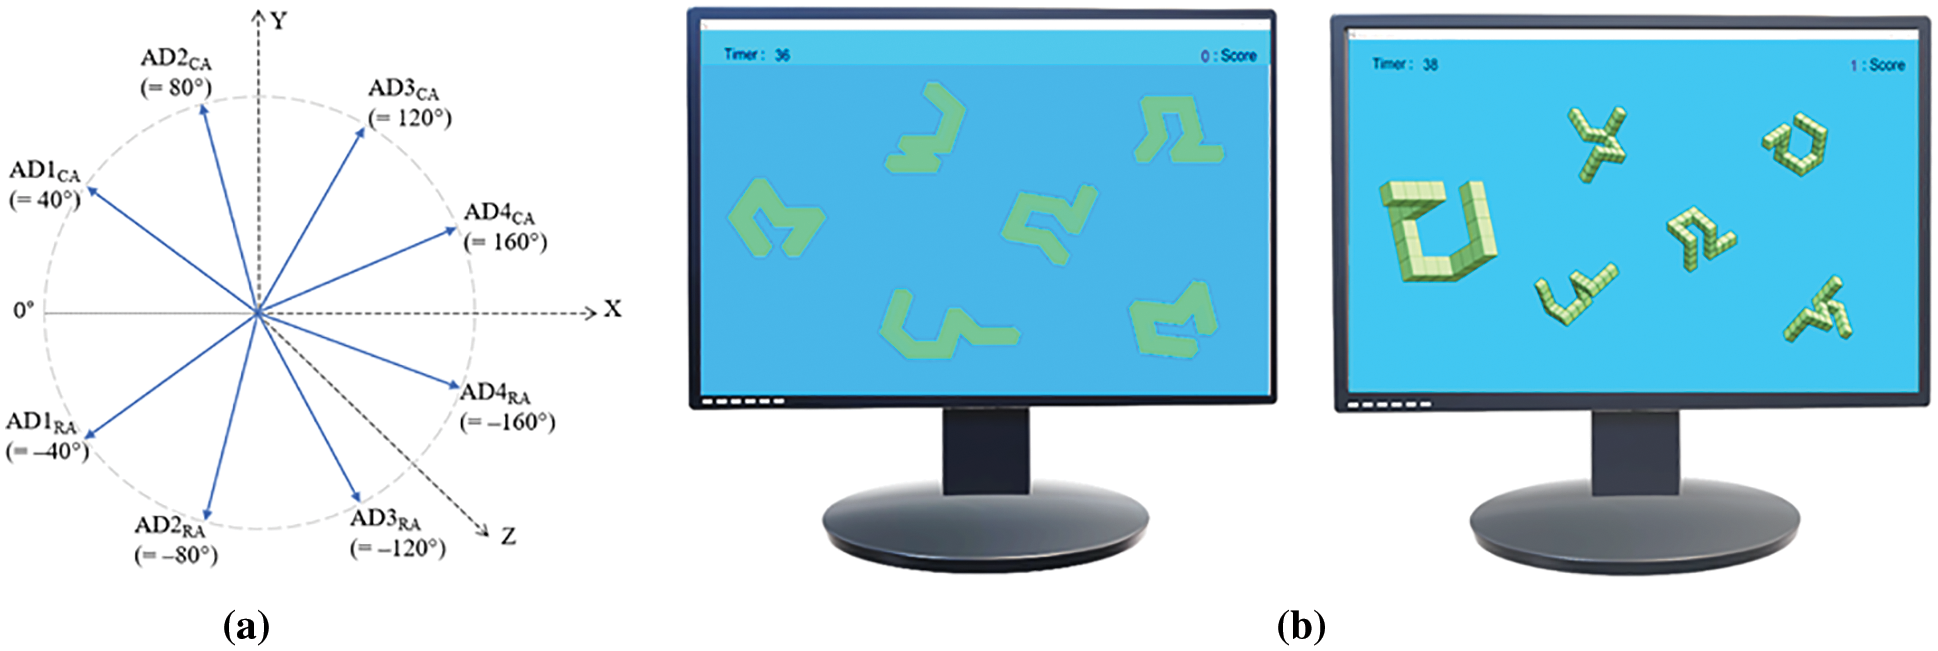
Figure 2: (a) Angular disparity conditions for CA and RA, (b) the game with 2D (left) and 3D objects (right)
The four convex type angular disparity conditions for Sections 1 and 2 were AD1CA (= 40°), AD2CA (= 80°), AD3CA (= 120°), and AD4CA (= 160°) whereas, the four reflex type angular disparity conditions for Sections 3 and 4, were AD1RA (= −40° or 320°), AD2RA (= −80° or 280°), AD3RA (= −120° or 240°), and AD4RA (= −160° or 200°). The angles for AD#RA were the reflection of their convex counterparts from AD#CA across the 0° line in Fig. 2a, where ‘#’ represents the index of the rotation. The objects were rotated in XY-plane (plane of the monitor screen), considering Z-axis normal to the plane.
The location of matched object was randomized, and the player had to identify the match and respond by using a mouse as soon as possible for proceeding to the subsequent trial. The trials were not time-limited so that a player could respond conveniently, and the time was recorded as response/reaction time. Players earned one score for each correct response and accumulated score was displayed on the right upper corner of the screen throughout the session. Fig. 2b shows examples of the 2D and 3D objects utilized in the game.
2.2 Participants and Experimental Setup
Fig. 3 shows an overview of the experimental workflow in the study. A total of 72 healthy engineering students voluntarily participated in the experiment. The data for 12 participants were discarded due to either excessive movement artifact or high impedance during the acquisition. After the exclusion, the sixty volunteers (51 males and 9 females; all right-handed; age range 18–29 years; Mean = 21.6 years; SD = 3.13) were selected for the study. All of them had normal or corrected to normal visual acuity. They all reported no medical history of neurological or psychological disorders. Each participant gave informed consent before starting the experiment, in a format approved by the Institute Human Ethics Committee. The equal number of participants were randomly assigned to each of the four groups—CA2D, CA3D, RA2D, and RA3D, each for one gaming section. Each group had 15 participants, and they were instructed to play the section of the gaming task assigned to them. All the participants were remunerated after the experiment.
The experiment was conducted in an isolated and noise-free environment to avoid any possible distraction and noise to EEG. The participant was seated on a comfortable chair in front of a computer monitor with MR gaming tasks. The monitor size was 24 inches with a screen resolution of 1920 × 1080, and the distance between the monitor and the participant was approx. ∼65 cm. A 10-channel MP 150 system (BIOPAC® Systems Inc., CA, USA) was used in the unipolar mode to acquire EEG data from 10 scalp positions—FPz, FC1, FC2, C3, Cz, C4, CP3, CP4, Pz and POz. The individual gold-plated electrodes were attached at the ten pre-marked positions after measuring based on 10–20 international standards, using Ten20® conductive Neurodiagnostic electrode paste. The linked ears were used as a common reference for all the channels, and the impedance was maintained below 5 kΩ.
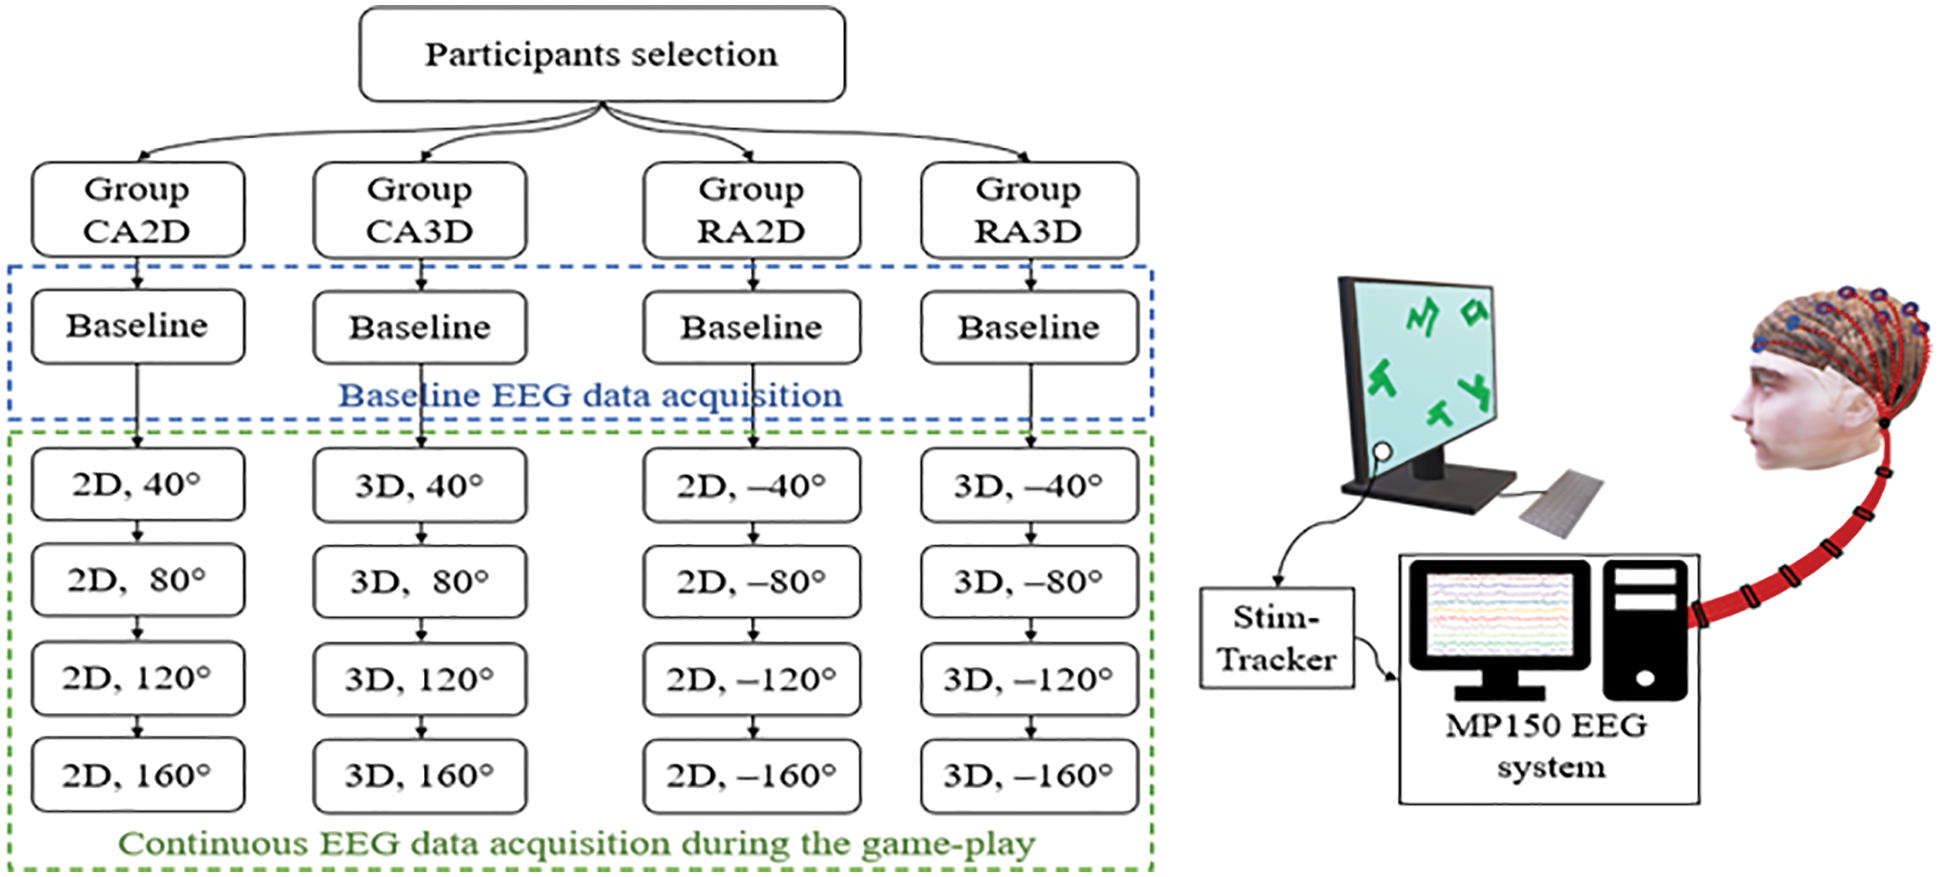
Figure 3: Experimental workflow (left) and schematic diagram for the data acquisition setup (right)
2.3 Task Execution and Data Acquisition
Before starting the experiment, each participant was explained the instructions for the task execution in detail and asked to keep the head movement minimal during the experiment. The 10-channels MP150 system was set for a 2 kHz sampling rate. Baseline EEG data for 5 min was recorded before the gaming-task execution, during which the participant was sitting at rest. After a training session with four trials (similar but not included in the actual experiment) to get participants familiar with the tasks, the actual gaming-task assigned to the group was started. The tasks had four levels with increasing angular disparity, and TTL (transistor-transistor logic) triggers were generated at the beginning of each level to synchronize the EEG data acquisition with the gaming-tasks using StimTracker® and a photodiode attached on the monitor. Fig. 3 also shows the schematic illustration of the data acquisition during the gaming session. The task session for a participant was in a single run. The tasks were not time-limited; however, the elapsed time (in second) was continuously displayed along with the total rewarded points in the monitor's corner. At the end of the gaming session, the datasets were saved along with the triggers for further offline analysis.
2.4 Group Design with Independent MR Parameters
Based on the individual parameters used for the experimental design, viz., angular disparity and dimensionality, we further arranged the EEG datasets into four groups for the analysis:
1. Group CA (participants who executed the tasks with convex AD with 2D/3D objects);
2. Group RA (participants who executed the tasks with reflex AD with 2D/3D objects);
3. Group 2D (participants who executed the tasks with 2D objects with convex/reflex AD);
4. Group 3D (participants who executed the tasks with 3D objects with convex/reflex AD).
Each of the four groups (each with 30 subjects) was analyzed to evaluate the effects of angular disparity and dimensionality conditions on EEG rhythms.
For offline data analysis, the data were first preprocessed utilizing standard routines in MNE-Python [34], and further analysis was done using the FieldTrip toolbox [35] and customized scripts in MATLAB® (https://www.mathworks.com). Fig. 4 shows the analysis workflow employed in the study.
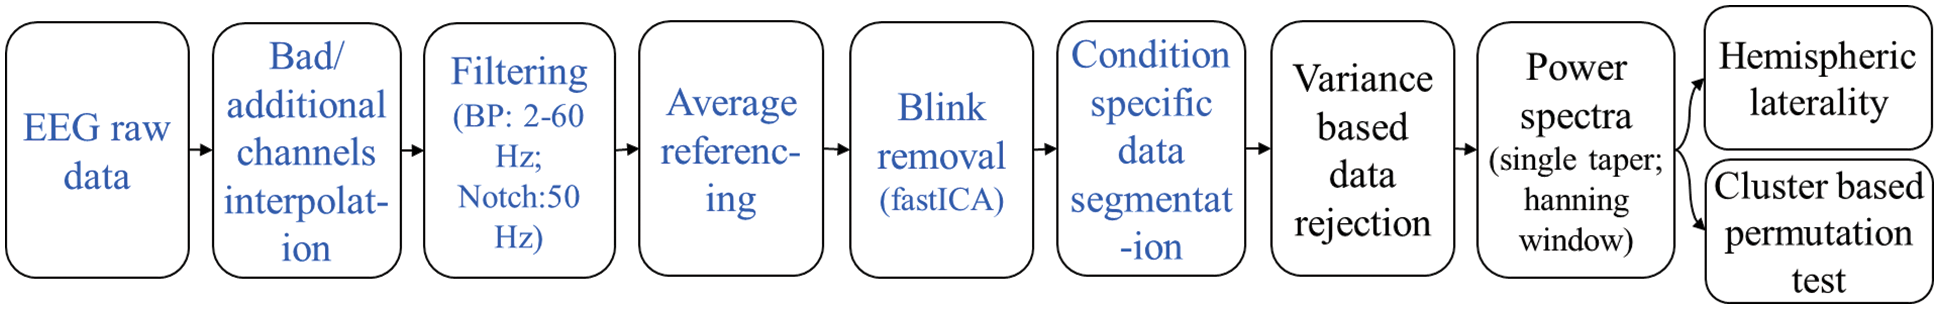
Figure 4: The analysis workflow in MNE-Python (blue) and FieldTrip (black)
2.5.1 Preprocessing of the EEG Data
First, by manually inspecting, we identified and marked if there was a bad EEG channel. Since using the MP150 system, we could acquire data only ten scalp positions with identical EEG channels at the high temporal resolution; therefore, along with the bad channels, if any, we also interpolated EEG data at four important positions—AFz, CPz, P1, and P2; see channels with blue labels in Fig. 5a. These four positions were in close vicinity of the recorded channels minimizing the possible interpolation error. The interpolation was done using the spherical spline method [36], which projects the sensor locations onto a unit sphere and interpolates signals at the bad/missing sensor locations based on good quality signals at nearby locations. Thus, the datasets were transformed into a total of fourteen channels. Subsequently, the new sets of 14-channel EEG data were filtered through a 2–60 Hz bandpass FIR filter followed by a 50 Hz notch filter to remove the power line noise. The filtered data were then re-referenced with the average of all the channels.
To remove the strong artifact due to the eye blinks during the experiment, we applied ICA (independent component analysis) [37]. The eyeblink component was rejected based on the components’ field map, and the clean signal was reconstructed using the rest of the components, shown in Fig. 5b. After that, the blink-removed EEG data sets were segmented for baseline, and the four angular disparity categories utilizing the event markers/triggers saved with the data. Finally, the preprocessed and segmented (condition-specific) EEG data were saved as .fif files for group-wise spectral analysis.
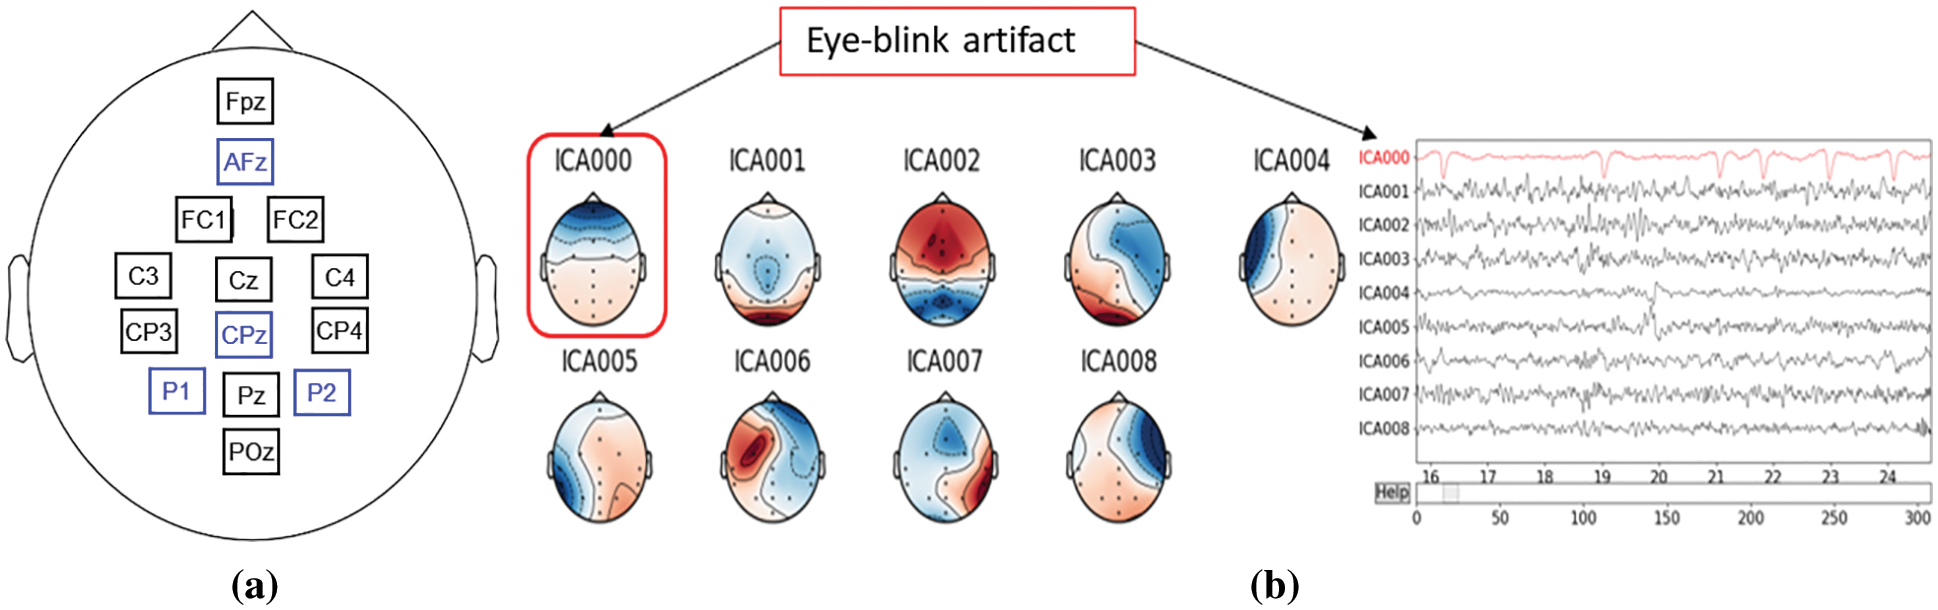
Figure 5: (a) The originally recorded (black) and interpolated channels (blue), (b) signals morphology and eye-blink component selection from ICs
Oscillatory components contained in continuous EEG signals often show changes in power relative to experimental conditions. Since the EEG data were from resting-state recording, we assume that the power spectrum is stationary over time. Hence, we analyzed the power spectrum averaged for the whole duration in one gaming session, not how it changes over time. We computed the PSD (power spectral density) for the preprocessed continuous datasets from all the participants. For computing the PSD, the multitaper method [38,39] for frequency transformation in ft_freqanalysis was utilized with a single hanning taper, a frequency bin of 0.25 Hz, and a non-overlapping window of length 4 s. A variance-based trial rejection method was used while computing the spectra for discarding the windows with variance higher than the 95th percentile of the maximum variance across all the windows [40]. It discarded the windows with the data having excessive movement artifacts. Thus, the data were transformed into condition-specific power spectra for each of the fourteen channels. Further, we computed the baseline normalized power spectra within 2–60 Hz for all channels, dividing the power spectra in each MR condition by the baseline power spectra. It gives the relative change in power from the baseline to each experimental condition, aka. relative power. Fig. 6 shows the distribution of band-specific relative power across brain regions for all four groups compared with the global baseline (mean of all baselines). The figure also plots the variation in averaged relative power for five regions—frontal (F), central (C), left central (CL), right central (CR), and parietal (P). Since the figure indicates that power tends to zero after ∼30 Hz, we constrained our further analysis below 30 Hz.
Using the computed relative power spectra, we applied cluster-based permutation tests [41,42], and hemispheric laterality analysis [43] to investigate the difference between groups due to changes in angular disparity and dimensionality in the computer-game with MR. To infer the statistical significance, we used the alpha level of 0.05 throughout this study.
(a) Cluster-based Permutation Test
As Fig. 6 indicates no changes in power beyond 30 Hz, we constrained our statistical tests within 3.5–30 Hz to improve the sensitivity of the test (i.e., the probability of detecting an effect). Differences in the relative power at the frequency range 3.5–30 Hz between the baseline and each of the four groups of the computer-game were statistically evaluated by a permutation test utilizing ft_freqstatistics.m in the FieldTrip toolbox. The paired sample t-statistic was computed for each EEG channel between the baseline and a gaming group. The channels were clustered based on their spatial adjacency using their neighborhood information. We specified the minimum number of neighboring channels two (cfg.minnbchan = 2) for considering a cluster sample, i.e., a cluster whose t-statistic is higher than the corresponding p < 0.05.
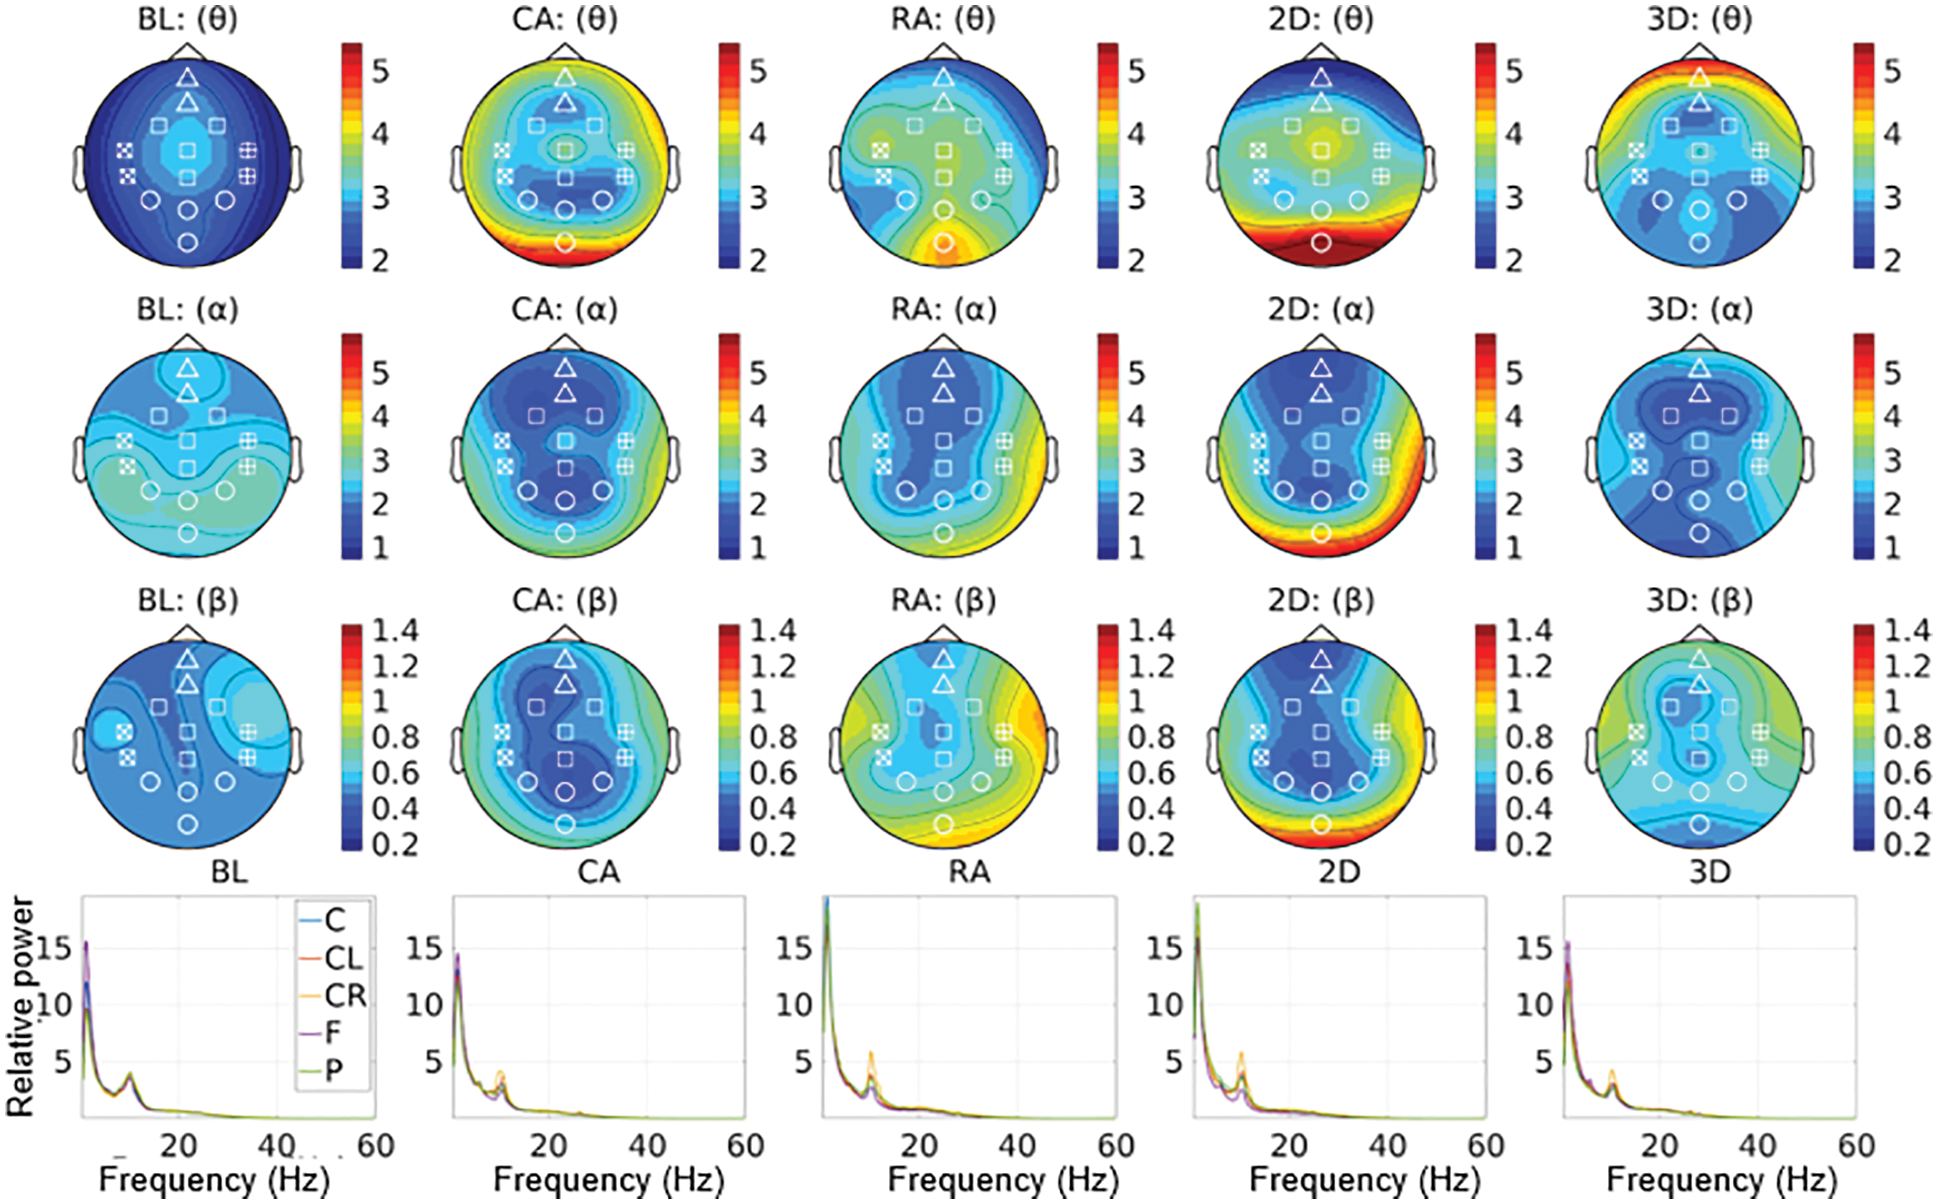
Figure 6: Relative power for all the four groups compared with the baseline for the frequency bands θ (3.5–7.5 Hz), α (7.5–13.0 Hz), and β (13.0–30.0 Hz)
The statistical significance of the spectral power difference between the baseline and a gaming condition was evaluated using a two-tailed t-test where the cluster's observed test statistic was the threshold at the 95th percentile of the null distribution. Subsequently, the cluster level statistic was computed by taking the sum of the t-values in each cluster, compared with the null distribution of the cluster statistics computed from the random permutation steps (5000 times) utilizing the Monte Carlo method. Finally, the p-values of the clusters were computed by estimating the proportion of draws from the permutation distribution with a maximum cluster-level statistic that is larger than the cluster-level statistic.
(b) Hemispheric Lateralization
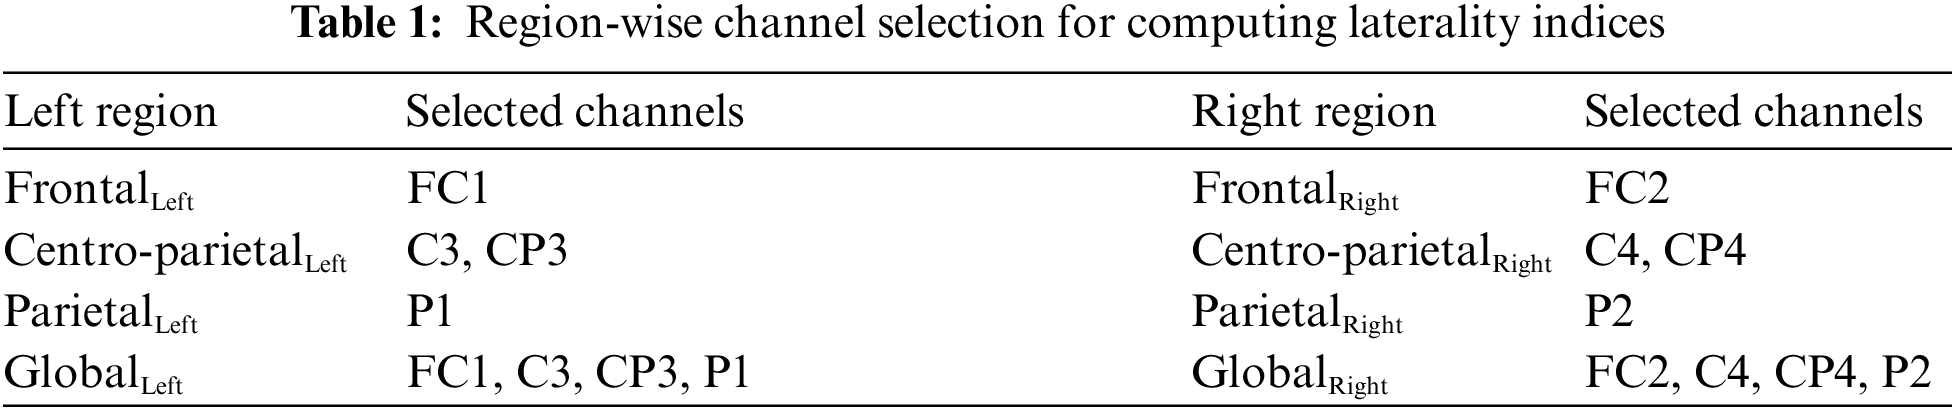
For studying the hemispheric lateralization, we analyzed band-wise regional and global hemispheric laterality. The laterality index (LI), which is the difference between responses from left (PL) and right (PR) hemispheres normalized by the sum of both, was computed as [43]:
Here P represents the relative spectral power, and the values of LI vary between −1 to +1, indicating the complete left to the complete right hemispheric dominance. The values corresponding to frontal, parietal, and central regions were computed for each of the four groups. Similarly, the global laterality indices were computed between the entire left and right hemispheres. The subsets of channels selected for the left and right regions are shown in Tab. 1. The channels close to the midline were excluded from both regions.
3.1 Cluster-based Permutation Tests
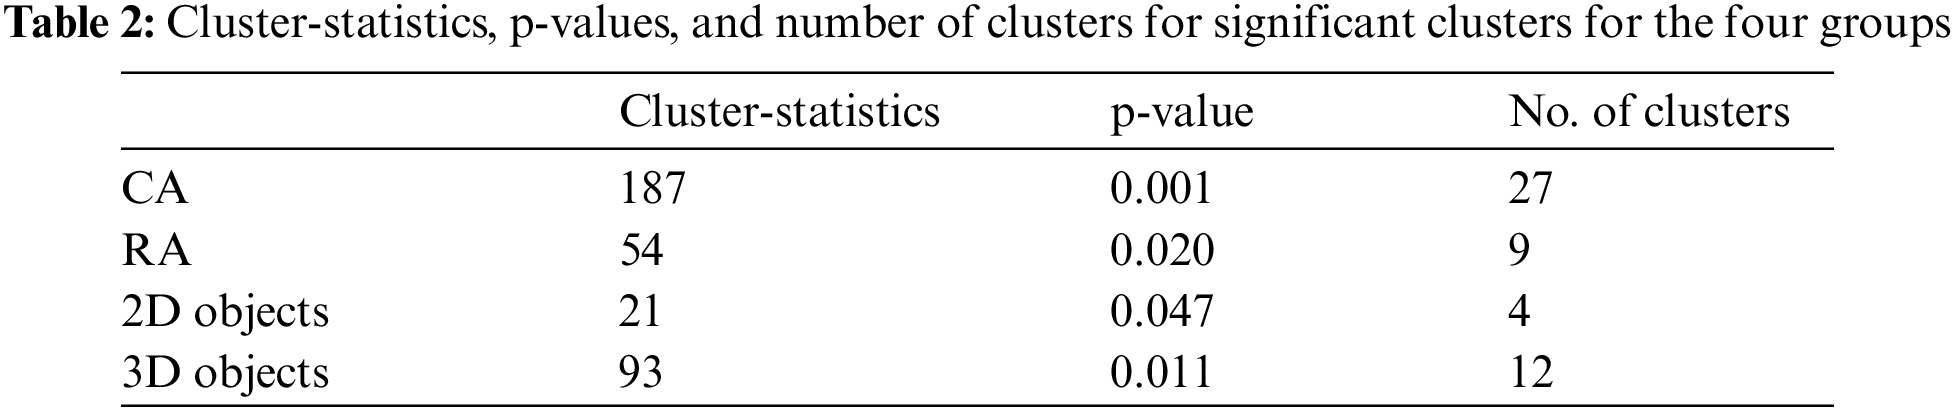
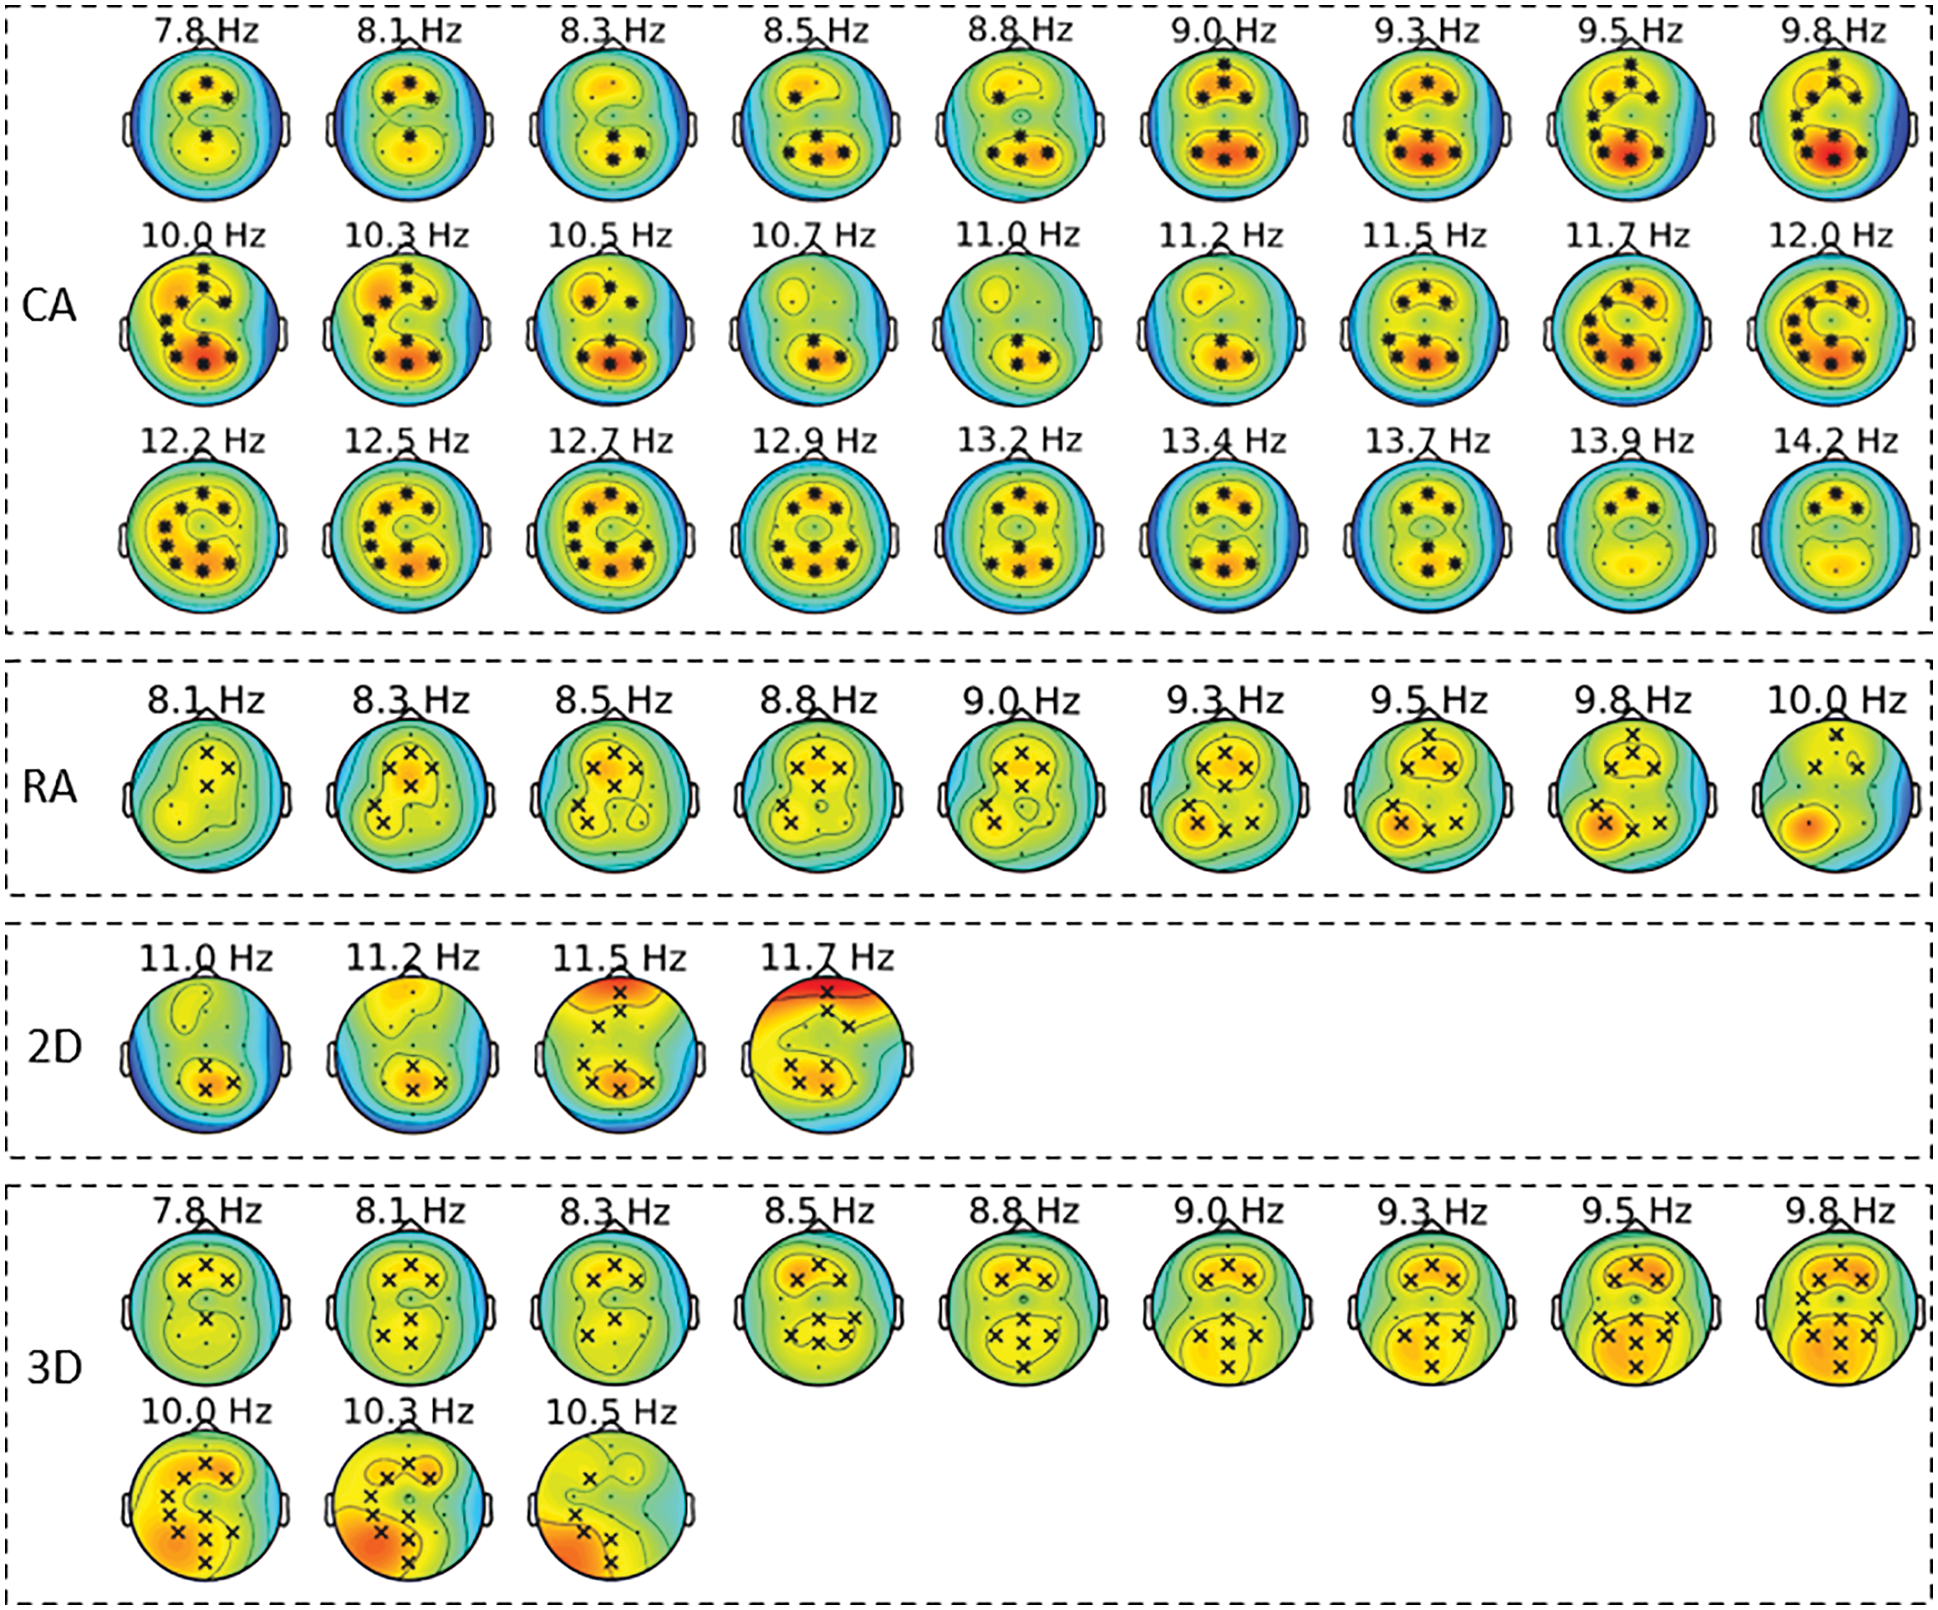
The condition-specific differences from baseline to each of the four groups were examined using the significance threshold of 0.05. Though we applied the test for each of the θ, α, and β bands, the significant clusters were notable around the α frequency range (5–15 Hz) across the four groups. Fig. 7 shows the spatio-spectral changes for all the four groups from the grand baseline, where xlim represents the frequency range on X-axis and ylim represents the relative power on the Y-axis. The vertical grey lines show the frequencies at which the clusters exist with a p-value lower than the significance threshold. For all the four groups, Tab. 2 lists the p-value threshold for the significant clusters, the number of clusters, and the cluster statistics, which is the sum of t-statistics across the clusters with the p-value lower than the threshold mentioned above. Appendix A shows the individual clusters for each of the four groups, where ‘*’ represents a cluster with p < 0.01 and ‘x’ with 0.01 < p < 0.05.
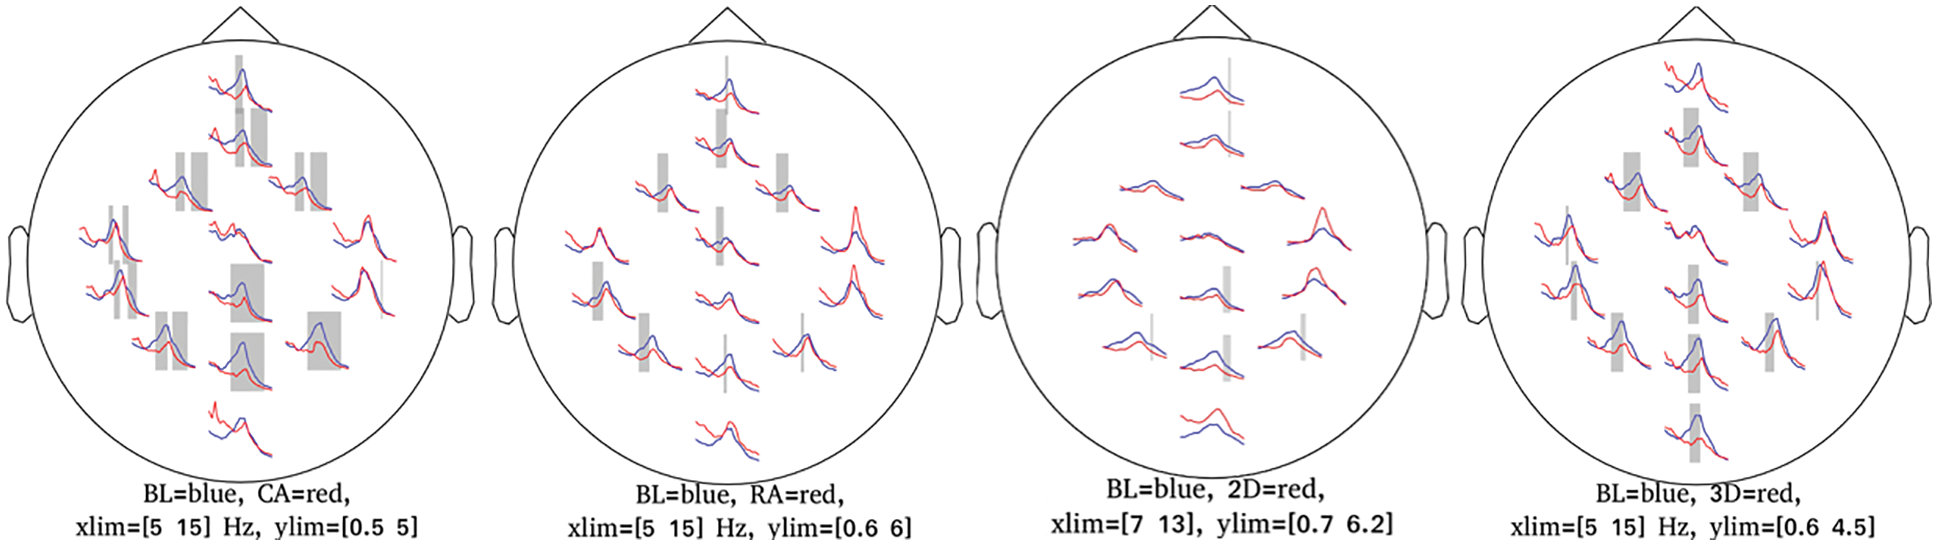
Figure 7: Plots corresponding to the frequency range for significance difference from baseline and most significant clusters
For the CA group, a higher number of clusters were notable in the frontal and parietal regions within the frequency range of 7.8–14.2 Hz. Fig. 7 also shows a few clusters involving the left central EEG channels. Appendix A demonstrates individual clusters at each frequency bin. For the RA group, fewer clusters were notable as compared to the CA group. These clusters were found within a lower alpha range (8.0–10.0 Hz). The clusters for the RA group were more visible in the frontal and left centro-parietal regions. In the case of the 2D group, no significant cluster was observed when applying the test for the frequency range 5–15 Hz; however, a few clusters were found when testing with the frequency range constrained to alpha (7.0–13.0 Hz). These clusters exist within the higher alpha range (11.0–11.7 Hz) involving the frontal and parietal regions. For the 3D group, the clusters were found over the frontal and left centro-parietal regions. These clusters lay within a lower alpha range (7.8–10 Hz).
3.2 Hemispheric Laterality Tests
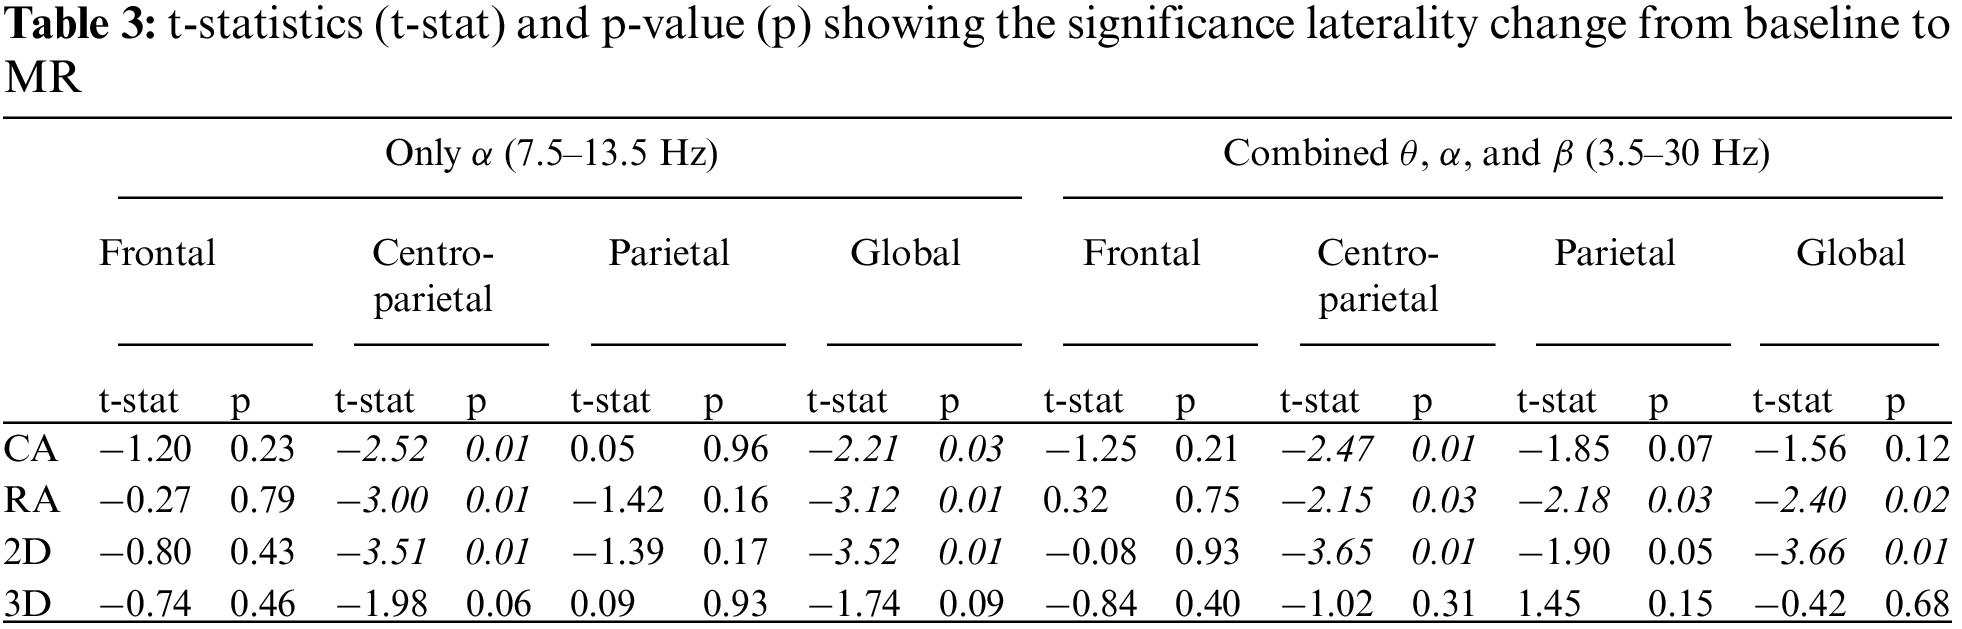
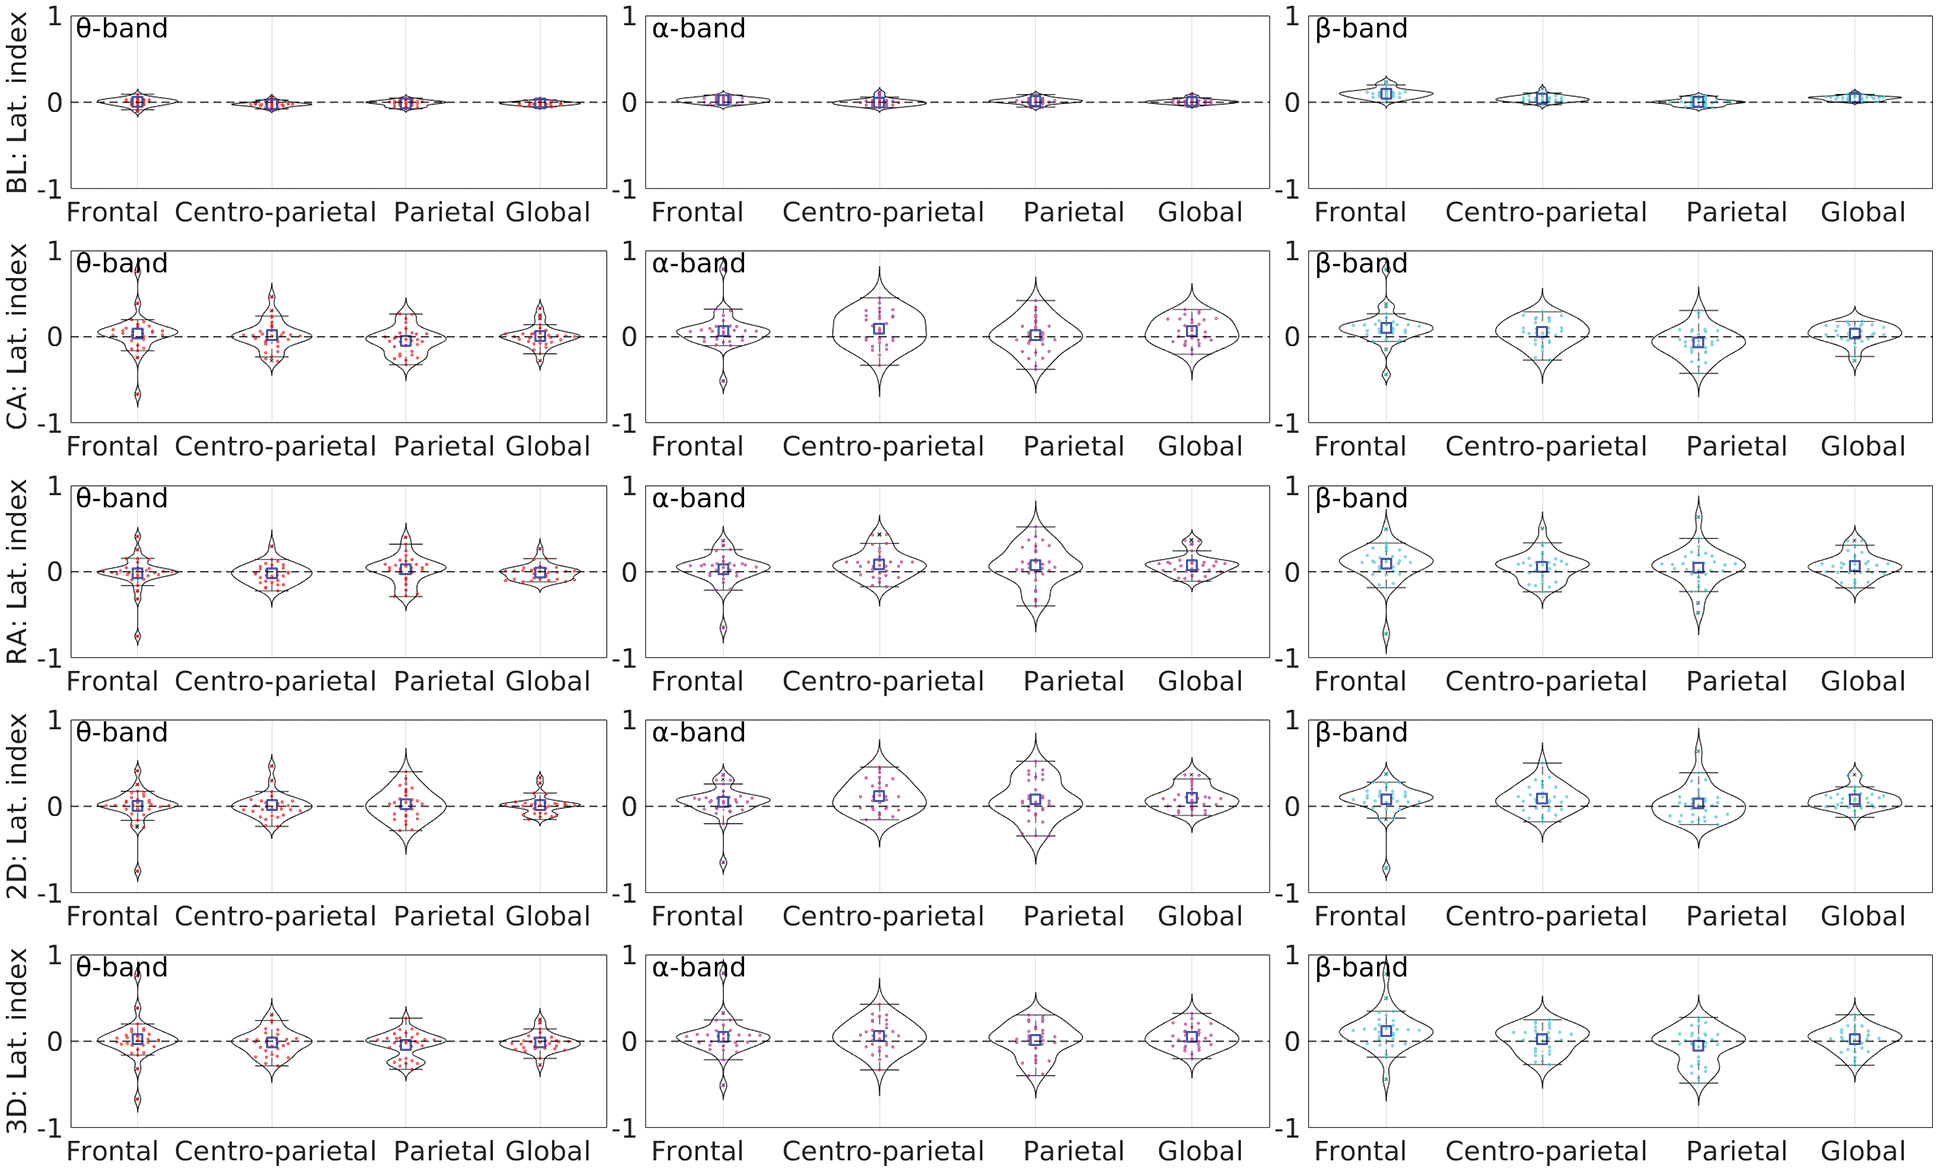
LIs were computed for each subject using the relative power for θ, α, and β bands. The distributions of LIs for all four groups are shown in Appendix B. To examine the laterality changes from baseline, T-statistics was applied separately for the α band and combined θ, α, and β bands, using the significance level 0.05. Tab. 3 lists the t-statistics and p-values for regional and global laterality changes from baseline in all four groups of MR. The italic entries show the significant changes from baseline. The highly significant changes were found in centro-parietal regions for the alpha band, guiding the variation in global laterality. For the frequency range 3.5–30 Hz, similar trends were found.
Further, the t-test was applied with a significance level of 0.05 to evaluate the difference between CA vs. RA and 2D vs. 3D groups across the frequency range of 3.5–30 Hz. The mean LIs for baseline and each group for θ, α, and β bands are shown in Fig. 8. The figure clearly shows the positive LIs for most of the groups. The positive LIs for the α band indicate higher alpha desynchronization in the left hemisphere in all the cases of MR. The CA group showed a significant laterality difference from the RA group only in the parietal region (t-statistics = −2.91, p = 0.01), indicating its right hemispheric dominance; however, the dominant alpha desynchronization in the left hemisphere impacts it, and the synergic effect can be noticed in this band. Similarly, the 3D group showed right-hemispheric dominance in contrast to the left dominating 2D group. The significant differences were found in the centro-parietal (t-statistics = 1.97, p = 0.04) and parietal (t-statistics = 2.43, p = 0.01) regions as well as globally (t-stat = 2.32, p = 0.02). Though the right frontal region showed higher positive mean LIs across all the bands for the CA group compared to the lower LIs for RA, a statistically significant difference was not observed (t-statistics = −0.61, p = 0.23). Because of the system limitation, we could not investigate the temporal or other regions.
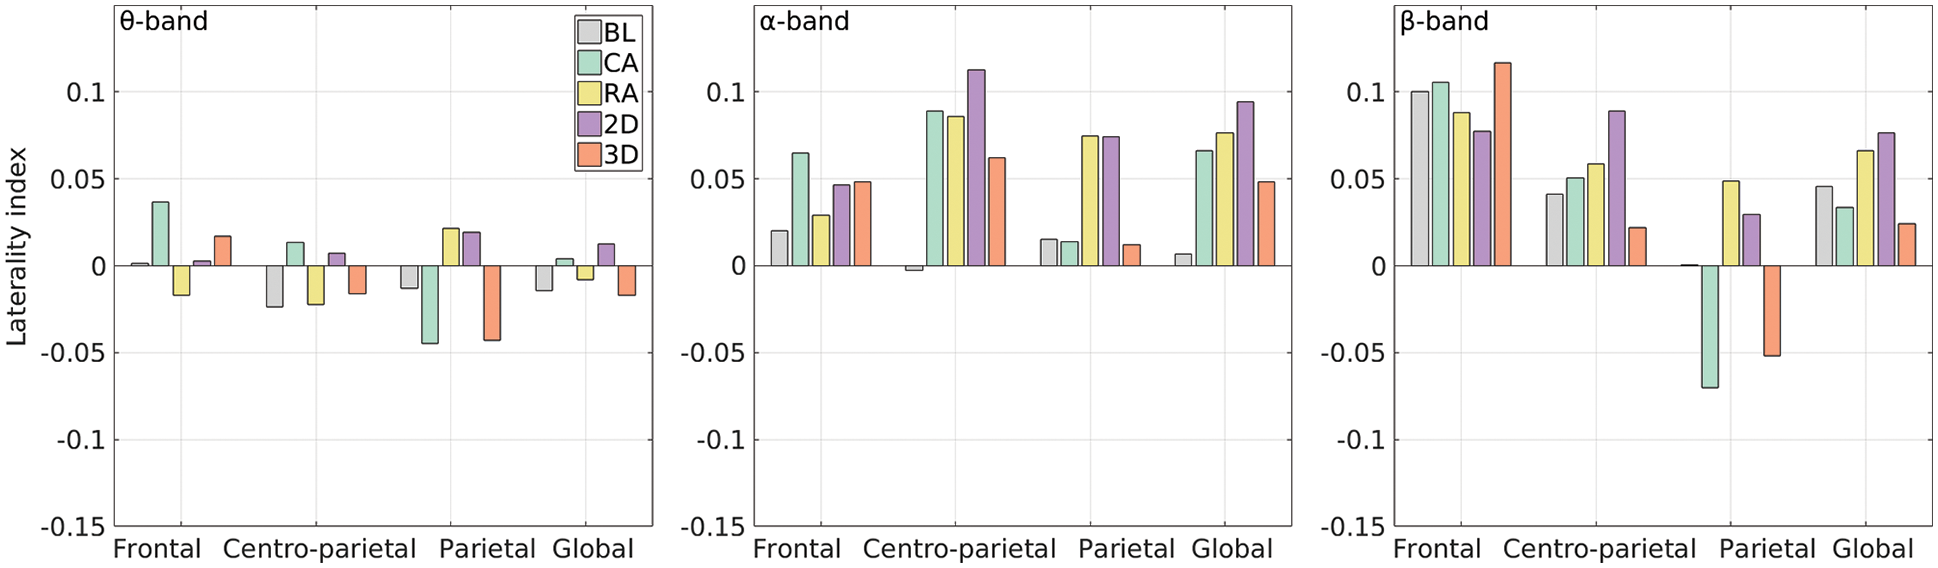
Figure 8: Band-wise mean LIs for each group (legends in the first subplot are valid for all)
In the study, the effects of dimensionality and angular disparity in an MR computer-game were investigated, utilizing the power spectra of EEG recorded during the gameplay. The cluster-based permutation tests were applied to find the spatio-spectral changes in EEG for the four groups of the game from the baseline. We also investigated the regional and global hemispheric laterality for θ, α, and β bands.
The permutation tests showed significant clusters in the frontal, centro-parietal, and parietal regions around the alpha frequency range, which are aligned with our anticipation. The fronto-parietal region is frequently referred to in the previous MR studies and related to the visuospatial representation. The posterior parietal cortex is crucial for representing the spatial maps, mental image formation, and uploading the spatial reference frames [27,44–48]. The decrease in alpha power associates with increased cortical activity in related areas. For instance, reduced alpha power in the parietal region during a cognitive task most likely reflects the cortical activation in the region, indicating the demand for visuospatial representation [24]. Since the tasks in the study were allocentric, increased activation in the bilateral parietal cortex was observed due to the object-centered allocation of attention [49].
For the group that played the MR game with convex angular disparities, significant changes were found across the alpha frequency range and beyond (7.8–14.2 Hz). On the other hand, the group with reflex angular disparity showed fewer clusters with alpha desynchronization limited to lower alpha frequencies (8.1–10.0 Hz). The former group showed a higher level of alpha desynchronization in frontal, left centro-parietal, and parietal regions, whereas, for the latter group, it was in frontal and left parietal regions; these results match our expectations. Previous studies supported the findings for the right-hemispheric bias of clockwise rotation and left for the counter-clockwise [50]. The significant changes in the case of convex angular disparity showed lower hemispheric lateralization and an extended cortical network, whereas the higher level of left-hemispheric lateralization was found in the case of reflex angular disparity. Since no cluster showed a significant change from baseline beyond 5–15 Hz, the cluster-based analysis was limited to this range for better sensitivity.
The statistically significant clusters and the lateralization indices indicate that the MR with reflex angular disparity is globally more left-lateralized than convex angles, which is quite close to our assumption about hemispheric laterality. However, the hemispheric asymmetry in MR processes associates not only the parity judgment but also reflects visuospatial processing, which utilizes the bilateral fronto-parietal network, rather than regions restricted to the posterior parietal regions [23,46,51–55]. In addition, due to the stimulus type, the MR process may require other high-level processing such as planning, reasoning, and other cognitive engagements; therefore, the left hemisphere usually gets more involved in the process.
As it is evident that the MR process also depends on the strategy followed by an individual to execute the task [44], the strategy affects the hemispheric lateralization for the process. The right hemisphere is recruited if the individual uses a holistic strategy (rotating the image/object as a whole), whereas the left hemisphere is recruited when the individual rotates the image/object in a piecemeal manner using an analytic approach. However, in addition to the approach chosen, the type of the objects (stimuli) and familiarity can impact on the selection of the MR strategy. For example, an individual may switch to the piecemeal strategy for ‘complexed-looking’ strange shapes [11] and holistic for the familiar objects or the objects with information, making the rotation easier [56,57].
The MR with 3D objects showed significant changes in EEG spectra in the fronto-parietal regions leaned towards the left for the lower-α band (7.8–10.5 Hz). On the other hand, in MR with 2D objects, we found fewer clusters within a higher alpha range (11.0–11.7 Hz), which slightly deviates from our assumptions. The possible reason for the lower number of significant clusters in the case of the 2D group could be the effect of mixed 2D-3D perception of the 2D objects in the experiment. Since the 2D objects in this study were designed by removing the depth information from the isomorphic 3D objects, they still contained some 3D effects. Therefore, the participants possibly followed different strategies, some of them by putting extra effort involving more reasoning and attention, whereas the others just guessed or randomly chose the answer instead of answering after rotating them mentally. Appendix B also shows that the IQR (interquartile range) for 2D is higher than the 3D, indicating higher variance in the former, which further indicates that the participants possibly followed different strategies rather than only piecemeal or the holistic approaches.
In laterality analysis, the t-statistics over the variation in laterality indices for each of the four groups from the baseline show the significant changes in centro-parietal regions, which are majorly driven by alpha rhythms; see Tab. 3. Further, the global and regional laterality for each of the four groups over the frequency band (3.5–30 Hz) was evaluated; see Fig. 8. The positive values indicate higher right-hemispheric power resulting from the increased desynchronization in the left hemisphere, which indicates a higher level of decision subprocesses and analytical engagement [58]. In the parietal region, the negative LI for CA and positive LI for the RA group were observed, indicating right and left dominating activations; however, the overall left-hemispheric alpha desynchronization impacts synergically reduce the right hemispheric dominance of the parietal region for the alpha range.
The t-test indicated significant changes in the central region and global laterality indices (LIs) from baseline to 2D group for α band and beyond but not for the 3D group. It indicates the hemispheric asymmetry significantly increases from baseline to the MR tasks with 2D objects. Further, the significant difference between LIs for 2D and 3D groups was found for all the regions showing higher positive values for 2D. It contradicts some previous findings suggesting 2D prone to the right following the holistic approach, whereas 3D to the left, utilizing the piecemeal strategy [11]. The possible reasons we find here are the complexity and object unfamiliarity. Since the objects were unfamiliar and the 2D without the depth information was more effort seeking, the subjects have possibly followed the more analytical approach to process the 2D than that of the 3D. Overall, the findings are consistent with those of earlier MR investigations.
Though the permutation-based clustering is a powerful tool to find the sensor level resting-state EEG/MEG (electro encephalogram/magneto encephalogram) spectral changes between the experimental conditions, the higher number of channels could undoubtedly be a strong add on to the study. The individual gold-plated electrodes and more viscous paste (not gel) facilitated us to reduce and sustain the EEG input impedance lower (<5 kΩ), and acquire high fidelity data; however, the study could be reproduced with a dense-EEG, which would enable researchers to investigate also at the source level. Additionally, new advances in signal processing, and the use of machine learning approaches [59,60], can aid in the investigation of any hidden pattern in EEG signals beyond the capability of traditional methods. Such patterns may aid in identifying a biomarker for specific clinical conditions, such as autism. Further, to keep the objects isomorphic in the current study, the 2D objects were designed by removing the depth effect from corresponding 3D models; however, they still had some leftover 3D perception due to design constraints. The perfect isomorphic 2D and 3D models can be designed for future studies to distinguish their effect on MR more precisely.
In this study, the isomorphic 2D and 3D objects with convex and reflex angular disparities were presented as an MR parity judgment task in a computer-game form. The effects of the objects’ dimensionality and angular disparity on the ongoing brain activity were investigated using the recorded EEG signal during the gameplay. Increased alpha desynchronization was found in fronto-parietal regions during the MR games. Further, the left hemispheric laterality was observed within 3.5–30 Hz for most mental rotation cases; however, the activity during the games with convex angular disparity and 3D objects showed the opposite laterality. The finding suggests possibilities of influencing the MR process by manipulating the parameters in computer-games. Furthermore, the correlation of the parameters with cortical functioning shows the possibilities of their effects on cognitive skills associated with fronto-parietal brain regions. The findings have diverse potential applicability in the future. They may help to design/improve computer-games for brain entrainment, which can be utilized in several applications, e.g., mental rotation training. Since computer gaming is increasingly being part of our day-to-day life, it can also be utilized as a covert tool to entrain our cognitive skills behind the entertainment silently. An investigation with a larger sample size and the long-term effect of such games on MR ability may further help to design gaming applications for training and therapeutic applications. Furthermore, the game's complexity can be personalized by utilizing advancements in machine learning, and the acquired neurophysiological data can be further investigated in depth.
Acknowledgement: The authors thank the participants who extended their support in performing the study. The authors would also like to thank Mr. Mrigank Krishan for his help in designing the MR gaming task used in the study.
Funding Statement: A. T. was supported by DST-INSPIRE Program sponsored by Department of Science & Technology, Government of India, Fellowship ID: IF150444, URL: https://www.online-inspire.gov.in/.
Conflicts of Interest: The authors declare that they have no conflicts of interest to report regarding the present study.
1. J. M. Thompson, H. C. Nuerk, K. Moeller and R. C. Kadosh, “The link between mental rotation ability and basic numerical representations,” Acta Psychologica, vol. 144, no. 2, pp. 324–331, 2013. [Google Scholar]
2. M. Stieff, “Mental rotation and diagrammatic reasoning in science,” Learning and Instruction, vol. 17, no. 2, pp. 219–234, 2007. [Google Scholar]
3. K. Seepanomwan, D. Caligiore, A. Cangelosi and G. Baldassarre, “Generalisation, decision making, and embodiment effects in mental rotation: A neurorobotic architecture tested with a humanoid robot,” Neural Networks, vol. 72, pp. 31–47, 2015. [Google Scholar]
4. V. Critten, E. Campbell, E. Farran and D. Messer, “Visual perception, visual-spatial cognition and mathematics: Associations and predictions in children with cerebral palsy,” Research in Developmental Disabilities, vol. 80, pp. 180–191, 2018. [Google Scholar]
5. R. N. Shepard and J. Metzler, “Mental rotation of three-dimensional objects,” Science, vol. 171, no. 3972, pp. 701–703, 1971. [Google Scholar]
6. L. A. Cooper, “Mental rotation of random two-dimensional shapes,” Cognitive Psychology, vol. 7, no. 1, pp. 20–43, 1975. [Google Scholar]
7. B. Bałaj, “The influence of object complexity and rotation angle on eye movements during mental rotation,” Roczniki Psychologiczne, vol. 18, no. 4, pp. 485–503, 2015. [Google Scholar]
8. S. G. Vandenberg and A. R. Kuse, “Mental rotations, a group test of three-dimensional spatial visualization,” Perceptual and Motor Skills, vol. 47, no. 2, pp. 599–604, 1978. [Google Scholar]
9. M. A. Just and P. A. Carpenter, “Eye fixations and cognitive processes,” Cognitive Psychology, vol. 8, pp. 441–480, 1976. [Google Scholar]
10. M. A. Just and P. A. Carpenter, “Cognitive coordinate systems: Accounts of mental rotation and individual differences in spatial ability,” Psychological Review, vol. 92, pp. 137–172, 1985. [Google Scholar]
11. C. E. Bethell-Fox and R. N. Shepard, “Mental rotation: Effects of stimulus complexity and familiarity,” Journal of Experimental Psychology: Human Perception and Performance, vol. 14, no. 1, pp. 12–23, 1988. [Google Scholar]
12. S. Shepard and D. Metzler, “Mental rotation: Effects of dimensionality of objects and type of task,” Journal of Experimental Psychology: Human Perception and Performance, vol. 14, no. 1, pp. 3–11, 1988. [Google Scholar]
13. A. R. Nikolaev and A. P. Anokhin, “EEG frequency ranges during perception and mental rotation of two-and three-dimensional objects,” Neuroscience and Behavioral Physiology, vol. 28, no. 6, pp. 670–677, 1998. [Google Scholar]
14. T. S. Redick and S. B. Webster, “Videogame interventions and spatial ability interactions,” Frontiers in Human Neuroscience, vol. 8, no. 183, pp. 1–5, 2014. [Google Scholar]
15. N. Van Meerten, K. Varma, M. Gravelle, N. Miller, E. Kraikul et al., “Evidence of a relationship between mental rotation skills and performance in a 3D puzzle game,” Frontiers in Education, vol. 4, no. 82, pp. 1–6, 2019. [Google Scholar]
16. L. Milani, S. Grumi and P. Di Blasio, “Positive effects of videogame use on visuospatial competencies: The impact of visualization style in preadolescents and adolescents,” Frontiers in Psychology, vol. 10, no. 1226, pp. 1–9, 2019. [Google Scholar]
17. C. S. Green and D. Bavelier, “Action video game modifies visual selective attention,” Nature, vol. 423, no. 6939, pp. 534–537, 2003. [Google Scholar]
18. C. S. Green and D. Bavelier, “Effect of action video games on the spatial distribution of visuospatial attention,” Journal of Experimental Psychology: Human Perception and Performance, vol. 32, no. 6, pp. 1465–1478, 2006. [Google Scholar]
19. J. Feng, I. Spence and J. Pratt, “Playing an action video game reduces gender differences in spatial cognition,” Psychological Science, vol. 18, no. 10, pp. 850–855, 2007. [Google Scholar]
20. I. D. Cherney, “Mom, let me play more computer games: They improve my mental rotation skills,” Sex Roles, vol. 59, no. 11–12, pp. 776–786, 2008. [Google Scholar]
21. A. C. Oei and M. D. Patterson, “Enhancing cognition with video games: A multiple game training study,” PLoS One, vol. 8, no. 3, pp. e58546, 2013. [Google Scholar]
22. A. L. Gardony, M. D. Eddy, T. T. Brunyé and H. A. Taylor, “Cognitive strategies in the mental rotation task revealed by EEG spectral power,” Brain and Cognition, vol. 118, pp. 1–18, 2017. [Google Scholar]
23. M. S. Cohen, S. M. Kosslyn, H. C. Breiter, G. J. DiGirolamo, W. L. Thompson et al., “Changes in cortical activity during mental rotation A mapping study using functional MRI,” Brain, vol. 119, no. 1, pp. 89–100, 1996. [Google Scholar]
24. M. A. Just, P. A. Carpenter, M. Maguire, V. Diwadkar and S. McMains, “Mental rotation of objects retrieved from memory: A functional MRI study of spatial processing,” Journal of Experimental Psychology: General, vol. 130, no. 3, pp. 493–504, 2001. [Google Scholar]
25. H. Kawamichi, Y. Kikuchi and S. Ueno, “Spatio-temporal brain activity related to rotation method during a mental rotation task of three-dimensional objects: An MEG study,” Neuroimage, vol. 37, no. 3, pp. 956–965, 2007. [Google Scholar]
26. J. M. Zacks, “Neuroimaging studies of mental rotation: A meta-analysis and review,” Journal of Cognitive Neuroscience, vol. 20, no. 1, pp. 1–19, 2008. [Google Scholar]
27. M. Thomas, M. Dalecki and V. Abeln, “EEG coherence during mental rotation of letters, hands and scenes,” International Journal of Psychophysiology, vol. 89, no. 1, pp. 128–135, 2013. [Google Scholar]
28. A. Tiwari, R. B. Pachori and P. K. Sanjram, “Isomorphic 2D/3D objects and saccadic characteristics in mental rotation,” Computers, Materials & Continua, vol. 70, no. 1, pp. 433–450, 2021. [Google Scholar]
29. B. Milivojevic, J. P. Hamm and M. C. Corballis, “Hemispheric dominance for mental rotation: It is a matter of time,” Neuroreport, vol. 20, no. 17, pp. 1507–1512, 2009. [Google Scholar]
30. E. A. Feredoes and P. S. Sachdev, “Differential effects of transcranial magnetic stimulation of left and right posterior parietal cortex on mental rotation tasks,” Cortex, vol. 42, no. 5, pp. 750–754, 2006. [Google Scholar]
31. C. Meneghetti, E. Borella and F. Pazzaglia, “Mental rotation training: Transfer and maintenance effects on spatial abilities,” Psychological Research, vol. 80, no. 1, pp. 113–127, 2016. [Google Scholar]
32. J. Haas, “A history of the unity game engine,” Dissertation, Worcester Polytechnic Institute, United States, 2014. [Google Scholar]
33. B. O. Community, “Blender-a 3D modelling and rendering package,” Stichting Blender Foundation, Amsterdam, 2018. [Online]. Available: http://www.blender.org. [Google Scholar]
34. A. Gramfort, M. Luessi, E. Larson, D. A. Engemann, D. Strohmeier et al., “MEG and EEG data analysis with MNE-python,” Frontiers in Neuroscience, vol. 7, no. 267, pp. 1–13, 2013. [Google Scholar]
35. R. Oostenveld, P. Fries, E. Maris and J. M. Schoffelen, “FieldTrip: Open-source software for advanced analysis of MEG, EEG, and invasive electrophysiological data,” Computational Intelligence and Neuroscience, vol. 2011, no. 156869, pp. 1–9, 2011. [Google Scholar]
36. F. Perrin, J. Pernier, O. Bertrand and J. F. Echallier, “Spherical splines for scalp potential and current density mapping,” Electroencephalography and Clinical Neurophysiology, vol. 72, no. 2, pp. 184–187, 1989. [Google Scholar]
37. A. Hyvarinen, “Fast and robust fixed-point algorithms for independent component analysis,” IEEE Transactions on Neural Networks, vol. 10, no. 3, pp. 626–634, 1999. [Google Scholar]
38. D. B. Percival and A. T. Walden, Spectral Analysis for Physical Applications. 1st ed., Cambridge, United Kingdom: Cambridge University Press, pp. 1–545, 1993. [Google Scholar]
39. P. P. Mitra and B. Pesaran, “Analysis of dynamic brain imaging data,” Biophysical Journal, vol. 76, no. 2, pp. 691–708, 1999. [Google Scholar]
40. A. Jaiswal, J. Nenonen, M. Stenroos, A. Gramfort, S. S. Dalal et al., “Comparison of beamformer implementations for MEG source localization,” NeuroImage, vol. 216, no. 116797, pp. 1–15, 2020. [Google Scholar]
41. E. Maris and R. Oostenveld, “Nonparametric statistical testing of EEG-and MEG-data,” Journal of Neuroscience Methods, vol. 164, no. 1, pp. 177–190, 2007. [Google Scholar]
42. E. Maris, “Statistical testing in electrophysiological studies,” Psychophysiology, vol. 49, no. 4, pp. 549–565, 2012. [Google Scholar]
43. M. L. Seghier, “Laterality index in functional MRI: Methodological issues,” Magnetic Resonance Imaging, vol. 26, no. 5, pp. 594–601, 2008. [Google Scholar]
44. B. Tomasino and M. Gremese, “Effects of stimulus type and strategy on mental rotation network: An activation likelihood estimation meta-analysis,” Frontiers in Human Neuroscience, vol. 9, no. 693, pp. 1–26, 2016. [Google Scholar]
45. L. Jäncke and K. Jordan K, “Functional neuroanatomy of mental rotation performance,” in Spatial Processing in Navigation, Imagery and Perception, 1st ed., Boston, MA: Springer, pp. 183–207, 2007. [Google Scholar]
46. J. Bhattacharya, H. Petsche, U. Feldmann and B. Rescher, “EEG Gamma-band phase synchronisation between posterior and frontal cortex during mental rotation in humans,” Neuroscience Letters, vol. 311, no. 1, pp. 29–32, 2001. [Google Scholar]
47. E. Ciaramelli, R. S. Rosenbaum, S. Solcz, B. Levine and M. Moscovitch, “Mental space travel: Damage to posterior parietal cortex prevents egocentric navigation and reexperiencing of remote spatial memories,” Journal of Experimental Psychology: Learning, Memory, and Cognition, vol. 36, no. 3, pp. 619, 2010. [Google Scholar]
48. M. Mishkin, L. G. Ungerleider and K. A. Macko, “Object vision and spatial vision: Two cortical pathways,” Trends in Neurosciences, vol. 6, pp. 414–417, 1983. [Google Scholar]
49. K. D. Wilson, M. G. Woldorff and G. R. Mangun, “Control networks and hemispheric asymmetries in the parietal cortex during attentional orienting in different spatial reference frames,” NeuroImage, vol. 25, no. 3, pp. 668–683, 2005. [Google Scholar]
50. L. A. Burton, N. Wagner, C. Lim and J. Levy, “Visual field differences for clockwise and counter-clockwise mental rotation,” Brain and Cognition, vol. 18, no. 2, pp. 192–207, 1992. [Google Scholar]
51. H. Koshino, P. A. Carpenter, T. A. Keller and M. A. Just, “Interactions between the dorsal and the ventral pathways in mental rotation: An fMRI study,” Cognitive, Affective, & Behavioral Neuroscience, vol. 5, no. 1, pp. 54–66, 2005. [Google Scholar]
52. K. Jordan, J. Schadow, T. Wuestenberg, H. J. Heinze and L. Jäncke, “Different cortical activations for subjects using allocentric or egocentric strategies in a virtual navigation task,” Neuroreport, vol. 15, no. 1, pp. 135–40, 2004. [Google Scholar]
53. C. Lamm, C. Windischberger, U. Leodolter, E. Moser and H. Bauer, “Evidence for premotor cortex activity during dynamic visuospatial imagery from single-trial functional magnetic resonance imaging and event-related slow cortical potentials,” NeuroImage, vol. 14, no. 2, pp. 268–83, 2001. [Google Scholar]
54. I. M. Harris, G. F. Egan, C. Sonkkila, H. J. Tochon-Danguy, G. Paxinos et al., “Selective right parietal lobe activation during mental rotation: A parametric PET study,” Brain, vol. 123, no. 1, pp. 65–73, 2000. [Google Scholar]
55. G. A. Tagaris, W. Richter, S. G. Kim, G. Pellizzer, P. Andersen et al., “Functional magnetic resonance imaging of mental rotation and memory scanning: A multidimensional scaling analysis of brain activation patterns,” Brain Research Reviews, vol. 6, no. 2–3, pp. 106–112, 1998. [Google Scholar]
56. B. Milivojevic, B. W. Johnson, J. P. Hamm and M. C. Corballis, “Non-identical neural mechanisms for two types of mental transformation: Event-related potentials during mental rotation and mental paper folding,” Neuropsychologia, vol. 41, pp. 1345–4356, 2003. [Google Scholar]
57. B. Milivojevic, J. P. Hamm and M. C. Corballis, “Functional neuroanatomy of mental rotation,” Journal of Cognitive Neuroscience, vol. 21, no. 5, pp. 945–959, 2009. [Google Scholar]
58. H. S. Gill, M. W. O'Boyle and J. Hathaway, “Cortical distribution of EEG activity for component processes during mental rotation,” Cortex, vol. 34, no. 5, pp. 707–718, 1998. [Google Scholar]
59. M. T. Sadiq, X. Yu, Z. Yuan and M. Z. Aziz, “Motor imagery BCI classification based on novel two-dimensional modelling in empirical wavelet transform,” Electronics Letters, vol. 56, no. 25, pp. 1367–1369, 2020. [Google Scholar]
60. M. T. Sadiq, X. Yu, Z. Yuan, Z. Fan, A. U. Rehman et al., “Motor imagery EEG signals classification based on mode amplitude and frequency components using empirical wavelet transform,” IEEE Access, vol. 7, pp. 127678–127692, 2019. [Google Scholar]
Appendix A. Significant clusters for the four analysis groups
Appendix B. Band-wise laterality indices distribution for all participants
 | This work is licensed under a Creative Commons Attribution 4.0 International License, which permits unrestricted use, distribution, and reproduction in any medium, provided the original work is properly cited. |