DOI:10.32604/cmc.2022.023878
| Computers, Materials & Continua DOI:10.32604/cmc.2022.023878 | |
| Article |
Classification COVID-19 Based on Enhancement X-Ray Images and Low Complexity Model
1Department of Information Technology, Technical College of Management, Kufa, Al Furat Alawsat University, Iraq
2Department of Medical Laboratory Techniques, Al-Mustaqbal University College, Hilla, Iraq
3Department of Computer Science, College of Computer and Information Sciences, Jouf University, Saudi Arabia
4Department of Computer Science, Faculty of Computers and Information, South Valley University, Qena, Egypt
*Corresponding Author: Ahmed Elaraby. Email: ahmed.elaraby@svu.edu.eg
Received: 24 September 2021; Accepted: 15 December 2021
Abstract: COVID-19 has been considered one of the recent epidemics that occurred at the last of 2019 and the beginning of 2020 that world widespread. This spread of COVID-19 requires a fast technique for diagnosis to make the appropriate decision for the treatment. X-ray images are one of the most classifiable images that are used widely in diagnosing patients’ data depending on radiographs due to their structures and tissues that could be classified. Convolutional Neural Networks (CNN) is the most accurate classification technique used to diagnose COVID-19 because of the ability to use a different number of convolutional layers and its high classification accuracy. Classification using CNNs techniques requires a large number of images to learn and obtain satisfactory results. In this paper, we used SqueezNet with a modified output layer to classify X-ray images into three groups: COVID-19, normal, and pneumonia. In this study, we propose a deep learning method with enhance the features of X-ray images collected from Kaggle, Figshare to distinguish between COVID-19, Normal, and Pneumonia infection. In this regard, several techniques were used on the selected image samples which are Unsharp filter, Histogram equal, and Complement image to produce another view of the dataset. The Squeeze Net CNN model has been tested in two scenarios using the 13,437 X-ray images that include 4479 for each type (COVID-19, Normal and Pneumonia). In the first scenario, the model has been tested without any enhancement on the datasets. It achieved an accuracy of 91%. But, in the second scenario, the model was tested using the same previous images after being improved by several techniques and the performance was high at approximately 95%. The conclusion of this study is the used model gives higher accuracy results for enhanced images compared with the accuracy results for the original images. A comparison of the outcomes demonstrated the effectiveness of our DL method for classifying COVID-19 based on enhanced X-ray images.
Keywords: COVID-19; X-ray; image enhancement; classification; CNN; SqueezNet model
The pandemic of COVID-19 still has a destructive effect on the world population health. The number of new infections with COVID-19 may not explain the difference in totals of yesterday and today and that because of the differences in methods of reporting, unification of data retrospectively, or delays of reporting. Present official counts of certain cases of COVID-19 are reported by WHO (World Health Organization) COVID-19 Situation, consequently, reports of WHO is more different than other sources of COVID-19 according to containment criteria and different data severance times are to be predicted [1].
Early detection of coronavirus cases is vital so that patients with the disease can be quarantined to reduce transmission. Currently, the gold standard for diagnosing COVID-19 is real-time reverse transcription-polymerase chain reaction (RT-PCR), which is a laboratory-based procedure to test for the presence of SARS-CoV-2 RNA (ribonucleic acid) in a sample (more recently saliva sample) taken from the patient. Typically, a real-time RT-PCR process takes approximately 4–6 h to obtain the test results. Furthermore, RT-PCR test kits are short in supply. Consequently, many COVID-19 patients cannot be identified at early stages and are likely to infect other people inadvertently [2].
Many deep learning-based artificial intelligence (AI) systems have been proposed, and the results show that the chest X-ray images benefit the detection of COVID-19 infection patients, and can effectively improve the accuracy of detection [3].
The screening of infected patients is the important step in the warfare towards COVID-19, using radiography of the chest as one of the main approaches of screening being radiological imaging [4]. The need for fast and accurate techniques for diagnosing viral and emergent diseases was demonstrated by coronavirus disease 2019 (COVID-19). Computed tomography (CT) images of lungs of patients and X-rays were used by medical personnel to diagnose COVID-19 [5]. The need for a diagnostic depending on a computational model-based has increased since the pandemic flare-up. This needs to support the test and diagnosis of COVID-19 when using chest X-ray medical imaging (CXR) scans [2]. The first imaging technique that is used for the diagnosis of COVID-19 disease is the Chest X-ray. Because of the large-scale images with high information datasets, high accuracy has been carried out using convolution neural networks (CNNs) for the classification and detecting of COVID-19 cases in such images [6]. Using chest X-ray images, many researchers have stated the efficiency of adopting deep learning classifiers in classifying COVID-19 from images of chest X-rays [7].
The produced images of structures and tissues within the body are form rays of visible light that have high energy sneak to the body to constitute what is called X-ray images. These images could be for bones, teeth, and chest. According to its affectivity for long periods, an X-ray is used to diagnose tumours, fractures, dental problems, and pneumonia [8]. Processing medical images are one of the important steps that assist in enhancing the results of studies and research. Studying in this spot is achieved to assist in diagnosing the disease using Computed tomography (CT) scans or chest X-rays for patients who have typical lung pneumonia [9]. Convolutional neural networks (CNNs) protrude when speaking about using machine learning and artificial intelligence in the medical domain. The major functions of CNNs which are deep artificial neural networks are image classification, collect them depending on similarity, and executing recognition of objects. The inspiration of the networks in the human visual shell processing and applied on the medical image because of the availability of abnormal morphology of tissue that used to detect tumours. CNN's can diagnose patterns more efficient than specialists of humans [10].
In [6] author used CNN to train two models using X-ray images, the first model to classify three classes: normal, COVID-19, and some other classes, the second model used to classify 14 other chest and diseases related with it. When there is a little number of enough training data and resources of computations then the best choice is Transfer learning for CNN training. For the initialization of weights, ImageNet is used as the learnt parameters on large data. To make training and classification take little time for completing, with no special requirements for GPU's, transfer learning can be represented in CPU's [11]. DeTraC model contains three phases. The training of the back-bone model of pre-trained CNN of DeTraC to extract local features from each image represents the first phase. Then the class-decomposition layer of DeTraC makes the local structure of the distribution of data more simply [1].
In this paper, one of the convolutional neural networks called SqueezeNet is used to classify data into three classes: COVID-19, Pneumonia, or Normal. The main advantage of using SqueezeNet is its simple nature and the and the small number of parameters that could be used which reduce the size of the network. The second reason is that we have a small number of classes that fit with this type of network because as it is well known, CNN can classify about one thousand classes. The datasets which used in this paper are preprocessed by using some image enhancement techniques like (Unsharp, Histogram Equal, Incompliant) to enhance the results of classification. The experimental results show that the accuracy of classifying enhanced data is higher than the accuracy of classifying the original data.
This paper is organized as the following, in Section 2. Many related studies are discussed and analyzed with their advantages and disadvantages. Section 3. Presents the main used methods with their explanation. The details of the used methods are presented in Sections 3.1–3.4. The important results of this paper are highlighted and analyzed in Section 4. Finally, the basic conclusions and future works are presented in Section 5.
As it was stated earlier that x-ray images with a convolutional neural network are the ideal way for diagnosing novel coronavirus (COVID-19) pneumonia. In [12], X-rays and CT scan images are used with convolution neural network (CNN) and AlexNet that is pre-trained and modified. There are two algorithms used here: the architecture of CNN and AlexNet (a transfer learning algorithm). Through several convolutional layers then through neural layers that are fully connected, the relevant features are extracted by CNN algorithms. When the data are returned in a spatial domain like the applications of image processing, the best method to be applied to these solutions is CNN. A simple CNN architecture is used to detect COVID-19 cases where that architecture contains one convolutional layer with 16 filters, batch normalization, ReLU (rectified linear unit), two fully connected layers, classification layer and SoftMax. A “Glorot” is used to make the initialization of the weights and cross-entropy that is used as a loss function in the layer of classification.
The alternation for RT-PCR testing is the combination between X-ray radiography (CXR) images and DL (Deep learning) for the classification of images. Over the past few months, the usage of it discussed widely and its powerful effectiveness remains unclear. For the classification of COVID-19 cases from normal cases, a lot of DL-methods were used. However, when the problem of classification COVID-19 is a multi-class, pneumonia, and normal cases mainly according to two factors: 1) the similarity of the textures of CXR images and pneumonia cases, and 2) the comparison between the number of COVID-19 infections and other two classes. To fix these problems, a new framework was adopted to learn DCNN (Deep Convolutional Neural Network) to achieve accurate classifying of pneumonia cases and COVID-19 from normal cases by using CXR images [13].
An efficient and accurate CNN classification was a challenge because of the availability of the insufficient–size and bad-quality datasets of the chest X-ray images. To address the challenges of the small-size and imbalanced datasets that are related to the quality of image, different techniques and different phases were used to preprocess the data, the purpose is to produce an effective dataset for training the modified CNN to gain good performance. The stages used to preprocess the data contains dataset balancing, image analysis by medical experts, and augmentation of data [14].
For the diagnosis of COVID-19 with high accuracy using images of X-ray, the authors in [15] aimed to present the use of deep learning which contains the training of classifiers of machine learning and deep learning. Four variant architectures of networks with different numbers of convolutional and connected layers with full form, and some of the basic techniques of preprocessing to test the results using different types of structures and different preprocessing techniques.
In [16], a novel model for the detection of COVID-19 automatically by using chest X-ray images without any enhancements on these images is presented. The basic goal of the development of this model is to provide diagnostic with accurate findings for the classification of binary (COVID vs. No-Findings) and classification with multi-class (COVID vs. No-Findings vs. Pneumonia). An intellectual approach is to build a model using a previously proven model, therefore there is no need to initialize a deep model from the beginning. Therefore, the starting point was the Darknet-19 model. Darknet-19 model is a model for classification that provides the basis for a real-time system for object detection YOLO (You only look once). This system has a special architecture designed for the detection of objects. Compared with the original DarkNet architectures, they have used fewer layers and filters. Gradually, the number of filters increased like 8, 16, 32. The number of convolutional layers in this model is 19 and the number of pooling layers is five, using Maxpool. The types of these used layers are typical CNN layers that contain a variant number of filters, stride values, and sizes.
Another type of CNN's-special architecture design with optimized parameters was proposed in [17] that performs effectively on recent data. Where the focus of this architecture was the reducing complexities of a network while retaining a high level of accuracy. There were many optimization steps to make the performance with an excellent level and plain design. Moreover, extra datasets, not used in the training phase were used by the proposed architecture to prove its effectiveness. Consequently, the proposed architecture has these main properties: 1) identification of COVID-19 with high accuracy, 2) compared to other recent models, there is a high reduction in system complexity, 3) The model is usable when the execution environment has limited resources, 4) using of external datasets that not used in the training process to assess the effectivity of the system.
The image-based diagnosis presented in [18] gets a revolutionary change in coronavirus infection classification in the body of humans easily where false positives and false negatives are zero or near to zero. In this model, a convolutional neural network (CNN) based growing of multi-image technique is adopted to detect COVID-19 in CT scan images and chest X-Ray of suspicious persons. Multi-image growing exploits the discontinuity figuration gained in the classified images for making the number of active examples increased for training the CNN model. The basic structure of the LeNet model is made used to execute training and classification with the growing multi-image CNN model. Using CT scans and X-ray images of lungs, the LeNet is trained to detect COVID and non-COVID cases. Pooling, convolutional, and connected layers with full form as LeNet model are three layers and viz. RELU and sigmoid are two activation functions were used by the CNN model. After the convolutional layer, RELU is used and for detection of COVID and non-COVID, sigmoid is used. SGD (standard stochastic gradient descent) optimizer with loss function for a binary cross-entropy and 32 batches in the training stage is used.
Using chest X-rays and taking into consideration memory and time of processing for COVID-19 classification, an accurate and efficient method was represented in [19]. Based on the efficiency of the Efficient Net of deep artificial neural networks family that is known with high accuracy and low disadvantages, they proposed new models. The main classification of the problem with a hierarchical classifier was exploited. The efficient Net is a family of models. (B0) is a base architecture represented with the assistance of the Network Architecture Search (NAS) method. The Mobile Inverted Bottleneck Conv (MBconv) is the main component of that architecture. The logical basis of the Efficient Net family is, to begin with, a model with high quality than scale its dimensions with a constant coefficient of scaling systematically.
In [20], To decrease the number of dimensions of data and retain necessary covariance's and invariances, the representation of data is done using early machine learning techniques that rely on features that are crafted by hand. As it is known, in data of images many transforms like Cosine, Wavelet transform, or Fourier have been used to get local correlation and disconnected components. To get the features directionality and information of texture (when they were needed to make a decision) Gabor filters have been used. K-means algorithm and Principal and Independent Component Analyses have been applied for the learning of features with a data-driven form or to reduce the dimensionality of data. These methods designed extraction of features within the objective of reconstruction containing a variety of criteria on the projection space and reconstruction (e.g., projection space is assumed orthogonal by PCA).
One of the most efficient techniques for early diagnosis is Convolutional Neural Networks (CNNs). For the recognition of COVID-19, a new randomly initialized CNN architecture is used where this network contains a set of created from scratch hidden layers of different sizes. The used RND-CNN contains one input layer and four hidden blocks for features learning and extracting, and an output layer, it contains two layers that are fully connected and a SoftMax layer for recognition of cases (Normal, Pneumonia, or COVID). The objective of the difference in layer blocks is to make the model covering a variety of features through the set of convolutions. Also, there is another advantage in this model which is its reduced number of parameters and its high performance with retaining low execution time compared with traditional CNNs [21].
The first stage collaborative design for the human-machine strategy used to build the new proposed COVID-Net is a basic network design important stage, where based on human-driven design concepts and practices, the design of the initial network prototype was built. In [22] the authors built the design of the initial network prototype to make the predictions listed below:
• no infection (normal)
• non-COVID 19 infection (e.g., bacterial, viral, etc.)
• COVID-19 viral infection.
The main reason for making these three predictions is the assistance for medical specialists to decide which treatment policy to use according to the cause of infection and to make decisions that have a priority for RT-PCR testing. Where non-COVID 19 and COVID 19 needs different strategies for treatment.
In [23] authors proposed a deep learning-based method for the classification of COVID-19 pneumonia and normal chest CT scans. This method consists of five steps: step 1 represents collecting of data while step 2 represents the implementation of 15-layered CNN architecture, the feature extraction and fusion are implemented in step 3, then the selection step is performed in step 4. Finally, one-class kernel ELM for the final classification is performed in step 5.
In [24] authors presented forecasting models to estimate and predict COVID-19 where they utilized the latest deep learning techniques such as Long Short Term Memory Network (LSTM), Recurrent Neural Network (RNN), and Gated Recurrent Units (GRU) to quantify the intensity of pandemic for the near future.
An optimized deep learning (DL) scheme to distinguish COVID-19 infected patients from normal patients according to computed tomography (CT) scans. In this method, contrast enhancement is used to improve the quality of the original images. A pertained DenseNet-201 is then trained using transfer learning. The process of feature extraction is performed by using two fully connected layers and an average pool. The mentioned features are then optimized with a Firefly algorithm to select the most optimal learning features. Finally, The optimal learning features are fused to improve the accuracy of the approach [25].
A multi-type feature fusion and selection was introduced by [26] to predict COVID-19 infections on chest computed tomography (CT) scans. Four steps are needed to perform this approach, the first step is the preparing of the database with COVID-19 pneumonia and normal CT scans. In the second step, these data are divided into ratios of 70:30 for training and testing. Multiple features are extracted in the third step. The fourth step represents the fusion process by using canonical correlation analysis to fuse the features into a single vector.
We present a description of the proposed framework that will be used for COVID-19 classification, normal and pneumonia based on the enhancement x-ray image and SqueezeNet model. The proposed CNN-based X-ray image classifiers are implemented framework was executed using MATLAB 2021a with computer specifications, 8 GB DDR4 of RAM, CPU AMD Ryzen 53550H with Radeon Vega Mobile GFX 2.10 GHz and Windows 10 operating system.
In this study, a primary dataset containing 21,909 X-ray images as shown in Tab. 1. That is basic dataset consists of three classes (COVID-19, Normal and Pneumonia) each class has different numbers of images [27–29].
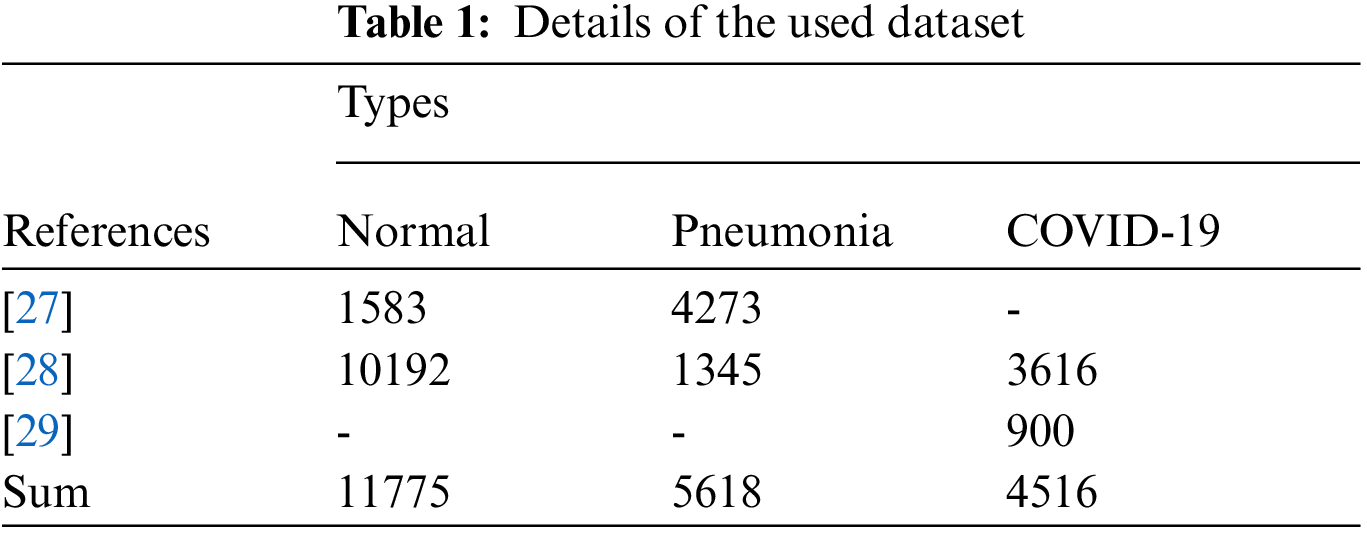
A balance must be made among three classes (COVID-19, Normal and Pneumonia), because we found a great difference between the number of images that make up that dataset, for example, we found the number of images for COVID-19 is equal to (4516-image) [28,29]. But the number of images Normal is (11775-image) [27,28], and the number of images of Pneumonia is (5618-image) [27,28]. Since the numbers of images are not equal in the dataset, the images must be every class equal to avoid the occurrence of bias for the category that contains more images than the other category and the results to be more realistic. So, we suggested that the least number of images be dependent is the number of COVID 19 images and delete some of the bad images also. In the end, the number of images is 4479 for each class and the total number of datasets is 13437.
SqueezeNet is a convolution network that executes better performance with a low number of classes as we have three classes only. Moreover, it has a good accuracy compare with AlexNet with 50× fewer parameters [30–32]. SqueezeNet consists of 18 layers deep and it can classify images up to 1000 object categories.
As it is depicted in Fig. 1, SqueezeNet begins with a standalone convolution layer (conv1), followed by 8 Fire modules (fire2–9), ending with a final convolution layer (conv10). A Fire module is comprised of a squeeze convolution layer feeding into an expand layer that has a mix of 1 × 1 and 3 × 3 convolution filters.
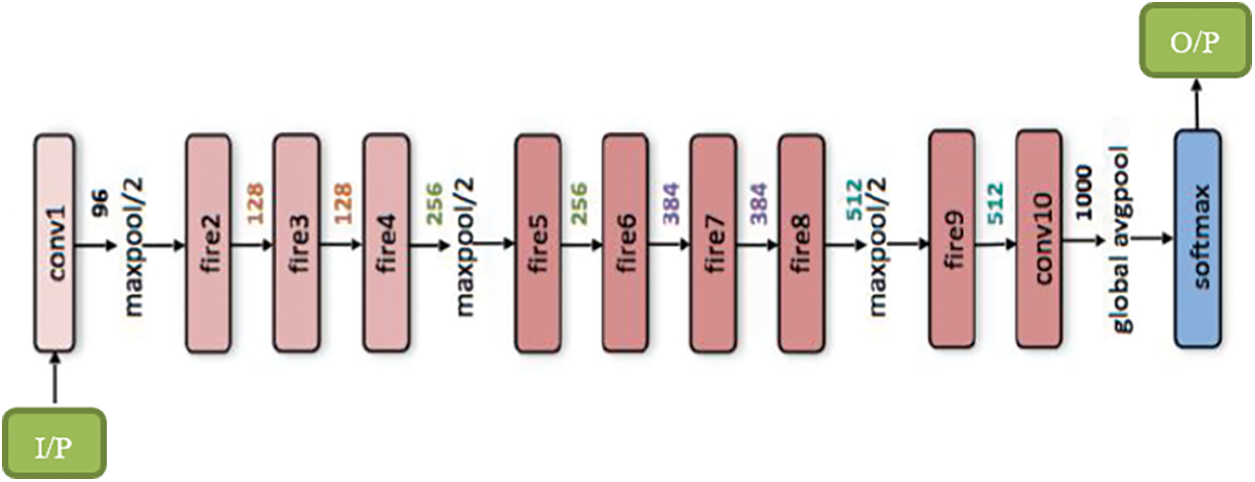
Figure 1: SqueezeNet CNN architecture
In this study, we have two scenarios: In the first scenario as shown in Fig. 2., We have resized all our datasets images from the original size to 227 * 227 to deal with the SqueezNet model. Moreover, the images available to us are of different sizes and to overcome these difficulties, all the images available to us must be of one size to obtain more realistic results. Then we split each dataset class into 80% for training and 20% for testing, then the training dataset passes to SequeezeNet to be trained.
In the second scenario, we took the same previous images after being improved by several techniques used in image modification, these techniques are Unsharp filter, Histogram equal and Complement image produced another view of the dataset [33], as shown in Fig. 2., which reveals the depth of details and information in the images. Now will explain all techniques used:
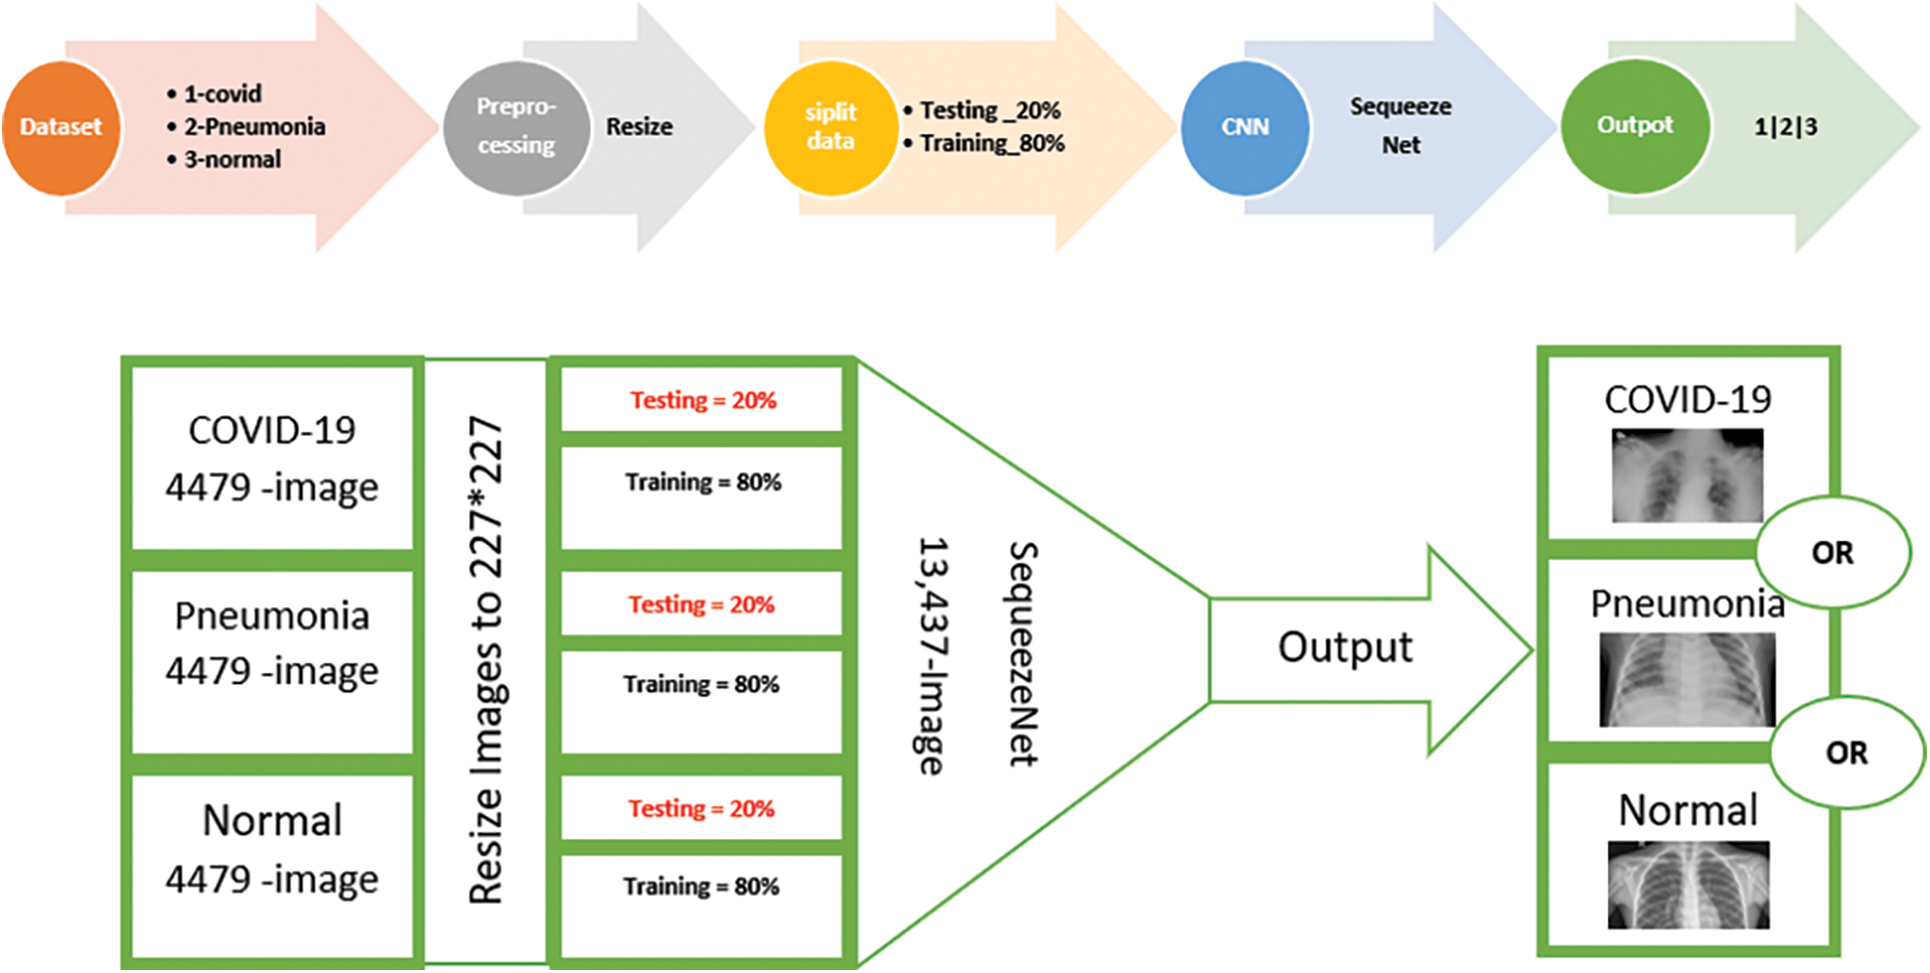
Figure 2: Scenario (1)-training SqueezNet on the original dataset
a. Unsharp filter
The unsharp filter is a basic sharpening operator that enhances edges (and other high-frequency components in an image) by subtracting an unsharp or smoothed, version of the original image from it [34]. In the photographic and printing industries, the unsharp filtering process is widely employed to crispen edges. Unsharp masking produces an edge image g(x, y) from an input image f(x, y) by using the below Eq. (1).
This technique, the first step used in this study to enhancement the x-ray images as shown in Fig. 3.
b. Histogram equal
This technique is the second step used in this study for adjusting x-ray images as shown in Fig. 3 intensities to enhance contrast. This technique usually increases the global contrast of many images, especially when the image is represented by a narrow range of intensity values. The approach, in particular, can enhance the effectiveness of bone structure in x-ray images and the detail in photographs that are either over or under-exposed. Through this adjustment, the intensities can be better distributed on the histogram utilizing the full range of intensities evenly. This allows for areas of lower local contrast to gain a higher contrast. Histogram equalization accomplishes this by effectively spreading out the highly populated intensity values which use to degrade the image contrast [35].
c. Complement image
The last step in the process of the enhancement of x-ray images in this study is complement image. zeros become ones and ones become zeros in this technique the colours black and white are reversed in a binary image [36]. In another word, each pixel value in the complement of a grayscale or colour image is subtracted from the maximum pixel value supported by the class (or 1.0 for double-precision images). Moreover, In the output image, the difference is used as the pixel value. Dark areas become lighter and light areas become darker in the final image. Reds become cyan in colour images, greens become magenta, blues become yellow, and vice versa as shown in Fig. 3.
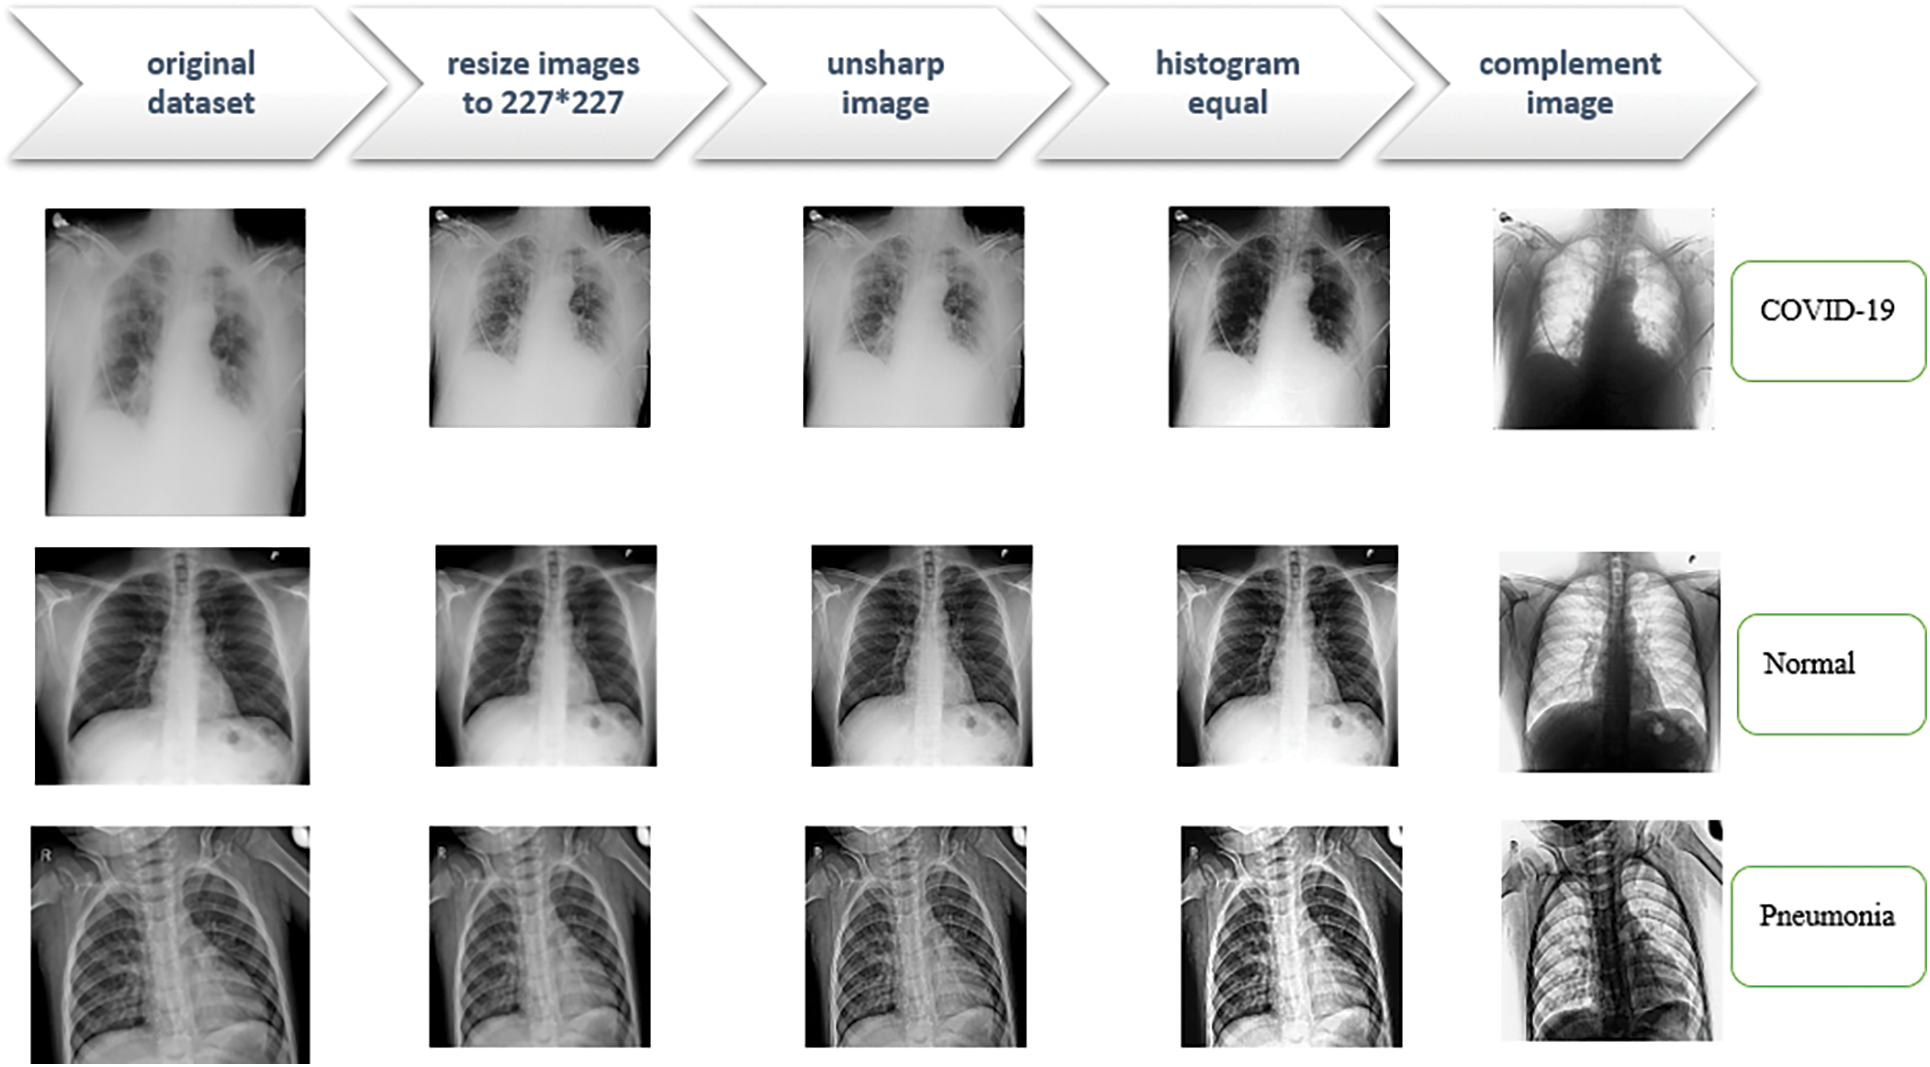
Figure 3: The sequence of processing operations applied to the dataset
In addition, when these modified images were trained as shown in Fig. 4., results were obtained higher than the previous results, and we can say that these results are closer and better than the results of the first test.
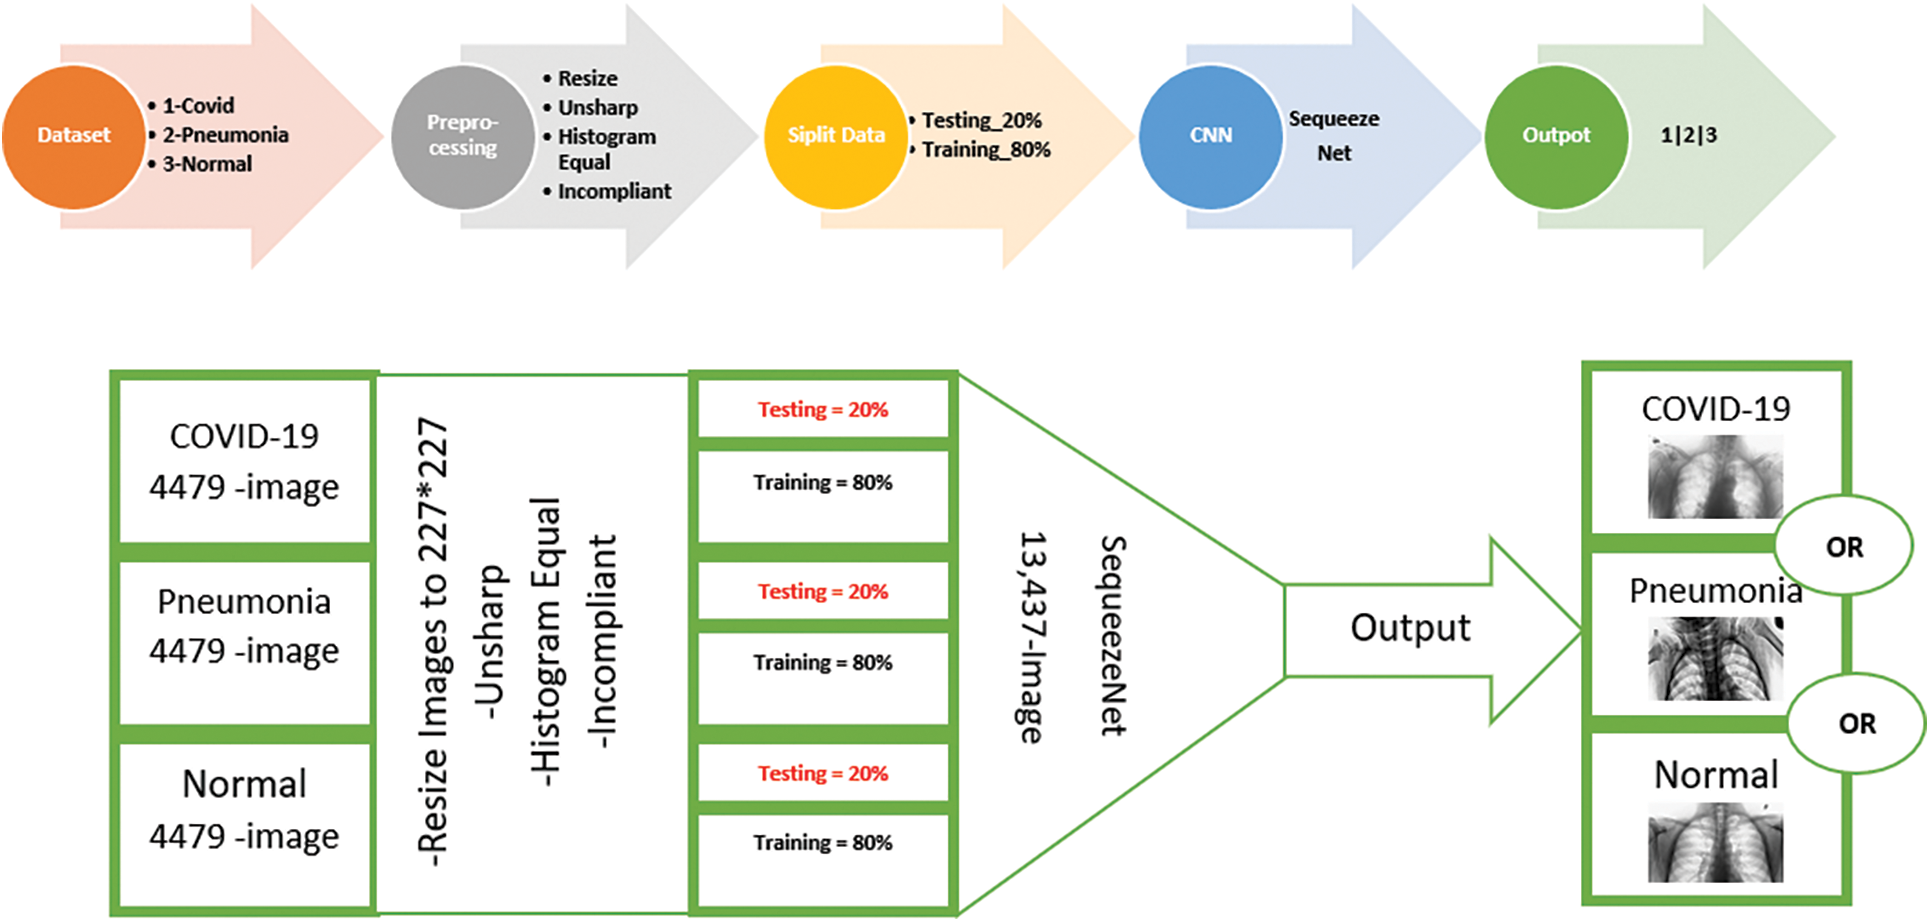
Figure 4: Scenario (2)-training SqueezNet on enhanced data
The training setup for the 13437 data samples is accomplished using MATLAB-2021a tools. The following steps illustrate the procedure of training data:
• Calling the data: Image Datastore is used to load and manage the dataset.
• Checking the data: Count Each Label is used to check and summarize the number of images per category (classes).
• Load pre-trained Network: Neural Network Toolbox is used to load the SequeezeNet model.
• Prepare the data: The dataset is split into training and validation data, where 80% of samples from each category are prepared for the training data and 20% for the validation data. Also, we used the Randomize function to avoid biasing.
• Reduce output: The deep layers of the CNNs model are modified into 3 layers.
In the proposed classifier, transfer learning is applied in the CNN model to improve learning efficiency [37–40]. In transfer learning, information that has been previously learned while solving a problem is transferred and reused to solve another related problem. To perform transfer learning, we need to create two components:
• An array of layers representing the network architecture. This is created by modifying a pre-existing network such as SequeezeNet.
• Dataset (x-ray Images) with known labels to be used as training data, which is typically provided by the data store.
These two components were provided as the inputs to the train network function that returns the trained network as output.
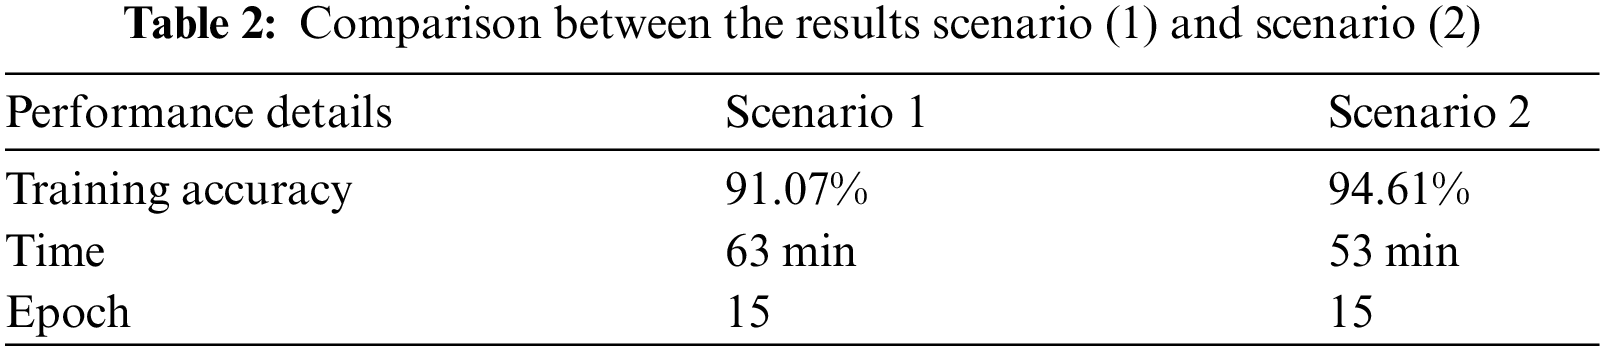
This section discusses the training results of our low complexity CNN model, SequeezeNet. In this paper, we used data sets [27–29]. In the proposed classifier, there are 10,750 x-rays extracted from the training dataset, where each class derive 3,583 x-ray images. These images were processed in the training stage of the low complexity CNN model. In the CNN model, 15 epochs are applied, which means that each type of dataset is processed in the training stage fifteen times. Thus, we have 2505 iterations and 167 iterations per epoch. The performance details of the results for scenario (1) and scenario (2) are shown in Tab. 2.
The accuracy and loss are observed through the training progress as shown in Figs. 5 and 6 to scenario-1 and scenario-2 respectively. The accuracy increases as the epoch increases until it reaches a saturated level, where inaccuracy is very small, and it fluctuates at a certain level. It is decaying, but the loss decreases as the epoch decreases until it reaches a certain saturation level. In simple words, accuracy determines how good the model is, and loss determines how bad the model is. A good model usually comes with high accuracy and low loss.

Figure 5: Accuracy and loss of the training for the original dataset (scenario-1)

Figure 6: Accuracy and loss of the training for the original dataset (scenario-2)
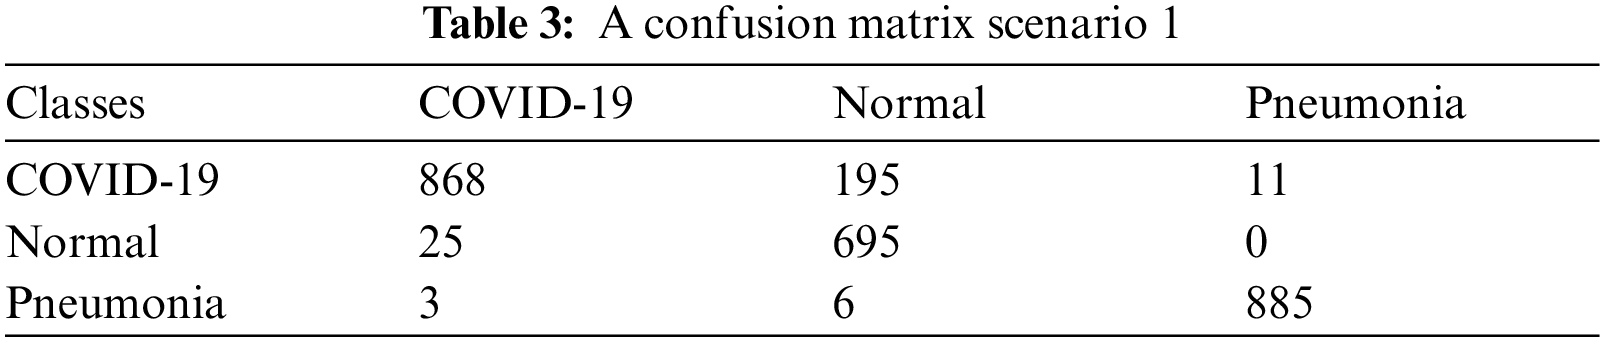
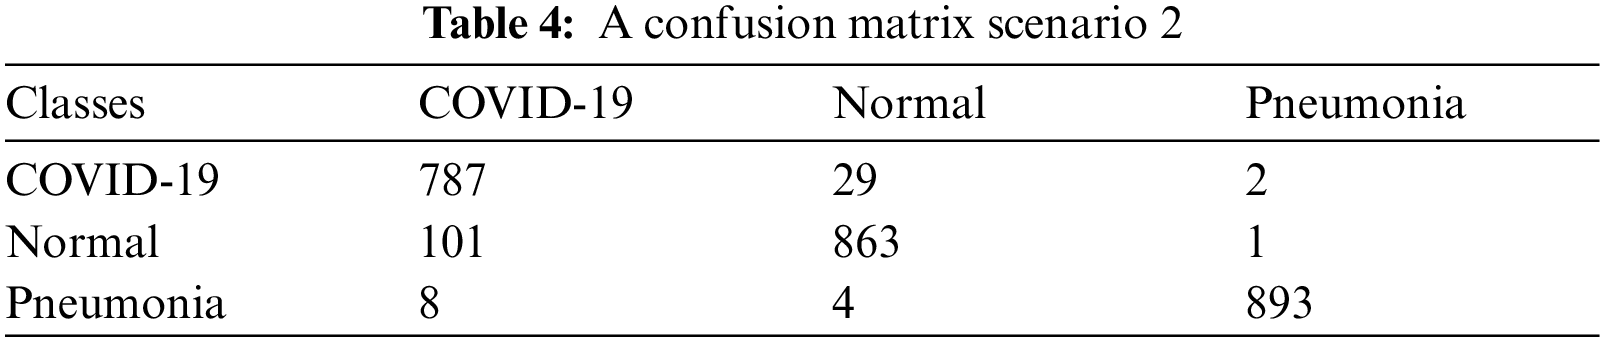
In the testing or validation dataset, the proposed classifier with 2,687 x-ray images for 3 classes, where each class has 896 x-ray images. A confusion matrix shows how well the model can accurately predict the class that is used in supervised learning. In the validation test of the proposed model, the model predicts the respective classes of the 3 classes. Each column of the matrix represents the number of predictions of each class, while each row represents the instances in the real class. The outputs are recorded in the confusion matrix as shown in Tabs. 3 and 4 to scenario-1 and scenario-2 respectively.
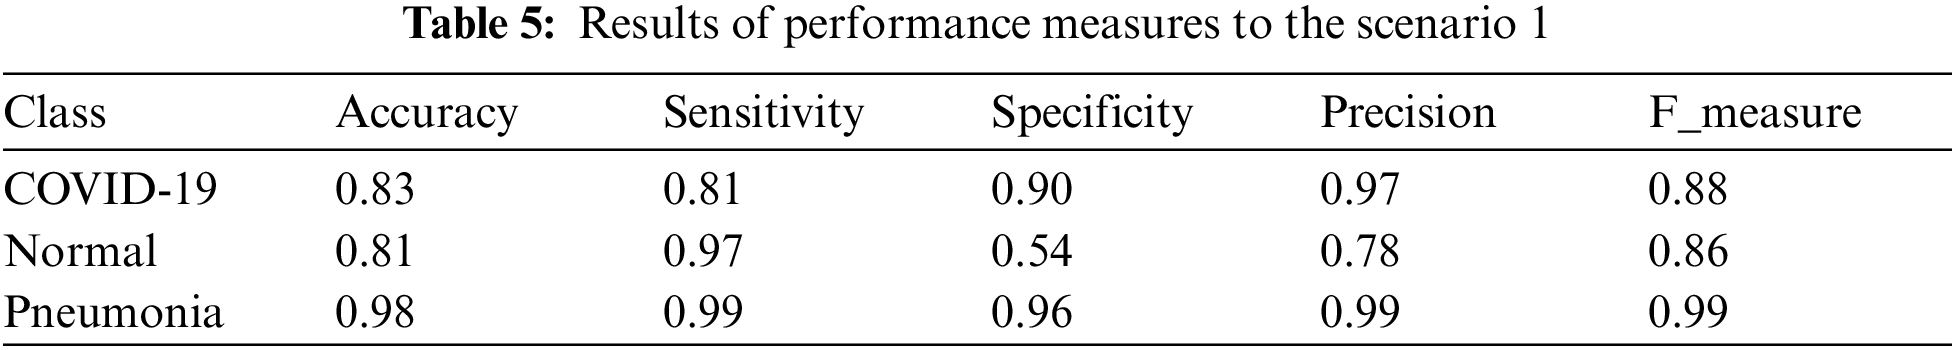
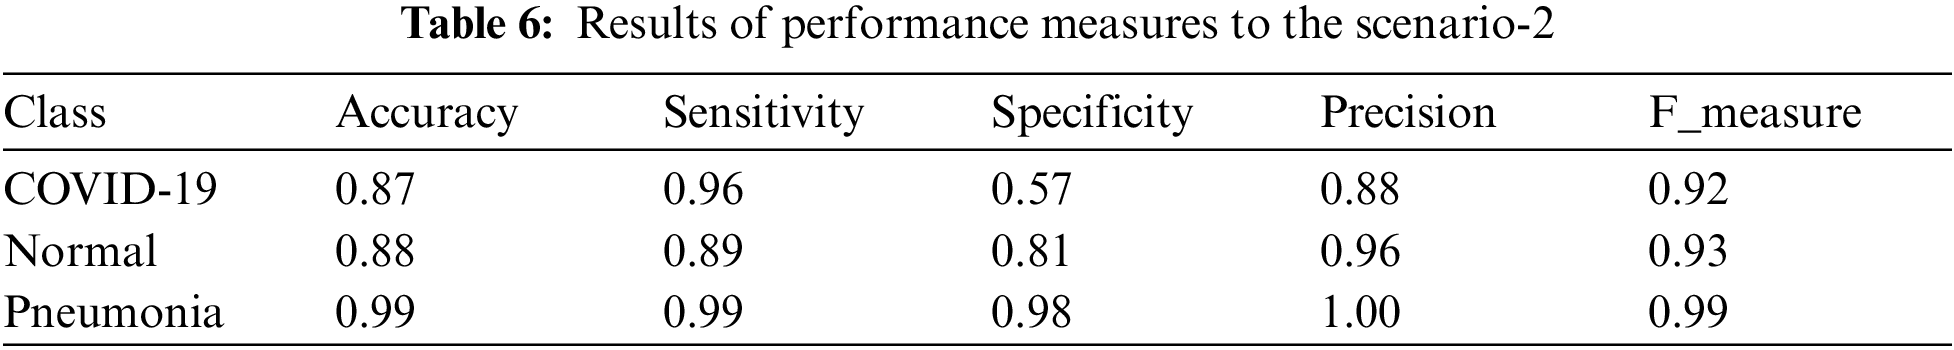
The performance measures used in this study are the most widely used metrics that shown below in Eqs. (2)–(6) are accuracy, sensitivity, specificity and precision [41,42] as in Tabs. 5 and 6 which are given as:
Definitions:
• True positive (TP) = the number of cases correctly identified as positive
• False-positive (FP) = the number of cases incorrectly identified as positive
• True-negative (TN) = the number of cases correctly identified as negative
• False-negative (FN) = the number of cases incorrectly identified as negative
We developed a deep learning approach for COVID-19 classification, normal and pneumonia based on the enhancement x-ray image and SqueezeNet model. The proposed framework adopted SqueezeNet to classify X-ray images into three groups: COVID-19, normal, and pneumonia. The use of the image enhancement technique as a preprocessing step leads to improvement of classification accuracy. The results approved that the comparison in two scenarios, without any enhancement on the datasets which achieved an overall accuracy of 91% with 63 min and after utilizing the image enhancement process where the performance became higher at approximately 95% with 53 min. From the mentioned above, the conclusion of this study is the preprocessing of the dataset contributed to enhancing the output of classification to the high rate. To compare our results with other studies, we used X-ray images, which are considered the cheapest type of scans in medical Imaging compared to CT images especially in poor countries. Disadvantages of this method are the difficulty of dealing with x-ray images to reach a higher accuracy of more than 95%.
The proposed future work could be adding many datasets approved by the World Health Organization and creating a new convolutional neural network. In addition, an integrated system could be created to help doctors and medical specialists in the early detection of viruses of all kinds through the application of some engineering tools such as filters or cutting important parts of images to reduce the execution time of data analysis.
Acknowledgement: We would like to acknowledge the group effort made in this research.
Funding Statement: The authors received no specific funding for this study.
Conflicts of Interest: The authors declare that they have no conflicts of interest to report regarding the present study.
1. “Coronavirus disease 2019 (COVID-19) situation report–94,” World Health Organization. 2019. URL: https://www.who.int/docs/default-source/coronaviruse/situation-reports/20200423-sitrep-94-COVID-19.pdf [accessed 2021-02-04]. [Google Scholar]
2. M. Shorfuzzaman, M. Masud, H. Alhumyani, D. Anand and A. Singh, “Artificial neural network-based deep learning model for covid-19 patient detection using x-ray chest images,” Journal of Healthcare Engineering, vol. 2021, no. 5513679, pp. 1–16, 2021. [Google Scholar]
3. X. Deng, H. Shao, L. Shi, X. Wang and T. Xie, “A classification–detection approach of COVID-19 based on chest X-ray and CT by using Keras pre-trained deep learning models,” Computer Modelling in Engineering & Sciences, vol. 125, no. 2, pp. 579–596, 2020. [Google Scholar]
4. S. Asif, Y. Wenhui, H. Jin and S. Jinhai, “Classification of COVID-19 from chest x-ray images using deep convolutional neural network,” in 2020 IEEE 6th Int. Conf. on Computer and Communications (ICCC), Chengdu, China, vol. 14, no. 8, pp. 426–433, 2020. [Google Scholar]
5. W. Zhang, B. Pogorelsky, M. Loveland and T. Wolf, “Classification of covid-19 x-ray images using a combination of deep and handcrafted features,” Accessed: Oct. 16, 2021. [Online]. Available: https://arxiv.org/abs/2101.07866v1. [Google Scholar]
6. A. Abbas, M. M. Abdelsamea and M. M. Gaber, “Classification of COVID-19 in chest x-ray images using DeTraC deep convolutional neural network,” Springer, vol. 51, pp. 854–864, 2020. [Google Scholar]
7. M. M. Taresh, N. Zhu, T. A. A. Ali, A. S. Hameed and M. L. Mutar, “Transfer learning to detect covid-19 automatically from x-ray images using convolutional neural networks,” International Journal of Biomedical Imaging, vol. 2021, no. 8828404, pp. 1–9, 2021. [Google Scholar]
8. S. Albahli, “A deep neural network to distinguish COVID-19 from other chest diseases using x-ray images,” Bentham Science, vol. 17, no. 1, pp. 109–119, 2020. [Google Scholar]
9. P. M. d. Sousa, P. C. Carneiro, M. M. Oliveira, G. M. Pereira, C. A. C. Junior et al., “COVID-19 classification in x-ray chest images using a new convolutional neural network: CNN-COVID,” Research on Biomedical Engineering, Accessed: Oct. 16, 2021. [Online]. Available: https://doi.org/10.1007/s42600-020-00120-5. [Google Scholar]
10. V. E. Balas, S. K. Roy, D. Sharma and P. Samui, “Handbook of deep learning applications,” in Smart Innovation, Systems and Technologies,” Berlin: Springer, ISBN: 978-3-030-11478-7, 2019. [Google Scholar]
11. N. Bansal and S. Sridhar, “Classification of x-ray images for detecting covid-19 using deep transfer learning,” Research Square, vol. 4, no. 1, pp. 21–29, 2020. [Google Scholar]
12. H. S. Maghdid, A. T. Asaad, K. Z. Ghafoor, A. S. Sadiq, S. Mirjalili et al., “Diagnosing COVID-19 pneumonia from x-ray and CT images using deep learning and transfer learning algorithms,” Proc. SPIE 11734, Multimodal Image Exploitation and Learning 117340E, (12 April 20212021. https://doi.org/10.1117/12.2588672. [Google Scholar]
13. Z. Fan, S. He, S. Ruan, X. Wang and H. Li, “Deep learning-based multi-class COVID-19 classification with x-ray images,” in Proc. SPIE 11598 Medical Imaging 2021: Image Guided Procedures, Robotic Interventions and Modeling, 1159813, (15 February 2021pp. 36, 2021. https://doi.org/10.1117/12.2582261. [Google Scholar]
14. A. A. Reshi, F. Rustam, A. Mehmood, A. Alhussan, Z. Alrabiah et al., “An efficient cnn model for covid-19 disease detection based on x-ray image classification,” Complexity, vol. 2021, Article ID 6621607, pp. 1–12, 2021. [Google Scholar]
15. B. Sekeroglu and I. Ozsahin, “Detection of covid-19 from chest x-ray images using convolutional neural networks,” SLAS Technology: Translating Life, vol. 25, no. 6, pp. 553–565, 2020. [Google Scholar]
16. T. Ozturk, M. Talo, E. A. Yildirim, U. B. Baloglu, O. Yildirim et al., “Automated detection of COVID-19 cases using deep neural networks with X-ray images,” Public Health Emergency Covid-19 Initiative, vol. 2, no. 5, pp. 1–2, 2020. [Google Scholar]
17. S. S. Ahrabi, M. Scarpiniti, E. Baccarelli and A. Momenzadeh, “An accuracy vs. complexity comparison of deep learning architectures for the detection of COVID-19 disease,” Computation, vol. 9, no. 1, pp. 1–20, 2021. [Google Scholar]
18. K. Purohit, A. Kesarwani, D. R. Kisku and M. Dalui, “COVID-19 detection on chest x-ray and ct scan images using multi-image augmented deep learning model,” bioRXiv, pp. 15–22, 2020. https://doi.org/10.1101/2020.07.15.205567. [Google Scholar]
19. E. Luz, P. L. Silva, R. Silva, L. Silva, G. Moriera et al., “Towards an effective and efficient deep learning model for COVID-19 patterns detection in X-ray images,” Research on Biomedical Engineering, 2021. https://doi.org/10.1007/s42600-021-00151-6. [Google Scholar]
20. A. S. Panayides, A. Amini, N. D. Filibovic, A. Sharma, S. A. Tsaftaris et al., “AI in medical imaging informatics: Current challenges and future directions,” IEEE Journal of Biomedical and Heal Informatics, vol. 24, no. 7, pp. 1837–1857, 2020. [Google Scholar]
21. S. B. Atitallah, M. Driss, W. Boulila and H. B. Ghézala, “Randomly initialized convolutional neural network for the recognition of covid-19 using x-ray images,” International Journal of Imaging Systems and Technology, vol. September, pp. 1–19, 2021. [Google Scholar]
22. L. Wang, Z. Q. Lin, and A. Wong, “COVID-Net: A tailored deep convolutional neural network design for detection of COVID-19 cases from chest X-ray images,” Scientific Reports, vol. 10, no. 1, pp. 1–12, 2020. [Google Scholar]
23. M. A. Khan, S. Kadry, Y. Zhang, T. Akram, M. Sharif et al., “Prediction of COVID-19-pneumonia based on selected deep features and one class kernel extreme learning machine,” Computers and Electrical Engineering, vol. 90, no. 106960, pp. 1–19, 2021. [Google Scholar]
24. H. T. Rauf, M. I. Lali, M. A. Khan, S. Kadry, H. Alolaiyan et al., “Time series forecasting of COVID-19 transmission in Asia pacific countries using deep neural networks,” Personal and Ubiquitous Computing, vol. 9, no. 3, 2021. DOI 10.1007/s00779-020-01494-0. [Google Scholar] [CrossRef]
25. M. A. Khan, N. Hussain, A. Majid, M. Alhaisoni, S. Ahmad et al., “Classification of positive COVID-19 CT scans using deep learning,” Computers, Materials & Continua, vol. 66, no. 3, pp. 2923–2938, 2021. [Google Scholar]
26. M. A. Khan, A. Majid, T. Akram, N. Hussain, Y. Nam et al., “Classification of COVID-19 CT scans via extreme learning machine,” Computers, Materials & Continua, vol. 68, no. 1, pp. 1003–1019, 2021. [Google Scholar]
27. P. Mooney, “Chest x-ray images (pneumonia),” (March, 2020). [Online]. Available: https://www.kaggle.com/paultimothymooney/chest-xray-pneumonia/metadata. [Google Scholar]
28. T. Rahman, “COVID-19 chest X-ray database,” (February, 2021). [Online]. Available: https://www.kaggle.com/tawsifurrahman/COVID19-radiography-database. [Google Scholar]
29. A. Haghanifar, M. Molahasani Majdabadi and S. Ko, “COVID-19 chest X-ray image repository,” figshare, 28-Jun-2020. [Online]. Available: https://figshare.com/articles/COVID-19_Chest_X-Ray_Image_Repository/12580328. [Google Scholar]
30. F. Özyurt, E. Sert and D. Avcı, “An expert system for brain tumor detection: Fuzzy C-means with super resolution and convolutional neural network with extreme learning machine,” Medical. Hypotheses, vol. 134, pp. 109433, Jan. 2020. [Google Scholar]
31. F. N. Iandola, S. Han, M. W. Moskewicz, K. Ashraf, W. J. Dally et al., “SqueezeNet: AlexNet-level accuracy with 50× fewer parameters and <0.5 MB model size,” Feb. 2016, Accessed: Oct. 16, 2021. [Online]. Available: http://arxiv.org/abs/1602.07360. [Google Scholar]
32. V. Pothos, D. Kastaniotis, I. Theodorakopoulos and N. Fragoulis, “Fast, Embedded Implementation of a Convolutional Neural Network for Image Recognition,” 2016. DOI 10.13140/RG.2.1.1778.9681. [Google Scholar] [CrossRef]
33. A. Saad, “Classification of COVID-19, normal and pneumonia based on enhancement X-ray image and squeeze Net model,” figshare. Dataset. https://doi.org/10.6084/m9.figshare.16408392.v1. [Google Scholar]
34. Z. Al-Ameen, A. Muttar and G. Al-Badrani, “Improving the sharpness of digital image using an amended unsharp mask filter,” International Journal of Image, Graphics and Signal Processing, vol. 11, no. 3, pp. 1–9, 2019. [Google Scholar]
35. J. Xiong, D. Yu, Q. Wang, L. Shu, J. Cen et al., “Application of histogram equalization for image enhancement in corrosion areas,” Shock and Vibration, vol. 2021, pp. 1–13, 2021. [Google Scholar]
36. S. Ameer, “Image thresholding using the complement feature,” American Journal of Engineering and Applied Sciences, vol. 13, no. 2, pp. 311–317, 2020. [Google Scholar]
37. A. Magotra and J. Kim, “Transfer learning for image classification using hebbian plasticity principles,” in CSAI 2019: Proc. of the 2019 3rd Int. Conf. on Computer Science and Artificial Intelligence, Beijing, China, pp. 233–238, 2019. [Google Scholar]
38. K. Weiss, T. M. Khoshgoftaar and D. D. Wang, “A survey of transfer learning,” Journal of Big Data, vol. 3, no. 1, pp. 1–40, 2016. [Google Scholar]
39. S. J. Pan, “A survey on transfer learning,” IEEE Transactions on Knowledge and Data Engineering, vol. 22, no. 10, pp. 1345–1359, 2010. [Google Scholar]
40. F. Yang, W. Zhang, L. Tao and J. Ma, “Transfer learning strategies for deep learning-based PHM algorithms,” Applied Sciences, vol. 10, no. 7, pp. 2361, 2020. [Google Scholar]
41. J. Davis and M. Goadrich, “The relationship between precision-recall and ROC curves,” in 2nd International Conference on Machine Learning, Pittsburgh Pennsylvania USA, pp. 233–240, 2006. [Google Scholar]
42. D. M. W. Powers, “Evaluation: From precision, recall and F-measure to ROC, informedness,” Journal of Machine Learning Technologies, vol. 2, no. 1, pp. 37–63, 2011. [Google Scholar]
 | This work is licensed under a Creative Commons Attribution 4.0 International License, which permits unrestricted use, distribution, and reproduction in any medium, provided the original work is properly cited. |