DOI:10.32604/cmc.2022.023864
| Computers, Materials & Continua DOI:10.32604/cmc.2022.023864 | |
| Article |
Prognostic Kalman Filter Based Bayesian Learning Model for Data Accuracy Prediction
1Department of ECE, College of Engineering and Technology, SRM Institute of Science and Technology, Vadapalani, Chennai, 600026, India
2Department of CSE, Birla Institute of Applied Sciences (BIAS), Bhimtal, Uttarakhand, 263136, India
3Division of Applied Mathematics, Wonkwang University, 460, Iksan-Daero, Iksan-Si, Jeonbuk, 54538, Korea
4School of Computer Science and Engineering, Vellore Institute of Technology (VIT), Chennai, 600127, India
5Department of Mathematics, Tamralipta Mahavidyalaya, West Bengal, 721636, India
6School of Computer Science and Engineering, Center for Cyber Physical Systems, Vellore Institute of Technology (VIT), Chennai, 600127, India
7Indian Institute of Information Technology (IIIT), Lucknow, Uttar Pradesh, 226002, India
8Department of Computer Science and Engineering, Saveetha School of Engineering, SIMATS, Chennai, 602105, India
*Corresponding Author: Jeong Gon Lee. Email: jukolee@wku.ac.kr
Received: 24 September 2021; Accepted: 07 December 2021
Abstract: Data is always a crucial issue of concern especially during its prediction and computation in digital revolution. This paper exactly helps in providing efficient learning mechanism for accurate predictability and reducing redundant data communication. It also discusses the Bayesian analysis that finds the conditional probability of at least two parametric based predictions for the data. The paper presents a method for improving the performance of Bayesian classification using the combination of Kalman Filter and K-means. The method is applied on a small dataset just for establishing the fact that the proposed algorithm can reduce the time for computing the clusters from data. The proposed Bayesian learning probabilistic model is used to check the statistical noise and other inaccuracies using unknown variables. This scenario is being implemented using efficient machine learning algorithm to perpetuate the Bayesian probabilistic approach. It also demonstrates the generative function for Kalman-filer based prediction model and its observations. This paper implements the algorithm using open source platform of Python and efficiently integrates all different modules to piece of code via Common Platform Enumeration (CPE) for Python.
Keywords: Bayesian learning model; kalman filter; machine learning; data accuracy prediction
In today's world of automation, machine learning techniques are applied everywhere to make more out of collected data. Machine Learning models are developed and tuned for better performance. The rate of efficiency of these models depends on specific parameters, which are obstacles in simulation of algorithms by human mind, but without which the algorithms cannot work [1]. We will be using Bayesian optimization here, which performs better than other available optimization algorithms evolved for the same job. Bayesian optimization works by taking assumption of unknown function from a single or many Gaussian process, uses a prior to maintain a next iteration of posterior distribution of this unknown function. For our demonstration, we make use of K-means clustering, which is one the most popular clustering algorithm. Our work is also related to fine tuning of input values, for which we use another algorithm, Kalman-filter [2]. We use values provided by Kalman-filter initially to feed in k-means clustering mechanism. These will work hand-in-hand to improve the clustering processes, and hence improve the classification.
Clustering, an important field in data science and a contributor to Machine Learning, finds its applications in several other fields like: Image processing, Web cluster search engines, Voice analysis, Pattern Recognition and Bioinformatics [3,4]. Cluster can be called a group of similar objects, and clustering is a process of making similar sets out of raw data, which helps in segregation of unknown data easily. The parameters involved should be used cautiously as incompatible use of parameters of clustering like, Number of Clusters (k-means) and Density Limit, may lead to situations like improper density shape of clusters, ambiguity in finding centroid and the noise [5–7]. Mainly, clustering algorithms divided into:
a) Belonging to a Cluster
■ Hard Clustering
■ Soft Clustering
b) Distance from nearest Cluster
■ Distance Clustering
■ Conceptual Clustering
c) Grouping of Clusters
■ Exclusive Clustering
■ Overlapping Clustering
■ Hierarchical Clustering
■ Probabilistic Clustering
The improved semi supervised K mean clustering is used for the greedy iteration to find the K mean clustering is presented in [8]. In this work, modification of iterative objective function for semi supervised K clustering in dealing with multi-objective optimization problems of insufficient is illustrated. Extended Kalman filter approach for VANET [9] and robotics field [10] is illustrated to achieve low computational requirements, fast convergence, and reliability. Such proposed approaches in existing literature suffers accurate prediction. The proposed work is not only able to improve the performance of Bayesian classification using the combination of Kalman Filter and K-means, but also can reduce the time for computing the clusters from data.
A Bayesian classifier provide the support for class predict of the values for attributes of that class. Bayesian analysis can serve as a backbone of intelligent systems like robotics. The analysis of previous data can compare on basis of its division into smaller datasets which can be analyzed in collaboration with each other and at same time.
The proposed model enabled conventional prediction algorithms to adapt to dynamic conditions through continuous monitoring of its performance. To evaluate the effectiveness of the proposed learning to prediction model, we developed a machine learning module to improve the prediction accuracy of the K-means technique and Kalman filter algorithm.
The open source model has many advantages, such as improved reproducibility of experimental results, quicker detection of errors, and faster adoption of machine learning algorithm.
The major contributions of this paper can be as follows:
■ Presents a method for improving the performance of Bayesian classification model using the combination of Kalman Filter and K-means techniques.
■ This paper implements the algorithm using open source platform of Python and efficiently integrates all different modules to piece of code via Common Platform Enumeration (CPE).
■ Proposed Bayesian learning probabilistic model for checking the statistical noise and other inaccuracies using unknown variables.
■ Kalman filter is found much capable to adhere potential result for it. This shows the efficiency of 97.6% along with K-Mean technique.
The remaining part of the paper is organized into five sections. The Section 2 presents the background & related work on available literature for K-mean and Bayesian hierarchical model. The Section 3 discusses the open source software and platforms used for implementation in this paper. The Section 4 discusses the Bayesian probabilistic model and Kalman-Filter Based Prediction Technique along. The Section 5 demonstrates the result and observation noted for comparison of data clustering using simple k-Mean and Kalman-filter analysis. The last section is conclusion of this paper.
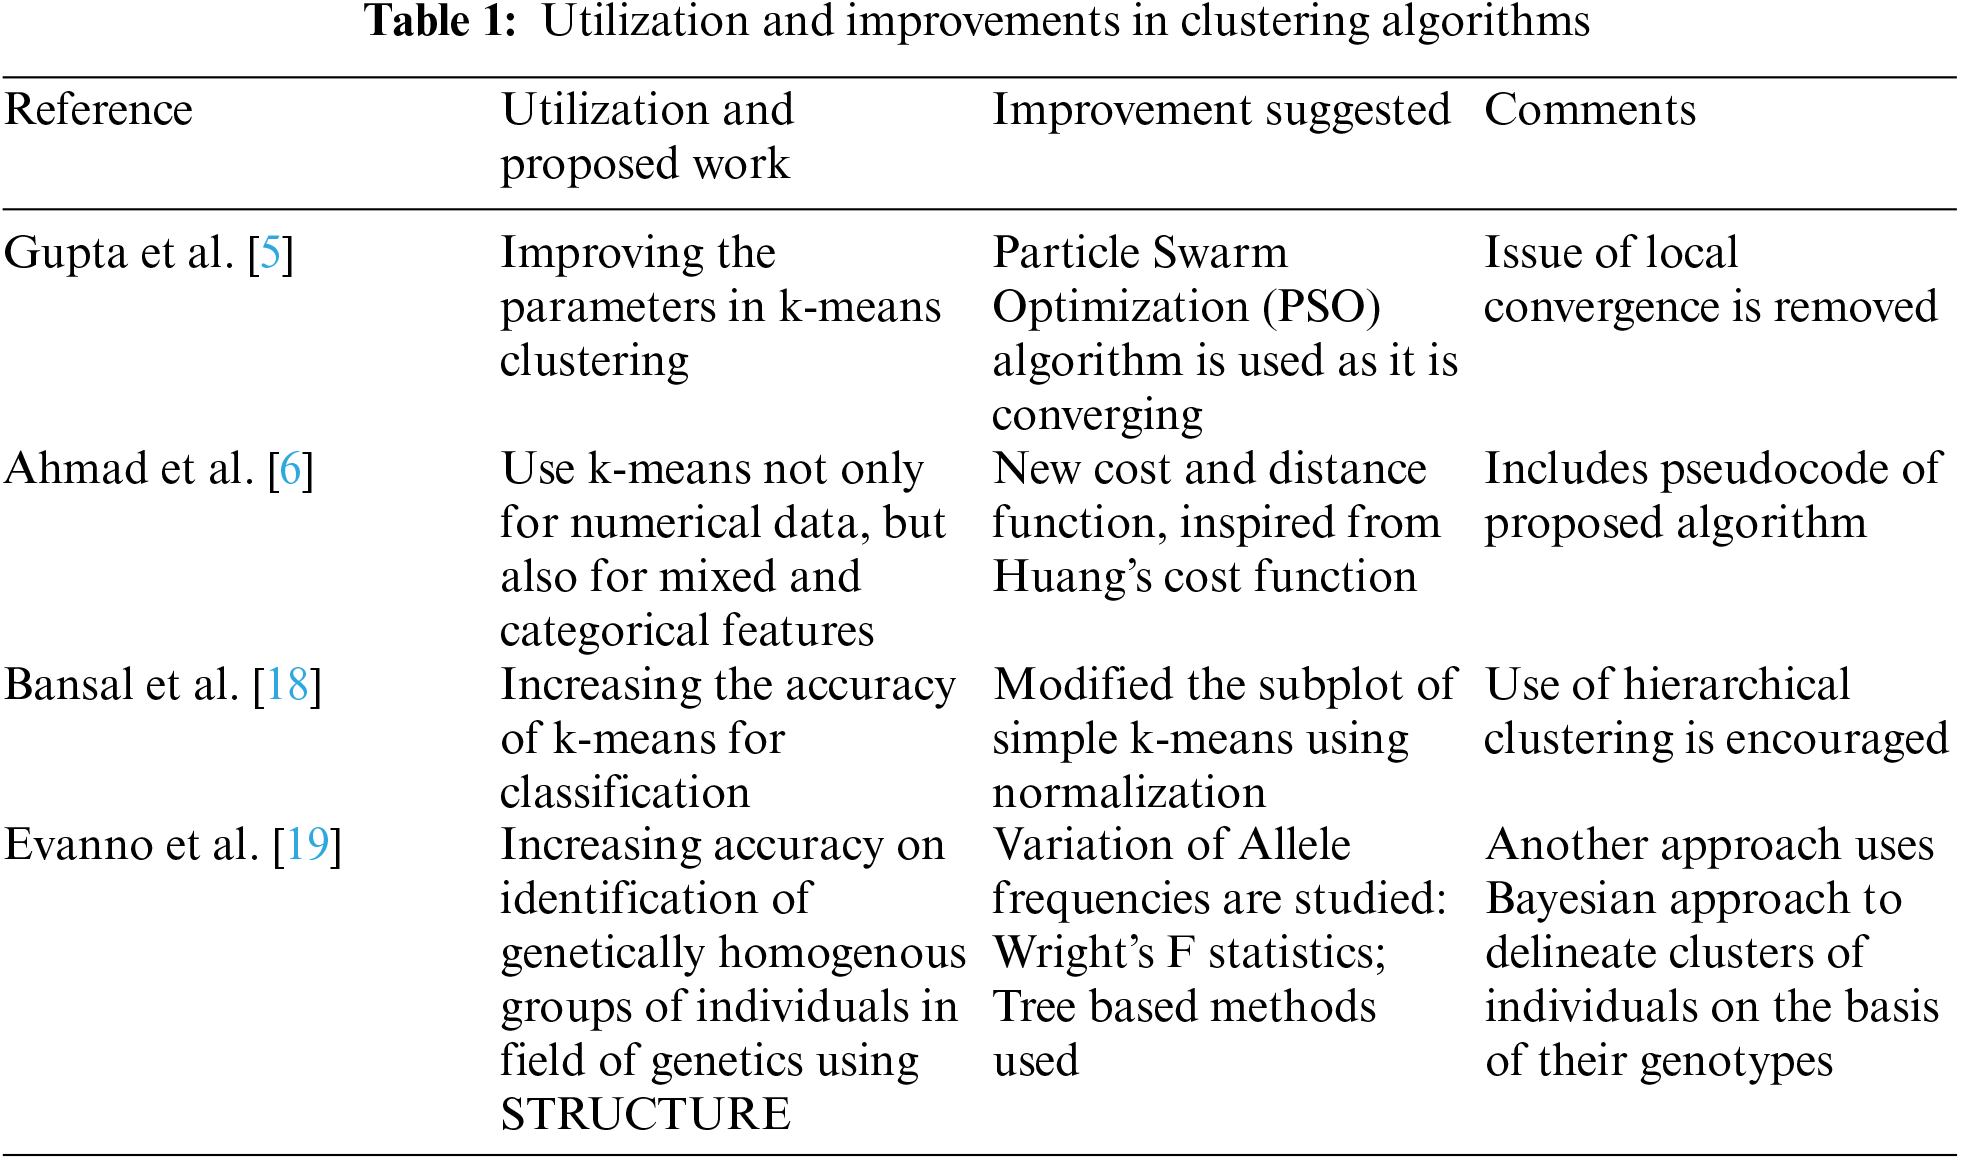
This section reports the background and related works in the field of Bayesian Analysis & framework for accurate prediction using machine learning algorithms. Tab. 1 also provides comments on utilization and improvements in clustering algorithms.
Reference [11] presented the work on machine learning algorithms to give fruitful results, the parameters and hyper parameters need to be fine-tuned on a regular basis. The tuning is also governed by thumb rule, which needs expertise, else it boils down to brute force searching for correctness of hyper parameters. It proposes a better way, Bayesian optimization which can be automated and further coupled with Gaussian process to be applied on the hyper parameters to boost the performance of the model. This proposed algorithm improves the previous fine tuning approaches and provides better optimization.
The work proposed in [12], was based on clustering algorithm using k-means technique with mixed numeric and categorical features. It also point out that the traditional k-means algorithm works best only for numeric computations. Taking in account the distance measures, an improved cost function with modified cluster center is proposed to get over the “numeric computations only” feature of the k-means and to characterize the clusters. It is thoroughly tested with real world datasets and compared with other clustering algorithms.
The work experimented using Bayesian classifier and kalman filter have drawn lot of attention in building predictive models with better outcome and expected data [13,14]. There have been some gaps and challenges which could be encountered:
• No holistic approach for common and open source frameworks platform data analysis.
• Increasing in the demand of accuracy using classification & clustering algorithms.
• No support for Bayesian learning optimization algorithms for reduction in the change of noise as minimum as possible.
• No modules to piece of code via Common Platform Enumeration (CPE).
The work done in [15] disregards usage of Null hypothesis significance testing (NHST) and focuses to promote Bayesian analysis in its place further with statistical comparison for Bayesian hierarchical modelling. By employing three Bayesian tests, namely, Bayesian correlated t-tests, Bayesian signed rank test and Bayesian hierarchical model. It finds errors in NHST and compares the results with that obtained using Bayesian analysis. It also states that p-value is not reasonable proxy for the probability of null hypothesis. But, statistical tests using NHST are employed more in machine learning.
The work [16] focus on clustering methods to efficiently analyze and generate the required output from the clusters by using K-means clustering. It further explains the working of k-means algorithm in detail, expressing the inaccuracies in k-means. As the number of clusters needs to be specified by the user, not the computer itself, it in turn leads to anomalies in the clusters formed as some data can remain un-clustered. In their proposed algorithm, this issue is looked upon to find a better way to start the clustering process, which will lead to less computation time and better accuracy in assigning the un-clustered datasets to similar clusters. Their method works on changing the conditions initially in the k-means algorithm.
Reference [17] presented with comparative study on Bayesian hierarchical model which gains on null hypothesis significance test (NHST). It has also cross-validated and compared accuracy of any two classifies using both methods, and have listed the shortcomings of NHST. The shortcomings can be reduced by employing Bayesian hypothesis testing. Also, the hierarchical model, by jointly analyzing the results obtained on all data sets, reduces the estimation error up to a significant rate.
3 Bayesian Open Source Frameworks
This section discusses the available set of open source software that has revolutionized the usage of technology in latest learning models based on machine intelligence. It also extends the development practices to creep the benefits of common sharing and exchanging between different medium [20,21]. As development of these software are done by volunteers across the globe and it is expected to have a rapid growth of development which directly facilitates the users in overall. Banjo (Bayesian Network Inference with Java Objects) is specifically used for static and dynamic Bayesian networks. Bayesian Network Tools in Java (BNJ) is extensively used for research and development using graphical models of probability. It is implemented in 100% pure Java. BUGS (Bayesian Inference using Gibbs Sampling) is a flexible software used to implement Bayesian analysis especially for complex statistical models and justified using Markov chain Monte Carlo methods. Dlib C++ Library is a general purpose & cross-platform software library which is written in C++ and high complexity for contract and component-based software engineering. Also extensive used to support Bayesian Network. FBN (Free Bayesian Network) is used for constraint based learning of Bayesian networks. JavaBayes is a tool for the manipulation of Bayesian network which is design to estimate probabilities. MSBNx is a component-based Windows application for creating, assessing, and evaluating Bayesian Networks. SMILE (Structural Modeling, Inference, and Learning Engine) is a fully portable library of C++ classes implementing graphical decision-theoretic methods, such as Bayesian networks and influence diagrams. UnBBayes provides a framework and GUI for Bayes Nets with different probabilistic models.
Bayesian Analysis is derived simply from Bayes Theorem, i.e., the outcome depends on the conditional probability of at least two parameters. This property amounts to its role as a basic building block for much larger probabilistic framework which can be used in complex models for machine learning [22]. The graphical models have long been a prevalent epitome for representing complex compositional probabilistic models, most likely: Directed graphs (Bayesian networks and Belief nets), undirected graphs (Markov networks), and Mixed graphs (both directed and undirected edges), as these representations allow much easier and richer generalization of graphical models. This makes the understanding of probabilistic models in context to larger models much easier to understand than a model comprising of nonlinear dynamical system. Probabilistic models, using the prior data are able to generate a posterior data using suitable generative models, which provides a vision for the model and helps interpret the course of data, the changes in the values and the learning attained by model at any phase. For machine learning and artificial intelligence (AI) systems, probabilistic modeling can be used as it is superior to many other existing theoretical and practical prediction models [23–27].
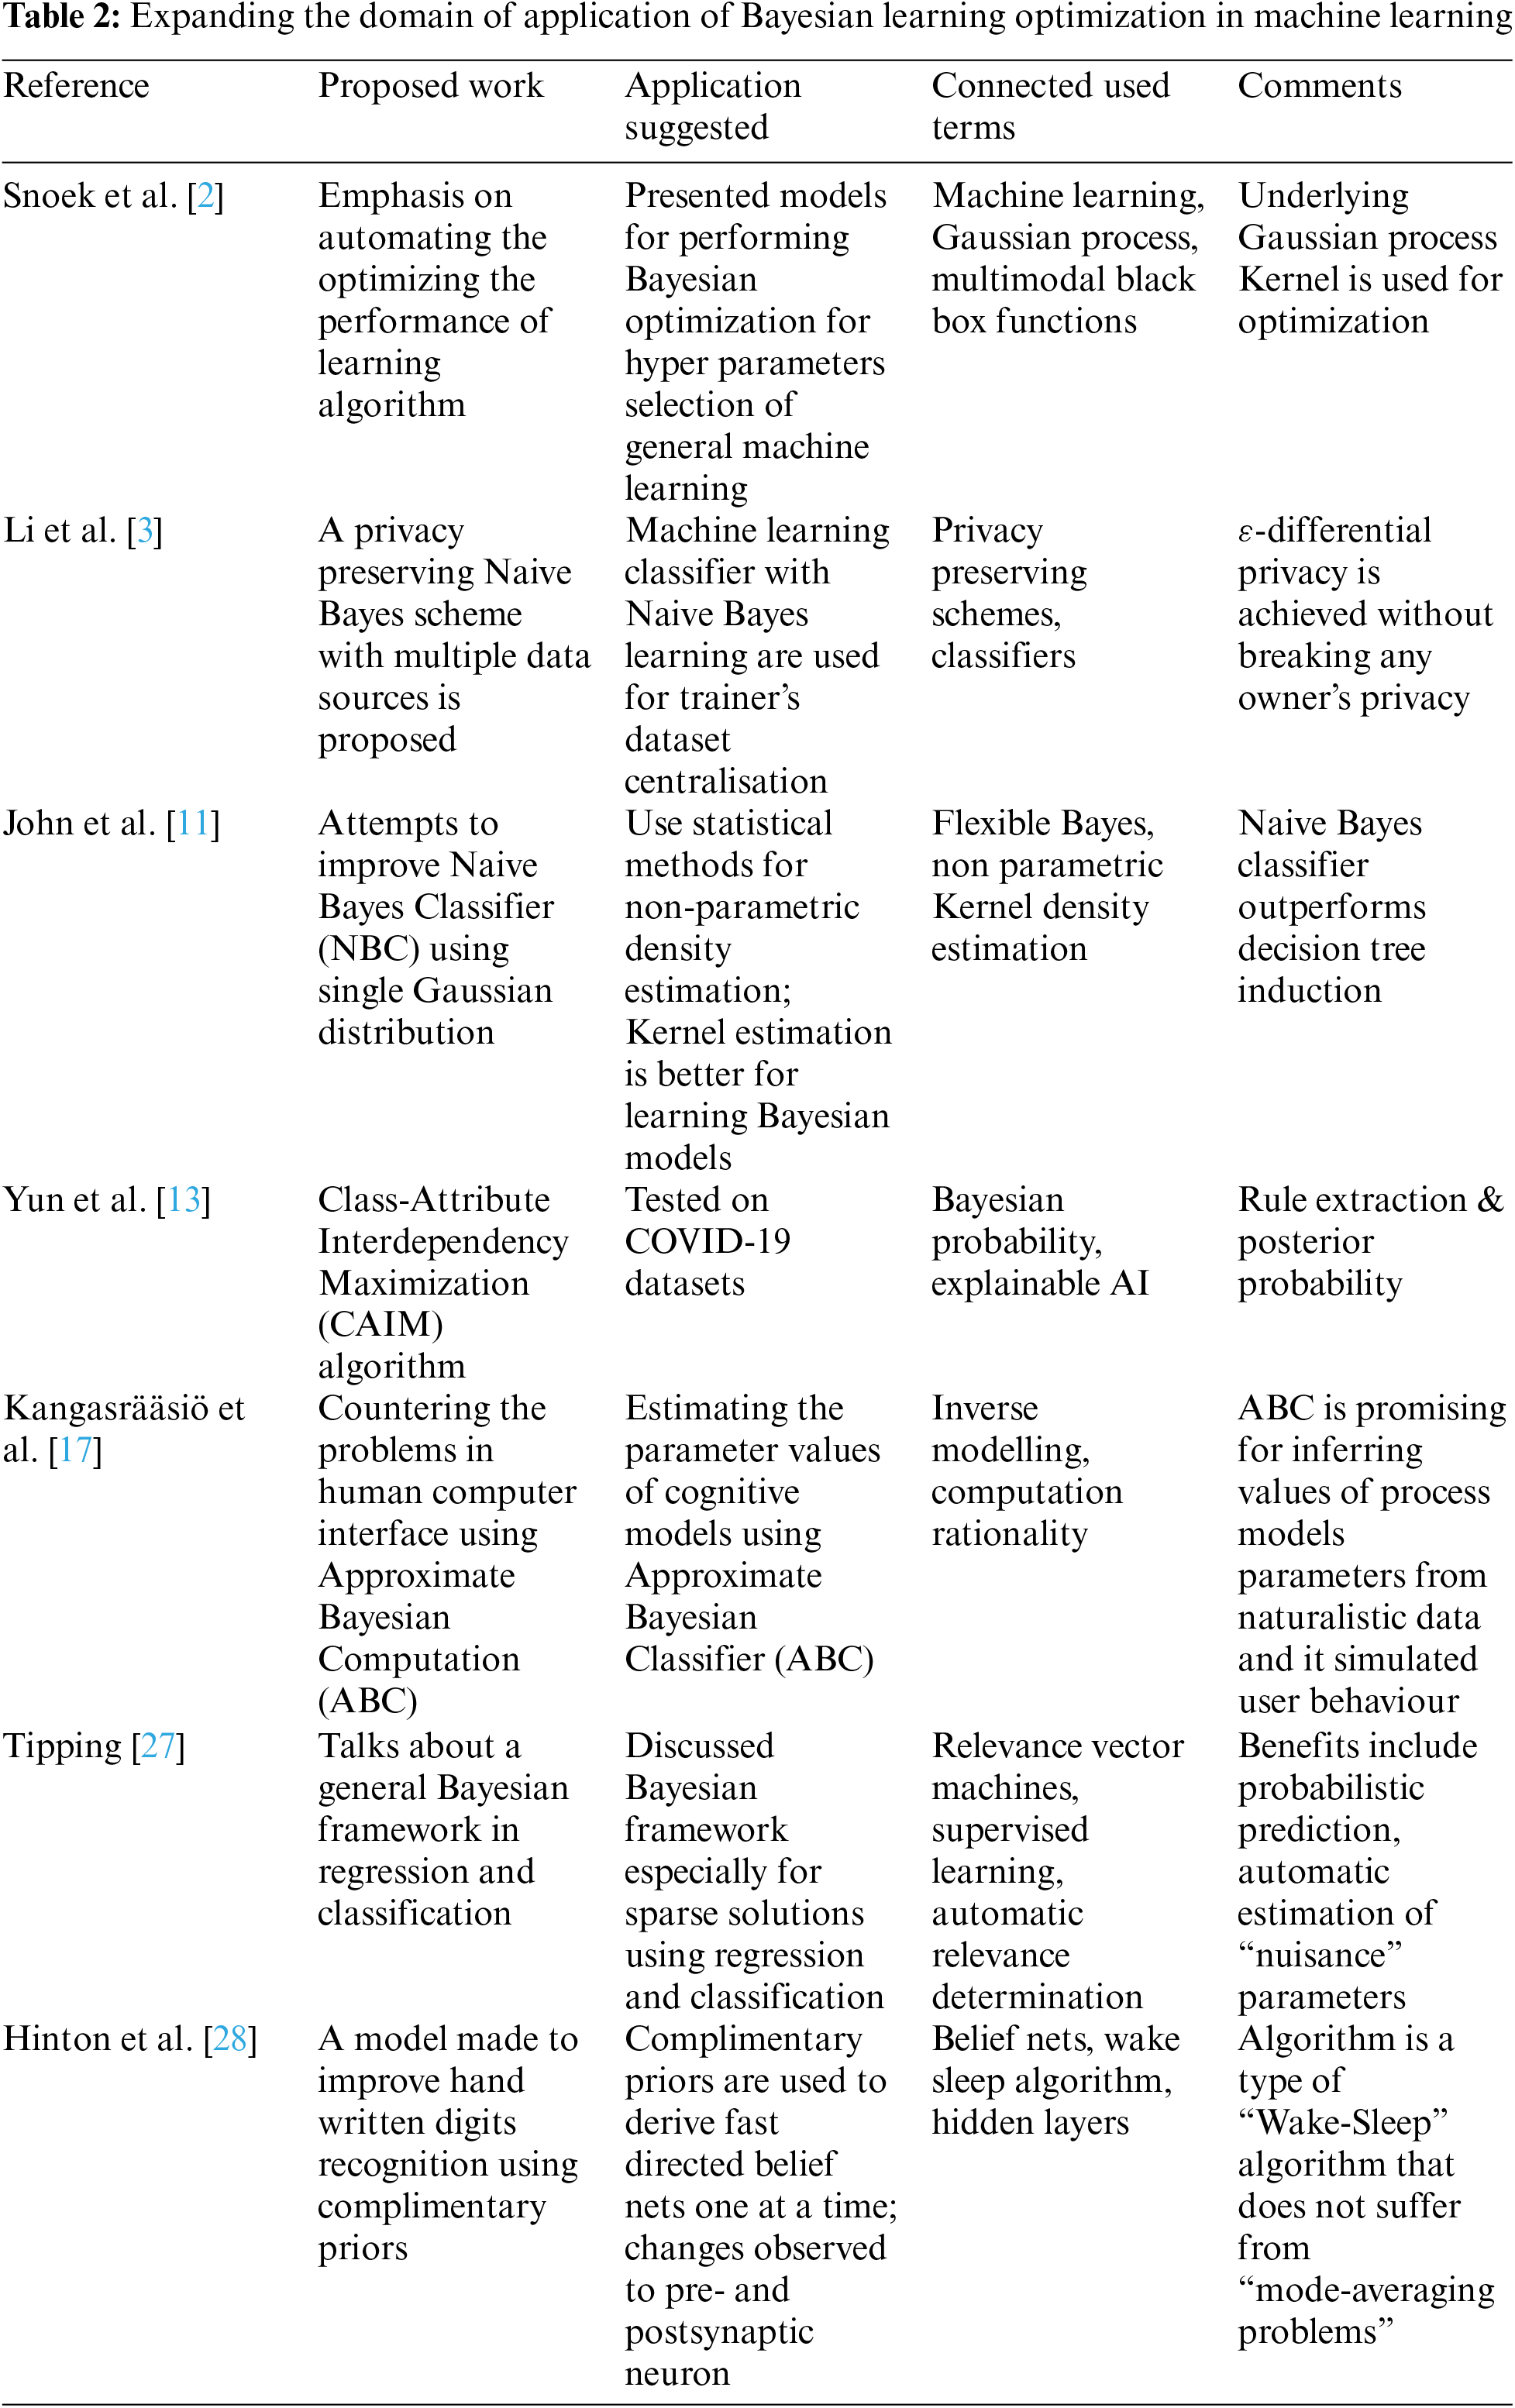
Bayesian probabilistic analysis can serve as a backbone of many AI systems as it relies on apprehending the previous and already stored information to gather new data for analysis [29]. This behavior is analogous to the thinking process of humans. Hence, Bayesian analysis finds many applications in current scenario of AI and machine learning as discussed in [30]. The previous data can comprise of large number of smaller datasets which can be analyzed in collaboration with each other and at same time. Thus, huge amount of data can be used to build prediction models and to recognize parameters having significant role. The prediction can be personalized by adding custom parameters, which can work in hierarchical mode, each having its own implication factor. This personalization is normally implemented using Hierarchical Bayes models for instance hierarchical processes and Bayesian multi-task learning. Tab. 2 reports the domain of application of Bayesian learning optimization in machine learning.
The world today is witnessing the increasing trend of open source software. It has been developed for plethora of applications, be it simple word processor like Open Office organizations or a powerful application which can be used for machine learning tools like: Apache Spark [31]. It supports the open source cause and have used different open source applications.
Python is very good language which currently has large number of programmers. This language is much versatile, that it is used in most machine learning applications. It is user-friendly and has a very easy syntax. It is also supported by various powerful manipulation libraries. We have used Python IDLE for running and testing the programs. Scikit-Learning is a free software machine learning language developed by David Cournapeau for Python programming language. It consists of various classification, clustering and regression algorithms including random forests, support vector machines and k-means. Numpy is also a library for python programming language, which is used in manipulation of large, multi-dimensional arrays and matrices. It also contains a collection of mathematical functions to operate on these. It is very versatile and can be used in various other applications. Matplotlib is the most popular plotting library in Python programming language. It provides functionality to embed plots in variety of GUI based applications such as Tkinter, wxPython. It can be called a free and open-source version of MATLAB like interface. Pandas is also an open source library for Python programming language. It provides data structures and data analysis tools. It provides functionality for manipulating numerical tables and time series. It comes handy when we have to deal with computations involving large amount of data. Common Platform Enumeration (CPE) for Python is a standardized method for describing and identifying classes of applications, operating systems, hardware devices present among an enterprise's computing assets. It features include rich comparison and cross-verification, parsing and evaluation.
Modelling using a probabilistic approach makes use of theory of probability which takes into consideration, all types of variation and uncertainty in the prediction as demonstrated in [32]. It also finds application in constructing and using models, simply called, probabilistic approach to modeling. The primary role of liner quadratic estimation (LQE) can justifies with predict and update the data. These also deals with estimation of error, estimation of time & Kalman gain.
All the observed data, combined with prior, structural and noise parameters are molded to represent and predict the unobserved trends in quantities. The generative models are applied on the predicted trends to zero onto the unobserved quantities. Learning process also uses this approach for increasing its accuracy in finding the correct parameters for a given dataset. Priors are of great importance as it is the ground for transforming prior probability to posterior distributions. This type of learning is termed as Bayesian Learning as its makes use of priors and generative models for prediction [33]. There have been several application which could directly demand the application of Bayesian Learning probabilistic model like:
■ Data Prediction on CoVID-19 disease and bacterial formations.
■ Pharmaceutical product development.
■ Data Science in Learning & Analysis
■ Autonomous vehicles.
4 Proposed Bayesian Learning Probabilistic Model
The role of data processing is very precious as fetch the data from local as well as global repository through various techniques. Later, this data is trained and modelled using various machine learning algorithms which overall helps in better and accurate prediction. The concept for accuracy prediction using machine learning algorithms using Bayesian Learning Probabilistic Model is depicted in Fig. 1.
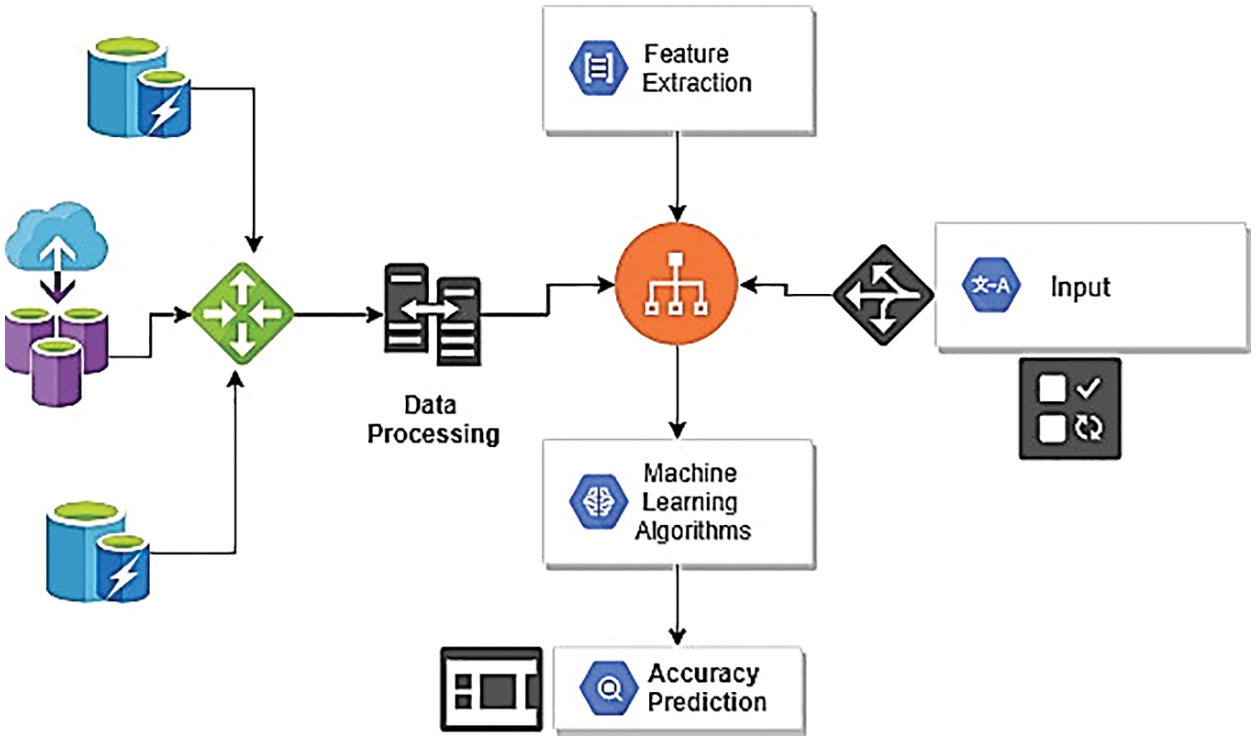
Figure 1: Systematic overview for machine learning based accuracy prediction using bayesian probabilistic model
Bayesian learning involves several important steps beforehand. The first step is to establish a descriptive mathematical generative model of the provided data. It is the probability (or likelihood) function that supplies probability of the observed data for each value of parameters [34]. This step requires finding the right and most accurate generative model. Next step is to find the credibility of each parameter value against the data. The goal is to find the most accurate parameter(s) and their values in regard to the observed prior data. The third step takes use of Bayes’ rule to combine the likelihood function and prior data to generate the posterior distribution using the parameters. This posterior distribution is the predicted data.
Bayesian probability can also be understood by the mean of Bayes rule and Bayesian Inference which is the interpretation of probability concept. Bayesian inference can be deduced as:
Whereas n and m are two events for which n is understand on the basis of m. In formal definition, one event is treated as a hypothesis and other event is just like evidence that supporting happening of particular hypothesis [35]. Both the event is for handling the different possibility of occurrence. For Bayesian probability used in above Eq. (1) can be understudied as:
●
●
●
●
For different values of n, the parameter which affects the
For partitioning using clustering based approach to group the data into a predetermined k-number, the minimizing the cost function
where
4.1 Kalman-Filter Based Prediction Proposed Technique
The Kalman-filter based prediction technique is successful to implement data set in which estimation of neighboring node can be done with linear stochastic difference equation [37–41]. This might also include the estimation of discrete as well as continuous dataset and the modelling based on linear stochastic difference equation can be obtained as mentioned below:
where
Let say,
Here,
4.2 Kalman Filter Based Bayesian Analysis
The Kalman-filter has two different phases specifically named as prediction and update. The prediction phase estimates the data from its previous period and generate an approximation of new data for the current. For the update phase, the more accurate data is calculated on the basis of corrections in the previous data, i.e., to refine the prediction phase for the current period.
Linear quadratic estimation, another name for Kalman filter can be used to filter out the noise in data. This is further explained through the plots on datasets that we have used. The initial dataset, or the dataset used to feed the Bayesian analysis function originally forms a backbone of prediction which has a large share in accuracy of estimation. If this initial data is sorted first and then fed into the Bayesian function, we can achieve better results. A better approach will be to filter out noise and sharp variations in the sorted data itself.
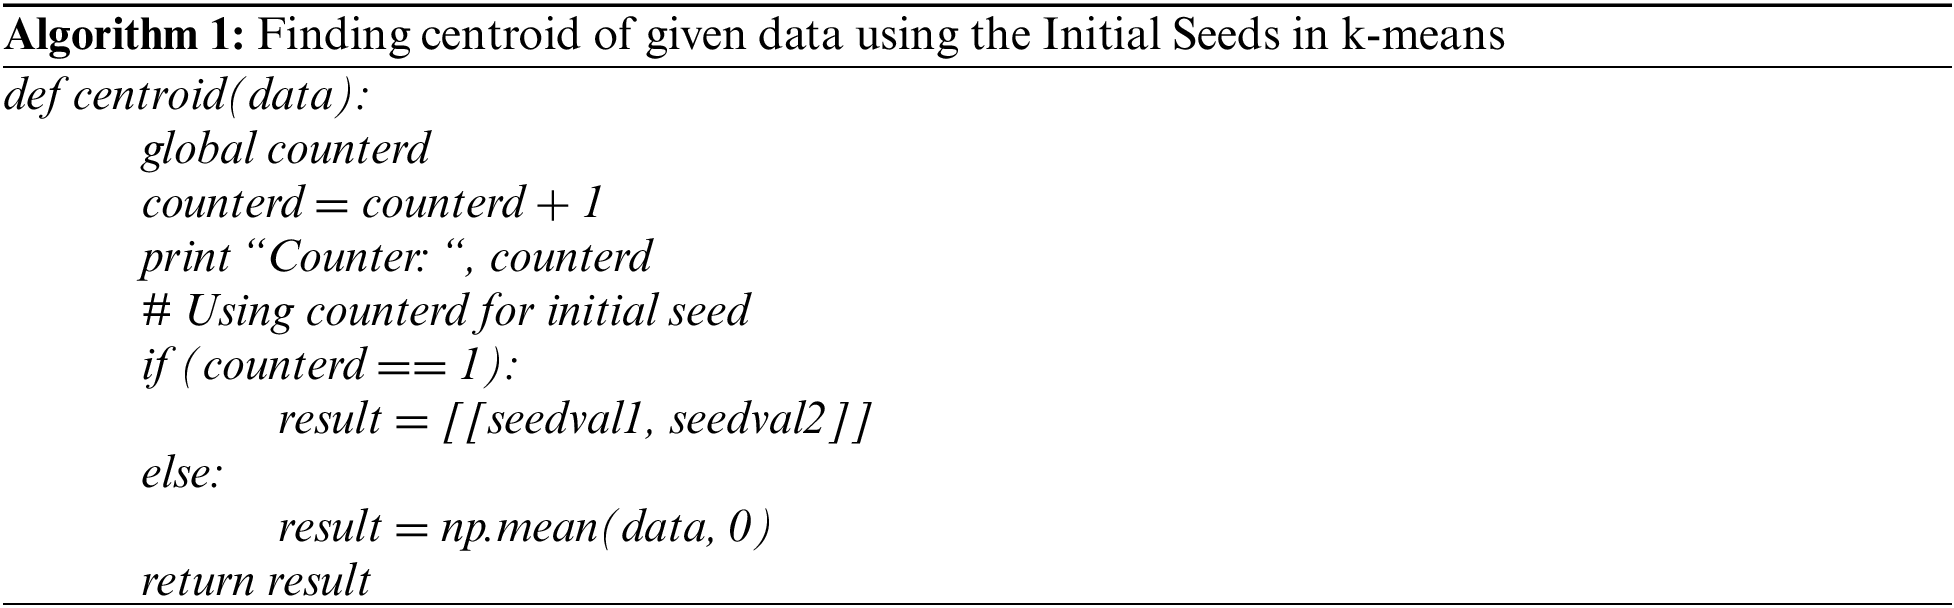
The snippet of these codes were implemented in Python language where seedval1 and seedval2 denotes the seed values calculated using Kalman Filter approach. This demand can be fulfilled by incorporating the need for Common Platform Enumeration (CPE). Afterward, the values are fed to function which used as a first set of values to calculate the centroid of the cluster. This scenario is mentioned in Algorithm 1. This paper implements the algorithm using open source platform of Python and efficiently integrates all different modules to piece of code via CPE.
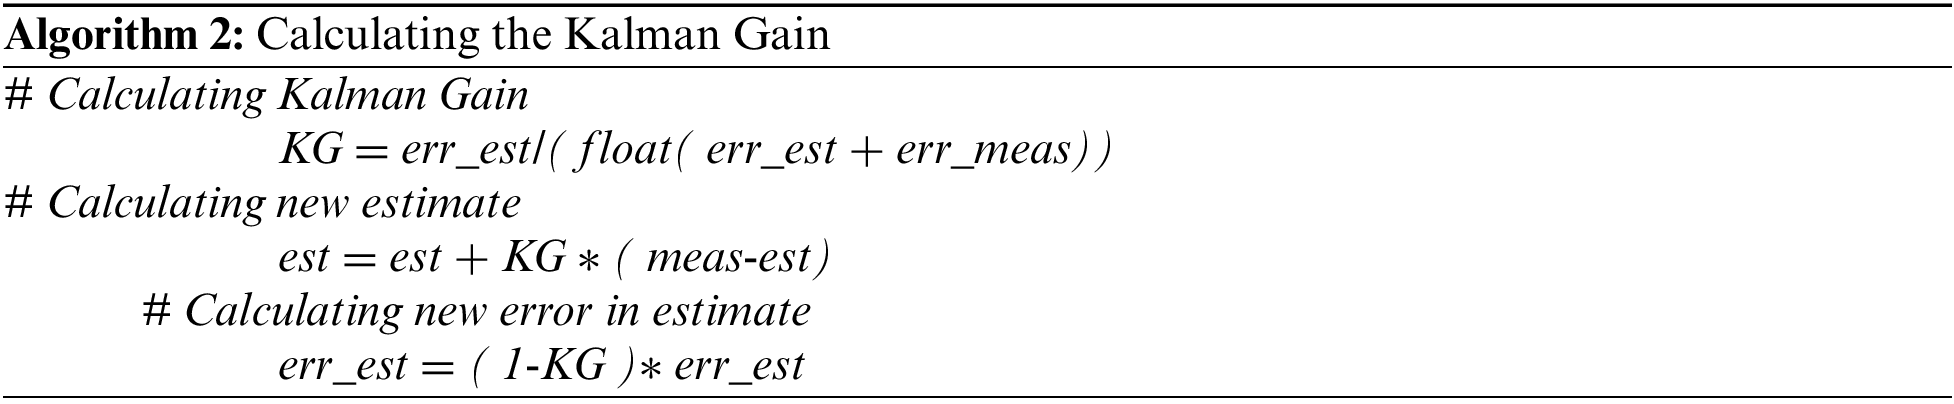
The code mentioned in Algorithm 2 is used to calculate basic Kalman Gain and new estimated values. It also generate initial seed values for feeding to k-means function where KG stands for Kalman Gain variable, est for the Estimated values, meas for the input data and err_est for error in estimate. This overall scenario is the simple Kalman filter algorithm without modification.
A good validation approach includes with basic hypothesis strategy and later, allow the classifier to moderate the tune parameters to the model as required. These parameters can be with distance function as demonstrated in next Section 5. In predicting the plot values, the initial data value is considered as seed index and is further provided with new numbers of clusters each time. This helps the overall model to predict an accurate efficiency as compare to other classifier like simple K-Mean.
In this section, simulation setup and results are presented.
Simulation is conducted to verify the efficiency of the proposed Kalman-filer based prediction model. The open source platform of Python and efficiently integrates all different modules to piece of code via CPE for Python is used.
CPE is a structured naming scheme for information technology systems (ITS), software, and packages. CPE includes a formal name verification system based upon the generic syntax for uniform resource identifiers (URI).
The efficacy is calculated with the help of CPE running on Intel Core i5 with 8 GB DDR4 RAM and Windows XP. These are the parameters used for the simulation. The dataset had been created from GNU Octave, which is available at (octave.org/doc/v4.2.1/). The size depends on the Kalman filter as it is found optimal seed value for centroid, which is found to be: [[48.4481141211, 50.8394268109]] for K-Mean clustering formation.
This approach will further reveal the amount of noise present in all the datasets which we can remove or improve upon. One such filtering algorithm which we have used is Kalman Filter. It has proven itself to check the statistical noise and other inaccuracies using unknown variables. Cumulatively, we have used K-means as a sorting (clustering) algorithm and Kalman filter as a filtering algorithm. Though we have used a small dataset, we have demonstrated that Kalman filter gives good results in stabilizing the data along with K-means which then can be used as a prior input for Bayesian analysis. Kalman filter is directly applied on data to reduce noise and is then fed to K-means function, hence improving the prediction mechanism by a significant amount. This paper is able to reduce the number of computations using Kalman filtering.
The dataset is made into ten clusters [46–51] using the k-means clustering algorithm, without any amalgamation of another algorithm as depicted in Fig. 2. This is justifying much faster scenario recognizing better cluster heads using Kalman-filter model as mentioned in Eq. (4).
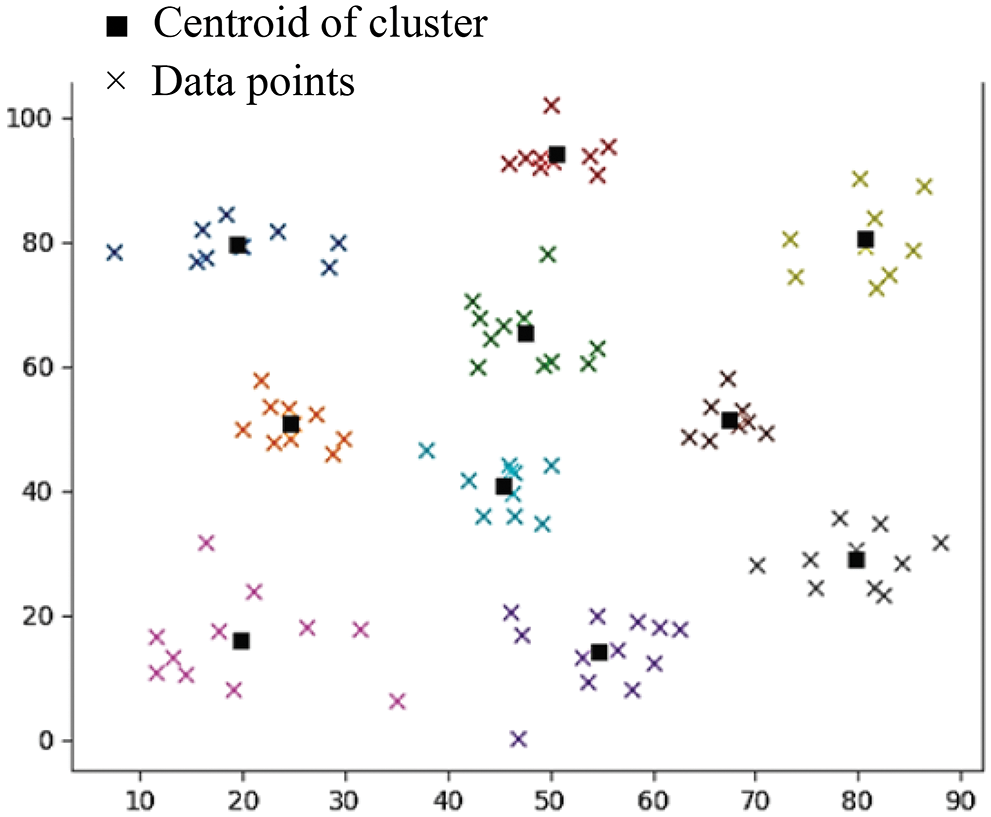
Figure 2: Initial number of clusters with
This experimental setup is established using three initial seed value which are plugged to k-means function at the first iteration. These initial seeds are calculated using simple Kalman filter algorithm, doing calculations on dataset. The required values for the computation of Kalman gain are determined and the output is used as the seed value for k-means [52–56]. Both seedval1 and seedval2 are calculated using this approach. It shows the plot with distance function, q = 3 as depicted in Fig. 3. In each plot, the initial seed is provided with new numbers of clusters each time with variable number of clusters. This shows the efficiency of 97.6% as compare to simple K-Mean. It is also observed that simple K-means approach varies at cluster 8 and cluster10, however, proposed approach increasing exponentially.
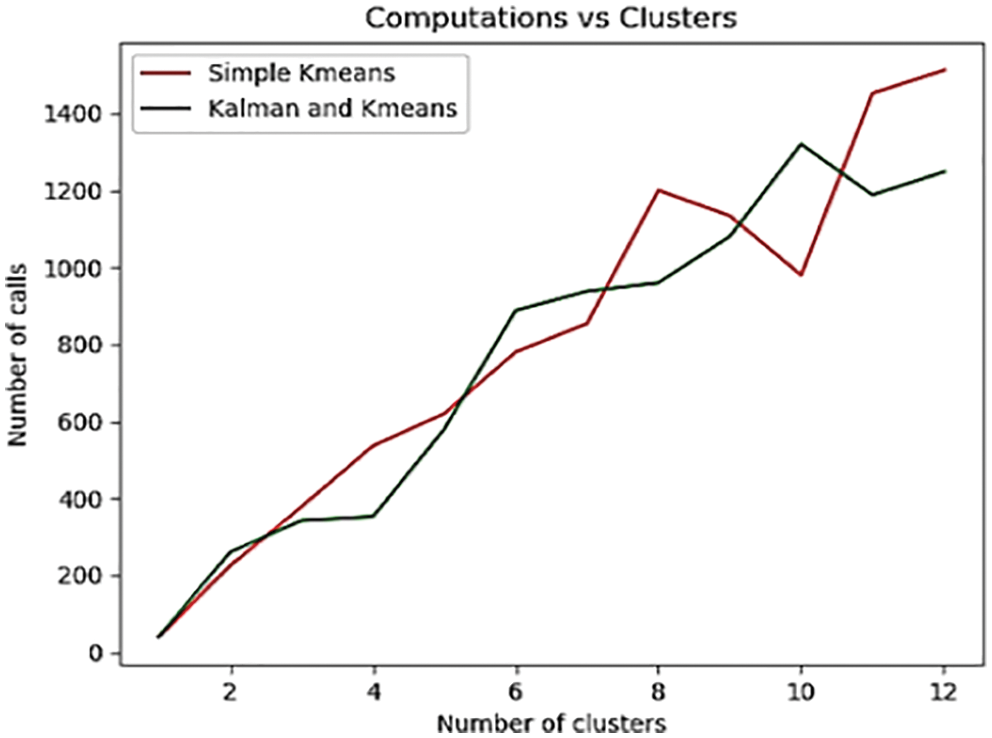
Figure 3: Comparison between number of calls and cluster with distance function, q = 3
As specified in Eq. (3), the different value for distance function, i.e., q = 4 is experimented and plot is observed with steady number of calls over mentioned clusters as depicted in Fig. 4.
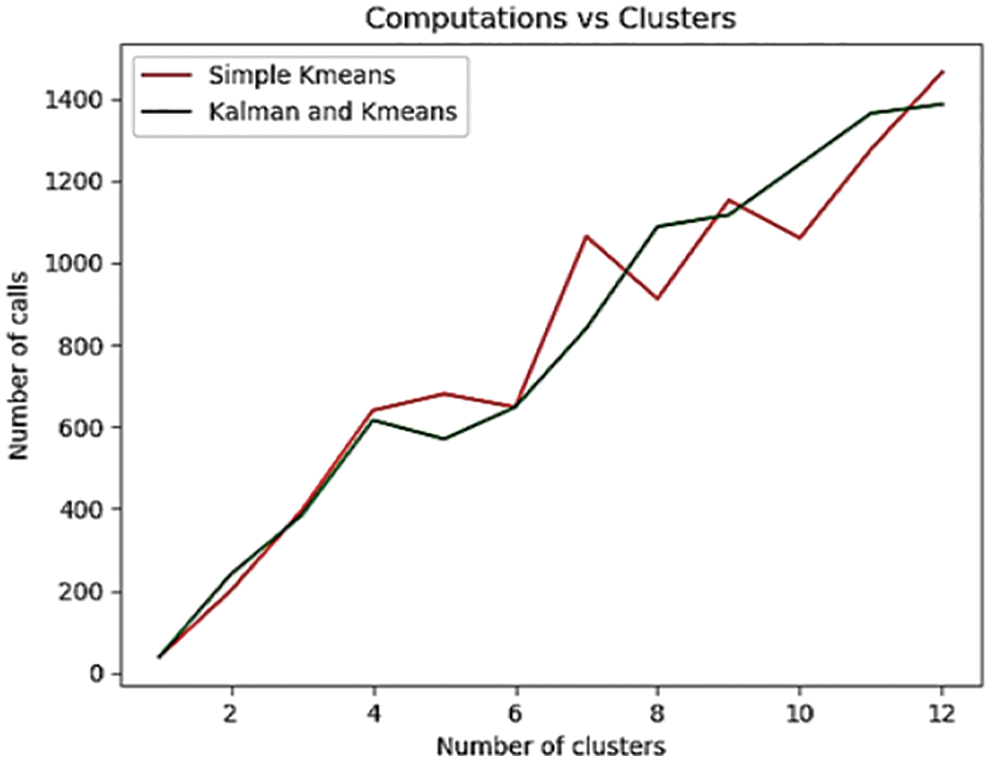
Figure 4: Comparison between number of calls and cluster with distance function, q = 4
For high cluster size, it is observed that the total number of calls increases with time and then dips periodically since cluster size 6, 8, and 10 respectively. Whenever, proposed approach is continuous increasing expect cluster size 5.
This shows the simple K-means clustering for data prediction is same as specified with Kalman filter approach upto 600 calls (approx.) but there is zig-zag in formation of clusters using simple K-Means as compared to Kalman-filter approach. Similar to above scenario, the different value for distance function, i.e., q = 5 is experimented and plot is observed with steady number of calls over mentioned clusters as depicted in Fig. 5. This also justifies significance of Kalman-filter and its computation methodology for better and efficiency in data prediction.
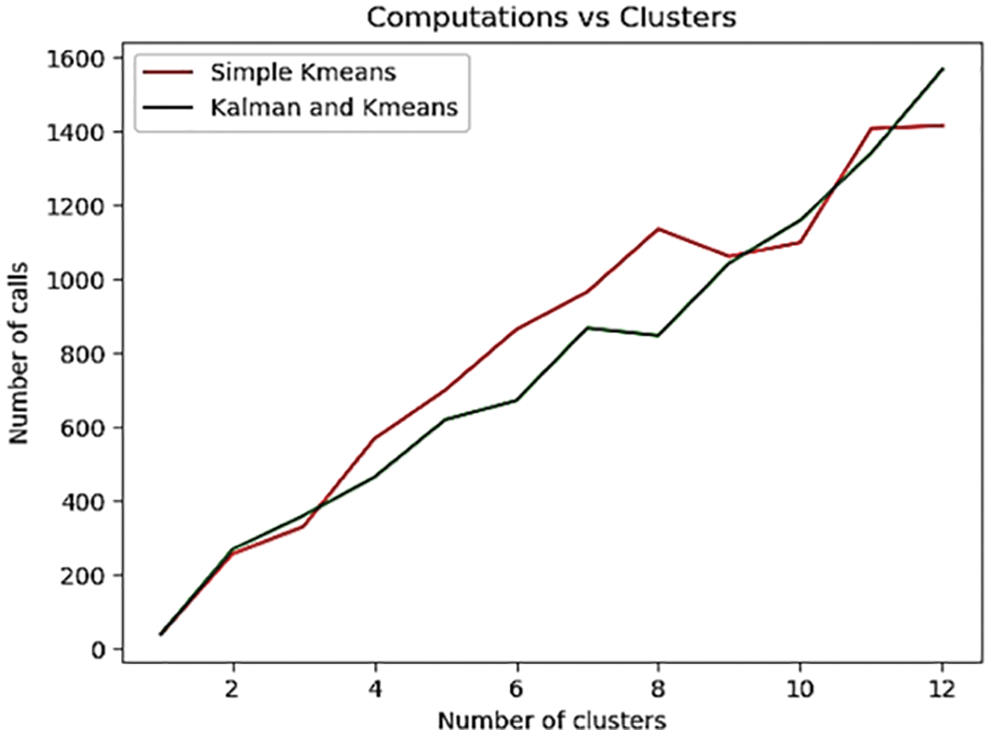
Figure 5: Comparison between number of calls and cluster with distance function, q = 54. Comparison between number of calls and cluster with distance function, q = 5
The world's today is witnessing the increasing trend of open source software. It has been developed for plethora of applications, be it simple word processor like Open Office organizations or a powerful application. This paper presents a method for improving the performance such open source software data prediction using Bayesian classification with the combination of Kalman Filter. The method is applied on a small dataset just for establishing the fact that the proposed algorithm can reduce the time for computing the clusters from data. It has also observed some serious change from all the three plots for different number of calls made to calculating the centroid of cluster. Such combination of Kalman-filer for cluster head selection has drastically reduced in the change of noise as minimum as possible which were not reported in earlier work done in this field. The plots also demonstrate the number of times to the k-means function made calls to calculate the centroid of cluster using the initial seed given to it. Such prediction algorithm is high desirable for predicting data in digital revolution and helps in designing new paradigms to learning algorithms. With the aid of open source software, this paper implements the cluster head selection algorithm efficiently with notable time. A much advanced work can be done by using neural nets in which training model can be varied based on noise conditions using Kalman filter. The amount of noise can be changed using filtering algorithm to achieve the accuracy and corrections in the parameter chosen. A major amount of improvements can be done on topics like how to choose the efficient and right algorithm for reducing noise in the input data set. Kalman filter is found much capable to adhere potential result for it. This shows the efficiency of 97.6% along with K-Mean technique.
Acknowledgement: The authors wish to express their thanks to one and all who supported them during this work.
Funding Statement: This paper was supported by Wonkwang University in 2021.
Conflicts of Interest: The authors declare that they have no conflicts of interest to report regarding the present study.
1. A. Benavoli, G. Corani, J. Demšar and M. Zaffalon, “Time for a change: A tutorial for comparing multiple classifiers through Bayesian analysis,” The Journal of Machine Learning Research, vol. 18, no. 1, pp. 2653–2688, 2017. [Google Scholar]
2. J. Snoek, H. Larochelle and R. P. Adams, “Practical Bayesian optimization of machine learning algorithms,” in Proc. of Advances in Neural Information Processing Systems, Lake Tahoe, Nevada, pp. 2951–2959, 2012. [Google Scholar]
3. T. Li, J. Li, Z. Liu, P. Li and C. Jia, “Differentially private naive Bayes learning over multiple data sources,” Information Sciences, vol. 444, pp. 89–104, 2018. [Google Scholar]
4. P. Wazurkar and R. S. Bhadoria, “Effective modelling for predictive analytics in data science,” Journal of Fundamental and Applied Sciences, vol. 10, no. 2, pp. 197–204, 2018. [Google Scholar]
5. A. Gupta, V. Pattanaik and M. Singh, “Enhancing K means by unsupervised learning using PSO algorithm,” in Proc. of Computing, Communication and Automation (ICCCA), Greater Noida, India, pp. 228–233, 2017. [Google Scholar]
6. A. Ahmad and L. Dey, “A K-mean clustering algorithm for mixed numeric and categorical data,” Data & Knowledge Engineering, vol. 63, no. 2, pp. 503–527, 2007. [Google Scholar]
7. K. Malyuga, O. Perl, A. Slapoguzov and I. Perl, “Fault tolerant central saga orchestrator in RESTful architecture,” in Proc. of 26th Conf. of Open Innovations Association (FRUCT), Yaroslavl, Russia, pp. 278–283, 2020. [Google Scholar]
8. X. Mai, J. Cheng and S. Wang, “Research on semi supervised K-means clustering algorithm in data mining,” Cluster Computing, vol. 22, pp. 3513–3520, 2019. [Google Scholar]
9. A. Bhargava, S. Verma and B. K. Chaurasia, “Kalman filter for trust estimation in vanets,” in Proc. of IEEE UP Section Conf. on Electrical Computer and Electronics (UPCON), Allahabad, India, pp. 1–6, 2015. [Google Scholar]
10. C. Urrea and R. Agramonte, “Kalman filter: Historical overview and review of its use in robotics 60 years after its creation,” Journal of Sensors, vol. 2021, pp. 1–21, 2021. [Google Scholar]
11. G. H. John and P. Langley, “Estimating continuous distributions in Bayesian classifiers,” in Proc. of the Eleventh Conf. on Uncertainty in Artificial Intelligence, Portland, Oregon, USA, pp. 338–345, 1995. [Google Scholar]
12. G. Corani, A. Benavoli, J. Demšar, F. Mangili and M. Zaffalon, “Statistical comparison of classifiers through Bayesian hierarchical modelling,” Machine Learning, vol. 106, no. 11, pp. 1817–1837, 2017. [Google Scholar]
13. J. Yun, M. Basak and M. M. Han, “Bayesian rule modeling for interpretable mortality classification of covid-19 patients,” Computers Materials & Continua, vol. 69, no. 3, pp. 2827–2843, 2021. [Google Scholar]
14. E. Park, H. J. Chang and H. S. Nam, “A Bayesian network model for predicting post-stroke outcomes with available risk factors,” Frontiers in Neurology, vol. 9, pp. 699–708, 2018. [Google Scholar]
15. B. Heaton, N. G. Polson and J. H. Witte, “Deep learning for finance: Deep portfolios,” Applied Stochastic Models in Business and Industry, vol. 33, no. 1, pp. 3–12, 2017. [Google Scholar]
16. J. Biamonte, P. Wittek, N. Pancotti, P. Rebentrost, N. Wiebe et al., “Quantum machine learning,” Nature, vol. 549, no. 7671, pp. 195–205, 2017. [Google Scholar]
17. A. Kangasrääsiö, K. Athukorala, A. Howes, J. Corander, S. Kaski et al., “Inferring cognitive models from data using approximate Bayesian computation,” in Proc. of CHI Human Factors in Computing Systems, Denver, CO, USA, pp. 1295–1306, 2017. [Google Scholar]
18. A. Bansal, M. Sharma and S. Goel, “Improved k-mean clustering algorithm for prediction analysis using classification technique in data mining,” International Journal of Computer Applications, vol. 157, no. 6, pp. 975–987, 2017. [Google Scholar]
19. G. Evanno, S. Regnaut and J. Goudet, “Detecting the number of clusters of individuals using the software structure: A simulation study,” Molecular Ecology, vol. 14, no. 8, pp. 2611–2620, 2005. [Google Scholar]
20. Z. Ghahramani, “Probabilistic machine learning and artificial intelligence,” Nature, vol. 521, pp. 452–463, 2015. [Google Scholar]
21. Z. I. Jordan and T. M. Mitchell, “Machine learning: Trends, perspectives, and prospects,” Science, vol. 349, pp. 255–260, 2015. [Google Scholar]
22. Y. Bengio, “Learning deep architectures for AI,” Foundations and Trends in Machine Learning, vol. 2, no. 1, pp. 1–127, 2009. [Google Scholar]
23. T. Poggio and S. Smale, “The mathematics of learning: Dealing with data,” Notices of the AMS, vol. 50, no. 5, pp. 537–544, 2003. [Google Scholar]
24. E. Grant, C. Finn, S. Levine, T. Darrell and T. Griffiths, “Recasting gradient-based meta-learning as hierarchical Bayes,” pp. 1–13, 2018. [Online] Available: https://arxiv.org/pdf/1801.08930.pdf. [Google Scholar]
25. S. B. Kotsiantis, I. Zaharakis and P. Pintelas, “Supervised machine learning: A review of classification techniques,” Emerging Artificial Intelligence Applications in Computer Engineering, vol. 160, pp. 3–24, 2007. [Google Scholar]
26. S. Mullainathan and J. Spiess, “Machine learning: An applied econometric approach,” Journal of Economic Perspectives, vol. 31, no. 2, pp. 87–106, 2017. [Google Scholar]
27. M. E. Tipping, “Sparse Bayesian learning and the relevance vector machine,” Journal of Machine Learning Research, vol. 1, pp. 211–244, 2001. [Google Scholar]
28. G. E. Hinton, S. Osindero and Y. W. Teh, “A fast learning algorithm for deep belief nets,” Neural Computation, vol. 18, pp. 1527–1554, 2006. [Google Scholar]
29. A. Karpatne, G. Atluri, J. H. Faghmous, M. Steinbach, A. Banerjee et al., “Theory-guided data science: A new paradigm for scientific discovery from data,” IEEE Transactions on Knowledge and Data Engineering, vol. 29, no. 10, pp. 2318–2331, 2017. [Google Scholar]
30. G. Wei, Y. Ling, B. Guo, B. Xiao and A. V. Vasilakos, “Prediction-based data aggregation in wireless sensor networks: Combining grey model and kalman filter,” Computer Communications, vol. 34, no. 6, pp. 793–802, 2011. [Google Scholar]
31. P. Arunachalam, N. Janakiraman, A. K. Sivaraman, A. Balasundaram, R. Vincent et al., “Synovial sarcoma classification technique using support vector machine and structure features,” Intelligent Automation & Soft Computing, vol. 32, no. 2, pp. 1241–1259, 2021. [Google Scholar]
32. B. R. Hunt, E. J. Kostelich and I. Szunyogh, “Efficient data assimilation for spatiotemporal chaos: A local ensemble transform Kalman filter,” Physica D: Nonlinear Phenomena, vol. 230, no. 2, pp. 112–126, 2007. [Google Scholar]
33. L. Peel, “Data driven prognostics using a kalman filter ensemble of neural network models,” in Proc. of Prognostics and Health Management (PHM), Denver, Colorado, USA, pp. 1–6, 2008. [Google Scholar]
34. Y. Lv, Y. Duan, W. Kang, Z. Li and F. Y. Wang, “Traffic flow prediction with big data: A deep learning approach,” IEEE Transactions on Intelligent Transportation Systems, vol. 16, no. 2, pp. 865–873, 2015. [Google Scholar]
35. E. J. Kieling, F. C. Rodrigues, A. Filippetto and J. Barbosa, “Smartalloc: A model based on machine learning for human resource allocation in projects,” in Proc of the 25th Brazillian Symposium on Multimedia and the Web, Rio de Janeiro, Brazil, pp. 365–368, 2019. [Google Scholar]
36. A. Balasundaram, G. Dilip, M. Manickam, A. K. Sivaraman, K. Gurunathan et al., “Abnormality identification in video surveillance system using DCT,” Intelligent Automation & Soft Computing, vol. 32, no. 2, pp. 693–704, 2021. [Google Scholar]
37. F. Sebastiani, “Machine learning in automated text categorization,” ACM Computing Surveys, vol. 34, no. 1, pp. 1–47, 2002. [Google Scholar]
38. S. Srini, “The Kalman filter: An algorithm for making sense of fused sensor,” 2018. [Online] Available: https://towardsdatascience.com. [Google Scholar]
39. P. S. Maybeck, “The Kalman filter: An introduction to concepts,” in proc. of Autonomous Robot Vehicles, New York, USA, pp. 194–204, 1990. [Google Scholar]
40. G. Madey, V. Freeth and R. Tynan, “Modelling the free/open source software community: A qualitative investigation,” Global Information Technologies: Concepts, Methodologies, Tools, and Applications, IGI Global, vol. 3, no. 21, pp. 3296–3298, 2008. [Google Scholar]
41. P. M. Tagade, S. P. Adiga, S. Pandian, M. S. Park, K. S. Hariharan et al., “Attribute driven inverse materials design using deep learning Bayesian framework,” Computational Materials, vol. 5, no. 1, pp. 1–14, 2019. [Google Scholar]
42. T. Wang, C. Rudin, F. Doshi-Velez, Y. Liu, E. Klampfl et al., “A Bayesian framework for learning rule sets for interpretable classification,” The Journal of Machine Learning Research, vol. 18, no. 1, pp. 2357–2393, 2017. [Google Scholar]
43. L. Yang, X. Meng and G. E. Karniadakis, “B-PINNs: Bayesian physics-informed neural networks for forward and inverse PDE problems with noisy data,” Journal of Computational Physics, vol. 425, pp. 232–246, 2021. [Google Scholar]
44. B. Hu, P. Ning, Y. Li, C. Xu, G. Christakos et al., “Space-time disease mapping by combining Bayesian maximum entropy and kalman filter: The BME-kalman approach,” International Journal of Geographical Information Science, vol. 35, no. 3, pp. 466–489, 2021. [Google Scholar]
45. R. Bantan, A. S. Hassan, E. Almetwally, M. Elgarhy and F. Jamal, “Bayesian analysis in partially accelerated life tests for weighted lomax distribution,” Computers, Materials & Continua, vol. 68, no. 3, pp. 2859–2875, 2021. [Google Scholar]
46. A. Shashank, R. Vincent, A. K. Sivaraman, A. Balasundaram, M. Rajesh et al., “Power analysis of household appliances using IoT,” in Int. Conf. on System, Computation, Automation and Networking (ICSCANIEEE Xplore, Puducherry, India, pp. 1–5, 2021. [Google Scholar]
47. S. Samanta, G. Muhiuddin, A. M. Alanazi and K. Das, “A mathematical approach on representation of competitions: Competition cluster hypergraphs,” Mathematical Problems in Engineering, vol. 1, no. 4, pp. 1–10, 2020. [Google Scholar]
48. D. Kothandaraman, A. Balasundaram, R. Dhanalakshmi, A. K. Sivaraman, S. Ashokkumar et al., “Energy and bandwidth based link stability routing algorithm for IoT,” Computers, Materials & Continua, vol. 70, no. 2, pp. 3875–3890, 2021. [Google Scholar]
49. A. Maity, K. Das, S. Samanta, S. Mondal and V. Dubey, “A study of cluster hypergraphs and its properties,” Social Network Analysis and Mining, vol. 11, no. 1, pp. 1–14, 2021. [Google Scholar]
50. S. Samanta and M. Pal, “Fuzzy planar graphs,” IEEE Transactions on Fuzzy Systems, vol. 23, no. 6, pp. 1936–1942, 2015. [Google Scholar]
51. R. Priya, S. Jayanthi, A. K. Sivaraman, R. Dhanalakshmi, A. Muralidhar et al., “Proficient mining of informative gene from microarray gene expression dataset using machine intelligence,” Advances in Parallel Computing (Smart Intelligent Computing and Communication TechnologyIOS Press, vol. 38, pp. 417–422, 2021. [Google Scholar]
52. S. Samanta, V. K. Dubey and B. Sarkar, “Measure of influences in social networks,” Applied Soft Computing, vol. 99, no. 1, pp. 101–112, 2021. [Google Scholar]
53. M. Ganga, N. Janakiraman, A. K. Sivaraman, A. Balasundaram, R. Vincent et al., “Survey of texture based image processing and analysis with differential fractional calculus methods,” in Int. Conf. on System, Computation, Automation and Networking (ICSCANIEEE Xplore, Puducherry, India, pp. 1–6, 2021. [Google Scholar]
54. S. Samanta, M. Pal, R. Mahapatra, K. Das and R. S. Bhadoria, “A study on semi-directed graphs for social media networks,” International Journal of Computational Intelligence Systems, vol. 14, no. 1, pp. 1034–1041, 2021. [Google Scholar]
55. R. Gayathri, R. Vincent, M. Rajesh, A. K. Sivaraman and A. Muralidhar, “Web-acl based dos mitigation solution for cloud,” Advances in Mathematics: Scientific Journal, vol. 9, no. 7, pp. 5105–5113, 2020. [Google Scholar]
56. K. Das, U. Naseem, S. Samanta, S. K. Khan and K. De, “Fuzzy mixed graphs and its application to identification of COVID 19 affected central regions in India,” Journal of Intelligent & Fuzzy Systems, vol. 40, no. 1, pp. 1051–1064, 2021. [Google Scholar]
 | This work is licensed under a Creative Commons Attribution 4.0 International License, which permits unrestricted use, distribution, and reproduction in any medium, provided the original work is properly cited. |