DOI:10.32604/cmc.2022.023852
| Computers, Materials & Continua DOI:10.32604/cmc.2022.023852 | |
| Article |
Identification and Classification of Crowd Activities
1Department of Information Technology, Faculty of Computers and Information, Mansoura University, Egypt
2Department of Computer Science, College of Computer Engineering and Sciences, Prince Sattam Bin Abdulaziz University, Al-Kharj, 11942, Saudi Arabia
3Department of Information Systems, Faculty of Computers and Artificial Intelligence, Benha University, Egypt
4Faculty of Computer Science and Engineering, Galala University, 435611, Suez, Egypt
5Department of Computer Science, Faculty of Media Engineering and Technology, German University, Egypt
*Corresponding Author: Ahmed O. Aseeri. Email: a.aseeri@psau.edu.sa
Received: 24 September 2021; Accepted: 24 December 2021
Abstract: The identification and classification of collective people's activities are gaining momentum as significant themes in machine learning, with many potential applications emerging. The need for representation of collective human behavior is especially crucial in applications such as assessing security conditions and preventing crowd congestion. This paper investigates the capability of deep neural network (DNN) algorithms to achieve our carefully engineered pipeline for crowd analysis. It includes three principal stages that cover crowd analysis challenges. First, individual's detection is represented using the You Only Look Once (YOLO) model for human detection and Kalman filter for multiple human tracking; Second, the density map and crowd counting of a certain location are generated using bounding boxes from a human detector; and Finally, in order to classify normal or abnormal crowds, individual activities are identified with pose estimation. The proposed system successfully achieves designing an effective collective representation of the crowd given the individuals in addition to introducing a significant change of crowd in terms of activities change. Experimental results on MOT20 and SDHA datasets demonstrate that the proposed system is robust and efficient. The framework achieves an improved performance of recognition and detection people with a mean average precision of 99.0%, a real-time speed of 0.6 ms non-maximum suppression (NMS) per image for the SDHA dataset, and 95.3% mean average precision for MOT20 with 1.5 ms NMS per image.
Keywords: Crowd analysis; individual detection; You Only Look Once (YOLO); multiple object tracking; kalman filter; pose estimation
Crowd analysis has recently gained much attention for its broad range of applications usage, including video surveillance. It has been an active research topic in machine learning (ML) and computer vision using continuous videos [1]. Crowded situations may originate from numerous scenarios, posing safety and security concerns. The crowd size and dynamics of crowds affect the safety of the people. Hence, further studies are needed on crowds and individuals in the crowd for surveillance and safe pre-control [2]. Because crowds usually have so many individuals accumulated with frequent and substantial movements. Many existing detections and tracking technologies, which are only applicable to sparse crowd scenes, do not work well in crowded scenes. The number of surveillance cameras installed all over the world has increased unprecedentedly. This makes it easier for us to identify and classify a wide area of crowds. Yet, with limited human resources, many video images simultaneously are not sufficient to analyze them. So, there is a need to have an automated way to monitor the population and classify them. The development of an intelligent surveillance system is one of the key applications of crowd analysis. In general, an analysis of a crowd may be conducted at three levels [3]. First, macroscopic levels where a mass of people's global motions and behaviors are the focus of interest. So, we can consider the whole crowd at once with no concern for the movements of individuals. Second, microscopic levels where the research deals with the behaviors and activities of any individuals in the crowd [4]. Finally, mesoscopic levels are based on combinations of intrinsic characteristics of microscopic and macroscopic levels.
This paper incorporates deep learning (DL) algorithms into our framework to improve identification accuracy, allowing better data to be derived from videos and analyzed per crowd [5–7]. So, analyzing individual behavior in crowded scenes is one of the most important and challenging areas in current research. The main steps of our framework: Firstly, we start with identifying the crowd and use object detection techniques to analyze crowds at microscopic levels [8]. Individuals in a crowd can move in the same direction or randomly. This is one of the challenges of crowd recognition and identification with high density in the MOT20 dataset in unconstrained environments. Therefore, we want to create a framework for crowd density representation using You Only Look Once (YOLO) by detecting individuals who appear in the video [9]. YOLO is used as a real-time object detection algorithm. It has the advantage of being much faster than other networks and still maintains accuracy [10,11]. Detecting individuals is the most important step in our research. Our model is completed with the result of the YOLO algorithm. The second most difficult challenge is multiple object tracking, which localizes detected persons along with the video [12]. Thirdly, the computation of calculating the total number of individuals is considered the third challenging problem [13]. Challenges appear due to occlusions, constant displacement of the person, varied viewpoints and behavior, varying levels of illumination, and the allocation of pixels per person decreases in high density. Finally, the proposed article focuses on observing abnormal human activities. A crowd analysis method has been completed using human pose estimation to provide an automated approach for detecting abnormal crowds. The major contributions of this paper can be highlighted as follows:
• A novel framework is proposed for DL model-based multi-scale feature extraction from video frames.
• A modified YOLO is used for a more accurate and fast human detection method in an unconstrained environment.
• A collective representation of the crowd is designed using a density map, given the individuals’ positions.
• Crowd counting is produced for high density, based on human detection.
• For more precise crowd classification, individual activities and several algorithms for human tracking are used.
The remainder of the article is arranged as follows. Section 2 summarizes the proposed study's most applicable methodologies in the related work section. Our proposed DL architecture is introduced in Section 3, especially employing human activities for crowd classification. A detailed experimental result and datasets of our work are followed in Section 4. Finally, we conclude and suggest possible future research directions in Section 5.
There is much research in crowd analysis. Each of them had his standard or real dataset to solve specific problems, so most studies are not comparable to others. Previous work on crowd analysis is summarized in Tab. 1.
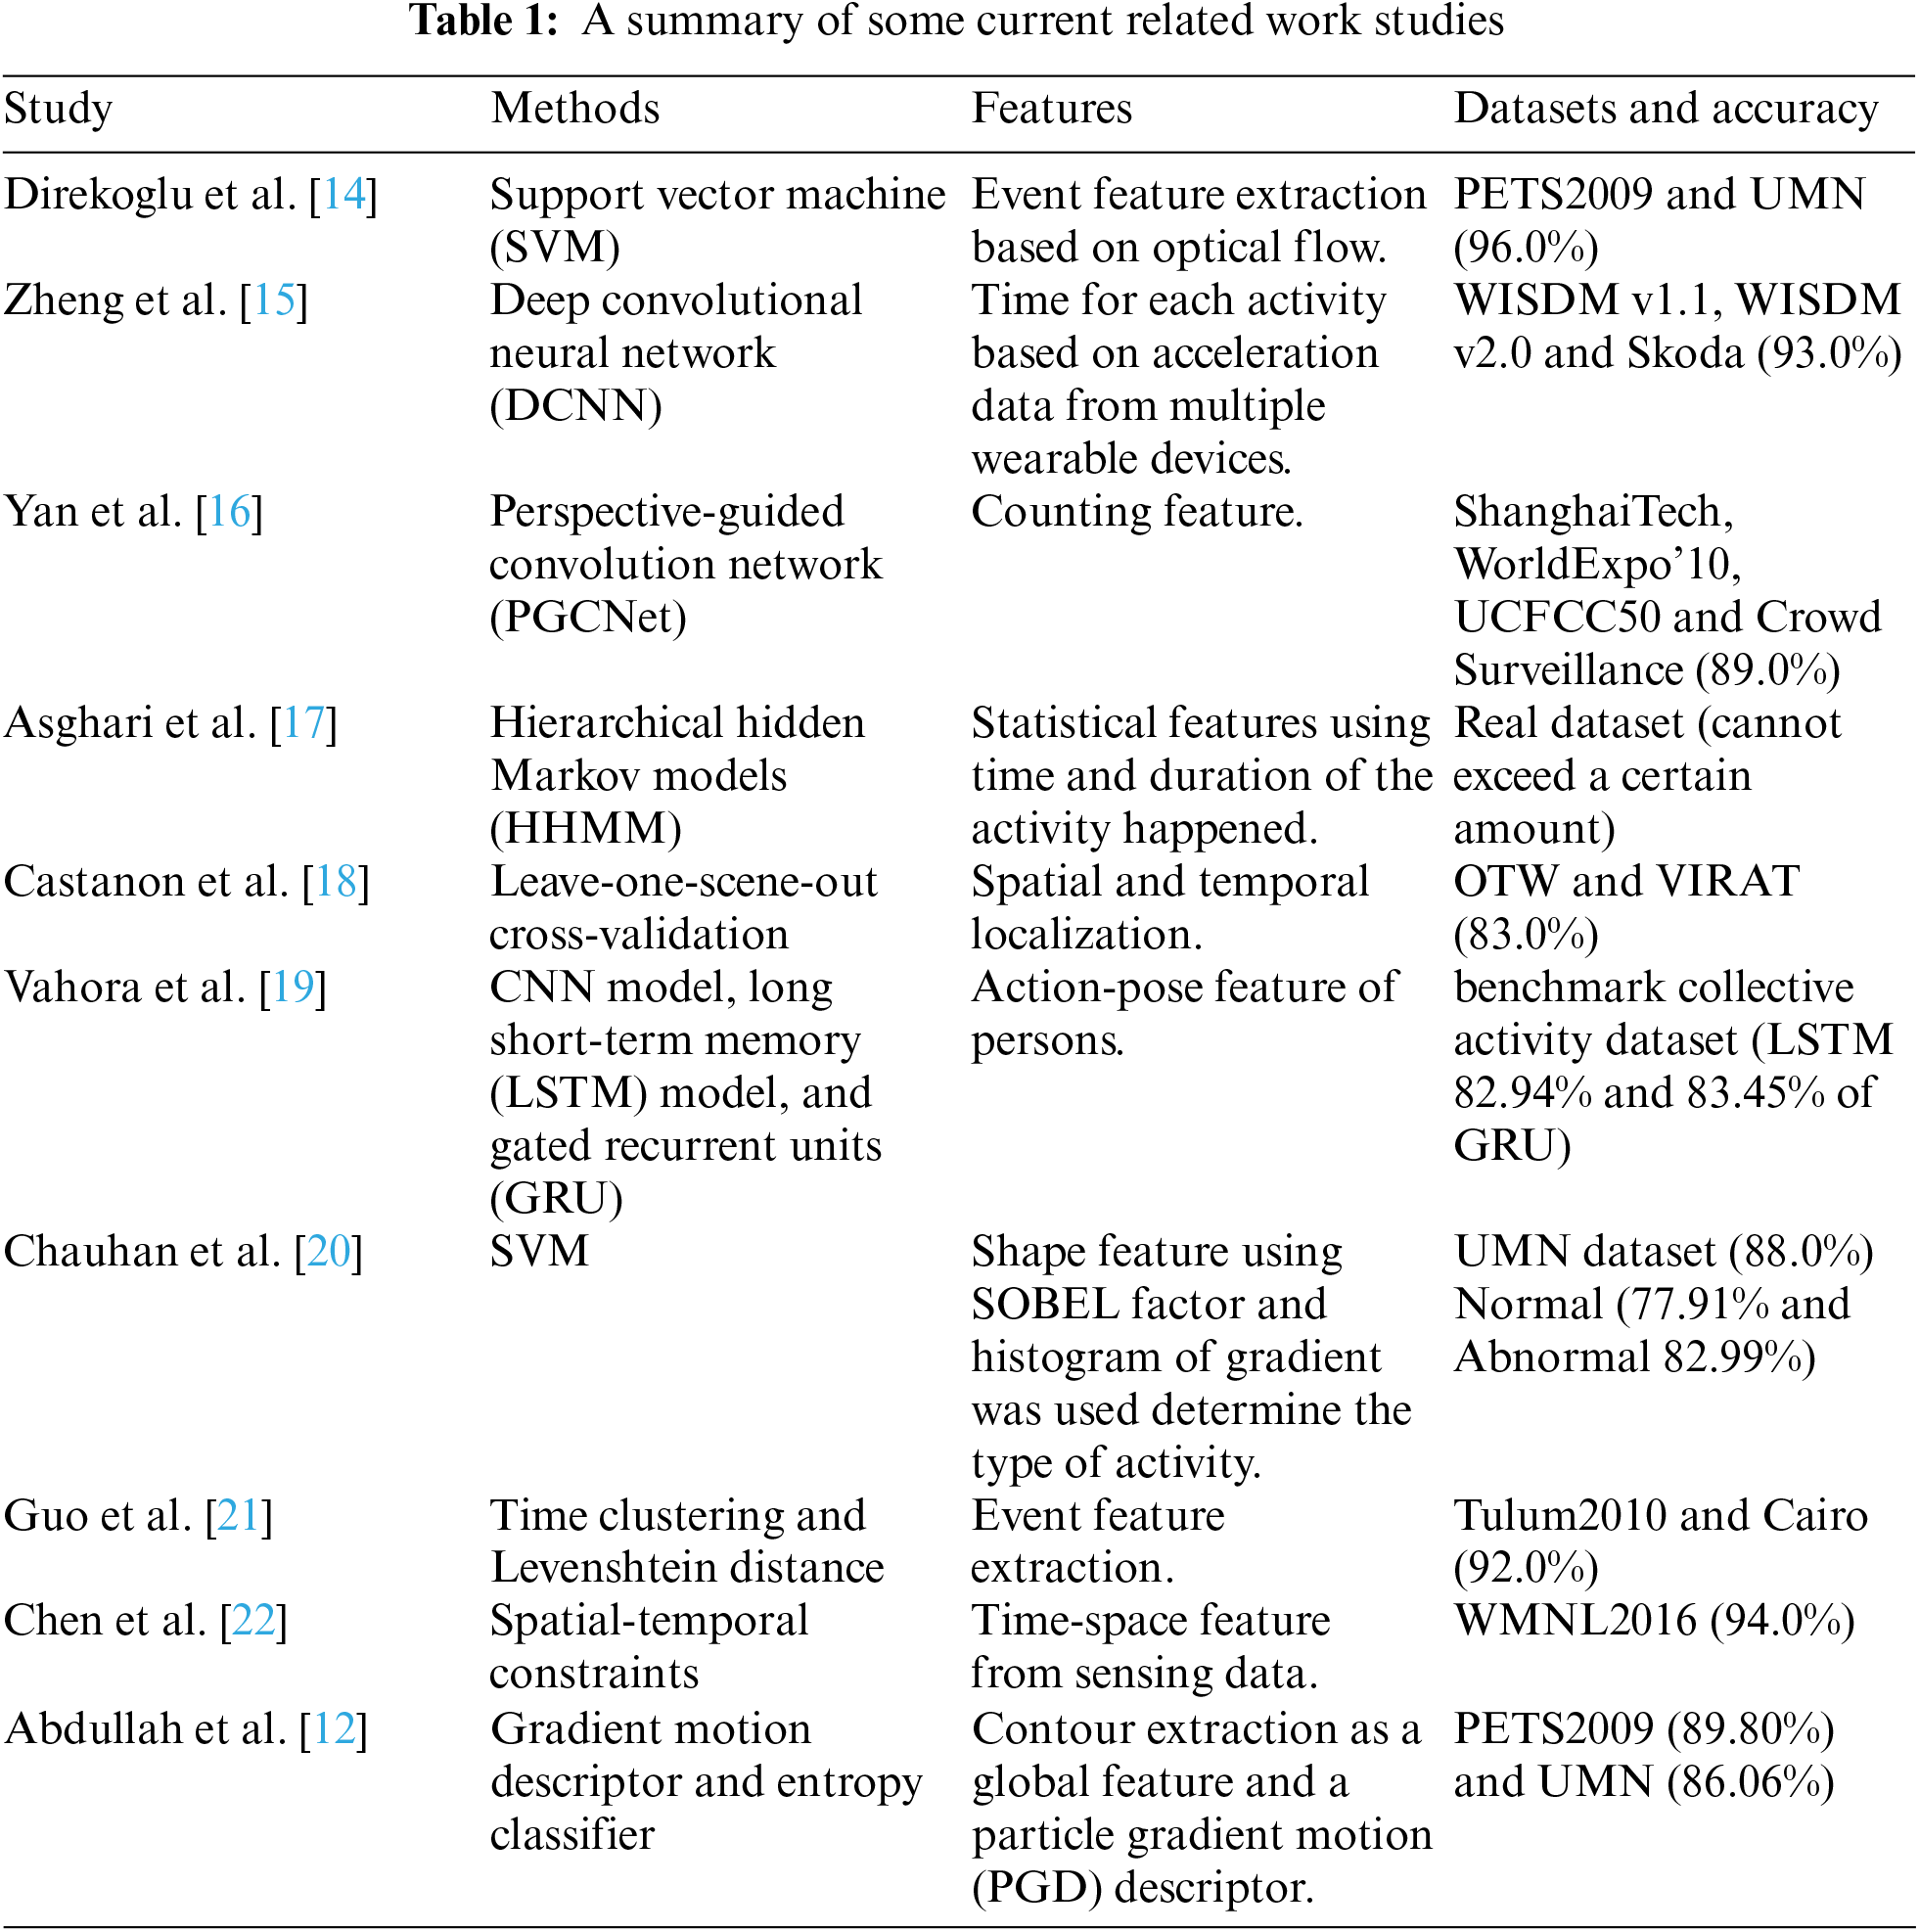
Direkoglu et al. [14] proposed an optical flow-based event feature extraction of the abnormal crowd. The angle difference between optical flow vectors was computed in each pixel's current and previous frames. Then multiplication of the angle difference with the optical flow magnitude in the current frame was used to remove noise. In the end, one class SVM was used to identify normal crowd behavior, and abnormal crowd activity was observed when a test sample deviated significantly from normal behavior. Using the UMN dataset, the optimal window size was 141, but in PETS2009, the optimal window size was 71. This paper needs to apply motion optical flow for a precise system.
Zheng et al. [15] used WISDM v1.1 (daily activity knowledge collected by a smartphone in an exceedingly laboratory, with a rate of 20 cycles/s), WISDM v2.0 (daily activity knowledge collected by a smartphone during an uncontrolled system with a rate of 20 cycles/s) and Skoda (manipulative gestures performed in an automotive maintenance situation, with the rate of 98 cycles/s). WISDM is collected from 51 test subjects performing 18 activities for 3 min each. In this paper, the knowledge about eight activities was accelerated. The participants completed every activity for approximately10 min except for jumping (approximately 1.7 min). Classifiers were separately trained and evaluated for each participant, which meant extra execution time.
Yan et al. [16] used the ShanghaiTech dataset, which was split into Part A and Part B, with 482 and 716 images. PGCNet was represented for crowd counting. The PGC block was built by combining the features before/after the PGC module. The problem occurs at low picture resolution.
Asghari et al. [17] utilized two datasets collected using 32 and 30 sensors from 2 different houses for five months. Each house had one person. The model hierarchically comprised a series of HMM, hereby developed to recognize the start of the activity, analyze the ongoing activity, and analyze the ongoing activity, identify the end and class of activities. Additional work needs to be done to improve recognition of the other class as the most troublesome class of activity.
Castanon et al. [18] used a crowd activity data set of 5,668 examples from 17 activities of NIST Extended Video Actions (ActEV) challenge for vehicles or people's activities and associated objects Out The Window (OTW). The VIRAT data set was employed for training and validation, which includes 1,404 train Set activities and 1203 Validation Set activities. There are inconsistencies hence the cause of these inconsistencies needs to be identified, and the OTW dataset expanded for addressing them.
Vahora et al. [19] proposed multi-layer deep architecture as human action-pose level CNN followed by recurrent neural network (RNN) model. LSTM and GRU models were employed to tackle the long-range dependency of the simple RNN model. Framework started with spatial feature extraction of person for action-pose classification using 16 classes of activities. The result showed that the LSTM model with Adam optimizer, learning rate 0,001, with N = 64 number of units in LSTM cell and the GRU model with RMSprop optimizer, learning rate 0,001, with N = 32 number of GRU units boosts performance compared to other variations.
Chauhan et al. [20] used gradient histogram and the Blob analytical method to extract the feature and recognize human movement within the video frame. The SVM then categorizes activities (normal (77.91%) or abnormal (82.99%) and types of activities such as Hectic (88.36%), Fight (86.87%), panic (79.1%), then crowd types were given.
Guo et al. [21] applied two resident datasets (Tulum and Cairo) provided by the Center for Advanced Studies in Adaptive Systems (CASAS). They evaluated his technique by comparing it with several conventional classifiers. Fourteen activity categories from 36 sensors were collected in Tulum2010 at 98 days measurement time, and Cairo had been collected from 32 sensors and 57 measurement days in 13 categories of activity. Two married residents who performed routine daily activities were applied to a home with practical experiments. Event feature extraction is based on separating activities that occur in the same space but at different times.
The WMNL2016 dataset collected from the Wireless & Mobile Network Laboratory was used by Chen et al. [22]. In WMNL2016, 40 state-of-the-art sensors were put in a six-area apartment, while one voluntary worker carried out 12 months’ activities. In 35 or more training days, the number of activities recognized was 12, which was used to tailor the Service for the elderly for individuals in the aged care sector in a smart home. In order to predict and recognize abnormal activity recognition, this article should employ deep learning and some other master learning technologies.
In crowded scenes, Abdullah et al. [12] presented framework counting, monitoring, and detecting the behavior of several persons with gradient motion descriptors and Spatio-temporal entropy classifier. The first dataset, PETS2009, was a data set that includes the Sample 1 data set used to count people in a low-density crowd. The Sample 2 data set was used to detect and track humans in medium-density crowds. The Sample 3 data set was used for tracking and estimating the number of individuals in a large crowd. The second dataset was UMN, consisting of three separate scenes (one indoors and two outdoors) to detect abnormal crowd behavior. The lawn scenario was one of the outdoor scenes, which consisted of 1453 frames and the Plaza scene was the second outdoor scene with three scenarios with 2142 frames. Six indoor scenes with 4144 frames were presented. Occlusion and single scene detection were the problems in this framework. Different scenes are considered, like sports, combat, traffic, and action scenes.
Not only the object in the image is classified, but the object is also localized to consist of an object detection model [23,24]. Two stages had been employed in earlier years to address this problem: first, sliding windows of different sizes were used to extract different areas in the image. Second, it applied the classification problem to determine what class the objects belong to. The problem with these approaches is that they need a great deal of calculation and are divided into several stages. This makes it difficult for the system to be optimized in terms of speed. Using the YOLO algorithm, our framework reconstructs object detection from image pixels to bounding box coordinates and class probabilities as a single regression issue [25]. The system provides prediction vectors that match each object in the image. The idea of the YOLO system is that it calculates all the features of the image. Besides, it predicts all the items simultaneously instead of iterating the process of classifying the different areas in the image.
3 The Proposed Crowd Analysis Technique
This paper introduces a crowd analysis framework in which the majority of problems are solved. In particular, it is especially difficult to detect each item individually if two or more individuals move close together; the human detector output is a merged result. Another important concern is irregular human distribution when the density differs in a video. These systems are faced with a non-uniform arrangement of different individuals that are close together. This is what is known as clutter. To deal with these challenges, the proposed approach is described in Fig. 1. The initial phase, employing the ML model for human detection, is crowd detection. This work requires quick human detection to be carried out in real-time. The network is trained with frames in which the crowd is included. After the training stage is properly done, people's activities in frames are classified to see their effect on the crowd's classification.

Figure 1: The flow of the crowd analysis framework
Our approach includes three primary stages of crowd analysis: individual detection, crowd representation, and classification. They are discussed in the following activities using video data (MOT20 and SDHA datasets). The first step in human detection is preprocessing, which focuses on formulating datasets to obtain videos containing a crowd using the YOLO model and tracking algorithm. In the second stage, identification and crowd map representation are applied in selected videos that contain a crowd. They are utilized to identify individuals as a part of the crowd and calculate the total number of individuals in each frame. In the third stage, the individual activities are classified to identify normal/abnormal crowds. Finally, the training model assigns individuals to the crowd to detect if the crowd changed using the number of individuals and activities.
3.1 Object Detection of Individuals
3.1.1 Preprocessing of Human Detection
The purpose of the preprocessing phase on the human detector is to provide an acceptable input in real-time for the model's suitability. Datasets are divided randomly into training, validation, and test sets using handcrafted methods. The extraction of input video feed frames is necessary. These frames are resized and smoothed out individually. The original frame is normalized, which improves the detecting speed without losing any precious frame data. This is a crucial method to ensure all individuals are labeled, especially those with the high-density crowd, to improve performance accuracy. It is done for the computing parameters needed and for further implementation and detection. The processed stage output is given into the YOLO model. After integrating the anchor box size of the detection model for classification purposes, preprocessing procedures would be finalized.
3.1.2 YOLOv5-S Model Architecture
YOLO is a neural network method that recognizes and detects different objects(here-individuals). It has grown in popularity over the above-mentioned detection technology due to its improved performance and uses only 7MB of memory. Human detection is done in YOLO as a regression issue and offers the class probability for the observed items as well as bounding boxes. YOLOv5-S is one of the various versions of YOLO, which consists of three main components that distinguish it from other algorithms [26]. Firstly, the backbone model is a CNN that generates important features from given images using Cross Stage Partial network (CSP) and Focus interlaced sampling splicing structure as the backbone. CSPNET deals with the issue of repeated gradient information in large-scale backbones [27]. It integrated gradient changes into the feature map. It reduces computations by reducing model parameters and FLOPS (floating-point operations per second), which improves inference speed and accuracy and reduces model size. Secondly, the Neck model is used to form feature pyramids. Feature pyramids aid models in achieving good object scaling generalization. It aids in identifying the same object in various sizes and scales.
Path Aggregation Network (PANET) [28] and Spatial Pyramid Pooling (SPP) [29] are used as the neck model of YOLOv5's. It boosts information flow and improves the use of exact location signals at lower layers, improving the object location precision. This version uses a subsampling layer that reduces the spatial scale of the convolved features. The computation power needed to process the data should be decreased by reducing dimensionality. Thirdly, YOLOv5's head, the YOLO layer, is used to do the final detection part. It generates a multi-scale prediction of three feature maps, allowing the model to handle small, medium, and large objects. Generalized Intersection over Union (GIoU-loss) is used to maximize the overlap area of the ground truth and predicted bounding box of detected object [30]. Backbone, Neck, and head models of YOLOv5's have been displayed in Fig. 2. The stochastic gradient descent (SGD) was employed [31]. It starts with an initial learning rate using ADAM as the adaptive learning rate [32]. SoftMax is used in the final layer of the network, representing a single class's utilization. The results of the detection stage are transformed to the training stage, as in Fig. 3.

Figure 2: The architectural description of YOLOv5's

Figure 3: The flowchart for the training of YOLOv5's
These results contain the bounding coordinate vector [
Crowd counting is determined using detection-based approaches, which are utilized to determine each individual's representation in the crowd. These methods consider the crowd as an independent collection of people who can detect individuals by generating bounding boxes and then counting people with bounding boxes. Crowd size is computed from the total number of bounding boxes in each frame [34,35].
3.2 Multiple Individual Tracking
Detection is followed by tracking individuals using bounding boxes and assigning a unique identifier to each one [36–39]. Using SORT tracking as a framework for Kalman filtering and Hungarian optimization to track individuals listed in Algorithm 1. A recursive estimator, the Kalman filter at time t + 1, is used to compute the estimation for the current state at time t. All that is required is the estimated state from the previous time step and the current measurement. As a result, the human's location can be maintained even if the human's vision is blocked. By assessing whether an individual in the current frame is the same individual detected in the previous frames. Furthermore, the Hungarian algorithm assigns a unique ID number to a target individual. Each individual in a frame is described by the following Eq. (1):
The target bounding box's horizontal and vertical positions (i.e., the centroid) are represented by

To represent the crowd map, the hue color range on the HSV channel was previously defined [40,41]. Abounding box is generated for each detected individual, which is utilized to calculate the individual's location in the heatmap. In general, the redder grids, the more individual bounding boxes are likely to intersect with one another. In addition to people's basic movement and tracking data, analyzing crowd density might be more valuable. So, risky zones might be identified or redesigned to secure the environment.
After the crowd is represented, we need to analyze human activities to know how they can reflect the impact of their changes on crowds. Crowd control can be improved as a result of a greater understanding of human activities and crowd dynamics using multiple human tracking listed in Algorithm 2.
3.4.1 Top-Down Pose Estimation
Pose estimation is utilized to identify and predict human activities such as sitting, standing, lying down, or punching or jumping [42–44]. Top-down approaches for pose estimation run a person detector first and then estimate body joints. There is a lot of overlap between individuals, different individual scales, and occlusion in our datasets in crowd frames. Therefore, a lot of difficulties have been solved with top-down techniques. The critical points in an individual's body include 18 joints such as the elbow, knees, and wrists are localized using the TensorRT pose method using ResNet backbone. A person's body representation is built using the position of human body parts from visual input data, as shown in Fig. 4. As a result, a person's body modeling is essential for estimating human position. It represents extracted features and key points from visual input data after detection and tracking using the YOLO technique and Kalman filter.

Figure 4: Overall pipeline to estimate human pose for activity recognition
After that, there are nine activities. They are labeled as normal and abnormal activities. In the case of abnormal individual activities, the crowd is classified as abnormal using the handcrafted method.
The model's training was conducted using MOT20 and SDHA datasets in a free Integrated Development Environment (IDE) called Google Collaboratory (Google Colab). Tesla K80 is utilized from Google Colab, which is Google provides to support research and learning about ML. The pre-installed libraries of Google Colab are pretty and allow the DL model to gain accuracy and learn from additional data sets.

Eight new sequences in unconstrained environments were chosen from three crowded situations for the MOT20 benchmark [45]. As part of prior challenges, all sequences were carefully collected and chosen for human detection and tracking. This benchmark focuses on scenarios with high pedestrian density, which can exceed 246 pedestrians per frame. In addition to indoor and outdoor locations, the sequences contain both day and night shots.
It contains videos of human-to-human encounters, including handshakes, pointing, hugging, pushing, and punching [46,47]. Time intervals and bounding boxes are provided for these interactions as ground truth labels. All twenty video sequences are roughly one minute in length for training, and there are three videos for testing. There is at least one execution per interaction in each video, resulting in an average of eight human activities in each movie. A person's height in the video is around 200 pixels. The videos are 720 * 480 at 30 frames per second. Videos are divided into two groups. A parking lot is the setting for the first two sets of videos. Backgrounds are generally static, and camera jitter is minimal in set 1. Set 2 (i.e., the last ten sequences) was shot on a breezy lawn. Backgrounds are shifting slightly (trees, for example), and there are greater camera jitters in these videos as a result.
4.3 Model Evaluation Indicators
Precision (P), also known as precision rate Eq. (3), is a measure used in this paper to show how well the model predicted the individuals. The number of actually detected people divided by the total of truly detected individuals and undetected people in each frame is known as the recall rate (R) in Eq. (4). The harmonic mean of precision and recall is denoted as the F1 score, which is calculated using Eq. (5). False positives (FP), true positives (TP), and false negatives (FN) are all used to calculate precision and recall as given below:
Furthermore, mAP (mean average precision) is computed using Eq. (6). In the detection model, GIoU quantifies the overlap between the bounding box of predicted and the real object's ground truth bounding box. Every value of the IoU threshold provides a different mAP. Therefore, this value must be specified. If IoU is compared to a specific threshold, the detection may be valid or wrong. To test individual detection model performance using a series of experiments, we test the performance of the trained system using GIoU thresholds of 0.5 and 0.5:0.95.
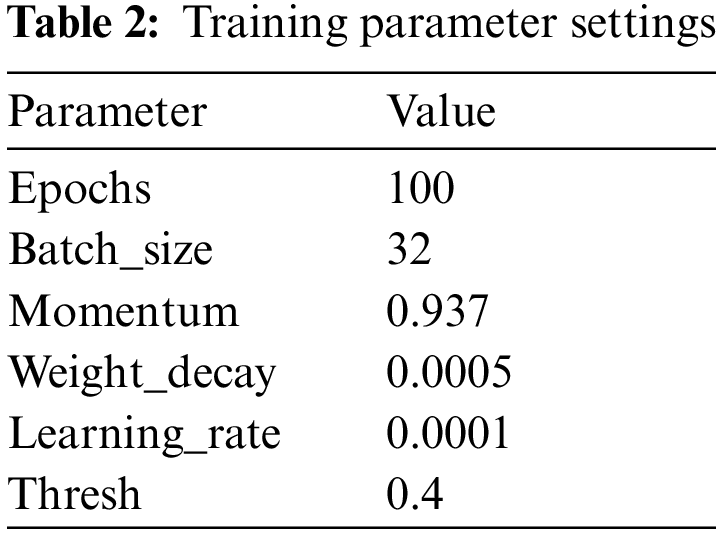
In this stage, learnable weights and biases are assigned to objects in preprocessing frames. Then, the YOLO algorithm is applied with initial parameters. For example, see Tab. 2.
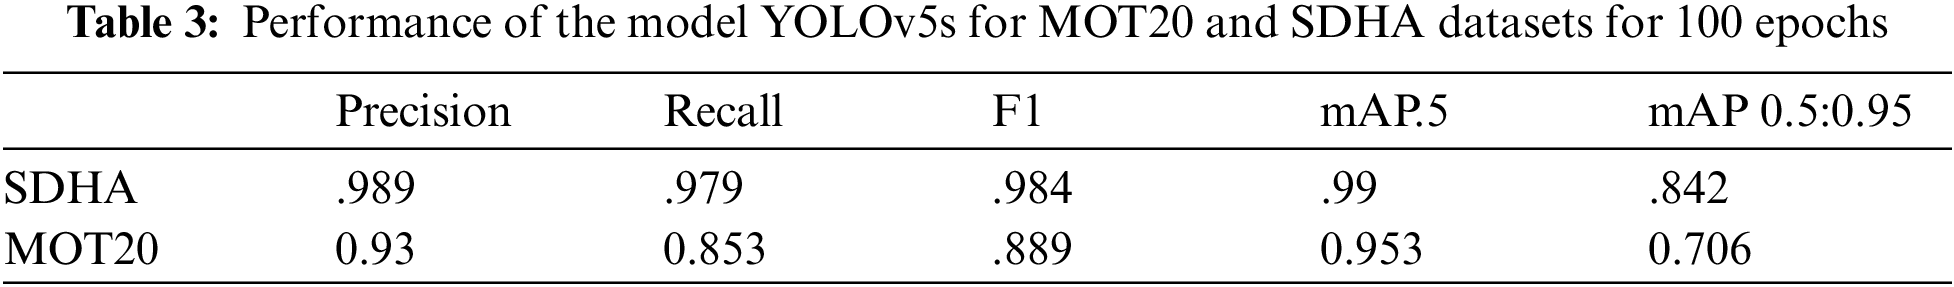
The trained model of object-detection is executed rapidly and makes it possible to utilize in real-time with a prediction in a fraction of a second. Tab. 3 shows the results of those metrics for MOT20 and SDHA datasets using YOLOv5s using 100 epochs. As a result of a different resolution, SDHA is executed with 640 image size, but MOT20 is 1280 image size.
4.4.3 SDHA Metrics Representation
Using the mAP is a good measure of the neural network's sensitivity in Fig. 5 to describe the research outcomes. At network size, the Precision-Recall Curve (PR-curve) in Fig. 6 is executed, and evaluations of it at the GIoU threshold extend from 0.5 to 0.95. We can observe that the model performed well overall, with network size 224 and GIoU threshold 0.5 having the highest mAP value of .99 percent.

Figure 5: The result of mean average precision at two thresholds, precision and recall for SDHA dataset
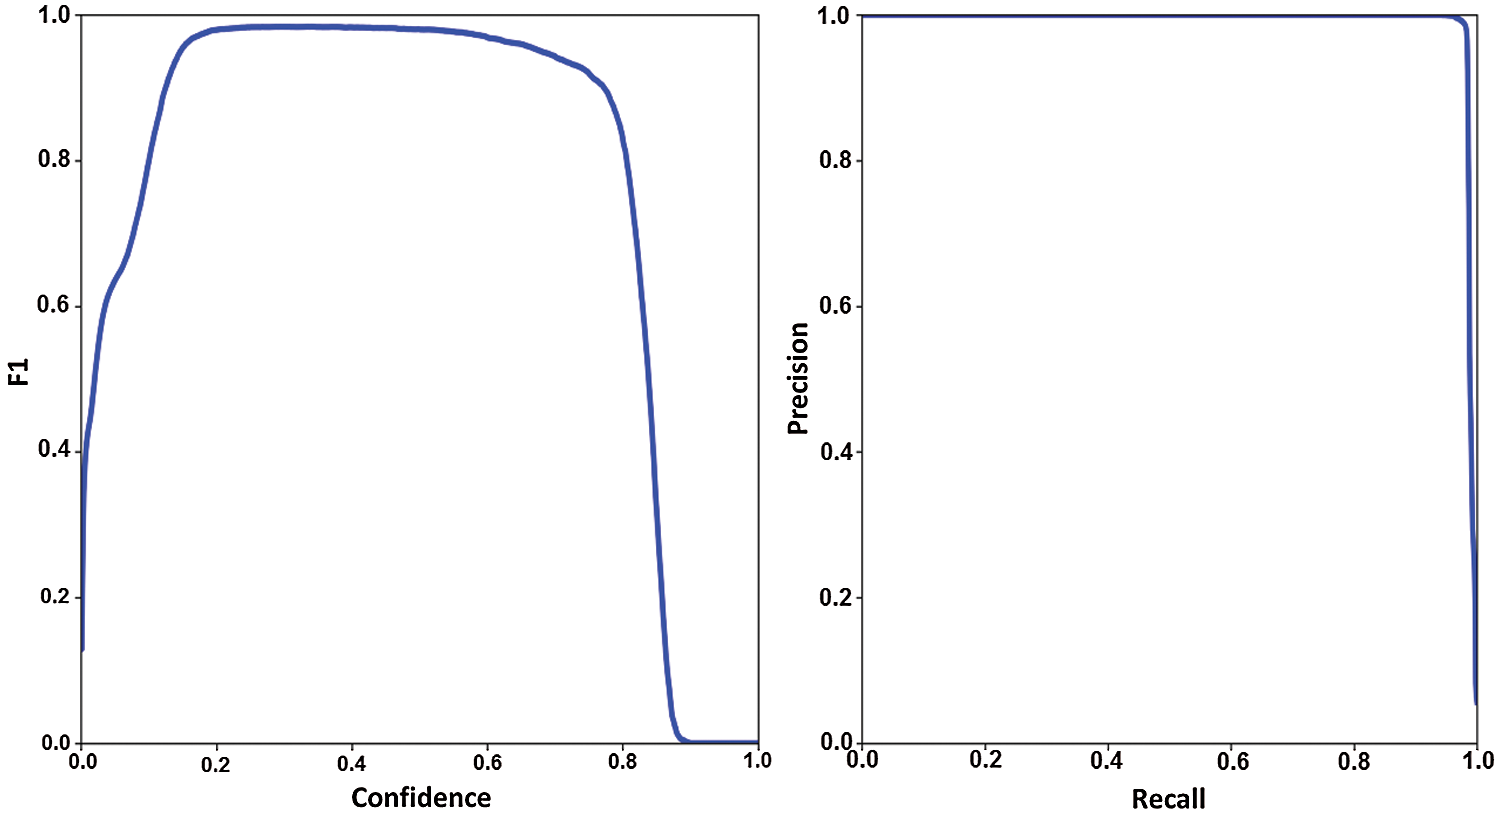
Figure 6: F1 score and PR curve of YOLOv5 for SDHA dataset
4.4.4 MOT20 Metrics Representation
The model performed mAP well overall at MOT20 in Fig. 7, with network size 283 and GIoU threshold 0.5 having the highest mAP value of 0.953 percent. At network size, the Precision-Recall Curve (PR-curve) in Fig. 8 is executed, and evaluations of it at the GIoU threshold extend from 0.5 to 0.95.

Figure 7: The result of mean average precision at two thresholds, precision and recall for MOT20 dataset
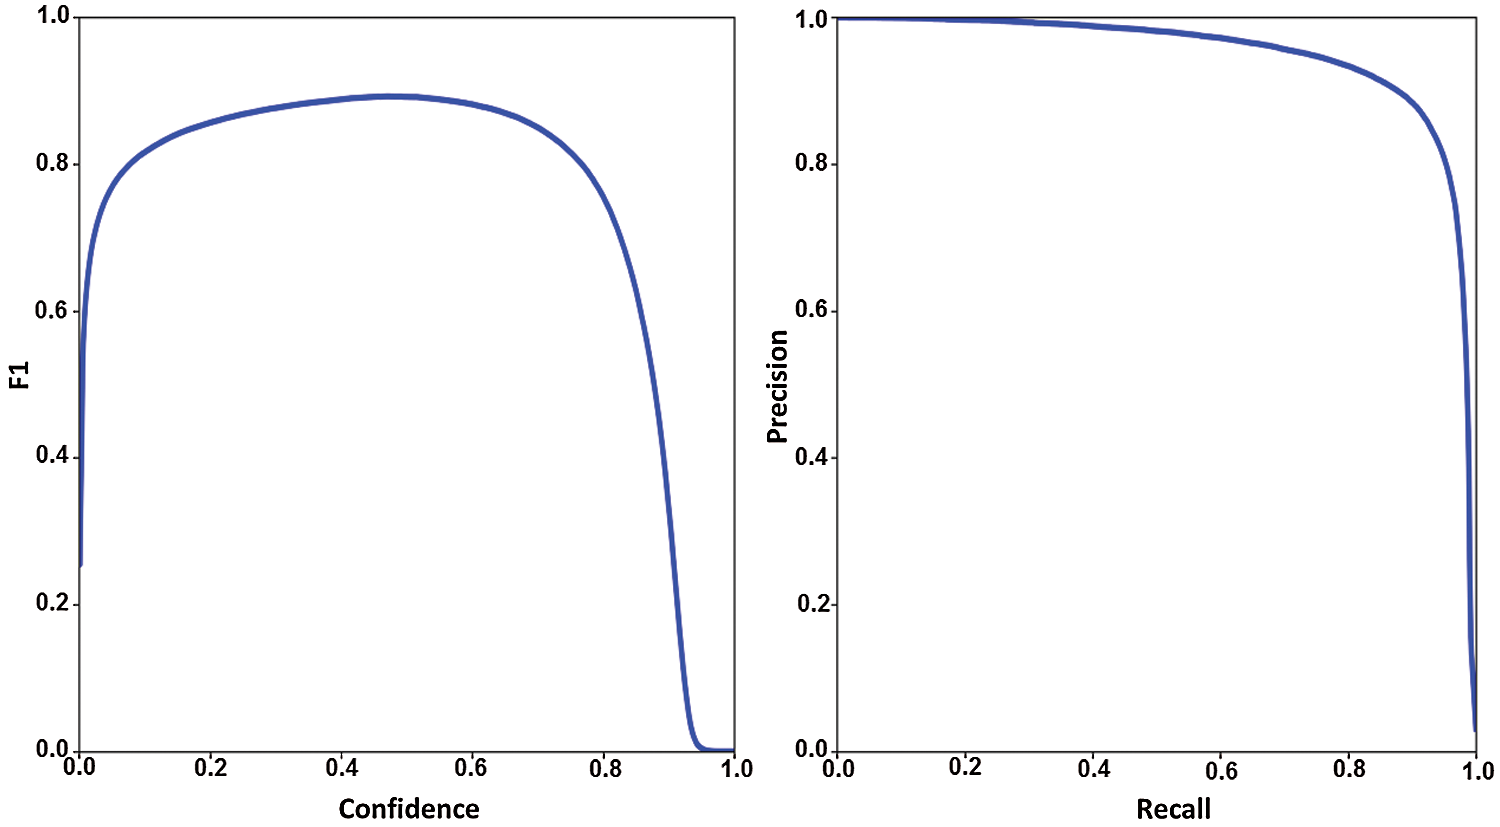
Figure 8: F1 score and PR curve of YOLOv5 for MOT20 dataset
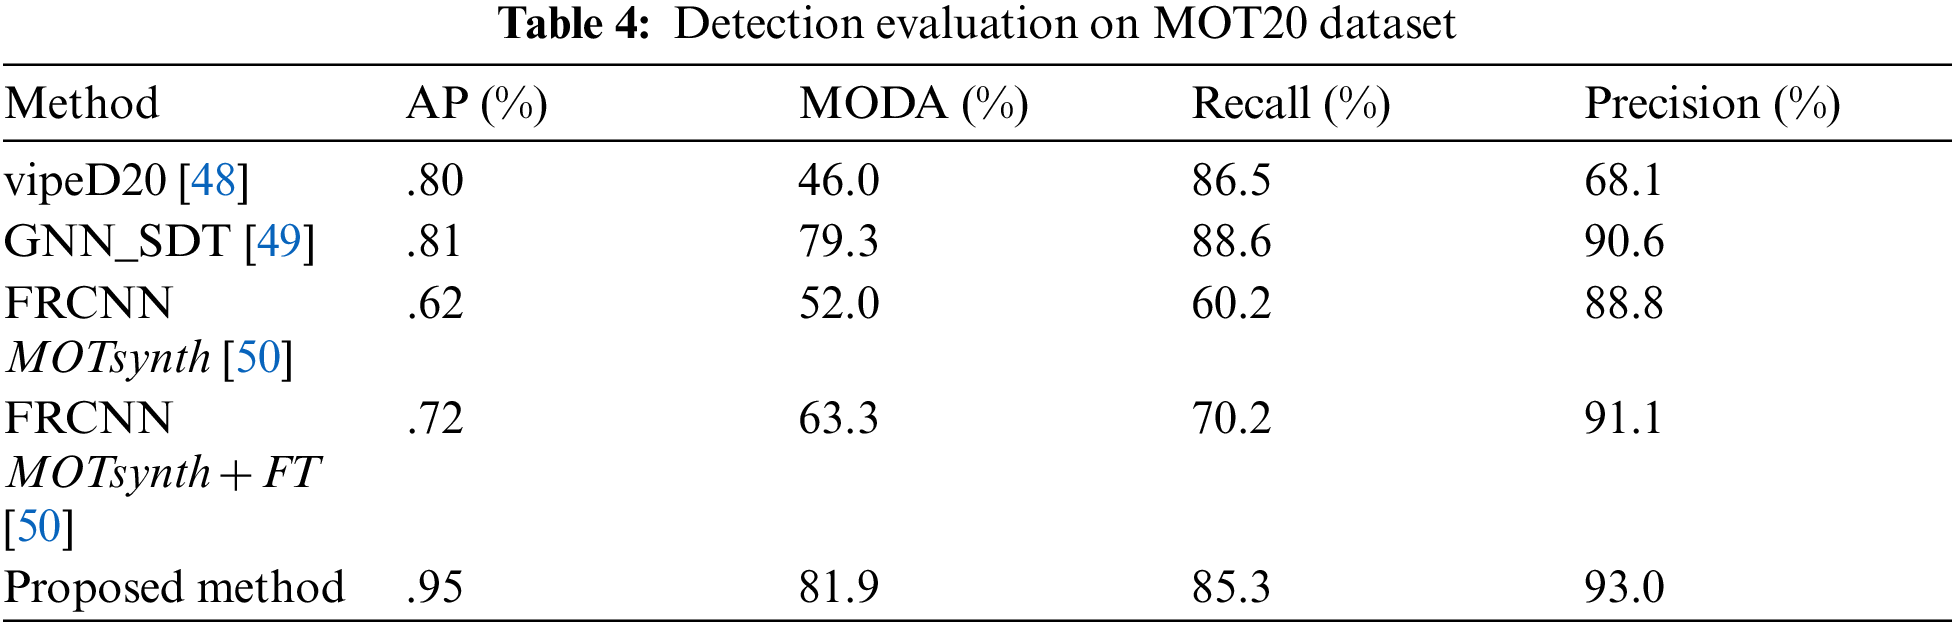
This model investigated the capability of deep learning to complete crowd analysis with detected bounding boxes. Although the utilized datasets have different densities and are unlabeled, the object detection algorithm worked well. After that, multiple human tracking and human activity recognition algorithms are utilized to improve YOLO to detect more individuals, especially in more crowded places. Finally, the proposed detection model utilizing MOT20 is more accurate than other algorithms listed in Tab. 4. We report the results on average accuracy (AP), multi-object detection accuracy (MODA), recall, and precision. We notice that the YOLOv5 detector specializes in pedestrian detection in crowded scenes, and it achieves high precision and is easily implemented. Another advantage is reducing the amount of computation due to one stage detector. We need to study the labeling technique for crowded places for further improvement since the amount of training data directly determines detection performance. Besides that, we need to add more activities to be estimated for more accuracy.
This paper presents a deep learning-based approach for object detection, multiple human tracking, and crowd classification using human activities in videos. YOLO technique for object detection was applied in 2 different datasets with different densities to ensure performance experimentally. Experimental results reveal that the YOLOv5 algorithm is superior through its speed, storage, and object detection accuracy. The bounding box from the previous phase was transferred in multiple human tracking and activity recognition stages. The Kalman filter algorithm is employed as a tracking algorithm. It was applied under many items such as activity changing and movement of objects, appearance changes, size changes, and slight changes in MOT20 and SDHA datasets. Besides, the presented system can efficiently recognize anomalous human activity from the crowd utilizing pose estimation, which significantly improves the system's accuracy and efficiency. Unusual Crowd Activity Detection can be used in various public places to provide early warning of crime and improve crowd management. In future research, we plan to study the inclusion of more abnormal activities. The ability to train deeper convolutional layers on additional datasets can also help the model perform better.
Funding Statement: The authors received no specific funding for this study.
Conflicts of Interest: The authors declare that they have no conflicts of interest to report regarding the present study.
1. E. Varghese and S. Thampi, “Towards the cognitive and psychological perspectives of crowd behaviour: A vision-based analysis,” Connection Science, vol. 33, no. 2, pp. 380–405, 2021. [Google Scholar]
2. K. Rezaee, S. Rezakhani, M. Khosravi and M. Moghimi, “A survey on deep learning-based real-time crowd anomaly detection for secure distributed video surveillance,” Personal and Ubiquitous Computing, vol. 10, pp. 1–17, 2021. [Google Scholar]
3. G. Tripathi, K. Singh and D. Vishwakarma, “Convolutional neural networks for crowd behaviour analysis: A survey,” The Visual Computer, vol. 35, no. 5, pp. 753–776, 2019. [Google Scholar]
4. D. Marčetić, L. Maleš and S. Ribarić, “Crowd motion pattern detection at the microscopic level,” in 2019 42nd Int. Convention on Information and Communication Technology, Electronics and Microelectronics (MIPRO), IEEE, pp. 1093–1098, 2019. [Google Scholar]
5. F. Rezaei and M. Yazdi, “Real-time crowd behavior recognition in surveillance videos based on deep learning methods,” Journal of Real-Time Image Processing, vol. 35, pp. 1–11, 2021. [Google Scholar]
6. M. Bendali-Braham, J. Weber, G. Forestier, L. Idoumghar and P. Muller, “Recent trends in crowd analysis: A review,” in Machine Learning with Applications, Elsevier, pp. 100023, 2021. [Google Scholar]
7. H. Ammar and A. Cherif, “DeepROD: A deep learning approach for real-time and online detection of a panic behavior in human crowds,” Machine Vision and Applications, vol. 32, no. 3, pp. 1–15, 2021. [Google Scholar]
8. A. Husein, D. Halim and R. Leo, “Motion detect application with frame difference method on a surveillance camera,” in Journal of Physics: Conference Series, vol. 1230, no. 1, pp. 12017, 2019. [Google Scholar]
9. W. Liu, K. Lis, M. Salzmann and P. Fua, “Geometric and physical constraints for drone-based head plane crowd density estimation,” in International Conference on Intelligent Robots and Systems (IROS), IEEE, pp. 244–249, 2019. [Google Scholar]
10. S. Shinde, A. Kothari and V. Gupta, “YOLO based human action recognition and localization,” Procedia Computer Science, vol. 133, pp. 831–838, 2018. [Google Scholar]
11. Q. Mao, H. Sun, Y. Liu and R. Jia, “Mini-YOLOv3: Real-time object detector for embedded applications,” IEEE Access, vol. 7, pp. 133529–133538, 2019. [Google Scholar]
12. F. Abdullah, Y. Ghadi, M. Gochoo, A. Jalal and K. Kim, “Multi-person tracking and crowd behavior detection via particles gradient motion descriptor and improved entropy classifier,” Entropy, vol. 23, no. 5, pp. 628, 2021. [Google Scholar]
13. V. Gong, W. Daamen, A. Bozzon and S. Hoogendoorn, “Counting people in the crowd using social media images for crowd management in city events,” Transportation (Amst), vol. 48, pp. 1–35, 2021. [Google Scholar]
14. C. Direkoglu, M. Sah and N. O'Connor, “Abnormal crowd behavior detection using novel optical flow-based features,” in IEEE on Advanced Video and Signal Based Surveillance (AVSS), pp. 1–6, 2017. [Google Scholar]
15. X. Zheng, M. Wang and J. Ordieres-Meré, “Comparison of data preprocessing approaches for applying deep learning to human activity recognition in the context of industry 4.0,” Sensors, vol. 18, no. 7, pp. 2146, 2018. [Google Scholar]
16. Z. Yan, Y. Yuan, W. Zuo, X. Tan, Y. Wang et al., “Perspective-guided convolution networks for crowd counting,” in IEEE/CVF International Conference on Computer Vision, pp. 952–961, 2019. [Google Scholar]
17. P. Asghari, E. Soleimani and E. Nazerfard, “Online human activity recognition employing hierarchical hidden markov models,” Journal of Ambient Intelligence and Humanized Computing, vol. 11, no. 3, pp. 1141–1152, 2020. [Google Scholar]
18. G. Castanon, N. Shnidman, T. Anderson and J. Byrne, “Out the window: A crowd-sourced dataset for activity classification in security video,” arXiv preprint arXiv1908.10899, 2019. [Google Scholar]
19. S. Vahora and N. Chauhan, “Deep neural network model for group activity recognition using contextual relationship,” Engineering Science and Technology, an International Journal, vol. 22, no. 1, pp. 47–54, 2019. [Google Scholar]
20. T. Chauhan and M. Patel, “Histogram of gradient (HOG) based crowd activity analysis using machine learning,” Mukt Shabd Journal, vol. 9, no. 4342, pp. 2347–3150, 2020. [Google Scholar]
21. J. Guo, Y. Li, M. Hou, S. Han and J. Ren, “Recognition of daily activities of two residents in a smart home based on time clustering,” Sensors, vol. 20, no. 5, pp. 1457, 2020. [Google Scholar]
22. H. Chen, C. Chang, C. Shang, G. Chen and S. Zhao, “Activity recognition approach based on spatial-temporal constraints for aged-care in smart home,” International Journal of Ad Hoc and Ubiquitous Computing, vol. 33, no. 3, pp. 168–183, 2020. [Google Scholar]
23. Y. Amit, P. Felzenszwalb and R. Girshick, “Object detection,” in IEEE on 7th International Conference on Control, Automation and Robotics (ICCAR), pp. 1–9, 2020. [Google Scholar]
24. M. Tan, R. Pang and Q. Le, “Efficientdet: Scalable and efficient object detection,” in IEEE/CVF International Conference on Computer Vision, pp. 10781–10790, 2020. [Google Scholar]
25. D. Thuan, “Evolution of yolo algorithm and yolov5: The state-of-the-art object detection algorithm,” 2021. [Google Scholar]
26. S. Jiao, T. Miao and H. Guo, “Image target detection method using the yolov5 algorithm,” in 3D Imaging Technologies—Multidimensional Signal Processing and Deep Learning, Springer Oulu University of Applied Sciences, pp. 323–329, 2021. [Google Scholar]
27. C. Wang, H. Liao, I. Yeh, Y. Wu, P. Chen et al., “CSPNet: A new backbone that can enhance learning capability of CNN,” in Proceedings of the IEEE/CVF Conference on Computer Vision and Pattern Recognition Workshops, pp. 390–391, 2020. [Google Scholar]
28. S. Liu, L. Qi, H. Qin, J. Shi and J. Jia, “Path aggregation network for instance segmentation,” in Proceedings of the IEEE Conference on Computer Vision and Pattern Recognition, pp. 8759–8768, 2018. [Google Scholar]
29. Z. Huang, J. Wang, X. Fu, T. Yu, Y. Guo et al., “DC-SPP-YOLO: Dense connection and spatial pyramid pooling based YOLO for object detection,” Information Sciences, vol. 522, pp. 241–258, 2020. [Google Scholar]
30. J. Redmon and A. Farhadi, “Yolov3: An incremental improvement,” arXiv preprint arXiv1804.02767, 2018. [Google Scholar]
31. H. Gao and H. Huang, “Faster stochastic second order method for large-scale machine learning models,” in Proceedings of the 2021 SIAM International Conference on Data Mining (SDM), pp. 405–413, 2021. [Google Scholar]
32. N. Landro, I. Gallo and R. La Grassa, “Combining optimization methods using an adaptive meta optimizer,” Algorithms, vol. 14, no. 6, pp. 186, 2021. [Google Scholar]
33. X. Zuo, J. Li, J. Huang, F. Yang, T. Qiu et al., “Pedestrian detection based on one-stage YOLO algorithm,” in Journal of Physics: Conference Series, vol. 1871, no. 1, pp. 12131, 2021. [Google Scholar]
34. Q. Wang, J. Gao, W. Lin and Y. Yuan, “Learning from synthetic data for crowd counting in the wild,” in Proceedings of the IEEE/CVF Conference on Computer Vision and Pattern Recognition, pp. 8198–8207, 2019. [Google Scholar]
35. J. Zhang, S. Chen, S. Tian, W. Gong, G. Cai et al., “A crowd counting framework combining with crowd location,” Journal of Advanced Transportation, vol. 21, no. 1, pp. 14, 2021. [Google Scholar]
36. S. Jeevith and S. Lakshmikanth, “Detection and tracking of moving object using modified background subtraction and kalman filter,” International Journal of Electrical and Computer Engineering, vol. 11, no. 1, pp. 217, 2021. [Google Scholar]
37. M. Rezaei and M. Azarmi, “Deepsocial: Social distancing monitoring and infection risk assessment in COVID-19 pandemic,” Applied Sciences, vol. 10, no. 21, pp. 7514, 2020. [Google Scholar]
38. X. Jin, R. RobertJeremiah, T. Su, Y. Bai and J. Kong, “The new trend of state estimation: From model-driven to hybrid-driven methods,” Sensors, vol. 21, no. 6, pp. 2085, 2021. [Google Scholar]
39. I. Greenberg, N. Yannay and S. Mannor, “Noise estimation is not optimal: How to use kalman filter the right way,” arXiv preprint arXiv2104.02372, 2021. [Google Scholar]
40. F. Bouhlel, H. Mliki and M. Hammami, “Crowd behavior analysis based on convolutional neural network: Social distancing control COVID-19,” in VISIGRAPP, pp. 273–280, 2021. [Google Scholar]
41. M. Kulkarni, R. Deedwania, P. Mudgal and A. Bhope, “Managing crowd density and social distancing,” International Journal of Engineering Research and Technology, vol. 10, pp. 2278–0181, 2021. [Google Scholar]
42. B. Xiao, H. Wu and Y. Wei, “Simple baselines for human pose estimation and tracking,” in Proceedings of the European Conference on Computer Vision (ECCV), pp. 466–481, 2018. [Google Scholar]
43. C. Zheng, W. Wu, T. Yang, S. Zhu, C. Chen et al., “Deep learning-based human pose estimation: A survey,” arXiv Preprint arXiv2012.13392, 2020. [Google Scholar]
44. R. Rodrigues, N. Bhargava, R. Velmurugan and S. Chaudhuri, “Multi-timescale trajectory prediction for abnormal human activity detection,” in Proceedings of the IEEE/CVF Winter Conference on Applications of Computer Vision, pp. 2626–2634, 2020. [Google Scholar]
45. P. Dendorfer, H. Rezatofighi, A. Milan, J. Shi, D. Cremers et al., “Mot20: A benchmark for multi object tracking in crowded scenes,” arXiv Preprint arXiv2003.09003, 2020. [Google Scholar]
46. M. Ryoo and J. Aggarwal, “UT-Interaction dataset, ICPR contest on semantic description of human activities (SDHA)(2010),” [Online]. Available: https://cvrc.ece.utexas.edu/SDHA2010/Human_Interaction.html, 2015. [Google Scholar]
47. M. Ryoo and J. Aggarwal, “UT-Interaction dataset, ICPR contest on semantic description of human activities (SDHA),” in IEEE International Conference on Pattern Recognition Workshops, vol. 2, pp. 4, 2010. [Google Scholar]
48. L. Ciampi, N. Messina, F. Falchi, C. Gennaro and G. Amato, “Virtual to real adaptation of pedestrian detectors,” Sensors, vol. 20, no. 18, pp. 5250, 2020. [Google Scholar]
49. Y. Wang, K. Kitani and X. Weng, “Joint object detection and multi-object tracking with graph neural networks,” arXiv Preprint arXiv2006.13164, 2020. [Google Scholar]
50. M. Fabbri, G. Braso, G. Maugeri, O. Cetintas, R. Gasparini et al., “MOTSynth: How can synthetic data help pedestrian detection and tracking?,” arXiv Preprint arXiv2108.09518, 2021. [Google Scholar]
 | This work is licensed under a Creative Commons Attribution 4.0 International License, which permits unrestricted use, distribution, and reproduction in any medium, provided the original work is properly cited. |