DOI:10.32604/cmc.2022.020118
| Computers, Materials & Continua DOI:10.32604/cmc.2022.020118 | |
| Article |
Melanoma Identification Through X-ray Modality Using Inception-v3 Based Convolutional Neural Network
College of Computer and Information Sciences, Jouf University, Sakaka, Aljouf, 72341, Saudi Arabia
*Corresponding Author: Saad Awadh Alanazi. Email: sanazi@ju.edu.sa
Received: 10 May 2021; Accepted: 18 June 2021
Abstract: Melanoma, also called malignant melanoma, is a form of skin cancer triggered by an abnormal proliferation of the pigment-producing cells, which give the skin its color. Melanoma is one of the skin diseases, which is exceptionally and globally dangerous, Skin lesions are considered to be a serious disease. Dermoscopy-based early recognition and detection procedure is fundamental for melanoma treatment. Early detection of melanoma using dermoscopy images improves survival rates significantly. At the same time, well-experienced dermatologists dominate the precision of diagnosis. However, precise melanoma recognition is incredibly hard due to several factors: low contrast between lesions and surrounding skin, visual similarity between melanoma and non-melanoma lesions, and so on. Thus, reliable automatic detection of skin tumors is critical for pathologists’ effectiveness and precision. To take care of this issue, numerous research centers around the world are creating autonomous image processing-oriented frameworks. We suggested deep learning methods in this article to address significant tasks that have emerged in the field of skin lesion image processing: we provided a Convolutional Neural Network (CNN) based framework using an Inception-v3 (INCP-v3) melanoma detection scheme and accomplished very high precision (98.96%) against melanoma detection. The classification framework of CNN is created utilizing TensorFlow and Keras in the backend (in Python). It likewise utilizes Transfer-Learning (TL) approach. It is prepared on the data gathered from the “International Skin Imaging Collaboration (ISIC)” repositories. The experiments show that the suggested technique outperforms state-of-the-art methods in terms of predictive performance.
Keywords: Deep learning; chronic obstructive pulmonary disease; chronic bronchitis; convolutional neural network; X-ray images
Extensive skin malignant growth contrasted with other types of tumors is a predominant factor in making it quite possibly the most severe medical problem worldwide. By looking back at history, melanoma is an uncommon malignant growth, yet in the previous fifty years, the overall cases of melanoma are drastically increasing. The financial load of Melanoma cure is likewise costly. In the USA, (the entire skin cancer's curing costs) $3.3 Billion, out of $8.1 Billion, are spent distinctly on melanoma. Basal cell carcinoma and squamous cell carcinoma are famously reparable whenever analyzed and cured in the beginning phases. The 5-year patient survival rate with beginning phase analysis of melanoma is roughly ninety-nine percent [1].
Human skin is the biggest organ in our body that gives assurance against injury, infections, light, and heat. Additionally, it stores nutrients, fat, and water. The deadliest kind of cancer is melanoma, as it spreads everywhere on our body (in case the proper diagnosis and treatment are not found in the beginning phase). Three sorts of skin tumors exist, in particular melanoma, squamous cell carcinoma, and basal cell carcinoma. Among all skin malignancies, melanoma is the most dangerous type. The instances of melanoma skin disease are expanding very fast.
The earliest identification of melanoma skin malignant growth should be treated in the beginning phase for the patient to acquire high recovery chances. On the skin, it appears as marks and moles. There are two distinct layers per the skin structure: the inward layer (i.e., dermis) and the external most layer (i.e., epidermis). Melanocytes are present in epidermis (i.e., the lower part). It comprises pigmented cell which is found in the epidermis and generates melanin. Skin is provided color through this pigment. When we have sun exposure, more pigments are produced in the skin (because of Melanocytes). Thus, the skin becomes darkened in color (due to melanocytes), which results in melanoma [2].
The melanoma (ME) oriented risks comprise excessive ultra-violet ray exposure, susceptibility to low immunity systems, previous genetic history, burning in the sun, and fair skin tone. In case ME is not identified in its beginning phases, it may develop and spread along the epidermis (i.e., skin's primary layer). Finally, it interacts with blood and Lymph vessel.
The essential parameters against the ME detection are size, color, and shape, which are significant characteristics of detecting skin malignancy, and they show up as moles (diameter more than six millimeters, changed color, random shape, and borders). The different non-intrusive procedures are provided in such a manner to perform the classification of malignant growth and isolated as melanoma or benign. Along these lines, the vital factor in decreasing the death rate is the earliest recognition of skin malignant growth [3–5].
The practices of dermatologists have been enhanced nowadays using Artificial Intelligence (AIN), Machine Learning (ML), and Deep Learning (DL) in distinct ways (i.e., treatment, diagnoses, detection, etc.) [6–8]. Later progressions in admittance to enormous datasets, quicker processing, and less expensive data storing capacity have energized ML approaches in the dermatological domain. It has been commonly utilized five distinct perspectives in dermatology, as explained below. (i) medical images-based illness characterization; (ii) dermatopathology images-oriented illness characterization; (iii) utilizing individual observing gadgets or mobile apps for the evaluation of skin illnesses; (iv) encouraging wide-scope epidemiological research and (v)best accuracy acquisition in disease classification and detection [9]. Accordingly, this research is deliberated to provide image processing, ML, and more specifically, DL-oriented ME detection.
Despite a high mortality rate, melanoma that is detected early is usually curable. Meanwhile, even seasoned dermatologists find it challenging to distinguish between melanoma and other benign moles during their initial development stages. This is being accomplished through the development of computerized algorithms. Certain low-complexity methods are designed for use on tablets and smartphones and can assist non-specialists. On the other hand, automated and professional decision-making necessitates sophisticated, intelligent algorithms and equipment in this area with improved accuracy and precision.
The objective of this research is to use deep learning to develop an autonomous melanoma detection mechanism. The input digital images are preprocessed to accomplish this, which are typically subjected to noise and illumination repercussions. This preprocessing efficiently aids in the extraction of discriminative features from images by the Inception-v3-based CNN. Following that, the images are fed into a CNN architecture, classifying the input as benign or malignant.
The remainder of this manuscript is ordered as below. Section 2 explains the literature on melanoma detection. Section 3 elucidates the methodology of this research. Section 4 provides the experiments and results. Section 5 gives the research relevant discussions. Lastly, the manuscript is concluded in Section 6.
The exploration of image processing-based melanoma detection has progressed considerably throughout the long term. Till now, various procedures have been attempted.
The research presented a strategy that applies six distinctive detection procedures (based on data mining) and afterward builds up a hybrid scheme utilizing Gradient Boosting classifier, AdaBoost, and Bagging procedures to anticipate the skin disease classification. Moreover, strategy is used to choose the most striking fifteen parameters (most significant in skin disease classification) [10].
The author presents a model-driven design in the cloud environment by utilizing the Deep-Learning Scheme (DLS) in its center usage. It was utilized to build models that help foresee skin cancers (for achieving an efficient precision rate). This manuscript was intended to construct a robust scheme and apply them to the classification of dermal cells. The DLS worked here is tried on standard-dataset for skin-cancer detection and dermal-cell classification [11].
For better performance, efficiency, and accuracy, autonomous recognition of skin injury is performed in [12]. For skin lesions (SL) early identification, the proposed calculation applies to include extraction utilizing Asymmetry Borders-Colors-Dermatoscopic Structures (ABCD) rule, HOG (for the extraction of features), GLCM, and ABCD-rule. Preprocessing is applied to enhance the quality of SL. Utilizing the SVM classifier, the Area under Curve obtained is 0.94%, and 97.8% of the precision rate is achieved.
For melanoma classification, a hybrid approach is utilized by the author [13]. It was helpful against the inspection of any dubious suspicious lesion (SL). Their proposed framework depended on the classification through three diverse phases: two classical AI schemes and CNN prepared with an extensive feature-set, depicting the SL's color, texture, and borders. Using the voting approach, these strategies are then consolidated toward performance improvement.
Through the manuscript [14], the author proposed 2 DLs to address the three issues, i.e., feature-extraction (dermoscopic), segmentation, detection of SL. A DLS comprising of 2 fully convolutional residuals-networks is utilized for segmentation and generating the classification results.
Through the manuscript [15], the author presented an autonomous model of skin cancer detection, using the images of SL, rather than regular clinical staff-based identification, but through the intervention of Artificial Intelligence and Machine Learning (ML). This research is planned into three stages, i.e., collecting the data, performing the data augmentation, framework construction, and classification. Using image processing, the author utilized different ML approaches like Support Vector Machine & CNN to frame a superior design, prompting an 85% precision rate.
The framework presented by [16] vigorously depends on the data-generation unit and processing unit for occlusion removal (images). It based on the generative-adversarial network for the classification of SL. The author observationally verified their methodology and showed that joining the two units mentioned above for melanoma classification. Over fundamental baselines, superior results were acquired.
For the classification and detection of SL (more specifically ME), the manuscript [17] provided a “Computer-Aided Detection” (CADN) framework (utilizing Mutual Information estimations) through a combination of CNN and handcraft highlights related to the clinical scheme (i.e., ABCD-rule).
Due to the high ME-oriented mortality rate, it is required to provide an approach to detect SL (to save a large number of lives). CNN is a class of DLS, a fundamentally more specialized form of multi-layer-perceptron. Through the research [18], the author intended to build up a deep learning-oriented CNN framework (against the ME detection) for the early detection of SL. For speedy processing, the model was also equipped with Transfer Learning approaches.
In the manuscript [19], the author provided a “faster, region-oriented CNN” (FRCNN) using the pigmented SL images for both training and testing purposes. Moreover, the same testing was performed using ten dermatologic learners (TDLs), ten board-affirmed dermatologists (BADs), and the precision rate was contrasted with FRCNN. The experiments observed that the arrangement precision rate of dermatologist-oriented solutions was less than FRCNN.
From the above studies, it can be concluded that numerous studies exist against skin cancer detection using different approaches of image processing. Distinct models are created and tried with diverse organization designs by fluctuating the layer's count utilized for ME detection, yet not restricted to Dense-layers, Pooling layers, Dropout-layers, or Convolutional layers (Convl). In the literature, a comprehensive discussion is provided on this research, and various other challenges still exist in this domain [20].
This section provides a comprehensive description of the proposed work that we use for ME Classification.
The primary image processing depended on the use filters, for example, to get the horizontal and vertical edges of an item in a picture utilizing the blend of filters. The filter-oriented processing is given in Fig. 1. In the mathematical expression, we can define Horizontal Edge Filter (HEFL) as provided in Eq. (1). In this equation, VEFL refers to Vertical Edge Filter.
The 6 × 6 grayscale images of melanoma are considered (for simplicity). We used a 2-Dimensional matrix. Here each element's value addresses the measure of light in the respective pixels. A convolutional product is used for the extraction of horizontal edges of the image. In other words, for each block, it is the summation of each element's product.
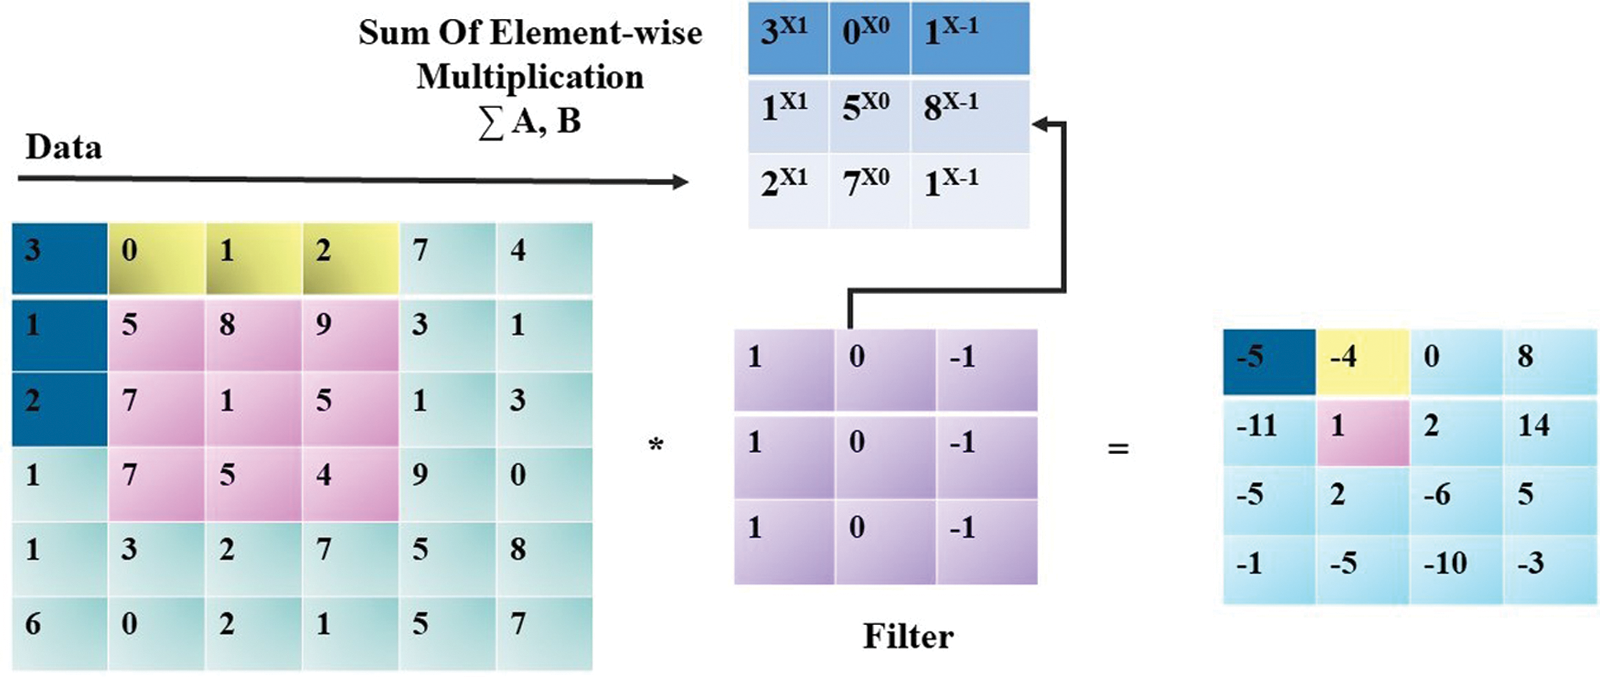
Figure 1: Processing through filters
For the 1st 3 × 3 image's block, the product of each element is performed, later the right block is considered, and this is repeated until all the blocks have been covered. This process can be summarized as given below in Fig. 2:
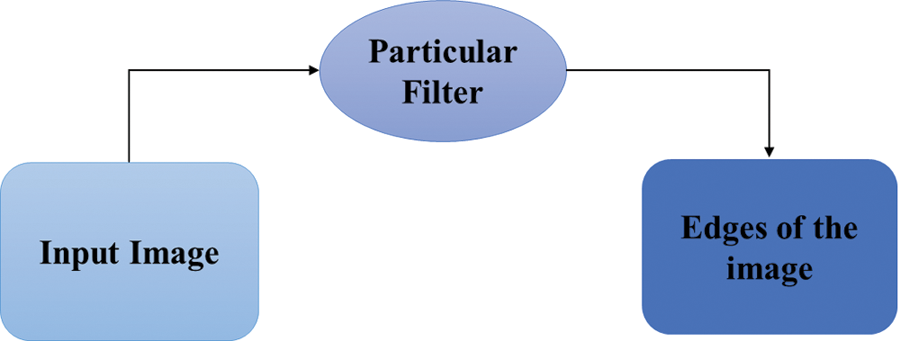
Figure 2: Edge detection
Through this view, the way of using a neural network can be perceived, a filter can be learned (see Fig. 3).
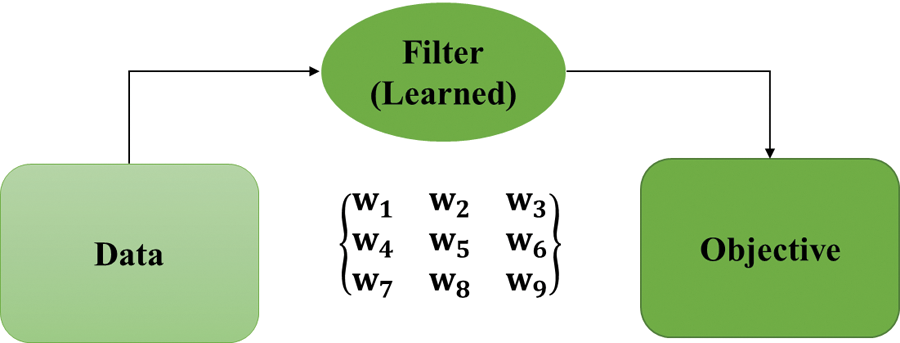
Figure 3: Use of learned filter
The principal instinct is to set a neural organization where the images of ME input is passed and yields a characterized target (i.e., state that can be either functional or non-functional). The learning of parameters is based on backpropagation.
In CNN, the author used a sequence of pooling and convolutional layers that permit separating the image's principle highlights (best suited to state classification). In the accompanying parts, every constituent alongside its mathematics would be explained. The following section discusses the Convolutional Product (CPT), Padding (PD), Stride (ST), Convolution (CN), and Pooling (PLN). Instead of unequivocally characterizing the CPT, I will initially characterize few fundamental processes like ST and PD. Here we will first explain the procedure of PD.
From the CPT, it can be observed that utilizing the VEFL, the image's middle pixels are heavily utilized as compared to the corner pixels. It implies that the edge's data is discarded. To tackle this issue, PD is commonly added around the picture to consider the edge's pixels. Conventionally, zero-based padding is done and signified with pd (i.e., a parameter for padding) through which on the four sides of the image, several elements are represented. The image (2D & grayscale) padding procedure is shown below (see Fig. 4), here pd = 1:

Figure 4: Padding procedure
In CPT, as a sub-process, ST is carried out. The result's size shrinking is done through a vast ST and the other way around. Here st represents the parameter of stride. The CPT is shown by Fig. 5 (per block, summation of element-wise components) here st = 1:

Figure 5: Stride process
The CPT is defined between a filter and a tensor, but first, it is required to characterize the PD and ST. When we characterized the CPT on a 2D framework (that is, summation of ‘element wised products’), next, the CPT (on a volume) is officially defined. Generally, the image can numerically to be addressed in the form of a tensor using the accompanying measurements. The dimension (DIMN) of an image (img) can be described as below (see Eq. (2)):
For example, in a colored image, we have, Blue, Green, and Red colors (here
The CPT between the filter and the image is a 2D matrix. Here every component is the sub-cube of the picture and summation of the filter's element-wise product as outlined in Fig. 6. In mathematics, the filter and image can be used as below (see Eq. (4)).

Figure 6: Convolution procedure
Here,
(1) In 1 × 1 convolution, where we considered fl = 1, this can be valuable to lessen the
(2) In the same convolution, the input size is equal to the size of the output
(3) In valid convolution the pd = 0.
In PLN, through sum up the data, we down-sampled the features of the image. Using the channel, this procedure is done. It keeps the
Conventionally, a filter with squared shape and fl size is considered. We took st = 2 and fl = 2. We used average pooling here, which is depicted below in Fig. 7.

Figure 7: Pooling scheme
For the development of CNN, we combined the steps mentioned above layer by layer. This section describes it. A single layer in CNN can be fully connected (FCL), i.e., identical to the layer in Feed-Forward Neural Network, pooling layer (PLL), and Convolutional Layer (Convl) using some Activation Function (AFN).
In Convl, we applied CPT, many filters are applied here, and input is gone along with AFN
1. Input image of melanoma:
2. PD is denoted as
3. ST is denoted as
4. Quantity of fl:
5. For nth convolution, the bias is denoted as
6. AFN is denoted as
7. Result:
Next, we can define this as
Consequently,
Here,
8. Here, the quantity of filters is represented by
9. For the lth layer, the parameters that are learned are given below:
10. fls have parameters, i.e., (
11. For Broadcasting, bias has parameters, i.e., (1 X 1 X 1) X
The following section describes the PLN layer. Without any influence on the number of channels, the input features are downsampled using the PLN layer. In this procedure, the following notations are considered.
12. Input image of melanoma:
13. PD is denoted as
14. ST is denoted as
15. Pooling fl size:
16. PLN function is denoted as
17. Result:
It can be narrated as:
Here,
When
There are no parameters to learn by PLN layer. The following section describes the FLC. A finite number of neurons are present in FLC. A vector is passed as input, and as a result, it also generates a vector. Generally, by considering the nth node of the mth layer, the following equation can be derived.
The result of the pooling or convolution layer is the input
For the lth layer, the learned parameters would be:
•
•
Following is the pictorial illustration of FCL (see Fig. 8).

Figure 8: Fully connected layers
All the above-explained procedures are summed up and presented below (see Fig. 9). When we applied a sequence of Convl (using AFNs), the next PLN is applied, and this process is repeated several times. Using this procedure, feature extraction of melanoma is done. Next, the extracted features are transmitted to a neural network, i.e., FCL, using the AFNs alongside. While moving deeper into the network, it was desired to reduce

Figure 9: The schematic view of CNN(a)

Figure 10: The overall view of CNN(b)
The INCP-v3 is a generally acclaimed image-processing framework, which different analysts have constructed after some time. Initially dependent on the article by Szegedy, i.e., “Reevaluating the Commencement Architecture for Computer Vision”. The model has accomplished a precision rate of higher than 98 percent (using preprocessing filters) on the dataset of ImageNet.
Before the application of INCP-v3, as preprocessing phase, image filtering is applied. It is essential to detect the ME edge, eliminate the noise, sharpen, and smooth the ME input images. A comparison of different standard imaging filters is provided to analyze their performance in Fig. 11. Here, the outperforming results of the Gaussian filter are obtained, and we utilized this filter for preprocessing of ME images. Here, the x-axis shows the size of the filter, and Y-axis shows the BRISQUE value (which represents the quality of the image after applying that specific filter).

Figure 11: Comparative results of distinct imaging filters
The pictorial representation of INCP-v3 is given in below Fig. 12. The Google proposed INCP-v3 is the 3rd version of the CNN series. It is prepared on thousand classes from the dataset of Image-Net that is itself prepared on images (i.e., around one million).
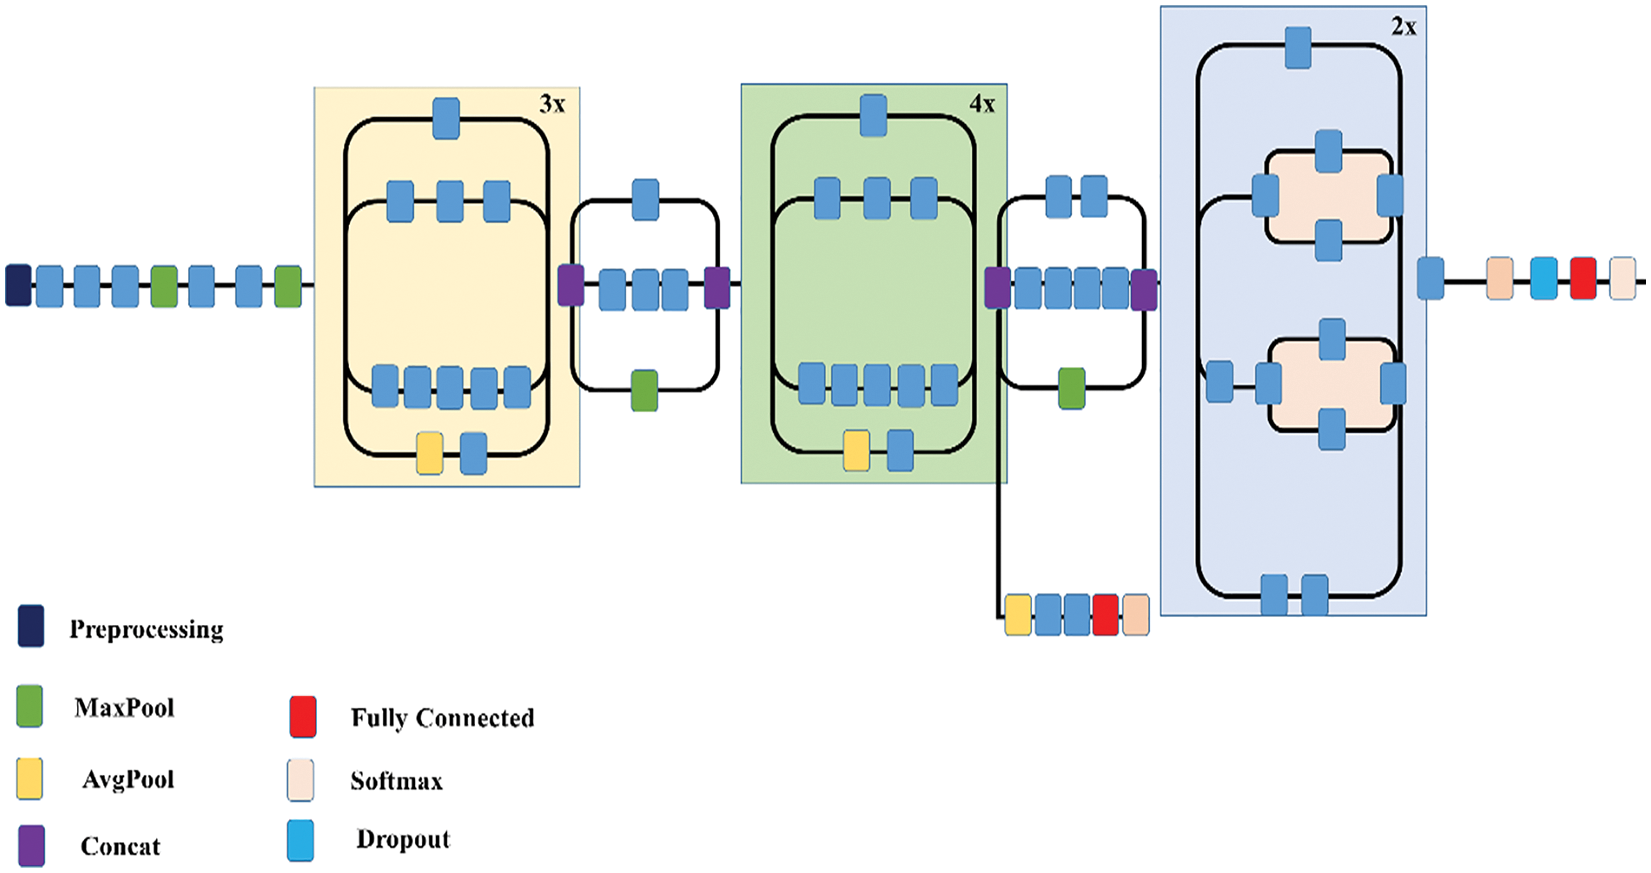
Figure 12: Overview of INCP-v3
The inception modules (IM) are comprised by it, which applies the multi-size filters on the inputs of a similar level. The computation cost engaged with the IM is addressed by applying 1 × 1 convolution for input truncation to a more modest middle-sized bock known as the bottle-neck layer (BTNKL). On the BTNKL, to altogether diminish the computational cost, various filters are applied. For regularization, the assistant classifiers in the INCP-v3 perform a contribution in the function for weight loss. For the INCP-v3, to use the pre-trained weight of ImageNet, the size of images needs to be 299 × 299.

Fig. 13 shows the overall flow of the proposed work.

Figure 13: The flow of proposed work
The dataset we utilized for this research is acquired from the “International Skin Imaging Collaboration (ISIC)” repository. We used the data augmentation approach to increase the number of melanoma images. The following mentioned techniques are used for data augmentation:
• Transformation of color space
• Noise-Injection
• Flipping
• Rotation
• Cropping
Due to extensive training data, a better learning rate is achieved. When the data got prepared, three parts are generated from it. 1) Training dataset is used for batch construction and model training. 2) Dev dataset is used to evaluate variance, bias, and for the model fine-tuning. 3) Test dataset is used for the generalization of precision/error of the trained model.
A set of labeled images of melanoma is used for the training of CNN. When the input images are provided, they are propagated to other distinct layers of CNN, which resulted in the classification of the melanoma state.
For melanoma case classification, just a single metric (i.e., accuracy) will not analyze the model's total effectiveness. Thus Support, F1 Score, Recall, and Accuracy for melanoma classification are carried out. The confusion matrix (CM) is additionally plotted to analyze the performance of the model. Confusion matrix has four components i.e., TNV = True Negative; FPV = False Positive; FNV = False Negative; and TPV = True Positive.
For instance, when the input image is named with the ME, & the model likewise categorizes it as ME, it is considered the TPV. However, when the input image is marked with the label of ME, but this is categorized as any of the six categorizations, the FNV case. FPV happens when the input image is classified as the positive case/functional case (by the system); however, it is associated with any six diseases. When a non-functional image (by the system) is predicted as non-functional, it is categorized as TNV.
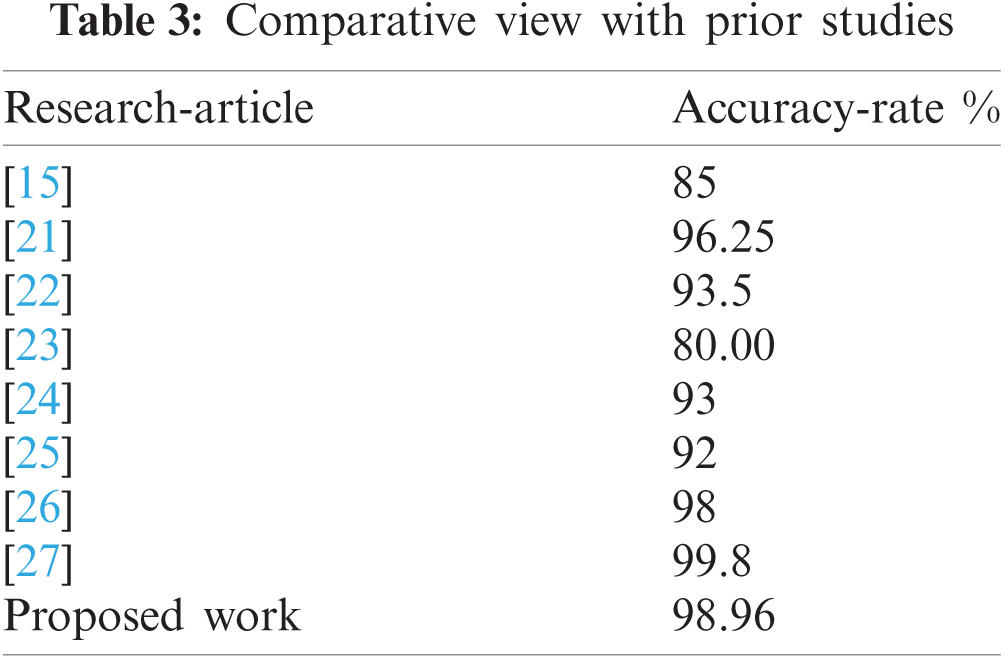
The hyper-parameters used while performing the experiments of the proposed work are given in below Tab. 1. The image size required by this model (i.e., 299 × 299) is composed for the image dataset. The acquired results are presented in Tab. 2. Fig. 14 provides the overview of ME classification. Fig. 15 provides the accuracy and loss curve against the ME classification while testing the proposed work. Lastly, in Tab. 3, a comparative view of the proposed work with other prior research is performed.
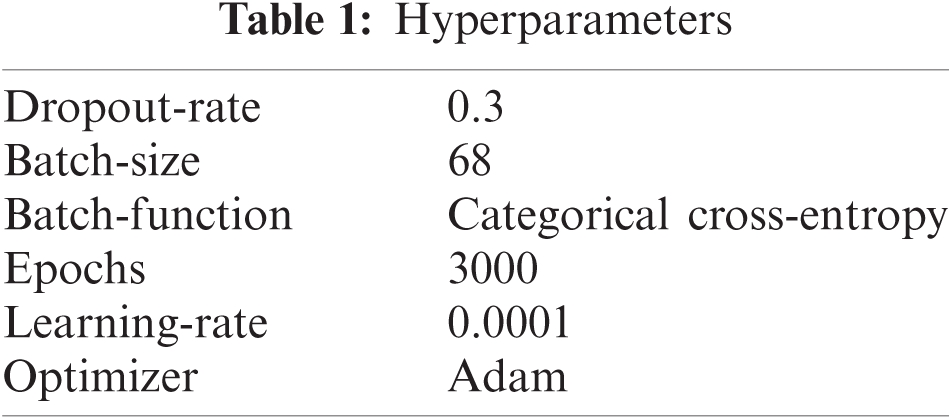
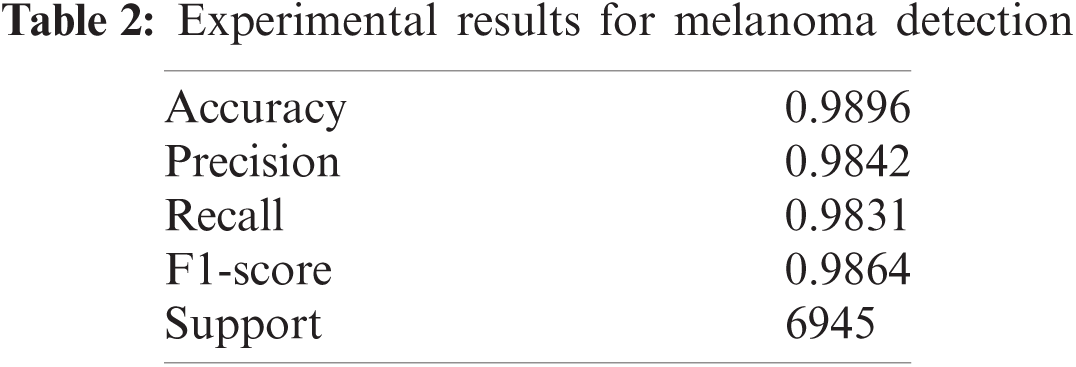

Figure 14: Classification overview

Figure 15: Accuracy and loss curve
CNN (the most superior algorithm for image processing) is used in this research for melanoma detection, where parameter weight calculation is defined over multiple layers. In order to select the parameters (that gives the outperforming prediction results). We started from the real-valued input image. Accordingly, an objective function is used that is known as the loss function (LFN). On the training dataset, it was used for the quantification of the distance between predicted and real value. We minimized the loss rate using two operations.
According to distinct parameters, the cost function's gradient calculation is done during the backward propagation phase. Later, their updation is performed.
Also, during forward propagation through the network, data-propagation is done (in batches/entire network). Next, the LFN is calculated on the batch. It is the summation of the error rate (for the classified results). The procedure is repeated for the number of times specified in epoch-number.
INCP-v3 outperformed due to the following reasons:
Connection Sparsity: The output of each layer is used as an input for the next layer.
Sharing of Parameters: In Convl, if one feature-detector is valuable for one image's part, then it can be valuable for others. The INCP-v3 (with preprocessing using Gaussian filter) is utilized in this research for melanoma classification, with the acquired accuracy rate of 98.96%.
To summarize, the purpose of this research is to develop a CNN model (i.e., INCP-v3 with a Gaussian filter for image preprocessing) to analyze and identify ME using image processing. Additionally, it investigated the data-augmentation approach for enhancing the robustness of the INCP-v3 framework's characterization as a preprocessing measure. TL is used to leverage a pre-trained model rather than training a new model from scratch. The INCP-v3 model achieved a precision rate of greater than 98 percent, outperforming some previous studies.
Acknowledgement: Thanks to my family and colleagues, who provided moral support.
Funding Statement: The author received no specific funding for this study.
Conflicts of Interest: The author declares that he has no conflicts of interest to report regarding the present study.
1. W. K. Barros, D. S. Morais, F. F. Lopes, M. F. Torquato, R. d. M. Barbosa et al., “Proposal of the cad system for melanoma detection using reconfigurable computing,” Sensors, vol. 20, no. 11, pp. 3168, 2020. [Google Scholar]
2. E. Jana, R. Subban and S. Saraswathi, “Research on skin cancer cell detection using image processing,” in 2017 IEEE Int. Conf. on Computational Intelligence and Computing Research, Tamil Nadu, India, 2017, pp. 1–8. [Google Scholar]
3. J. Pauline, S. Abraham and J. Bethanney Janney, “Detection of skin cancer by image processing techniques,” Journal of Chemical and Pharmaceutical Research, vol. 7, no. 2, pp. 148–153, 2015. [Google Scholar]
4. U.-O. Dorj, K.-K. Lee, J.-Y. Choi and M. Lee, “The skin cancer classification using deep convolutional neural network,” Multimedia Tools and Applications, vol. 77, no. 8, pp. 9909–9924, 2018. [Google Scholar]
5. A. Masood and A. Ali Al-Jumaily, “Computer aided diagnostic support system for skin cancer: A review of techniques and algorithms,” International Journal of Biomedical Imaging, vol. 2013, pp. 1–22, 2013. [Google Scholar]
6. C. Curiel-Lewandrowski, E. Berry and S. Leachman, “Artificial intelligence approach in melanoma,” in Melanoma, New York (NYSpringer, pp. 1–31, 2019. [Google Scholar]
7. T. J. Brinker, A. Hekler, A. Hauschild, C. Berking, B. Schilling et al., “Comparing artificial intelligence algorithms to 157 German dermatologists: The melanoma classification benchmark,” European Journal of Cancer, vol. 111, pp. 30–37, 2019. [Google Scholar]
8. M. Tariq, S. Nisar, A. Shah, S. Akbar, M. A. Khan et al., “Effect of hybrid reinforcement on the performance of filament wound hollow shaft,” Composite Structures, vol. 184, pp. 378–387, 2018. [Google Scholar]
9. S. Chan, V. Reddy, B. Myers, Q. Thibodeaux, N. Brownstone et al., “Machine learning in dermatology: Current applications, opportunities, and limitations,” Dermatology and Therapy, vol. 10, no. 3, pp. 365–386, 2020. [Google Scholar]
10. A. K. Verma, S. Pal and S. Kumar, “Comparison of skin disease prediction by feature selection using ensemble data mining techniques,” Informatics in Medicine Unlocked, vol. 16, pp. 100202, 2019. [Google Scholar]
11. M. AlJame, I. Ahmad, A. Imtiaz and A. Mohammed, “Ensemble learning model for diagnosing covid-19 from routine blood tests,” Informatics in Medicine Unlocked, vol. 21, pp. 100449, 2020. [Google Scholar]
12. M. Vidya and M. V. Karki, “Skin cancer detection using machine learning techniques,” in 2020 IEEE Int. Conf. on Electronics, Computing and Communication Technologies, pp. 1–5, Bangalore, India, 2020. [Google Scholar]
13. J. Daghrir, L. Tlig, M. Bouchouicha and M. Sayadi, “Melanoma skin cancer detection using deep learning and classical machine learning techniques: A hybrid approach,” in 2020 5th Int. Conf. on Advanced Technologies for Signal and Image Processing, pp. 1–5, Sousse, Tunisia, 2020. [Google Scholar]
14. Y. Li and L. Shen, “Skin lesion analysis towards melanoma detection using deep learning network,” Sensors, vol. 18, no. 2, pp. 556, 2018. [Google Scholar]
15. M. Vijayalakshmi, “Melanoma skin cancer detection using image processing and machine learning,” International Journal of Trend in Scientific Research and Development, vol. 3, no. 4, pp. 780–784, 2019. [Google Scholar]
16. D. Bisla, A. Choromanska, R. S. Berman, J. A. Stein and D. Polsky, “Towards automated melanoma detection with deep learning: Data purification and augmentation,” in Proc. of the IEEE/CVF Conf. on Computer Vision and Pattern Recognition Workshops, United States, pp. 1–9, 2019. [Google Scholar]
17. J.-A. Almaraz-Damian, V. Ponomaryov, S. Sadovnychiy and H. Castillejos-Fernandez, “Melanoma and nevus skin lesion classification using handcraft and deep learning feature fusion via mutual information measures,” Entropy, vol. 22, no. 4, pp. 484, 2020. [Google Scholar]
18. H. Nahata and S. P. Singh, “Deep learning solutions for skin cancer detection and diagnosis,” in Machine Learning with Health Care Perspective. Cham: Springer, pp. 159–182, 2020. [Google Scholar]
19. S. Jinnai, N. Yamazaki, Y. Hirano, Y. Sugawara, Y. Ohe et al., “The development of a skin cancer classification system for pigmented skin lesions using deep learning,” Biomolecules, vol. 10, no. 8, pp. 1123, 2020. [Google Scholar]
20. A. Naeem, M. S. Farooq, A. Khelifi and A. Abid, “Malignant melanoma classification using deep learning: Datasets, performance measurements, challenges and opportunities,” IEEE Access, vol. 8, pp. 110575–110597, 2020. [Google Scholar]
21. M. K. Monika, N. A. Vignesh, C. U. Kumari, M. Kumar and E. L. Lydia, “Skin cancer detection and classification using machine learning,” Materials Today: Proceedings, vol. 33, pp. 4266–4270, 2020. [Google Scholar]
22. A. Sagar, “Convolutional neural networks for classifying melanoma images,” BioRxiv, 2020. https://doi.org/10.1101/2020.05.22.110973. [Google Scholar]
23. S. Mustafa, A. B. Dauda and M. Dauda, “Image processing and SVM classification for melanoma detection,” in 2017 Int. Conf. on Computing Networking and Informatics, Lagos, Nigeria, 2017. [Google Scholar]
24. I. Zaqout, “Diagnosis of skin lesions based on dermoscopic images using image processing techniques,” Pattern Recognition-Selected Methods and Applications, 2019. [Google Scholar]
25. M. K. Hasan, M. T. E. Elahi, M. A. Alam and M. T. Jawad, “Dermoexpert: Skin lesion classification using a hybrid convolutional neural network through segmentation, transfer learning, and augmentation,” MedRxiv, 2021. https://doi.org/10.1101/2021.02.02.21251038. [Google Scholar]
26. M. Mehmood, E. Ayub, F. Ahmad, M. Alruwaili, Z. A. Alrowaili et al., “Machine learning enabled early detection of breast cancer by structural analysis of mammograms,” Computers, Materials and Continua, vol. 67, no. 1, pp. 641–657, 2021. [Google Scholar]
27. S. A. Alanazi, M. Alruwaili, F. Ahmad, A. Alaerjan and N. Alshammari, “Estimation of organizational competitiveness by a hybrid of one-dimensional convolutional neural networks and self-organizing maps using physiological signals for emotional analysis of employees,” Sensor, vol. 21, no. 11, pp. 1–29, 2021. [Google Scholar]
 | This work is licensed under a Creative Commons Attribution 4.0 International License, which permits unrestricted use, distribution, and reproduction in any medium, provided the original work is properly cited. |