DOI:10.32604/cmc.2022.024545
| Computers, Materials & Continua DOI:10.32604/cmc.2022.024545 | |
| Article |
Mathematical Modelling of Quantum Kernel Method for Biomedical Data Analysis
1Information Technology Department, Faculty of Computing and Information Technology, King Abdulaziz University, Jeddah, 21589, Saudi Arabia
2Centre of Artificial Intelligence for Precision Medicines, King Abdulaziz University, Jeddah, 21589, Saudi Arabia
3Mathematics Department, Faculty of Science, Al-Azhar University, Naser City, 11884, Cairo, Egypt
4Electrical and Computer Engineering Department, Faculty of Engineering, King Abdulaziz University, Jeddah, 21589, Saudi Arabia
5Information Systems Department, Faculty of Computing and Information Technology, King Abdulaziz University, Jeddah, 21589, Saudi Arabia
6Mathematics Department, Faculty of Science, New Valley University, El-Kharga, 72511, Egypt
*Corresponding Author: Romany F. Mansour. Email: romanyf@sci.nvu.edu.eg
Received: 21 October 2021; Accepted: 03 December 2021
Abstract: This study presents a novel method to detect the medical application based on Quantum Computing (QC) and a few Machine Learning (ML) systems. QC has a primary advantage i.e., it uses the impact of quantum parallelism to provide the consequences of prime factorization issue in a matter of seconds. So, this model is suggested for medical application only by recent researchers. A novel strategy i.e., Quantum Kernel Method (QKM) is proposed in this paper for data prediction. In this QKM process, Linear Tunicate Swarm Algorithm (LTSA), the optimization technique is used to calculate the loss function initially and is aimed at medical data. The output of optimization is either 0 or 1 i.e., odd or even in QC. From this output value, the data is identified according to the class. Meanwhile, the method also reduces time, saves cost and improves the efficiency by feature selection process i.e., Filter method. After the features are extracted, QKM is deployed as a classification model, while the loss function is minimized by LTSA. The motivation of the minimal objective is to remain faster. However, some computations can be performed more efficiently by the proposed model. In testing, the test data was evaluated by minimal loss function. The outcomes were assessed in terms of accuracy, computational time, and so on. For this, databases like Lymphography, Dermatology, and Arrhythmia were used.
Keywords: Medical data classification; feature selection; qkm classifier; ltsa optimization
ML has numerous strategies to investigate or perform prediction analysis of big data in medical field. These ML approaches recognize the patterns in huge volumes of datasets “without being expressly modified to perform that task” [1]. ML approaches have been broadly used in analysing the medical data in order to help the medical specialists [2]. For most of the part, huge sized medical databases contain different sorts of features or measurements. The dimensionality of this huge data set can seriously impact different parts of the examination measure. It can build the learning framework on time during both training and deployment stages [3]. Then, it might cause the “scourge of dimensionality” issue.
In medical datasets, every dataset contains numerous features which makes it difficult at the time of classification [4]. The search for high accuracy and rapid classification models have always been the top priority in CAD frameworks which is managed through significant development and analysis in terms of patient recuperation. Each occurrence, utilized in a classification task, is addressed with a few mathematical or categorical features [5]. There are diverse classification methods used since classification influences the applications in a significant manner, [6,7]. To accomplish high classification accuracy, by any of the classifiers, it is important to select an efficient feature set through feature selection method that can denote an occasion [8,9]. For most of the most part, the filter approaches are autonomous of learning induction algorithm [10]. The channels evaluate a pertinence record for every feature to quantify the importance of a feature for the objective. At this point, every rank gets featured based on its significance files and the search is performed as indicated based on positions or dependent on some factual standards [11,12].
As of late, Kernel methods attract a lot of interest these days, owing to its force of grouping the data based on the correlation between two input variables or in terms of feature set space [13–15]. Kernels can likewise be connected to a number of ML models in order to improve data classification accuracy of the model. After feature selection, Quantum-motivated algorithms are implemented as a part of developmental algorithm based on QC literature [16,17] that details about coherence, interference, standing waves and so on. The ideas and standards of quantum mechanics have been utilized in these algorithms to overcome the failure of conventional algorithms [18]. The current research paper introduces Quantum Kernel method to improve classification accuracy along with optimization algorithms. The manipulative and explorative characteristics of the search algorithms assist them in arriving at optimal solutions [19]. Most of the search algorithms are necessary to proceed to further steps and accomplish the optimal result at less execution time.
Main Contributions of the Paper: In this paper, medical data applications are analysed by means of data classification and feature selection techniques. A filter approach is implemented to resolve the problem of feature selection in medical dataset classification. For classification, QKM is presented in which the parameters are optimized or tuned by LTSA. The quality of the proposed QKM_LTSA model was analysed and compared against the existing models. Based on the outcomes, the supremacy of the proposed method is established.
Rest of the paper is organized as follows. After the introduction section, a review of recent research works related to medical applications along with ML algorithms is explained in Section 2 with their advantages and disadvantages. Section 2.1 depicts the motivation behind QC in medical data application, Section 3 explains the proposed methodology for data classification as normal and abnormal and the algorithm steps are detailed in the subsections. Section 4 demonstrates the result of simulation modelling and finally, the conclusion is discussed in Section 5 with future scope.
Harb et al. 2014, [20] proposed a filter as well as Particle Swarm Optimization (PSO) technique with wrapper approach as a feature selection technique. The implemented technique was different from another feature selection technique i.e., Genetic approach. Both the calculations were made using three datasets. The results demonstrate that the subset of the element got classified by the proposed PSO, while five classifiers were involved in the process. The outcomes showed improvement in terms of accuracy of classification.
In 2020, Soula et al. [21] depicted a novel incremental classifier to overcome the issues related to group strategies. The model is designed to deal with the issues identified in Kernel Support Vector Machines (KSVM) and data spread. Essentially, when a Kernel SVM is implemented in a steady fashion, the novel data becomes accessible after few minutes. This method can handle huge and dynamic data viably and reduce the execution time [22]. A binary encoding system was proposed by Li et al, in which the model does not require the clients to have space information on CNN. At that point, another model is proposed upon the quantum carried on developing technique to ensure the adequacy of the advanced structures in CNN. At long last, the algorithm exhibited excellent classification accuracy when applied in few benchmark datasets, when applied in DL framework in general. The experimental analysis demonstrated that the method accomplished the preferred classification and outperformed other conventional techniques.
In 2020, Pilario et al. [23] made use of kernel methods than other approaches. Every issue was examined with regards to their significance and how it was addressed during that time by different analysts. In 2018, Zhang et al. [24] proposed a multiple-layer multiple-kernel learning algorithm based deep learning with DL capability in order to locate the arranged set of kernels. The implemented model refreshed the kernel network weights by advancing a measurement that depends upon the exhibition of learned kernels with SVM classifier. The set up was similar to that of the deep neural network of training system. The model was subjected to medical application issue yet, it accomplished better outcomes than the previously-available methods [25]. A total of three quantum-motivated meta-heuristic procedure was proposed by Dey et al. 2020. A correlation was achieved between the quanta-enriched algorithms and their coherent conventional algorithms. The effectiveness of quantum-motivated method was tested and compared with traditional partners in terms of mean, fitness and classification errors. Further, the study also considered numerical functions as well as algorithm execution time.
2.1 Motivation of Quantum Kernel Method in Medical Data Classification
ML system-based medical applications regularly lag behind in terms of accuracy when it comes to unstructured medical data or image classes. Further, the power attributable to the accompanying important challenges also become high.
■ There is a need to develop training dataset to train the algorithm appropriately. Since the medical data investigators are unavailable and even if available, they are costly, the connected sores are not adequately accessible in the data sets.
■ The prerequisites for high computational accuracy and memory system requirements for broad training of deep learning systems are costly and challenging to accomplish.
■ In medical data classification, neural network structures regularly experience the ill effects of over fitting and moderate convergence issues. These challenges consequently need tremendous endeavours so as to provide suitable tuning for the hyper parameters of the hidden design. Neural network-based medical data classification overcomes the issue of unavailability of reliable data.
In order to overcome the challenges discussed above, QC i.e., Quantum Kernel classifier is utilized with optimization algorithm in order to improve the data classification accuracy. The primary advantage in utilizing QC in medical data application is that the impact of quantum parallelism is high with regards to post-optimization issues in less time. This characteristic reduces the computational time and minimizes the loss function.
The proposed model is aimed at distinguishing the medical dataset into two classes and to improve the classification accuracy by implementing Quantum Kernel function and Linear Tunicate Swarm Algorithm (LTSA). Each dataset has a number of attributes from which some specific attributes (it specifies the type of disease) are used in the classification of data. The steps involved in medical data classification are as follows.
■ Medical Dataset-University of California, Irvine (UCI) Database
■ Feature Selection-Filter Method
■ Data Classification-QKM
■ Loss Function Optimization-LTSA
Fig. 1 demonstrates the workflow of the proposed medical data classification model. A novel technique named Quantum Kernel Method (QKM) is proposed for data prediction. This QKM process initially calculates the loss function, aimed at medical data, by optimization technique i.e., Linear Tunicate Swarm Algorithm (LTSA) used. The output of optimization is either 0 or 1 i.e., odd or even in QC. From this output value, the data is detected according to the class i.e., normal and abnormal.

Figure 1: Block diagram of medical data classification model using QKM
3.1 Feature Selection: Filter Approach (IMBO-CFS)
Feature selection is a method to reduce the number of input variables, when building up a prescient model. Filter-based feature selection methods utilize factual measures to score the correlation or rely between input variables that can be filtered to select the most appropriate features. The correlation between two input data or variables can be assessed by utilizing the equation (Pearson coefficient) given below.
Here, x and y denote the input data. Similar to most of the feature selection procedures, CFS (Correlation-based Feature Selection) utilizes a search algorithm along with a capacity to assess the value of feature subsets. Here, one optimization algorithm is utilized as a filter with CFS as a fitness function. In this work, IMBO (Improve Monarch Butterfly Optimization) is proposed as a channel whereas CFS is used as a fitness function. CFS measures the applicability of each feature to predict the class label along with the degree of inter correlation among them. This occurs based on the assumption that good feature subsets tend to contain features that are highly related (prescient of) with the class, yet uncorrelated with (not prescient of) one another.
Monarch Butterfly (MB) is a metaheuristic algorithm which is developed on the basis of movement pattern of Monarch Butterflies [26]. The relocation pattern of MB is decoded as follows: (I) A ruler butterfly stays in either Land 1 or Land 2, (ii) Each youngster ruler butterfly is created as an individual by the movement administrator from MB in Land 1 or in Land 2, (iii) if the recently-produced MB has better fitness value on the contrary to its parent, then it gets supplanted by its parent. Therefore, the populace range remains unaltered and the butterflies with better fitness move towards the future. They remain unchanged by other administrators. Further, this cannot be disintegrated with the addition of generations. A general MB is improved by random value selection i.e., the value is selected based on the updated velocity of Particle Swarm Optimization (PSO) algorithm in Eq. (4) and those steps are detailed as given herewith.
MB optimizer is initialized with ‘n’ number of population in land 1 as well as land 2; here, the position of every monarch butterfly represents the given feature set combination and the fitness is evaluated according to the correlation value of each data variable (position of each MB).
The position of the MB is updated by two operations namely, migration operation and adjustment of the butterfly operator. The MB in land one and land two are named as Sub-population one and two. In this study, the features are initialized as subpopulation one and subpopulation two. The migration procedure, followed by these butterflies, is defined below.
where
On the contrary, if
where
The position of butterfly can be adjusted based on the generated
where
On the other hand, when
Here, BAR represents the modification rate of butterflies and
where
IMBO algorithm is derived by replacing the random value in Eq. (4) and by updating the velocity in PSO algorithm as explained in Eq. (11). From the general form of PSO, for one particle, its velocity vector value is refreshed based on
where,
From Eq. (1),

Figure 2: Flowchart of IMBO algorithm
3.2 Proposed Quantum Kernel Method for Medical Data Classification
Once the features are extracted from this filter (IMBO-CFS), QKM is utilized as a data classification model. This model classifies the data as either normal or abnormal with minimized loss function. The purpose of this minimal objective is to increase the speed so as to perform some computations more effectively in the proposed model. The best-selected features are then fed to a quantum circuit by Quantum Kernel Method [14].
3.2.1 Quantum Kernel Method (QKM)
Quantum kernel function system is productively utilized to build the hyperplane condition, which calculates the loss function, aimed at metaheuristic algorithm-based optimization. Linear kernel function is denoted as follows.
The equation given below explains the decision surface of hyper plane.
The vector, drawn from the input space is denoted by y in dimension
Lagrange multiplier is denoted by
With the help of LTSA optimization, the optimum values (linear weight vector) of Lagrange multipliers are calculated and updated during every iteration.
3.2.2 Loss Function Optimization-Proposed LTSA Model
A function can be minimized or maximized based on the accuracy or any specific parameters. In this due course of the process, optimization approach plays a vital role. Here, QKM calculates the loss function which can be optimized or minimized by a search algorithm i.e., Linear Tunicate Swarm Algorithm.
Tunicate Swarm Algorithm: It has the capacity to identify the area where food is available, in ocean. In current research work, two characteristics of tunicate are utilized to detect the food source such as
■ Jet propulsion
■ Swarm intelligence
Tunicate must fulfil three stages in a specific manner in order to avoid the conflicts between search agents, must stay close to the best search agent, move to the position of best search agent and reduce the conflicts between search agents. The swarm conducts a fresh inquiry about the best solution and the specialists to achieve this [26].
Linear TSA: Linear-TSA utilizes a reference set as a swap to generate the random numbers and it was applied in Random-TSA. At first, the medical data sequence from UCI database is chosen as a reference set. Here, another molecule is removed consecutively from the reference set. Random-TSA generates a random number to initiate the population and calculate the velocity. In order to evaluate a new search agent position, the best search agent value is utilized.
Stage 1: Avoiding the conflicts among search agents
The vector

Figure 3: Tunicate behaviour: stage 1
Here,
where,
Stage 2: Movement towards the direction of best neighbour
After the stage ‘avoiding conflict among neighbouring search agents’, the tunicate search agents (data) move to the optimal neighbour as explained in Fig. 4.
The parameter

Figure 4: Tunicate behaviour: stage 2
Stage 3: Converge to optimal search agent
In this scenario, the optimal search agent moves the position towards the food source (i.e., food source) as depicted in Fig. 5.

Figure 5: Tunicate behaviour: stage 3
if
Stage 4: Swarm Intelligence
Generally, two optimal solutions are stored and the place of other search agents is updated. The swarm behaviour of tunicate is updated based on the following equation.
Eq. (20) updates the position of search agents in line with
The optimization output remains either 0 or 1 i.e., odd or even in QC. Based on this output value, the data is detected according to the class. The flowchart of LTSA is shown in Fig. 6.

Figure 6: Flowchart of LTSA
3.3 Allocation of Optimal Solution
With the application of QKM in LTSA algorithm, medical data was classified as either normal or abnormal from UCI datasets. The most accurate medical data classification was achieved for three datasets used in the study such as Lymphography, Dermatology and Arrhythmia. Finally, maximum accuracy and minimal loss function were also attained by the proposed QKM-LTSA algorithm.
The proposed QKM-LTSA model was implemented in MATLAB 2016a with an i5 processor and 4GB RAM. From UCI machine learning repository, the datasets such as Lymphography, Dermatology and Arrhythmia were retrieved out of which various medical data were considered for classification process. Three databases were used in the study. The proposed model was implemented, validated and compared with other conventional feature selection and classifier systems for its supremacy under different performance metrics.
For the proposed medical data classification process, three medical datasets sourced from UCI machine learning repository were used. The details of the dataset is given in Tab. 1. Following is the descriptions of the datasets.:
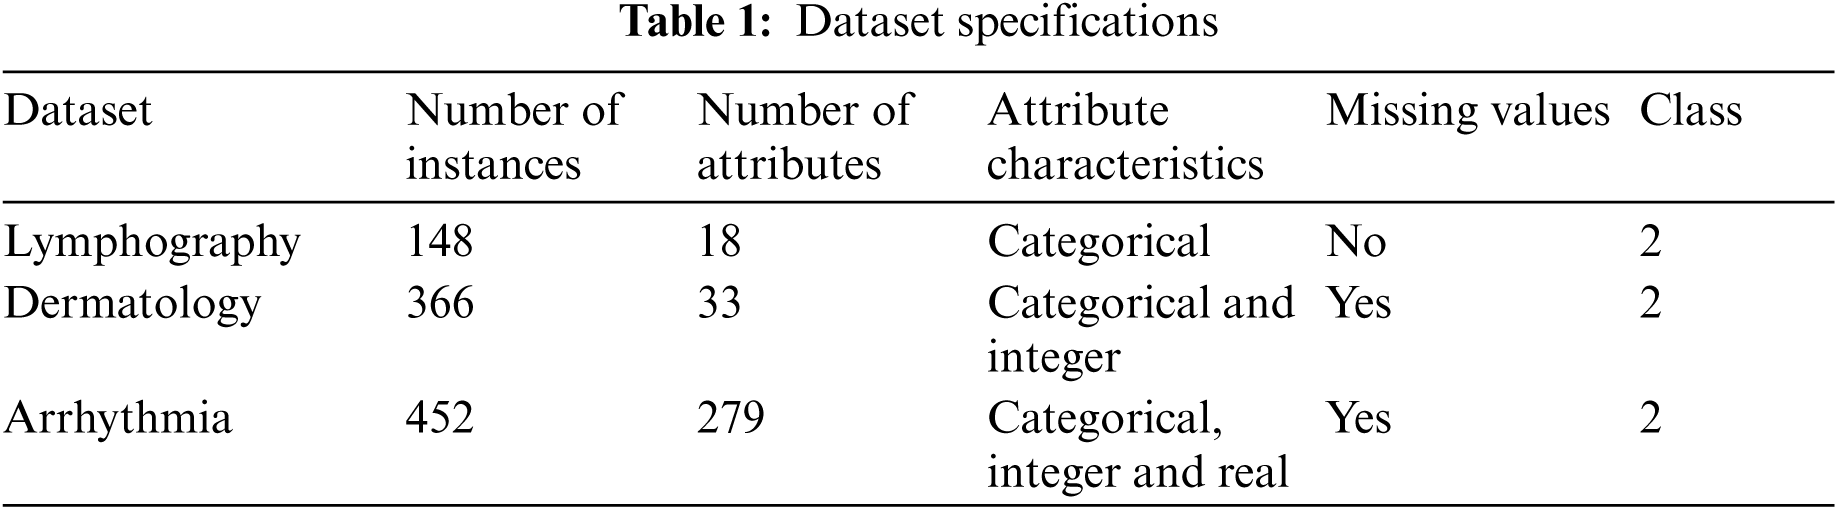
1) Lymphography Dataset: Lymphography is one of the three domains allotted by Oncology Institute and it has consistently appeared in ML literature.
2) Dermatology Dataset: Dermatology dataset consists of 34 attributes. From this, one is nominal and other 33 are linear esteemed. One of the challenges in this database is that for differential determination, an illness may show the features of one more sickness toward the early stage whereas it may include the trademark features at later stages. Initially, the patients were categorized based on 12 features. Then, skin tests were conducted to assess 22 histopathological features. Histopathological assessments were balanced by the evaluation of every sample, under a micro-instrument.
3) Arrhythmia Dataset: Arrhythmia dataset consists of 279 attributes. In this database, 73 are nominal and 206 are linear. One of the 16 groups are characterized by absence and presence of heart arrhythmia.
The simulation outcomes of feature selection algorithms such as CFS (without optimization), CFS with Fruit Fly Optimization (CFS-FFO), and the proposed CFS-IMBO algorithm are shown in the table given below. For different set of features in UCI dataset, the accuracy of different algorithms like CFS, CFS-FFO and proposed CFS-IMBO are shown in Fig. 7. These algorithms were utilized and the accuracy was calculated and rated based on its features. The accuracy was analysed for different feature sets in the range of 10 to 60. When compared to other feature selection algorithms, correlation-based IMBO model achieved high accuracy on Lymphography dataset.

Figure 7: Accuracy of feature selection
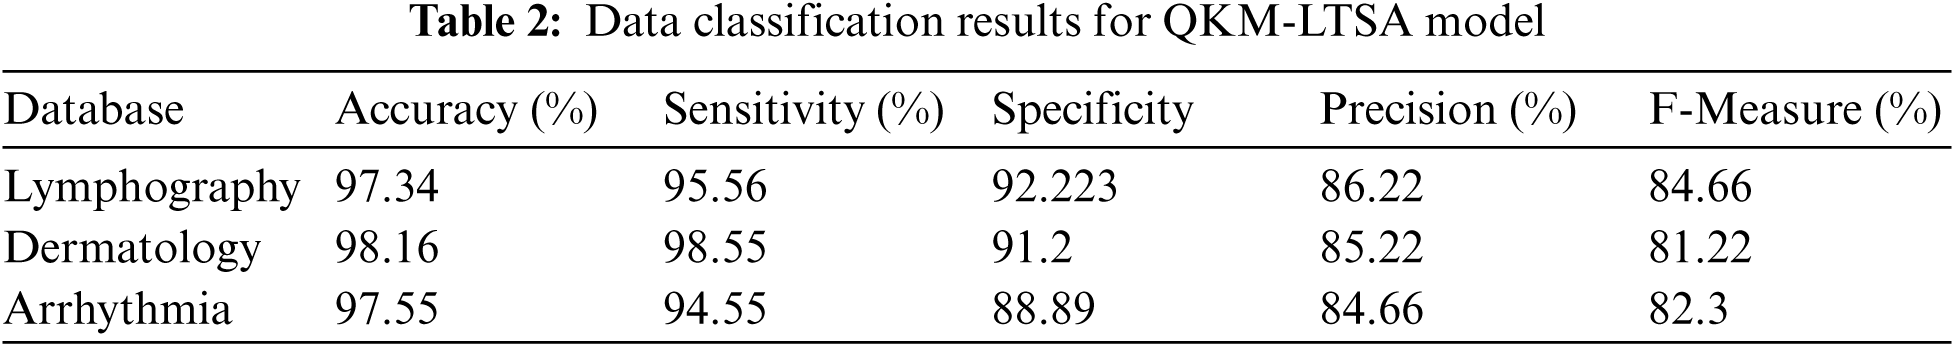
Tab. 2 shows the results of medical data classification by the proposed QKM-LTSA model. Usually, quantum kernel methods classify the high-dimension linear feature data from non-linear feature data. Due to this characteristic, QKM is used in medical data classification which provides highly accurate results. The outcome demonstrates that Lymphography database accomplished 97.34% accuracy, 95.56% sensitivity, 92.22% specificity, 86.22% precision and 84.66% F-measure. Moreover, the proposed technique achieved similar results in other two databases (dermatology, and Arrhythmia) which are shown in Tab. 2.
The results of the performance measures’ analysis attained by the proposed QKM-based LTSA and existing classification models are shown in Figs. 8–10 for all three datasets. The proposed model was compared with QKM, SVM-FOA, Hybrid Kernel SVM and Multi Kernel SVM models. The measures considered for data classification process were sensitivity, specificity, accuracy, f-measure and precision. The results for these measures are shown in Figs. 8–10 for the datasets, Lymphography, Dermatology and Arrhythmia respectively. For Lymphography dataset, the accuracy measure of QKM-LTSA was 98.84, QKM was 92.2, SVM-FOA, hybrid kernel SVM was 77.49 and multi-kernel was 88.92. For Dermatology dataset, the accuracy measure of QKM-LTSA is 98.84, QKM is 92.2, SVM-FOA is, hybrid kernel SVM is 77.49 and multi-kernel is 88.92.
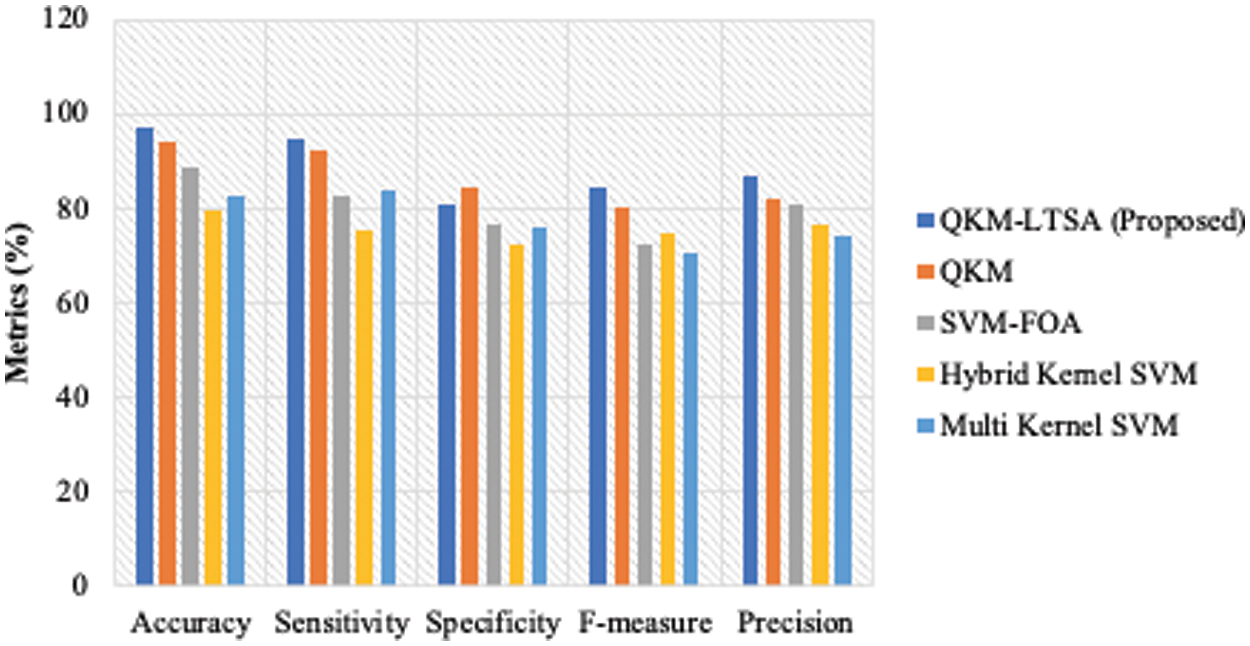
Figure 8: Performance measures for lymphography dataset

Figure 9: Performance measures for dermatology dataset

Figure 10: Performance measures for arrhythmia dataset
The time taken for classifying the medical data, based on the selected features, is illustrated as a line graph in Fig. 11. The time taken for executing ML algorithms was also analysed i.e., hybrid SVM, Multi-Kernel SVM, SVM-FOA and the proposed QKM-LTSA. From the analysis, it was found that the proposed classifier took minimum time to classify the medical data.

Figure 11: Execution time analysis of classification algorithms
The current research paper explained the importance of QC in medical data classification and the effectiveness of the proposed classifier. One of the challenges faced during data classification is the scrutiny of the best features from numerous attributes present in UCI database. The current study considered three medical datasets for medical data classification in order to find out the data as either normal or abnormal. At first, the data was made to undergo optimal feature selection process by the proposed IMBO with CFS filter approach. The simulation analysis found out that the proposed IMBO with CFS feature selection method performed well compared to existing methods; it selected optimal features with minimum computational cost requirement to resolve medical data classification problems. Then, based on the selected features, the data was classified as normal or abnormal by the proposed Quantum-inspired KM with LTSA optimization. The performance of the proposed QKM-LTSA model was measured in terms of few measures such as sensitivity, specificity and accuracy. The results showed that QKM-LTSA achieved the maximum value and minimum loss function. Finally, it can be concluded that the QC-based medical data classification model obtained promising results than other techniques. In future, the study can be extended to include new measures for medical data values and to remove the missing values by new imputation approach, classification, and prediction. Future contributions will concentrate on developing novel and hybrid optimization algorithms with filter methods for feature selection and medical data classification.
Funding Statement: This research work was funded by Institutional fund projects under Grant No. (IFPHI-038-156-2020). Therefore, authors gratefully acknowledge technical and financial support from Ministry of Education and King Abdulaziz University, DSR, Jeddah, Saudi Arabia.
Conflicts of Interest: The authors declare that they have no conflicts of interest to report regarding the present study.
1. E. Tuba, I. Strumberger, T. Bezdan, N. Bacanin and M. Tuba, “Classification and feature selection method for medical datasets by brain storm optimization algorithm and support vector machine,” Procedia Computer Science, vol. 162, pp. 307–315, 2019. [Google Scholar]
2. O. Cigdem and H. Demirel, “Performance analysis of different classification algorithms using different feature selection methods on Parkinson's disease detection,” Journal of Neuroscience Methods, vol. 309, pp. 81–90, 2018. [Google Scholar]
3. M. N. Kumar, M. M. Abedin, M. S. Islam, H. S. Suri, A. S. E. Baz et al., “Comparative approaches for classification of diabetes mellitus data: Machine learning paradigm,” Computer Methods and Programs in Biomedicine, vol. 152, pp. 23–34, 2017. [Google Scholar]
4. R. F. Mansour, N. M. Alfar, S. A. Khalek, M. Abdelhaq, R. A. Saeed et al., “Optimal deep learning based fusion model for biomedical image classification,” Expert Systems, pp. 1–15. https://doi.org/10.1111/exsy.12764. 2021. [Google Scholar]
5. R. F. Mansour, J. E. Gutierrez, M. Gamarra, V. G. Díaz, D. Gupta et al., “Artificial intelligence with big data analytics-based brain intracranial hemorrhage e-diagnosis using CT images,” Neural Computing and Applications, 2021. pp. 1–10. https://doi.org/10.1177%2F0846537120954293. [Google Scholar]
6. H. Gunduz, “An efficient dimensionality reduction method using filter-based feature selection and variational autoencoders on Parkinson's disease classification,” Biomedical Signal Processing and Control, vol. 66, pp. 102452, 2021. [Google Scholar]
7. M. M. Islam, M. J. Rahman, D. C. Roy and M. Maniruzzaman, “Automated detection and classification of diabetes disease based on Bangladesh demographic and health survey data, 2011 using machine learning approach,” Diabetes & Metabolic Syndrome: Clinical Research & Reviews, vol. 14, no. 3, pp. 217–219, 2020. [Google Scholar]
8. Z. Lei, Y. Sun, Y. A. Nanehkaran, S. Yang, M. S. Islam et al., “A novel data-driven robust framework based on machine learning and knowledge graph for disease classification,” Future Generation Computer Systems, vol. 102, pp. 534–548, 2020. [Google Scholar]
9. K. Deeba and B. Amutha, “ResNet-deep neural network architecture for leaf disease classification,” Microprocessors and Microsystems, pp. 103364, 2020. [Google Scholar]
10. V. Chandrasekar, V. Sureshkumar, T. S. Kumar and S. Shanmugapriya, “Disease prediction based on micro array classification using deep learning techniques,” Microprocessors and Microsystems, vol. 77, pp. 103189, 2020. [Google Scholar]
11. L. Li, L. Sun, Y. Xue, S. Li, X. Huang et al., “Fuzzy multilevel image thresholding based on improved coyote optimization algorithm,” IEEE Access, vol. 9, pp. 33595–33607, 2021. [Google Scholar]
12. B. Sabeena, S. Sivakumari and P. Amudha, “A technical survey on various machine learning approaches for Parkinson's disease classification,” Materials Today: Proceedings, pp. S2214785320376987, 2020. https://doi.org/10.1016/j.matpr.2020.10.120 [Google Scholar]
13. R. Mengoni and A. Di Pierro, “Kernel methods in quantum machine learning,” Quantum Machine Intelligence, vol. 1, no. 3–4, pp. 65–71, 2019. [Google Scholar]
14. P. Nanglia, S. Kumar, A. N. Mahajan, P. Singh and D. Rathee, “A hybrid algorithm for lung cancer classification using SVM and neural networks,” ICT Express, vol. 7, no. 3, pp. 335–341, 2021. [Google Scholar]
15. G. N. Kouziokas, “SVM kernel based on particle swarm optimized vector and Bayesian optimized SVM in atmospheric particulate matter forecasting,” Applied Soft Computing, vol. 93, pp. 106410, 2020. [Google Scholar]
16. J. Biamonte, P. Wittek, N. Pancotti, P. Rebentrost, N. Wiebe et al., “Quantum machine learning,” Nature, vol. 549, pp. 195–202, 2017. [Google Scholar]
17. S. Jain, J. Ziauddin, P. Leonchyk, S. Yenkanchi and J. Geraci, “Quantum and classical machine learning for the classification of non-small-cell lung cancer patients,” SN Applied Sciences, vol. 2, no. 6, pp. 1088, 2020. [Google Scholar]
18. R. Y. Li, R. D. Felice, R. Rohs and D. A. Lidar, “Quantum annealing versus classical machine learning applied to a simplified computational biology problem,” npj Quantum Information, vol. 4, no. 1, pp. 14, 2018. [Google Scholar]
19. S. Dey, S. Bhattacharyya, U. Maullik, “Quantum-inspired automatic clustering technique using ant colony optimization algorithm,” Quantum Inspired Intelligent Systems for Multimedia Data Analysis, 2018. pp. 1–25. https://doi.org/10.4018/978-1-5225-5219-2.ch002. [Google Scholar]
20. H. M. Harb and A. S. Desuky, “Feature selection on classification of medical datasets based on particle swarm optimization,” International Journal of Computer Applications, vol. 104, no. 5, pp. 14–17, 2014. [Google Scholar]
21. A. Soula, K. Tbarki, R. Ksantini, S. B. Said, and Z. Lachiri, “A novel incremental Kernel nonparametric SVM model (iKN-SVM) for data classification: An application to face detection,” Engineering Applications of Artificial Intelligence, vol. 89, pp. 103468, 2020. [Google Scholar]
22. Y. Li, J. Xiao, Y. Chen and L. Jiao, “Evolving deep convolutional neural networks by quantum behaved particle swarm optimization with binary encoding for image classification,” Neurocomputing, vol. 362, pp. 156–165, 2019. [Google Scholar]
23. K. E. Pilario, M. Shafiee, Y. Cao, L. Lao and S. H. Yang, “A review of kernel methods for feature extraction in nonlinear process monitoring,” Processes, vol. 8, no. 1, pp. 24, 2019. [Google Scholar]
24. G. Zhang, L. Zhong, M. Xiao and Y. H. Huang, “Deep kernel learning with application to medical image annotation,” in 2018 14th Int. Conf. on Natural Computation, Fuzzy Systems and Knowledge Discovery (ICNC-FSKD), Huangshan, China, pp. 1346–1352, 2018. [Google Scholar]
25. A. Dey, S. Dey, S. Bhattacharyya, J. Platos and V. Snasel, “Novel quantum inspired approaches for automatic clustering of gray level images using particle swarm optimization, spider monkey optimization and ageist spider monkey optimization algorithms,” Applied Soft Computing, vol. 88, pp. 106040, 2020. [Google Scholar]
26. S. Kaur, L. K. Awasthi, A. L. Sangal and G. Dhiman, “Tunicate swarm algorithm: A new bio-inspired based metaheuristic paradigm for global optimization,” Engineering Applications of Artificial Intelligence, vol. 90, pp. 103541, 2020. [Google Scholar]
 | This work is licensed under a Creative Commons Attribution 4.0 International License, which permits unrestricted use, distribution, and reproduction in any medium, provided the original work is properly cited. |