DOI:10.32604/cmc.2022.024312
| Computers, Materials & Continua DOI:10.32604/cmc.2022.024312 | |
| Article |
Optimal Hybrid Feature Extraction with Deep Learning for COVID-19 Classifications
1Department of Information Systems, College of Science & Art at Mahayil, King Khalid University, Saudi Arabia
2Department of Information Systems, Prince Sultan University, Riyadh, 11586, Saudi Arabia
3Department of Computer Science, King Khalid University, Muhayel Aseer, 62529, Saudi Arabia
4Faculty of Computer and IT, Sana'a University, Sana'a, 61101, Yemen
5Department of Computer and Self Development, Preparatory Year Deanship, Prince Sattam bin Abdulaziz University, AlKharj, Saudi Arabia
6Faculty of Arts and Science, Najran University, Sharourah, Saudi Arabia
7Department of Natural and Applied Sciences, College of Community-Aflaj, Prince Sattam bin Abdulaziz University, Saudi Arabia
*Corresponding Author: Manar Ahmed Hamza. Email: ma.hamza@psau.edu.sa
Received: 13 October 2021; Accepted: 16 December 2021
Abstract: Novel coronavirus 2019 (COVID-19) has affected the people's health, their lifestyle and economical status across the globe. The application of advanced Artificial Intelligence (AI) methods in combination with radiological imaging is useful in accurate detection of the disease. It also assists the physicians to take care of remote villages too. The current research paper proposes a novel automated COVID-19 analysis method with the help of Optimal Hybrid Feature Extraction (OHFE) and Optimal Deep Neural Network (ODNN) called OHFE-ODNN from chest x-ray images. The objective of the presented technique is for performing binary and multi-class classification of COVID-19 analysis from chest X-ray image. The presented OHFE-ODNN method includes a sequence of procedures such as Median Filtering (MF)-based pre-processed, feature extraction and finally, binary (COVID/Non-COVID) and multiclass (Normal, COVID, SARS) classification. Besides, in OHFE-based feature extraction, Gray Level Co-occurrence Matrix (GLCM) and Histogram of Gradients (HOG) are integrated together. The presented OHFE-ODNN model includes Squirrel Search Algorithm (SSA) for fine-tuning the parameters of DNN. The performance of the presented OHFE-ODNN technique is conducted using chest x-rays dataset. The presented OHFE-ODNN method classified the binary classes effectively with a maximum precision of 95.82%, accuracy of 94.01% and F-score of 96.61%. Besides, multiple classes were classified proficiently by OHFE-ODNN model with a precision of 95.63%, accuracy of 95.60% and an F-score of 95.73%.
Keywords: COVID-19; classification; deep learning; radiological images
Respiratory infections in human beings tend to limit their survival rate and is highly fatal in nature. In 2019, SARS-coV-2 was first diagnosed and named as COVID-19 by WHO. It falls under a group of viruses named coronavirus. Being a respiratory virus, COVID-19 causes severe cold, cough and fever along with respiratory syndromes like Middle East Respiratory Syndrome (MERS) and Severe Acute Respiratory Syndrome (SARS) [1]. This virus is named as corona viruses because of its crown-shaped tips at its base. Novel coronavirus is generally found in animals; while it has the capability to spread to human beings and can quickly become a pandemic, affecting entire human population. COVID-19, as the name says, the outbreak of this deadly virus attacked the human population in the year 2019 and gained pandemic status by March 2020. It is an air borne disease i.e., its major source of spreading is through air which was confirmed on 28th January 2020. On 15th February 2020, in excess of 5,000 COVID-19 positive cases were confirmed and registered a total of 106 deaths.
Since 23rd January 2020, entire Wuhan city, China was quarantined by terminating all the resources such as shops, transportation modes and other sources in and out of the city. Further, quarantine was also extended to other neighboring countries. Followed by, several other countries have also quarantined the corona-affected patients. Italy has become the epicenter in European region since by March 2020, it recorded the highest death in the world. By 05th of April 2020, 15,000 deaths were registered in Italy, while it was 8,000 in Lombardia, 21,000 in Emilia-Romagna, and 1,200 in Piedmont.
In medical perspective, COVID-19 disease causes massive and highly mortal pneumonia with clinical depiction being SARS-CoV. Obviously, the patients exhibit flu-based signs like fever, dry cough, sore throat, tiredness and shortage in breathing. The pneumonia patients were further weakened by this disease and resulted in acute renal failure, and finally death. In addition to the above-mentioned symptoms, COVID-19 shows other symptoms such as lack of taste and smell as well. Hence, such asymptomatic patients acted as carriers due to which their immediate contacts got infected with COVID-19. It can be found that other inhabitants of country who were sampled for pharyngeal swab, and 50%–75% of the individuals were swab positive. This inferred that that they were affected with the virus without any symptoms [2].
In recent times, COVID-19 can be diagnosed through nose swab collected from the patient and by making the sample undergo Polymerase Chain Reaction (PCR). The major issue is that the swab can be taken and diagnosed for the infected people. But, asymptomatic patients could not be identified easily unless they exhibit some symptoms. If the diagnosis confirmed that a patient has COVID-19 with the help of PCR, the affected patients with pneumonia can be confirmed through chest X-ray. Then the Computed Tomography (CT) images in this model are assumed as the features for human eye, as illustrated by the developers in [3]. The spreading rate of COVID-19 is decided based on the ability of finding the diseased patients with minimum false negatives. By ensuring better disease management, it is clear that the periodical disease prediction activates the execution of monitoring care, which is highly essential for COVID-19 patients. The patients have been proven to show anomalies in their chest CT images with maximum bilateral contribution. Biomedical imaging implies the symptoms of pneumonia. WHO has announced various supplemental diagnostic protocols for COVID-19.
Diagnosis is generally carried out by processing Real-time Reverse PCR (rRT-PCR) upon biological samples collected from the patients. These samples may be sputum, blood and so on. Generally, it is accessible with a limited period of time. COVID-19 is probably predicted with the application of radiological imaging whereas its detection observed an increase from clinical photographs, where X-Rays are applied. Various works have described the prediction process of pulmonary disease by diagnosing the clinical images using Artificial Intelligence (AI). AI is a newly developed technology in recent times and its application is highly helpful for professionals in the interpretation of clinical images. Specifically, transfer learning and Deep Learning (DL) methodologies have been established and reused many times as initial point for consecutive operation. Deep Learning is one of the well-known methods in which pre-trained approaches are employed as primary points on computer vision as well as natural language computations. It offers a wide range of procedural resources that are essential for the development Neural Network (NN) approaches, to resolve the issues and from huge jumps that offer relevant issues. The current efforts have implied drastic enhancement in the prediction of clinical sector, for example, lung cancer prediction, prostate cancer ranking etc.
The current research article presents a novel automated COVID-19 analysis method utilizing Optimal Hybrid Feature Extraction (OHFE) and Optimal Deep Neural Network, abbreviated as OHFE-ODNN in chest x-ray image. The proposed OHFE-ODNN method contains a sequence of procedures such as Median Filtering (MF)-based preprocessing, OHFE-based feature extraction and finally ODNN-based classifier. Here, OHFE is a combination of optimal GLCM and HOG features, where the optimal set of features are chosen by Oppositional Crow Search (OCS) algorithm. The ODNN model includes Squirrel Search Algorithm (SSA) for fine-tuning the DNN parameters. The performance of the OHFE-ODNN model was assessed utilizing chest x-rays dataset. The experimentation outcome proved the effective efficiency of OHFE-ODNN method compared to existing methods.
Rest of the paper is ordered as follows. Section 2 offers a detailed survey of existing techniques. Section 3 introduces the proposed OHFE-ODNN technique and Section 4 validates the performance of the proposed method. At last, Section 5 concludes the work.
The recent advancements made in medical image processing methodologies triggered a rapid development in the establishments of smart detection as well as diagnosis materials. ML models are highly approved these days, as eminent modes for disease analysis. Thus, effective feature extraction models are essential for accomplishing optimal Machine Learning (ML) techniques. However, DL approaches have been extensively used in medical imaging models, since the features are extracted in an automated manner or with the help of a few pre-defined models like ResNet. Yu et al. [4] employed CNN for classifying the chest CT images of COVID-19 positive patients. Nardelli et al. [5] utilized 3D CNN for categorizing the pulmonary artery–vein sections in chest CT scan image. Shin et al. [6] applied DCNN for classifying interstitial lung disease from CT scan image.
Xie et al. [7] divided the benign and malignant lung nodules under the application of knowledge-based collaborative DL on chest CT. This method attained the maximum accuracy in terms of classifying the lung nodes. Hagerty et al. [8] segregated melanoma dermoscopy image under the application of DL which achieved standard accuracy. Gerard et al. [9] predicted the pulmonary fissure from CT scan image with use of supervised discriminative learning approach. Setio et al. [10] employed a multi-view traditional system for the prediction of pulmonary nodule from CT image. Xia et al. [11] applied deep adversarial systems for the segmentation of abdominal CT image. Pezeshk et al. [12] made use of 3D CNN method to predict the pulmonary nodule from chest CT scan image. Zreik et al. [13] leveraged a classifier technique with the help of recurrent CNN for classifying Coronary Artery Plaque and Stenosis from coronary CT scan images. The study employed full 3D CNN in order to combine multi-dimensional data to tumor segments in CT. Bhandary et al. [14] deployed a methodology for the detection of lung infection utilizing DL technology. Gao et al. [15] utilized 3D block-based residual DL system for predicting tuberculosis disease levels in CT pulmonary image. Pannu et al. [16] developed PSO-relied ANFIS for the enhancement of classification rate. Zeng et al. [17] executed Gated bi-directional CNN (GCNN). GCNN was applied from the classification of patients whether affected with COVID-19 or not.
Dorgham et al. [18] intended to improve the security of communication and storage of medical images in cloud with the help of hybrid encryption techniques. In this study, symmetric and asymmetric encryption algorithms were incorporated. Due to this, a fast and secure encryption process was executed. Besides, three diverse techniques were selected in this study to build the model and security was increased utilizing digital signature approach. In literature [19], a secure image fusion approach was presented to preserve the privacy and protect copyright. In this study, two cloud services were utilized to eliminate the need for Trusted Third Party (TTP). Gudivada et al. [20] developed an efficient model to develop, maintain and utilize the models that can improve the healthcare sector. The goal of the study is to offer resources that can be utilized in the development of resembling models and deploying it in healthcare sector. As per the literature [21], Denotational Mathematics can act as an effective technique to model and control the DL network. Thus, it enhances the quality of healthcare decision making. Ghoneim et al. [22] presented an effective medical image forgery detection system for medical field to ensure that the images relevant to medical field remains unchanged. Goléa et al. [23] presented a ROI based fragile watermarking method to detect the tampering of medical images. It is based on the network transmitted, where the sent message is split as packets whereas the redundant data is appended for treating the errors.
To summarize, it is identified that the DL approach accomplishes better outcomes to COVID-19 disease classification in chest CT scan image. DL methods might attain optimal results; hence the results could be maximized in future with the help of effective feature extraction models like participants of ResNet. In addition, hyper-tuning of DL methods could be accomplished with the help of transfer learning too. Thus, the establishment of new Deep Transfer Learning (DTL) based COVID-19 patient classification method forms a significant inspiration for current study.
Fig. 1 illustrates the working principle of proposed OHFE-ODNN technique. As shown, the input images are pre-processed using MF manner. Then, the hybrid set of OGLCM and HOG features are extracted. Finally, ODNN is applied with SSA to classify the feature set into different classes in the applied X-ray chest image.
MF technique is defined as non-linear signal process model that depends upon recent statistics. MF result is defined as
where
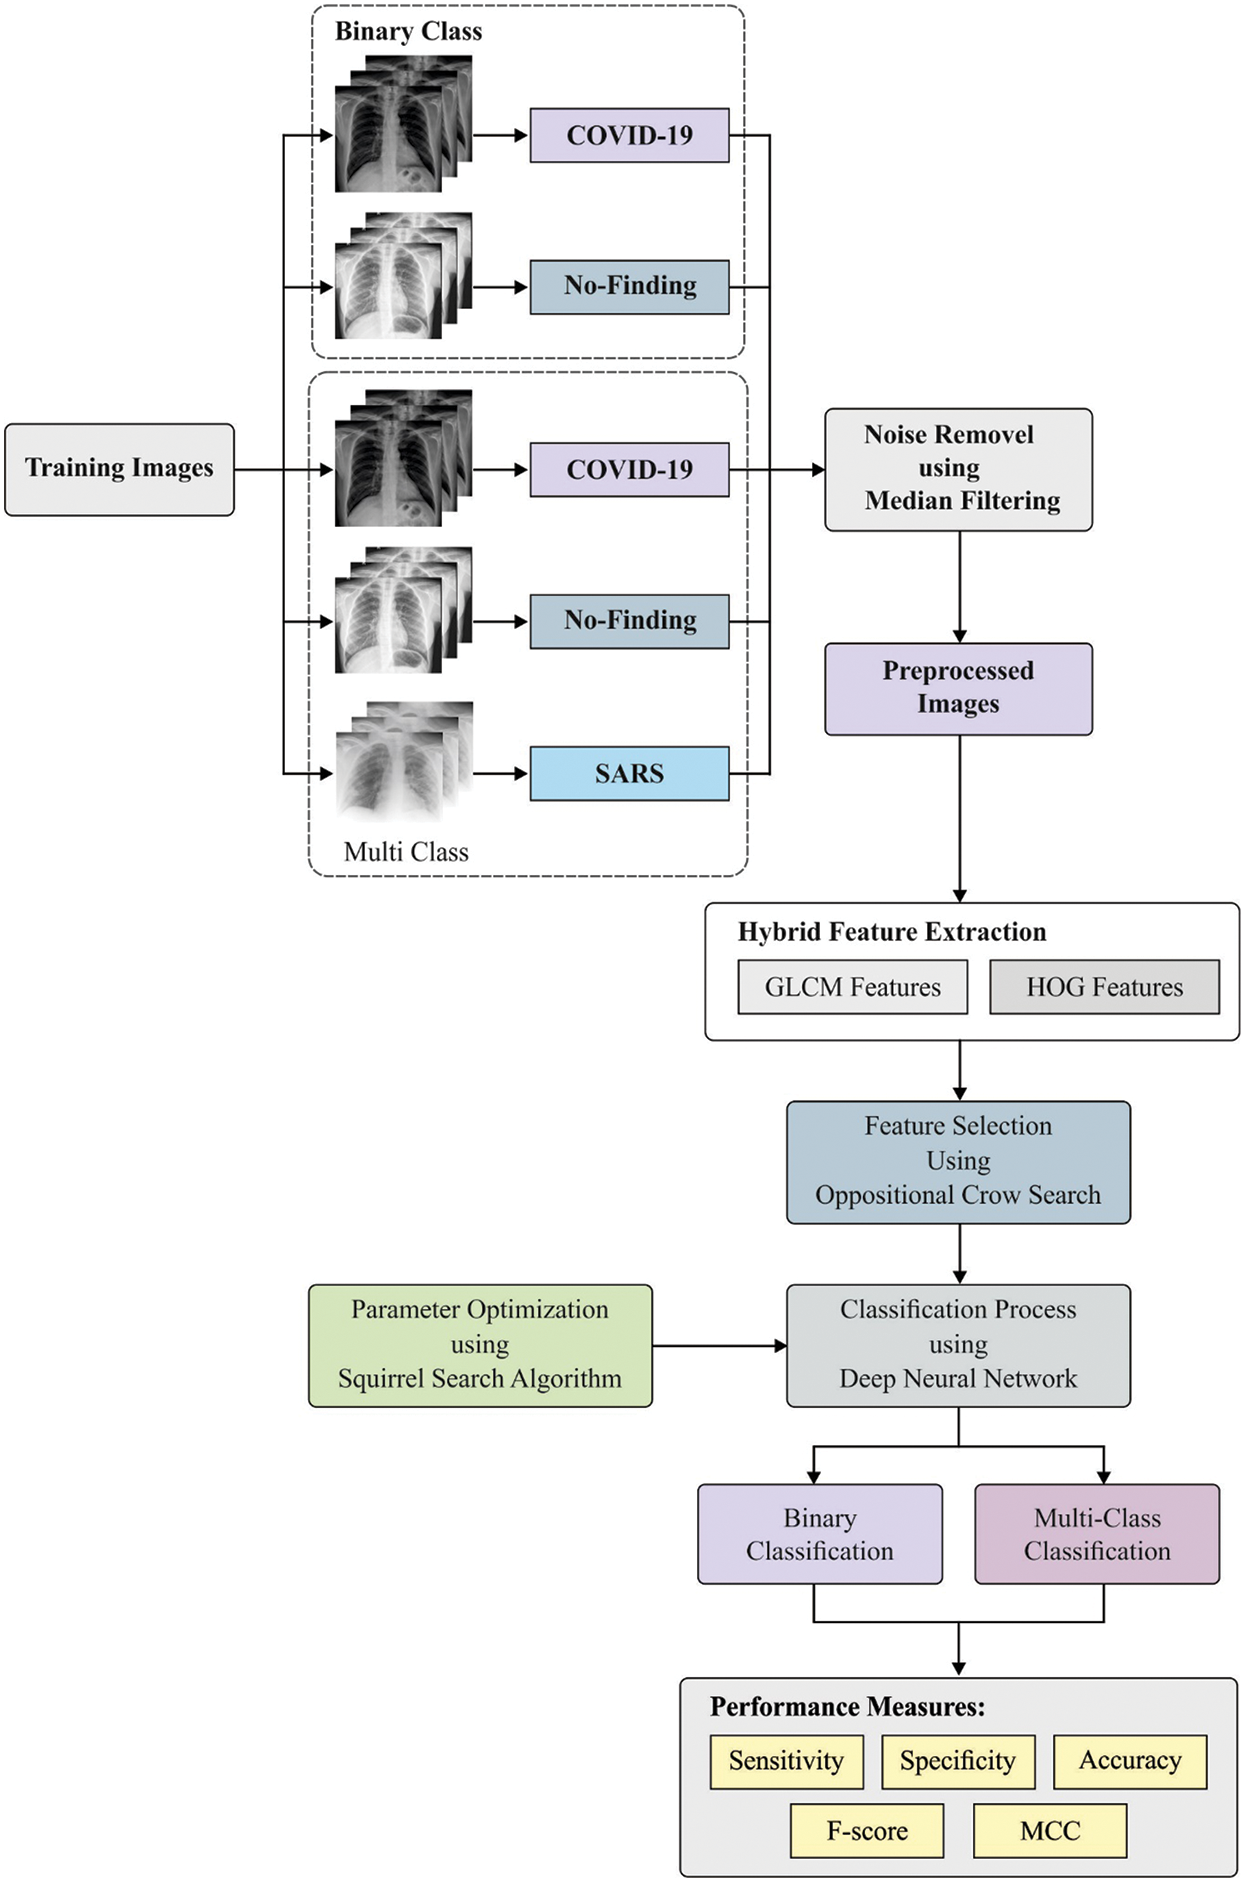
Figure 1: Overall process of the proposed model
When (1) and (2) are compared, it can be inferred that the MF functions are based on two objectives namely the size of mask and noise distribution. MF eliminates the noise considerably, when compared to average filtering. The function of MF is to maximize, when the MF method is integrated with average filtering model.
3.2 Optimal Hybrid Feature Extraction
OHFE model performs feature extraction process upon the preprocessed image, where OGLCM and HOG features are integrated together.
A major element in HOG feature was applicable for containing the local procedure of object. The indifference of object conversions and brightness state are to be considered as edge and data-based gradients which are estimated under the application of various coordinate-HOG feature vector. A normal expression, applied in processing gradient point, is depicted in Eq. (3):
Image prediction windows are characterized as different spatial areas and are termed as ‘cells’. At last, the magnitude of gradients (x, y) is demonstrated in Eq. (4).
The edge orientation of the point (x, y) was illustrated in Eq. (5):
Here, Gx and Gy imply the horizontal and vertical directions of the gradients. To improve brightness and noise, a normalized operation is computed next to the determination of histogram values. In contrast, the computation of normalization can be employed and the local histograms can be validated. In comparison with normalization, L2-norm predicts the existence of cancer effectively. The blocks of normalized HOG are showcased in Eq. (6).
where e depicts a small positive score applied in regularization, f represents the feature vector, h indicates the non-normalized vector, and
In general, ‘texture’ is defined as the duplicated pattern of local difference present in image intensity. The application of co-occurrence matrix depends upon the identity of grey-level deployment that is applied in texture detection [24]. It is also modified using dense and fine textures, when compared with incomplete textures.
Based on the measures of intensities for all integrations, statistics is categorized as 1st order, 2nd order and higher-order statistics. In this approach,
3.2.3 Optimal Feature Selection Using OCS Algorithm
Under the application of texture features such as GLCM and GLRLM, the optimal subset of features is obtained from pre-processing the clinical image. The actual features extracted are not provided for classification, as it consumes the maximum processing time for implementation. Thus, the optimal FS method needs to be selected in which the important features are decided with the help of optimization algorithm named OCS. The developer in literature [25] has introduced a CS method based on crow's behavior in terms of concealing and consuming the food. With respect to crow's hierarchy, the characteristics of CSA are detailed herewith.
■ It is a form of flock
■ It conserves the place, where it hides the food
■ In order to steal, they always fly in rows by following one another
■ By possibility, it protects the caches and prevents it from pilfered.
The actual as well as novel places of 2 crows are shown in Fig. 2.
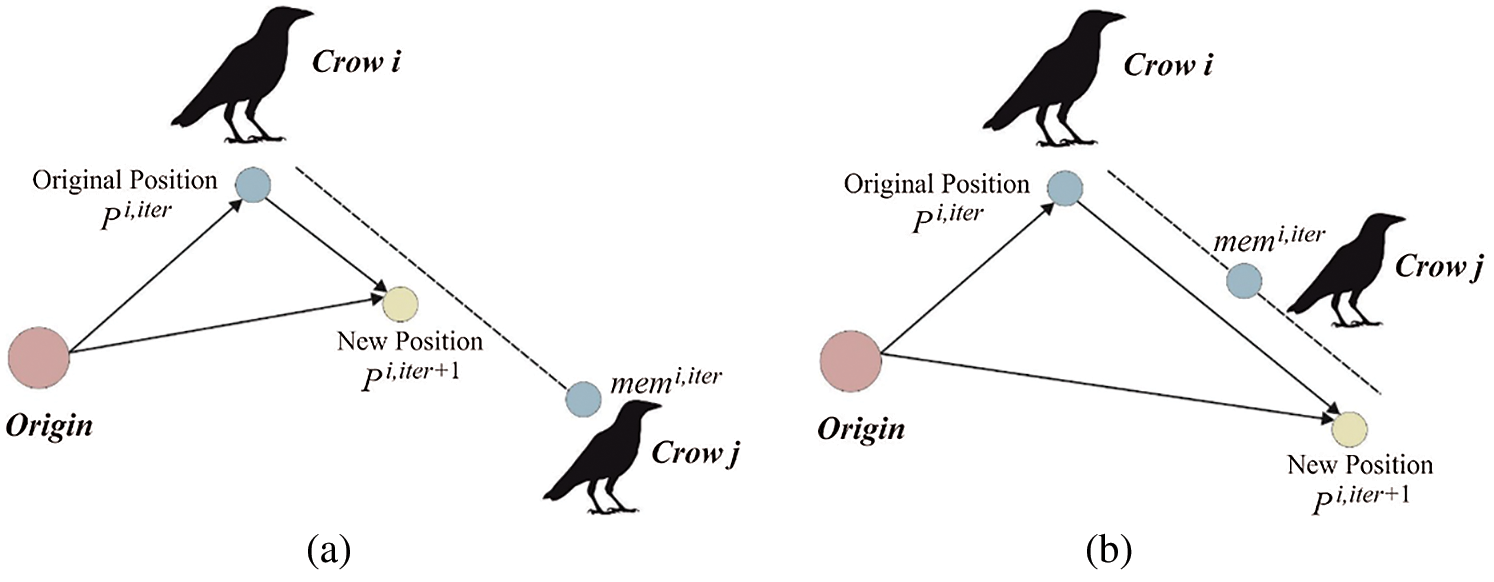
Figure 2: Inspiration of CSA. (a) If (f1 < 1) (b) if (f1 > 1)
In order to improve the classical CS method, contrast task is applied. For all the invoked solutions, the neighboring direction begins to operate. By comparing the solutions, optimal solutions can be accomplished.
The population of crows should be declared i.e., the features obtained from clinical image in terms of
When the solutions are compared, the optimal one can be chosen as the primary solution. For instance, suppose
The Fitness Function (FF) of OCS method is defined according to the main purpose of this study. In this approach, optimization is carried out for accomplishing the optimal features from the applied dataset images.
When generating a new position, a crow is randomly considered so that it can be developed as a new position under selection of the flock of crows, where the crow ‘
The maximization of Eq. (10) is defined as follows:
The position and storage measures of the recently extended crow are calculated based on Eq. (11).
It has been clear that the fitness score to a novel position of crow was superlative in previous place. Usually, a crow tries to maximize its storage space by selecting a new position. When iterations reach the maximum value, the optimum place of storage equivalent to the objective with better result of the extracted features. The well-known patterns of OCS method are depicted in Fig. 3.
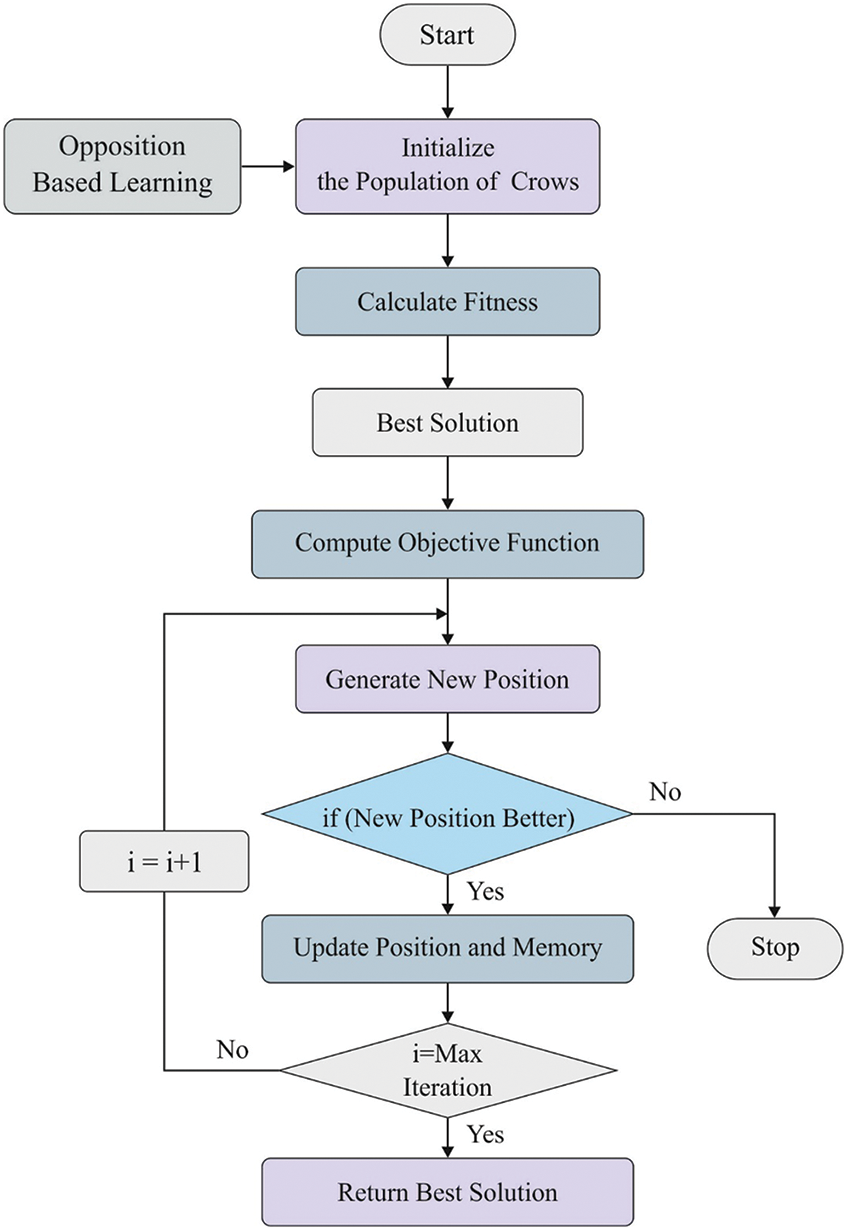
Figure 3: Opposition based crow search algorithm
DNN model is comprised of 3 major elements like input, resultant, and hidden layers. During training stage, DNN maximizes the weight of nodes in hidden states using SSA. The NN frequently fits the labeled training information's solution boundary due to the progressive growth in training iterations. In order to enhance the speed of training process, DNN, classification accuracy, and 2 hidden states are developed. During the hidden state, overall nodes are determined by applying Eq. (12).
where, the count of input state nodes are represented, and the count of resultant layer nodes are depicted as b, the count of hidden state nodes are denoted as n and a constant value from 1 and 10 is represented as c. The conv1 layer gets an input of 112 × 112 with 7 × 7, stride 2.
In order to activate the ability of non-linear fitness, an activation function was comprised in the hidden state of DNN. Here, it applies the sigmoid as activation function which is defined as follows
The input data of a system is named as x which is enabled using a mapping function,
where,
where
Cross Entropy (CE) was applied as a loss function of DNN which is considered to be the configuration of training and testing. The application of CE does not apply the function of sigmoid as well as softmax output frameworks. The loss of CE is determined using Eq. (16).
where, n implies the volume of training sample,
When enhancing the fitness of the population, the solution value becomes highly significant with SSA. When the values are upgraded, this model shows the fitness value to be shifted towards the optimal result. Besides, the novel and existing results are related to each other. Subsequently, the upcoming iteration achieve better results. Furthermore, it needs the stimulation of population size and count of iterations that result in the execution of the method. It becomes a leading one, when compared to optimized models in terms of minimum processing complexity, time as well as rapid convergence speed. The execution of this method is consolidated in the upcoming sections.
First, initiate the population size, count of iterations as well as the termination condition. Based on the population, optimal and poor solutions are computed by means of objective function. The present solution depends upon the optimal and inferior solutions which have to be modified by applying Eq. (17).
where
SSA method has been used herewith for parameter tuning in DNN as per the literature [27–30]. SSA approach is developed from the foraging behavior of flying squirrels. This is an efficient approach applied by such small animals to migrate far away. When the weather is warm, a squirrel changes its location by jumping from trees in the forest and find the food. It often consumes acorn nuts from which it acquires the energy required for its functioning. Next, it explores for hickory nuts which are better than acorn nut. It saves those nuts for winter season. In case of cold weather, the squirrels become highly vulnerable and survive with energy-rich foods. Followed by, if the weather again changes into warm, squirrels become powerful and effective. Previous strategies are followed in warm season for the exploration of food. Based on food foraging hierarchy of squirrels [31], optimal SSA is developed iteratively in mathematical manner.
There are some significant attributes in SSA namely, maximum value of iteration
3.4.2 Location Initialization Phase
The location of squirrels is loaded randomly from the searching space as shown below:
where rand
Then, the quality of food sources is calculated under the application of fitness measure of a squirrels’ location as depicted herewith.
Besides, the organization of food source is processed. It is composed of three types of trees like, oak tree (acorn nuts), hickory tree, and normal tree. The optimum food source (low fitness) was assumed that the hickory nut tree
The 3 states that represent the dynamic gliding strategy of squirrels are determined as follows.
Scenario 1. The squirrels reside in acorn nut tree jumps to hickory nut tree. Based on this scenario, a novel place is developed in the following way.
where
Scenario 2. Squirrels that reside in normal tree go to acorn nut trees to gather the required food. A new position is deployed using the given function:
where
Scenario 3. Any squirrel on normal tree go to hickory nut tree, if it meets the routine objective. At this point, a novel location of the squirrel was established as provided below.
where
3.4.4 Seasonal Monitoring Criteria Validation
The foraging nature of the flying squirrels depend upon the varying seasons. Hence, seasonal observation should be done so that the trapping can be eliminated in local optimum outcome. The seasonal constant
For
where Lévy distribution is a highly remarkable device applied for improving the global searching to optimized models:
This method traps, if the maximum constraints are satisfied. Otherwise, the nature of developing new place and approving the seasonal observation should be followed repeatedly.
The performance of the proposed OHFE-ODNN method was tested utilizing a set of chest X-ray [32] image dataset including 220 images from COVID-19 positive patients, 27 Normal patients and 11 images from SARS-11 positive patients. Some of the test images are displayed in Fig. 4. The parameters contained in the simulation procedure are learning rate: 0.0001, momentum: 0.9, batch size: 128 and epoch count: 140.
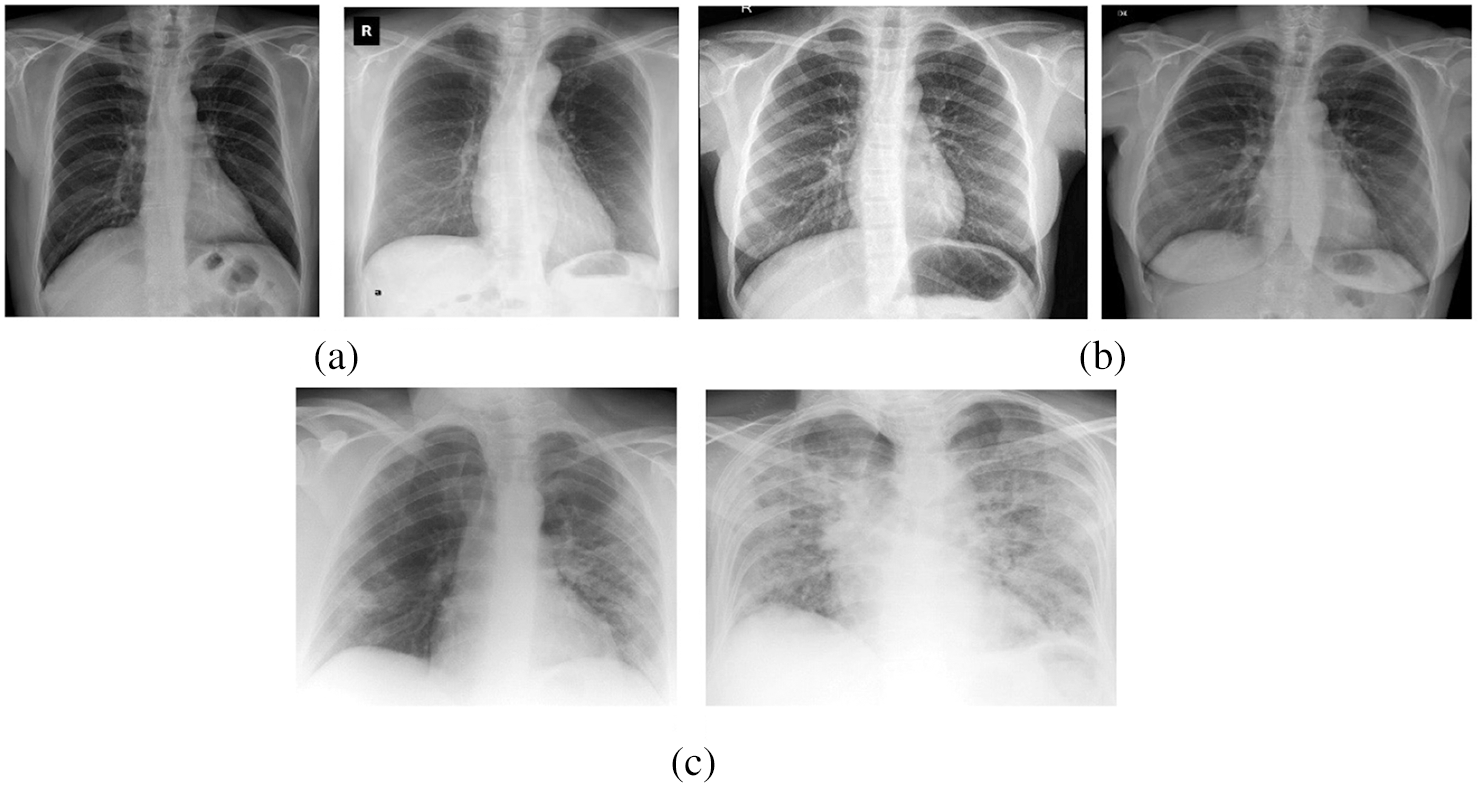
Figure 4: (a) Covid-19 (b) normal (c) SARS
Fig. 5 demonstrates the confusion matrix generated by OHFE-ODNN method on the classifier of binary classes under five runs. During run 1, it is noted that OHFE-ODNN model achieved a TP of 212, TN of 23, FP of 8 and an FN of 4. In run 2, it is evident that OHFE-ODNN method accomplished a TP of 210, TN of 22, FP of 10 and an FN of 5. While at run 3, it is pointed that the proposed OHFE-ODNN approach obtained a TP of 209, TN of 21, FP of 11 and an FN of 6. During run 4, it is clear that the proposed OHFE-ODNN technique reached a TP of 212, TN of 20, FP of 8 and an FN of 7. At run 5, it is depicted that OHFE-ODNN approach attained a TP of 211, TN of 21, FP of 9 and an FN of 6.
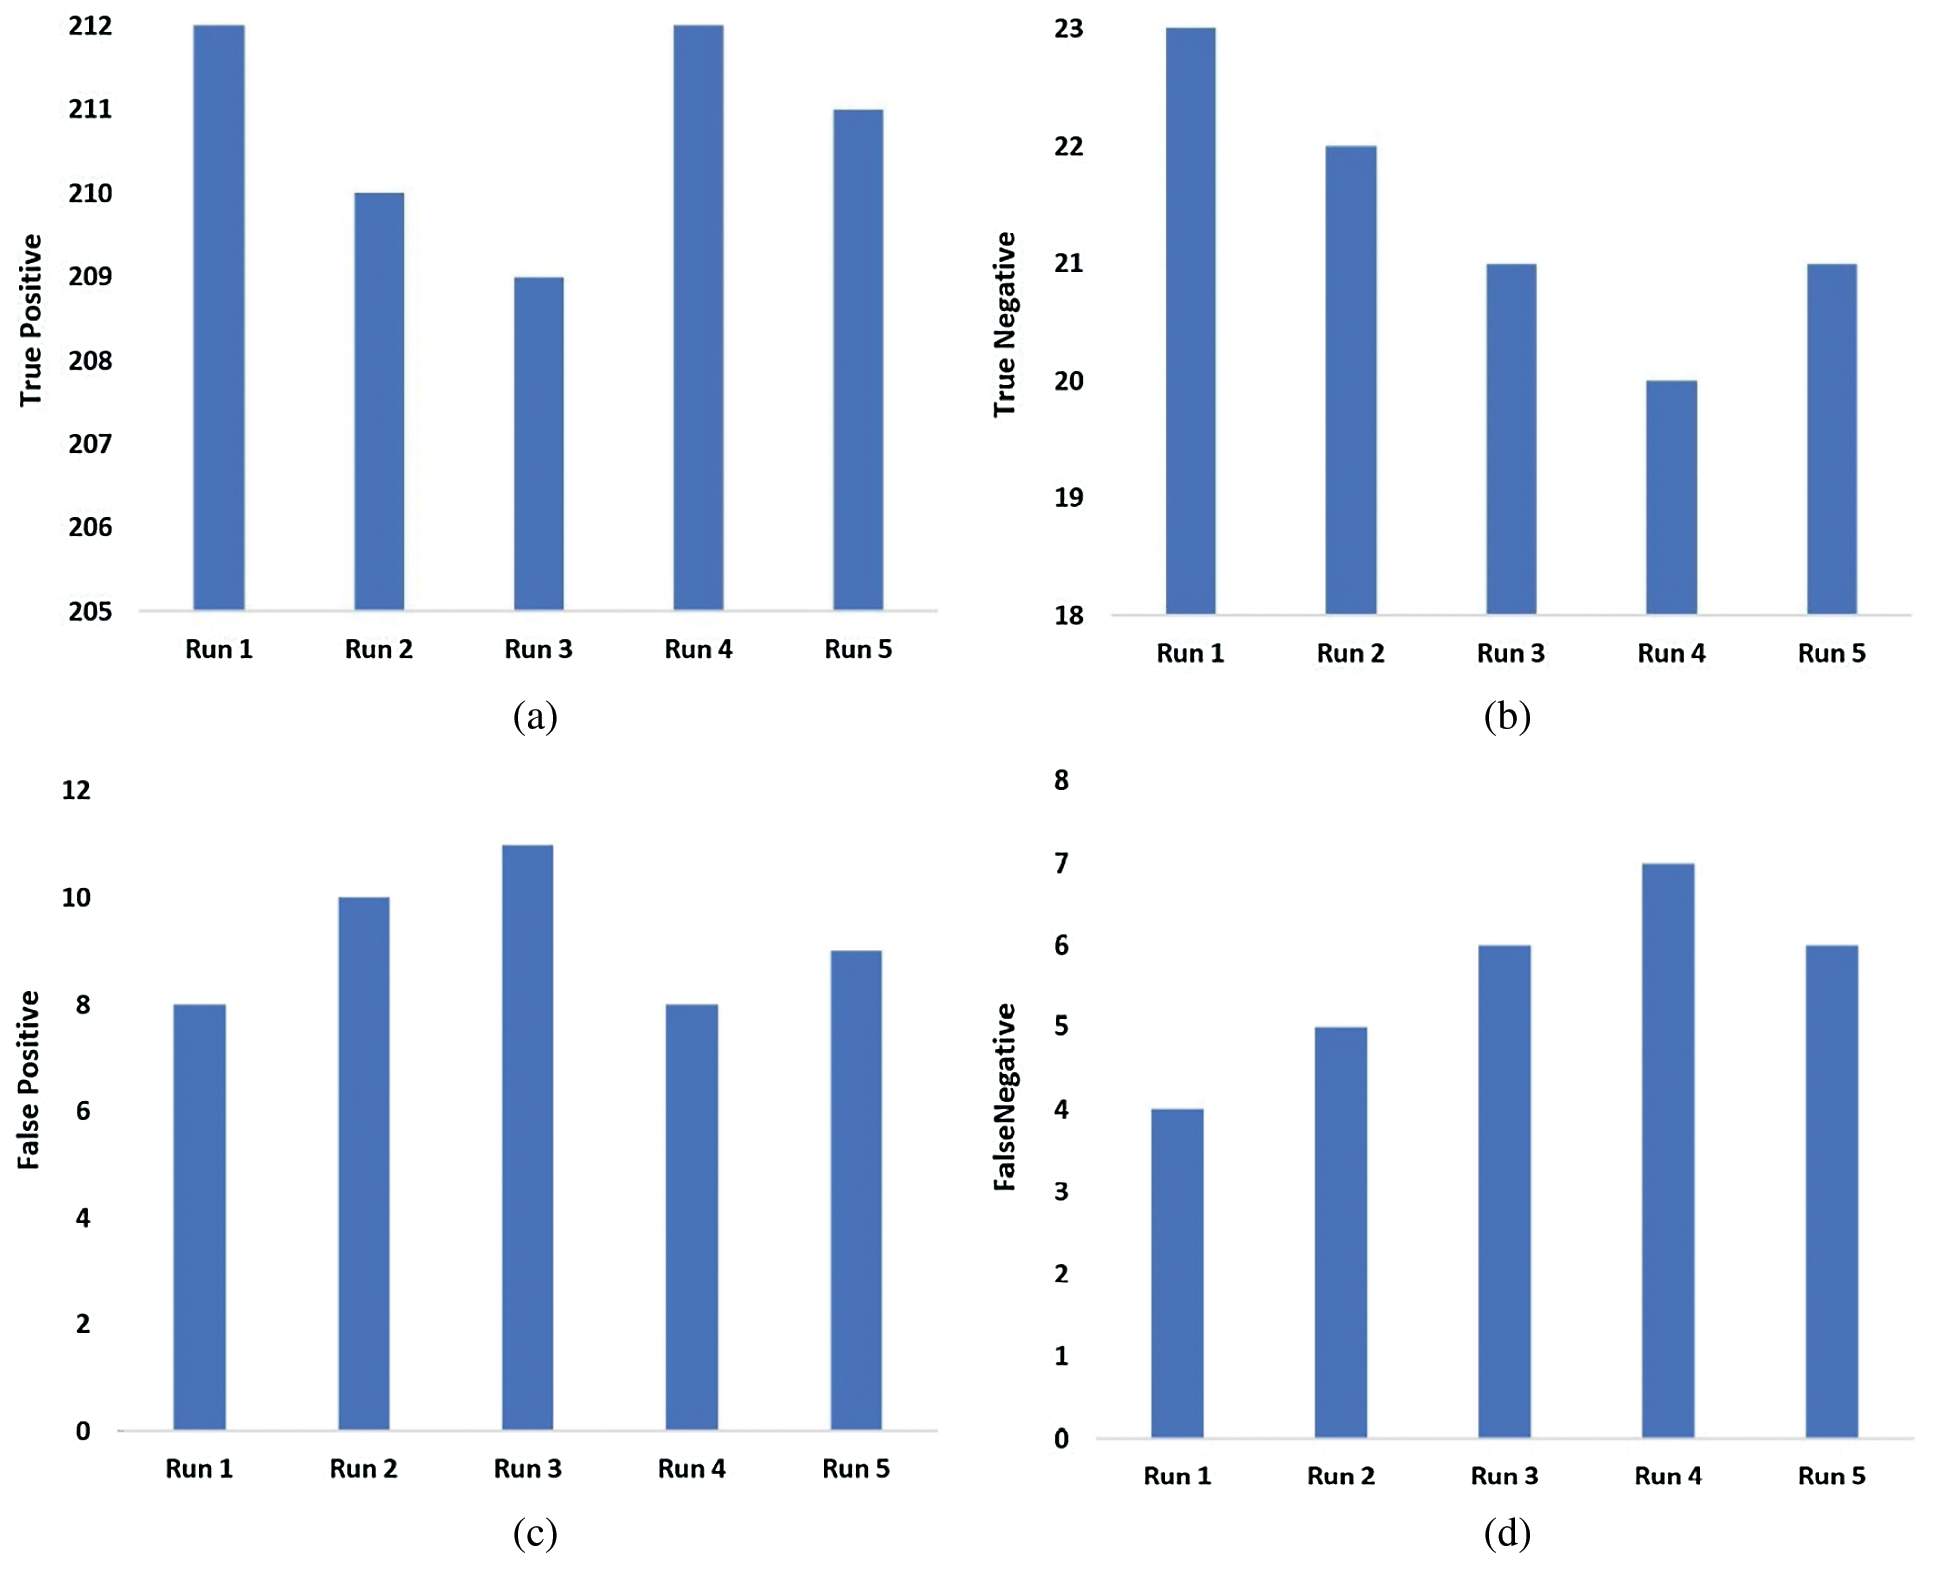
Figure 5: (a) True positive (b) True negative (c) False positive (d) False negative
Fig. 6 shows the binary classification outcomes of the proposed OHFE-ODNN model under varying measures and distinct number of runs. Under run 1, the proposed OHFE-ODNN technique reached a maximum sens. of 98.14%, spec. of 74.19%, prec. of 96.36%, acc. of 95.14%, F1-score of 97.25%, and MCC of 76.81%. Under the implementation of run 2, the presented OHFE-ODNN method accomplished an optimal sens. of 97.67%, spec. of 68.75%, prec. of 95.45%, acc. of 93.93%, F1-score of 96.55%, and MCC of 71.49%. At run 3, the projected OHFE-ODNN approach achieved a high sens. of 97.21%, spec. of 65.63%, prec. of 95%, acc. of 93.12%, F1-score of 96.09%, and MCC of 67.62%. When the experiment was conducted at run 4, the developed OHFE-ODNN approach accomplished a high sens. of 96.80%, spec. of 93.93%, prec. of 96.36%, acc. of 93.93%, F1-score of 96.58%, and MCC of 69.33%. Under the execution of run 5, the applied OHFE-ODNN technique obtained a better sens. of 97.24%, spec. of 70%, prec. of 95.91%, acc. of 93.92%, F1-score of 96.57%, and MCC of 70.39%.
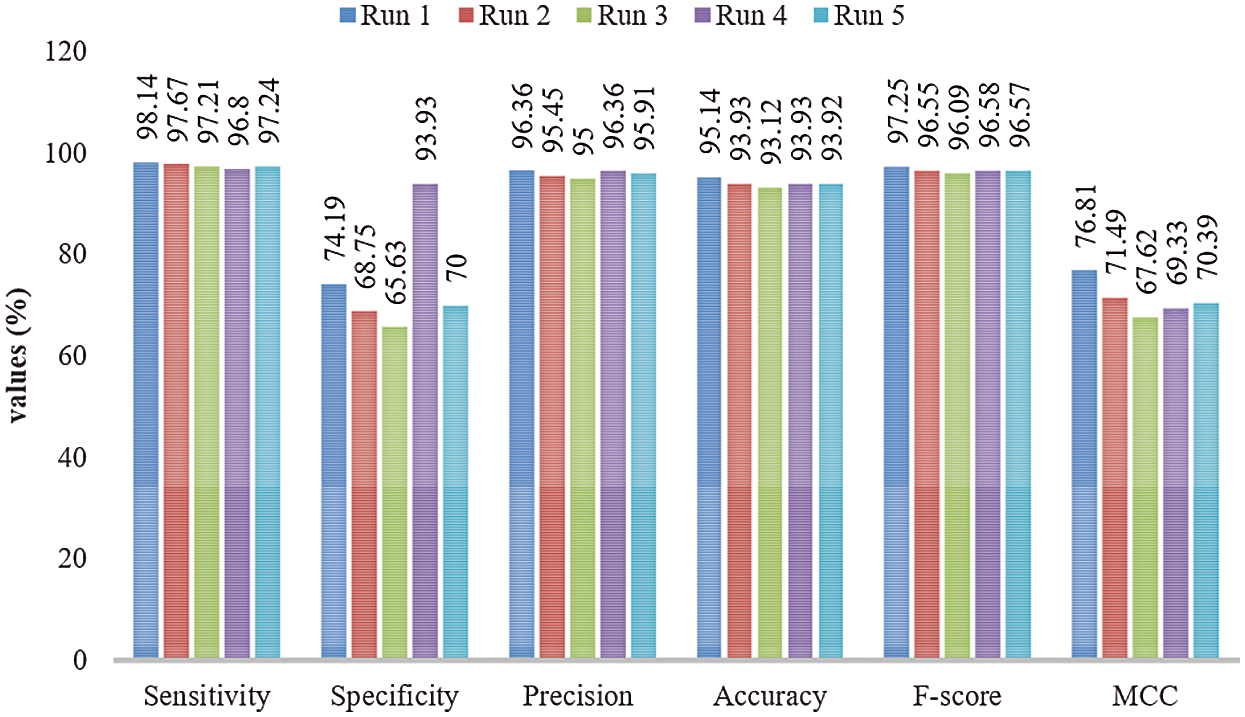
Figure 6: Binary classification analysis of OHFE-ODNN model with different measures
Fig. 7 shows the multi classification result of the proposed OHFE-ODNN approach with respect to diverse scores, under various runs. At run 1, the presented OHFE-ODNN scheme accomplished a higher sens. of 95.67%, spec. of 87.30%, prec. of 93.40%, acc. of 95.90%, F1-score of 95.36%, and MCC of 84.56%. Under the execution of run 2, the projected OHFE-ODNN technique achieved an optimal sens. of 96.89%, spec. of 89.12%, prec. of 96.80%, acc. of 94.60%, F1-score of 95.32%, and MCC of 83.47%. Under the implementation of run 3, the deployed OHFE-ODNN technology gained a high sens. of 94.50%, spec. of 92.40%, prec. of 95.20%, acc. of 95.33%, F1-score of 96.54%, and MCC of 85.23%. Under the execution of run 4, the deployed OHFE-ODNN framework obtained a maximal sens. of 96.82%, spec. of 92.34%, prec. of 96.83%, acc. of 96.70%, F1-score of 96.33%, and MCC of 84.84%. Under the representation of run 5, the implied OHFE-ODNN technique reached a better sens. of 95.30%, spec. of 91.39%, prec. of 95.92%, acc. of 95.47%, F1-score of 95.09%, and MCC of 85.31%.
Fig. 8 illustrates the results of average analysis of OHFE-ODNN approach under different measures. The figure states that the proposed OHFE-ODNN technique performed binary classification with a sens. of 97.41%, spec. of 74.5%, prec. of 95.82%, acc. of 94.01%, F1-score of 96.61% and MCC of 71.13%. Similarly, OHFE-ODNN model exhibited better multiclass classification with a sens. of 95.84%, spec. of 90.51%, prec. of 95.63%, acc. of 95.6%, F1-score of 95.73% and MCC of 84.68%.
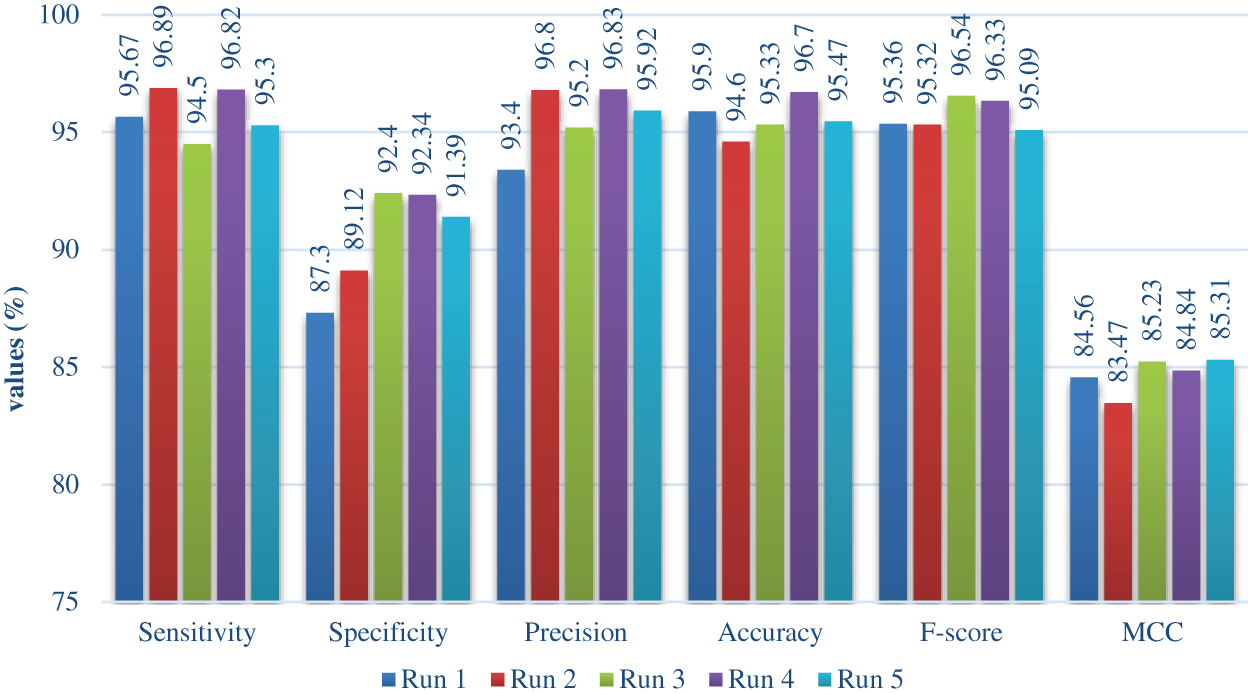
Figure 7: Multi classification analysis of OHFE-ODNN method with varying measures
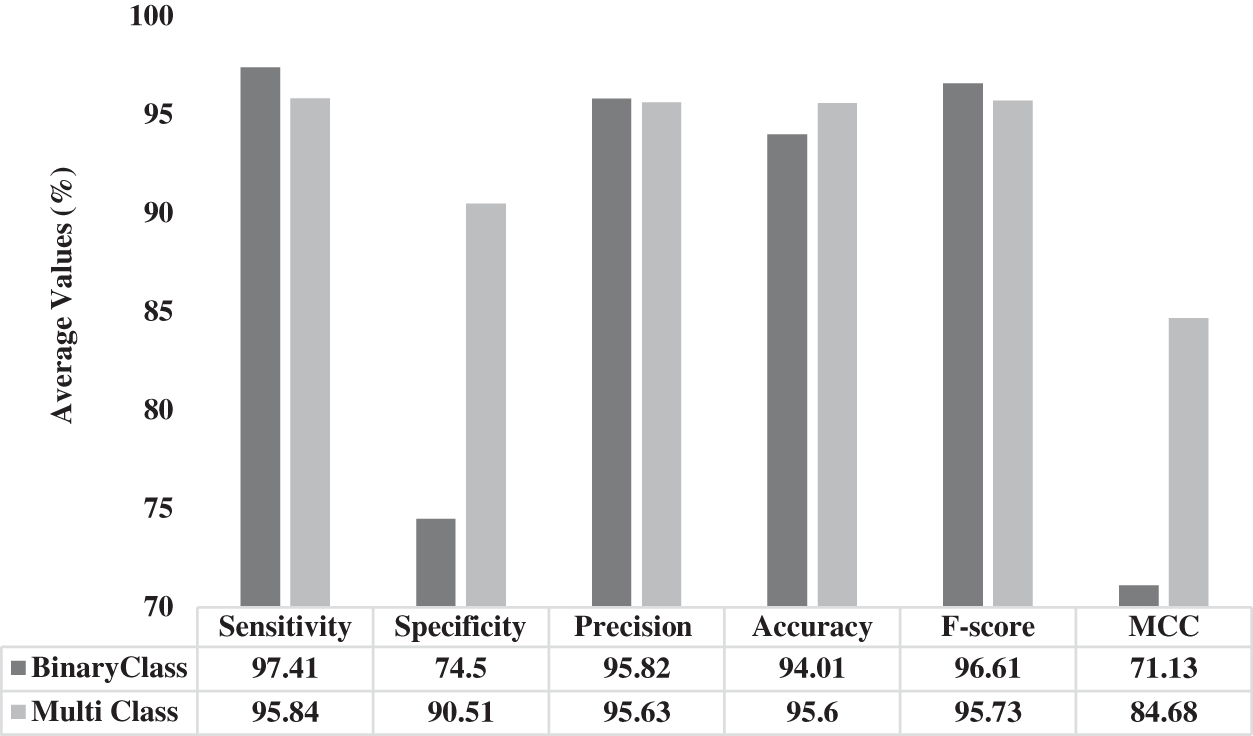
Figure 8: Average analysis of OHFE-ODNN model under different measures
The current research work developed an automated COVID-19 analysis model utilizing OHFE-ODNN technique in chest x-ray images. The input images are pre-processed using MF approach. Then, the hybrid set of OGLCM and HOG features are extracted. Finally, ODNN with SSA was executed for classifying the feature set as to distinct classes in the applied X-ray chest images. OHFE is a combination of optimal GLCM and HOG features, where the optimal set of features are chosen by OCS algorithm. ODNN model includes SSA to fine tune the parameters of DNN. The experimental results validated the supremacy of the proposed OHFE-ODNN model since it gained a maximum accuracy of 94.01% and 95.60% on binary and multi-class classification of chest X-ray images.
Acknowledgement: The authors would like to acknowledge the support of Prince Sultan University, Riyadh, Saudi Arabia for partially supporting this project and for paying the Article Processing Charges (APC) of this publication.
Funding Statement: The authors extend their appreciation to the Deanship of Scientific Research at King Khalid University for funding this work under Grant Number (RGP.1/172/42). https://www.kku.edu.sa.
Conflicts of Interest: The authors declare that they have no conflicts of interest to report regarding the present study.
1. K. V. Holmes, “SARS-associated coronavirus,” New England Journal of Medicine, vol. 348, no. 20, pp. 1948–1951, May 2003. [Google Scholar]
2. P. Romagnani, G. Gnone, F. Guzzi, S. Negrini, A. Guastalla et al., “The COVID-19 infection: Lessons from the Italian experience,” Journal of Public Health Policy, vol. 41, no. 3, pp. 238–244, 2020. [Google Scholar]
3. M. Y. Ng, E. Y. Lee, J. Yang, F. Yang, X. Li et al., “Imaging profile of the COVID-19 infection: Radiologic findings and literature review,” Radiology: Cardiothoracic Imaging, vol. 2, no. 1, pp. e200034, Feb. 2020. [Google Scholar]
4. Y. Yu, H. Lin, J. Meng, X. Wei, H. Guo et al., “Deep transfer learning for modality classification of medical images,” Information, vol. 8, no. 3, pp. 91, 2017. [Google Scholar]
5. P. Nardelli, D. J. Carretero, D. B. Pelaez, G. R. Washko, F. N. Rahaghi et al., “Pulmonary artery–vein classification in ct images using deep learning,” IEEE Transactions on Medical Imaging, vol. 37, no. 11, pp. 2428–2440, 2018. [Google Scholar]
6. H. Shin, H. R. Roth, M. Gao, L. Lu, Z. Xu et al., “Deep convolutional neural networks for computer-aided detection: Cnn architectures, dataset characteristics and transfer learning,” IEEE Transactions on Medical Imaging, vol. 35, no. 5, pp. 1285–1298, 2016. [Google Scholar]
7. Y. Xie, Y. Xia, J. Zhang, Y. Song, D. Feng et al., “Knowledge-based collaborative deep learning for benign-malignant lung nodule classification on chest ct,” IEEE Transactions on Medical Imaging, vol. 38, no. 4, pp. 991–1004, 2019. [Google Scholar]
8. J. R. Hagerty, R. J. Stanley, H. A. Almubarak, N. Lama, R. Kasmi et al., “Deep learning and handcrafted method fusion: Higher diagnostic accuracy for melanoma dermoscopy images,” IEEE Journal of Biomedical and Health Informatics, vol. 23, no. 4, pp. 1385–1391, Jul. 2019. [Google Scholar]
9. S. E. Gerard, T. J. Patton, G. E. Christensen, J. E. Bayouth and J. M. Reinhardt, “FissureNet: A deep learning approach for pulmonary fissure detection in ct images,” IEEE Transactions on Medical Imaging, vol. 38, no. 1, pp. 156–166, Jan. 2019. [Google Scholar]
10. A. A. A. Setio, F. Ciompi, G. Litjens, P. Gerke, C. Jacobs et al., “Pulmonary nodule detection in ct images: False positive reduction using multi-view convolutional networks,” IEEE Transactions on Medical Imaging, vol. 35, no. 5, pp. 1160–1169, May 2016. [Google Scholar]
11. K. Xia, H. Yin, P. Qian, Y. Jiang and S. Wang, “Liver semantic segmentation algorithm based on improved deep adversarial networks in combination of weighted loss function on abdominal ct images,” IEEE Access, vol. 7, pp. 96349–96358, 2019. [Google Scholar]
12. A. Pezeshk, S. Hamidian, N. Petrick and B. Sahiner, “3-D convolutional neural networks for automatic detection of pulmonary nodules in chest ct,” IEEE Journal of Biomedical and Health Informatics, vol. 23, no. 5, pp. 2080–2090, 2019. [Google Scholar]
13. M. Zreik, R. W. v. Hamersvelt, J. M. Wolterink, T. Leiner, M. A. Viergever et al., “A recurrent cnn for automatic detection and classification of coronary artery plaque and stenosis in coronary ct angiography,” IEEE Transactions on Medical Imaging, vol. 38, no. 7, pp. 1588–1598, Jul. 2019. [Google Scholar]
14. A. Bhandary, G. A. Prabhu, V. Rajinikanth, K. P. Thanaraj, S. C. Satapathy et al., “Deep-learning framework to detect lung abnormality–A study with chest X-ray and lung CT scan images,” Pattern Recognition Letters, vol. 129, pp. 271–278, Jan. 2020. [Google Scholar]
15. X. W. Gao, C. J. Reynolds and E. Currie, “Analysis of tuberculosis severity levels from CT pulmonary images based on enhanced residual deep learning architecture,” Neurocomputing, vol. 392, pp. 233–244, 2020. [Google Scholar]
16. H. S. Pannu, D. Singh and A. K. Malhi, “Improved particle swarm optimization based adaptive neuro-fuzzy inference system for benzene detection,” Clean-Soil, Air, Water, vol. 46, no. 5, pp. 1700162, 2018. [Google Scholar]
17. X. Zeng, W. Ouyang, B. Yang, J. Yan and X. Wang, “Gated bi-directional CNN for object detection,” in European Conf. on Computer Vision, Cham, Springer, pp. 354–369, 2016. [Google Scholar]
18. O. Dorgham, B. A. Rahamneh, A. Almomani, M. A. Hadidi and K. F. Khatatneh, “Enhancing the security of exchanging and storing dicom medical images on the cloud,” International Journal of Cloud Applications and Computing, vol. 8, no. 1, pp. 154–172, 2018. [Google Scholar]
19. A. Kumar, “Design of secure image fusion technique using cloud for privacy-preserving and copyright protection,” International Journal of Cloud Applications and Computing, vol. 9, no. 3, pp. 22–36, 2019. [Google Scholar]
20. A. Gudivada, J. Philips and N. Tabrizi, “Developing concept enriched models for big data processing within the medical domain,” International Journal of Software Science and Computational Intelligence (IJSSCI), vol. 12, no. 3, pp. 55–71, 2020. [Google Scholar]
21. J. Sarivougioukas and A. Vagelatos, “Modeling deep learning neural networks with denotational mathematics in ubihealth environment,” International Journal of Software Science and Computational Intelligence, vol. 12, no. 3, pp. 14–27, 2020. [Google Scholar]
22. A. Ghoneim, G. Muhammad, S. U. Amin and B. Gupta, “Medical image forgery detection for smart healthcare,” IEEE Communications Magazine, vol. 56, no. 4, pp. 33–37, 2018. [Google Scholar]
23. N. E. H. Goléa and K. E. Melkemi, “ROI-Based fragile watermarking for medical image tamper detection,” International Journal of High Performance Computing and Networking, vol. 13, no. 2, pp. 199, 2019. [Google Scholar]
24. N. H. Rajini and R. Bhavani, “Computer aided detection of ischemic stroke using segmentation and texture features,” Measurement, vol. 46, no. 6, pp. 1865–1874, 2013. [Google Scholar]
25. R. J. S. Raj, S. J. Shobana, I. V. Pustokhina, D. A. Pustokhin, D. Gupta et al., “Optimal feature selection-based medical image classification using deep learning model in internet of medical things,” IEEE Access, vol. 8, pp. 58006–58017, 2020. [Google Scholar]
26. S. Ramesh and D. Vydeki, “Recognition and classification of paddy leaf diseases using optimized deep neural network with jaya algorithm,” Information Processing in Agriculture, vol. 7, no. 2, pp. 249–260, 2020. [Google Scholar]
27. K. Shankar, E. Perumal, V. G. Díaz, P. Tiwari, D. Gupta et al., “An optimal cascaded recurrent neural network for intelligent COVID-19 detection using chest X-ray images,” Applied Soft Computing, vol. 113, pp. 107878, 2021. [Google Scholar]
28. K. Shankar, S. N. Mohanty, K. Yadav, T. Gopalakrishnan and A. M. Elmisery, “Automated COVID-19 diagnosis and classification using convolutional neural network with fusion based feature extraction model,” in Cognitive Neurodynamics, US: Springer, Sep. 2021. [Google Scholar]
29. K. Shankar, E. Perumal, P. Tiwari, M. Shorfuzzaman and D. Gupta, “Deep learning and evolutionary intelligence with fusion-based feature extraction for detection of COVID-19 from chest X-ray images,” in Multimedia Systems, US: Springer, May 2021. [Google Scholar]
30. K. Shankar and E. Perumal, “A novel hand-crafted with deep learning features based fusion model for COVID-19 diagnosis and classification using chest X-ray images,” Complex & Intelligent Systems, vol. 7, no. 3, pp. 1277–1293, 2021. [Google Scholar]
31. T. Zheng and W. Luo, “An improved squirrel search algorithm for optimization,” Complexity, vol. 2019, pp. 1–31, 2019. [Google Scholar]
32. Dataset: https://github.com/ieee8023/covid-chestxray-dataset, 2021. [Google Scholar]
 | This work is licensed under a Creative Commons Attribution 4.0 International License, which permits unrestricted use, distribution, and reproduction in any medium, provided the original work is properly cited. |