DOI:10.32604/cmc.2022.023912
| Computers, Materials & Continua DOI:10.32604/cmc.2022.023912 | |
| Article |
Hydrodynamics and Heat Transfer Analysis of Airflow in a Sinusoidally Curved Channel
1Department of Mathematics and Social Sciences, Sukkur IBA University, Sukkur, 65200, Sindh, Pakistan
2Mathematics Department, Faculty of Science and Technology, Suan Dusit University, Bangkok, 10300, Thailand
3Department of Mathematics, Faculty of Applied Science, King Mongkut's University of Technology North Bangkok, Bangkok, 10800, Thailand
*Corresponding Author: Thanin Sitthiwirattham. Email: thanin_sit@dusit.ac.th
Received: 26 September 2021; Accepted: 10 November 2021
Abstract: For heat transfer enhancement in heat exchangers, different types of channels are often tested. The performance of heat exchangers can be made better by considering geometry composed of sinusoidally curved walls. This research studies the modeling and simulation of airflow through a
Keywords: Simulation of fluid flow; heat transfer; cosine function; wavy channel
| Nomenclature | |
| Velocity field of the fluid in two dimensions | |
| Outlet temperature | |
| x-component of velocity field | |
| Reynolds number | |
| y-component of velocity field | |
| Dynamic pressure | |
| Length of the channel | |
| Specific heat of air at constant pressure | |
| Period of vibration of boundaries | |
| Standard thermal conductivity of the air | |
| Amplitude of vibration boundaries | |
| Temperature in the domain | |
| Height of the contracted region | |
| Nusselt number | |
| Inlet velocity | |
| Average Nusselt number | |
| Inlet Temperature | |
| Prandtl Number | |
The wavy channels in which the contraction and expansion regions are created periodically is very essential in most of the devices for enhancing the heat distribution, pressure reduction, and maximizing the flow rate. Because of having the expansion and the contraction regions, the fluid passage through these channels attains an automatically created periodicity. Having the periodic variation in the cross-sectional area, the fluid gains a regime of fully developed that is quite different from those channels having the constant cross-sectional area. Fluid flow problems in the wavy channels are often studied to examine the separated flows in which separated vortices are formed in the expansion regions, patterns of the flow velocity, pressure patterns, and the temperature distribution due to the periodic variation. Due to the periodic variation in the parameters of the geometry, the pattern of the fluid movement is largely affected by the flow velocities, loss in pressure, and heat enhancements [1–4]. The wavy channels with the corrugated walls having the periodic expansion and contraction are widely studied in the many of the application like blood oxygenators [5,6], in the microfiltration cell [7], the wavy channels are also studied as the vortex generators to increase the thermal performance in solar panels [8,9]. There is a lot of work focused upon the fluid flow through sinusoidally curved wavy channels, details are given below:
In [10], the authors studied the laminar flow and thermal characteristics in the cavity composed of sinusoidal functions. It was discussed that due to the increase in the flow velocities, a large number of vortices are produced inside the cavities which might increase hydrodynamic and thermal enhancements in the channels. On examining the wavy channel [11] reported that when compared with the rectangular channel, the wavy types channel has the largest values of the friction factor and because of the reason the wavy channels are largely used for the cooling process. Investigating the flow pattern through the wavy channels [12] composed of sinusoidal functions with the parametric study for Reynolds number, it was reported that in the range of
Besides all these works there is much effort devoted by researchers in last few years in modeling nanofluids flows through different curvy geometries with application in energy storage, drug delivery, cancer treatment, tissue generation, readers are referred to the works [27–29]. In this paper, the hydrodynamics of airflow and heat transfer through a sinusoidally curved wavy channel is studied in detail. Section 2 presents the problem description. In Section 3, we present different mesh sizes and correlation analysis. The variation in flow variables including temperature distribution is observed by changing Reynolds number from 100 to 1000 and period of vibration of walls from 0 to 5. The problem is modeled in COMSOL Multiphysics 5.4 and solved using finite element method to obtain flow variables including temperature profile. Section 4 precisely discusses the results and presents a comparison analysis with the recently published work. A detailed parametric study using graphs is also carried out. In Section 5 we give the concluding remarks.
2.1 Geometrical Construction of the Wavy Channel
The current problem of the fluid flow and heat transfer is tested by making the open channel who's upper and lower boundaries are shaped up by using the cosine function see Fig. 1. Such geometries are creating the auto oscillation or vibration in a domain that generates hypes or contraction region in the channel which results increase the speed of the particles and reducing the dynamic pressure. The length of the channel is fixed of whereas the boundaries of the channel are vibrated with the period P. Here the boundary below of the channel is erected with the help of function and the lower boundary of the channel is erected by the function. Where
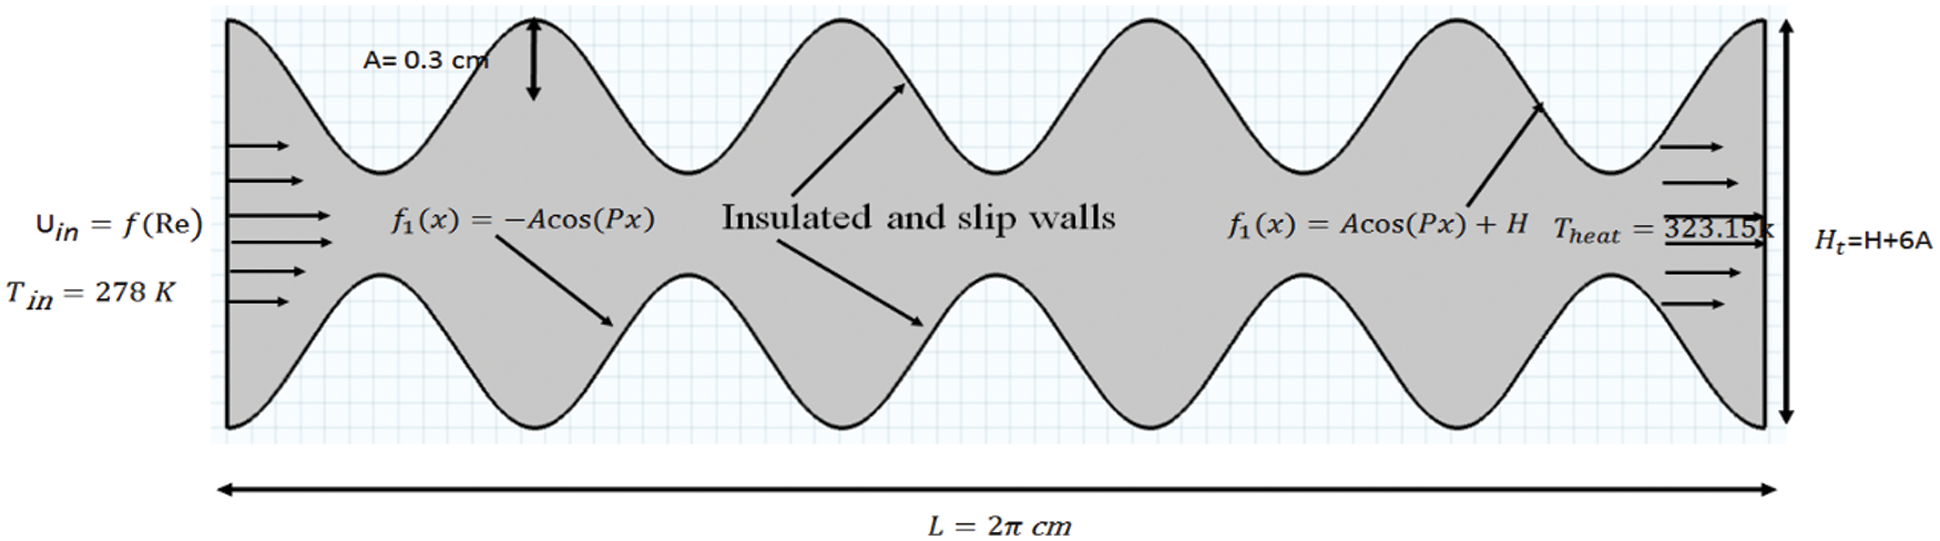
Figure 1: Geometrical construction and boundary conditions of the problem
The modeling and simulation for the present fluid flow and heat transfer problem are examined by considering the steady-state, two-dimensional, and incompressible Newtonian fluid. We use COMSOL Multiphysics 5.4 for the simulation which implements streamline-upwind Petrov-Galerkin's finite element method [15] to solve the coupling system of Navier Stokes equations and heat equation. In Fig. 3, we present the work flow of the problem. Let
where p denotes pressure and
The heat transfer for the fluids in the vector form and in component form can be written as by Eqs. (5) and (6)
Following boundary conditions are set:
(a) Slip boundary condition at upper and lower walls
(b) Fully developed flow conditions at inlet and outlet of the channel are respectively
and
where
where
3 Validation and Comparison Between Different Mesh Sizes
It is the describable quality of the finite element procedures to get the results up to the benchmark by performing a mesh independent study for the fluid flow problem and heat transfer. To approve the current fluid flow problem for a sinusoidally curved wavy channel a mesh independent study is performed along the channel. For this reason, five different types of meshes are practiced to estimate the ratio of the centerline horizontal component of velocity u to the inlet velocity
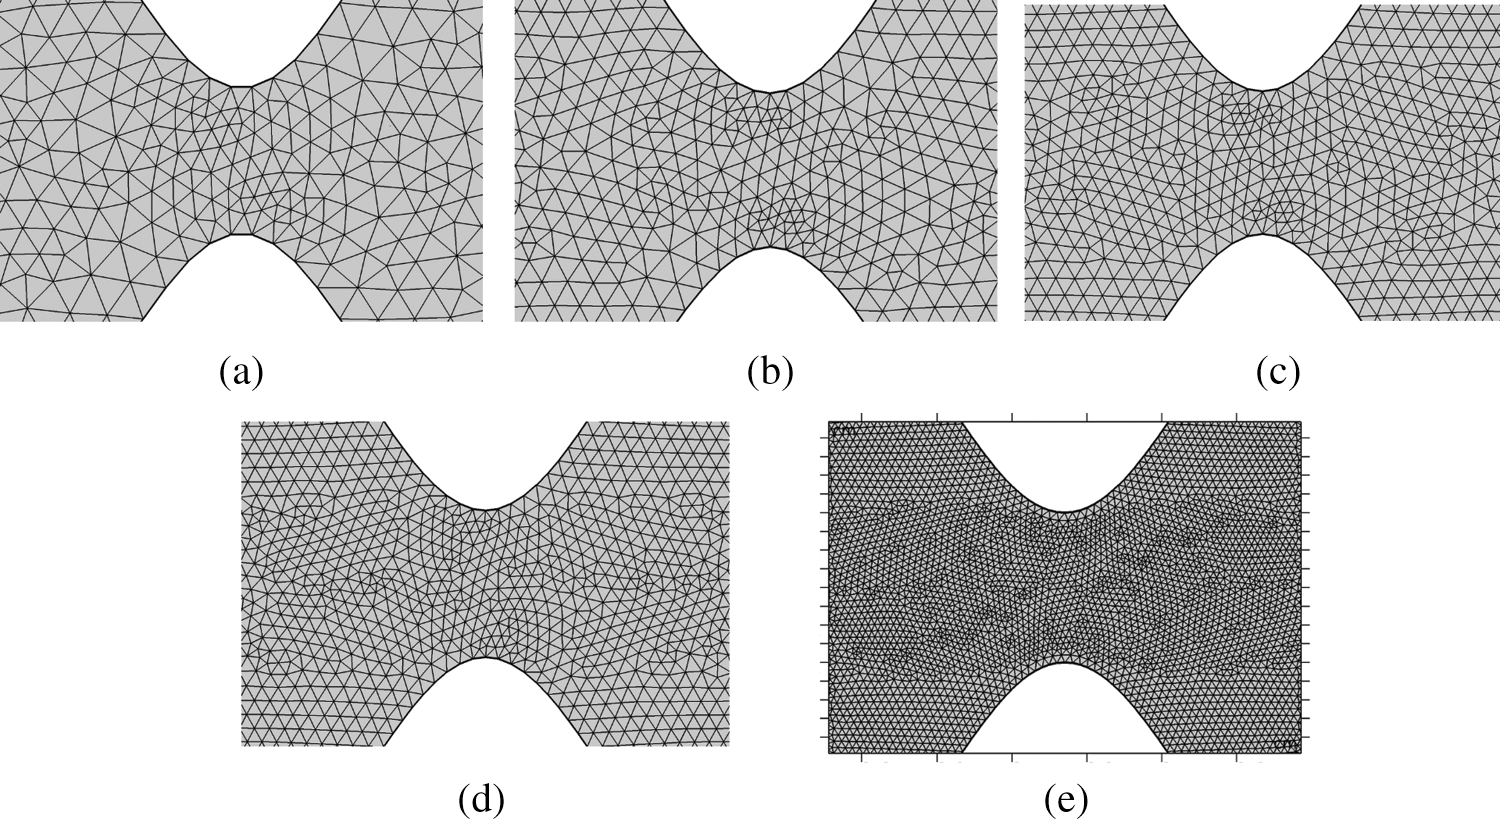
Figure 2: Triangular meshing (a) normal (b) fine (c) finer (d) Extra fine and (e) Extremely fine
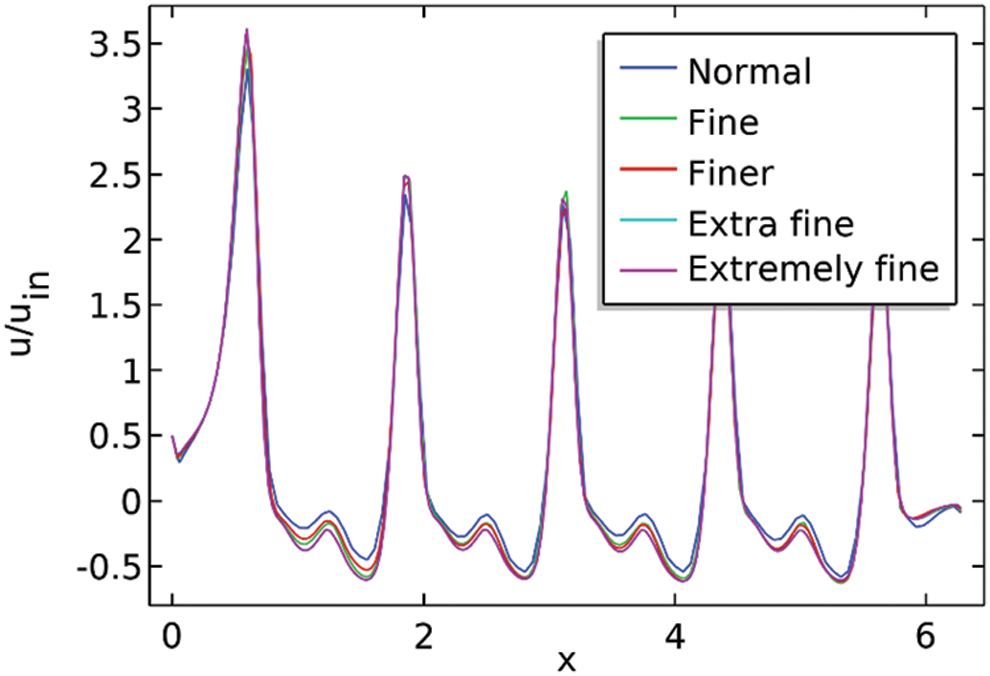
Figure 3: The ratio
Statistics for extremely fine mesh as well different other meshes are given by the following Tab. 1.

3.2 Association with Correlation
After doing the mesh independent study, we are adjusting our intention to approve the results for the local Nusselt number downstream of the channel by exploring the correlation available through different pieces of literature. According to the literature, the local Nusselt number for a flat plate in the state of forced convection is provided by the equation correlating the local Reynolds number and Prandtl number [7]. However, our channel of concern is only flat for the period
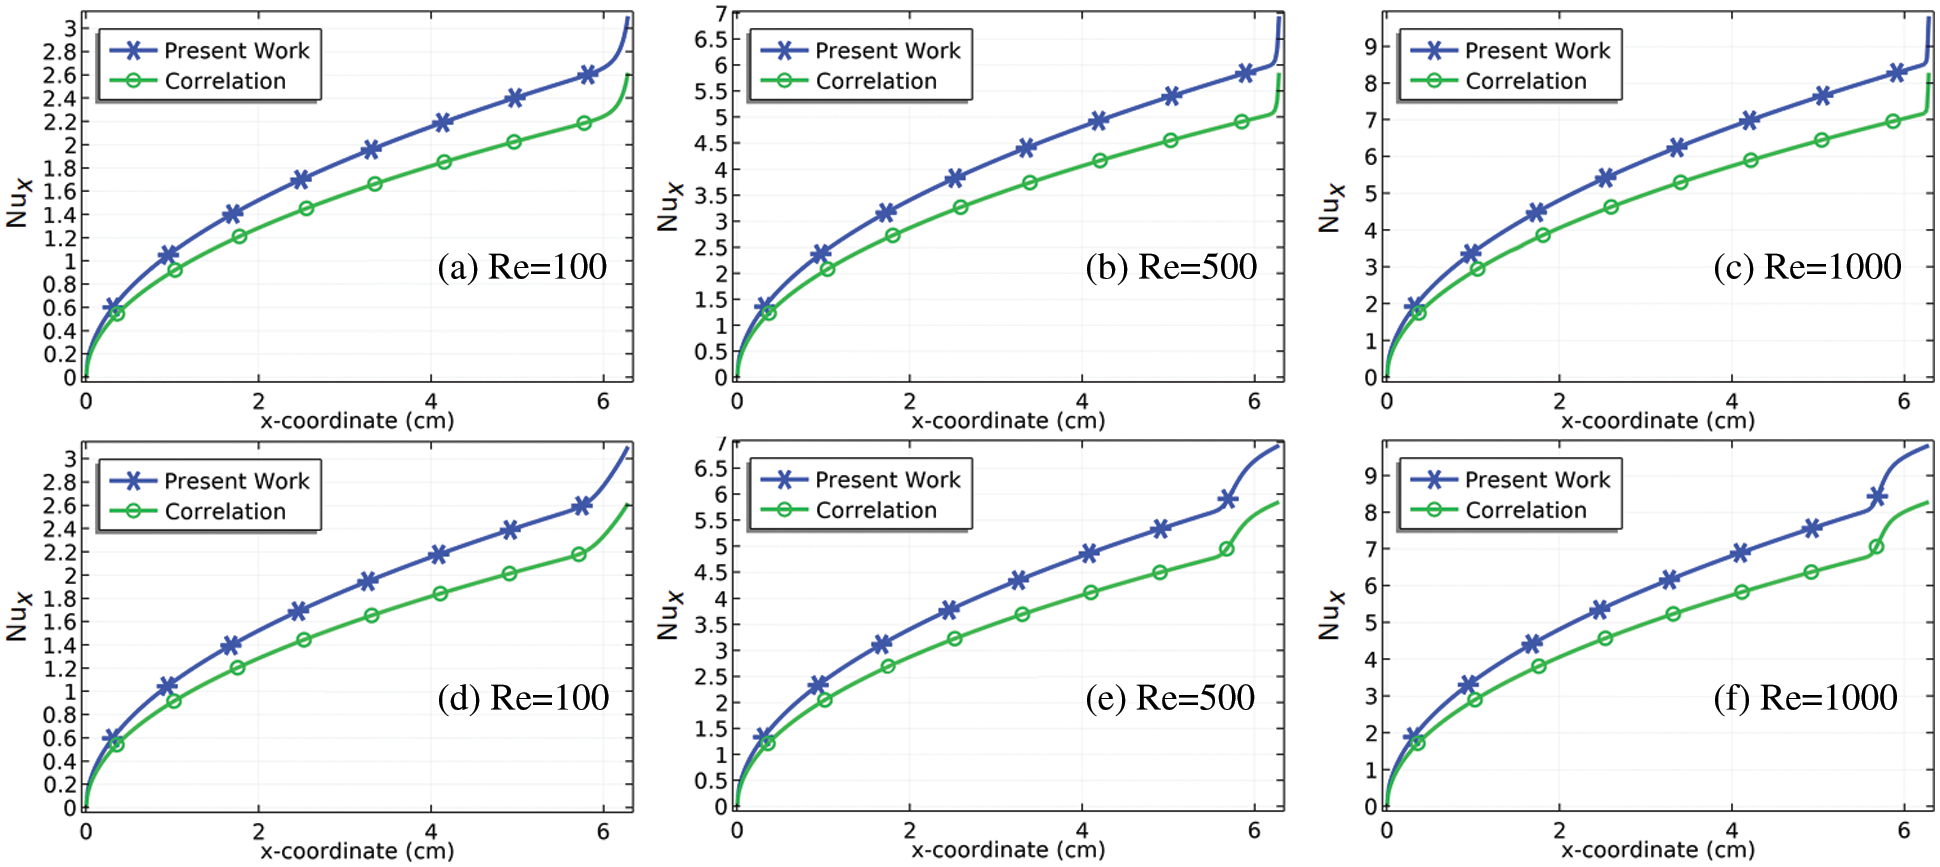
Figure 4: Correlation-based confirmation of the model for the local Nusselt number at the downstream of the channel at
The laminar and Newtonian fluid flow onward with heat transfer was tested with the use of the Reynolds number
4.1 Surface Plots of the Velocity Field with Streamlines and Axial Velocity
The streamlines pattern with the surface plots is dispatched in Fig. 5. For the straight rectangular channel, the flow of particles in the domain remains consistent i.e., there was no increment or declination in fluids velocities. Moreover, there was no formation of vortices in the domain. Next, we check the pattern of the velocity field in the vibrating channel by putting a period of
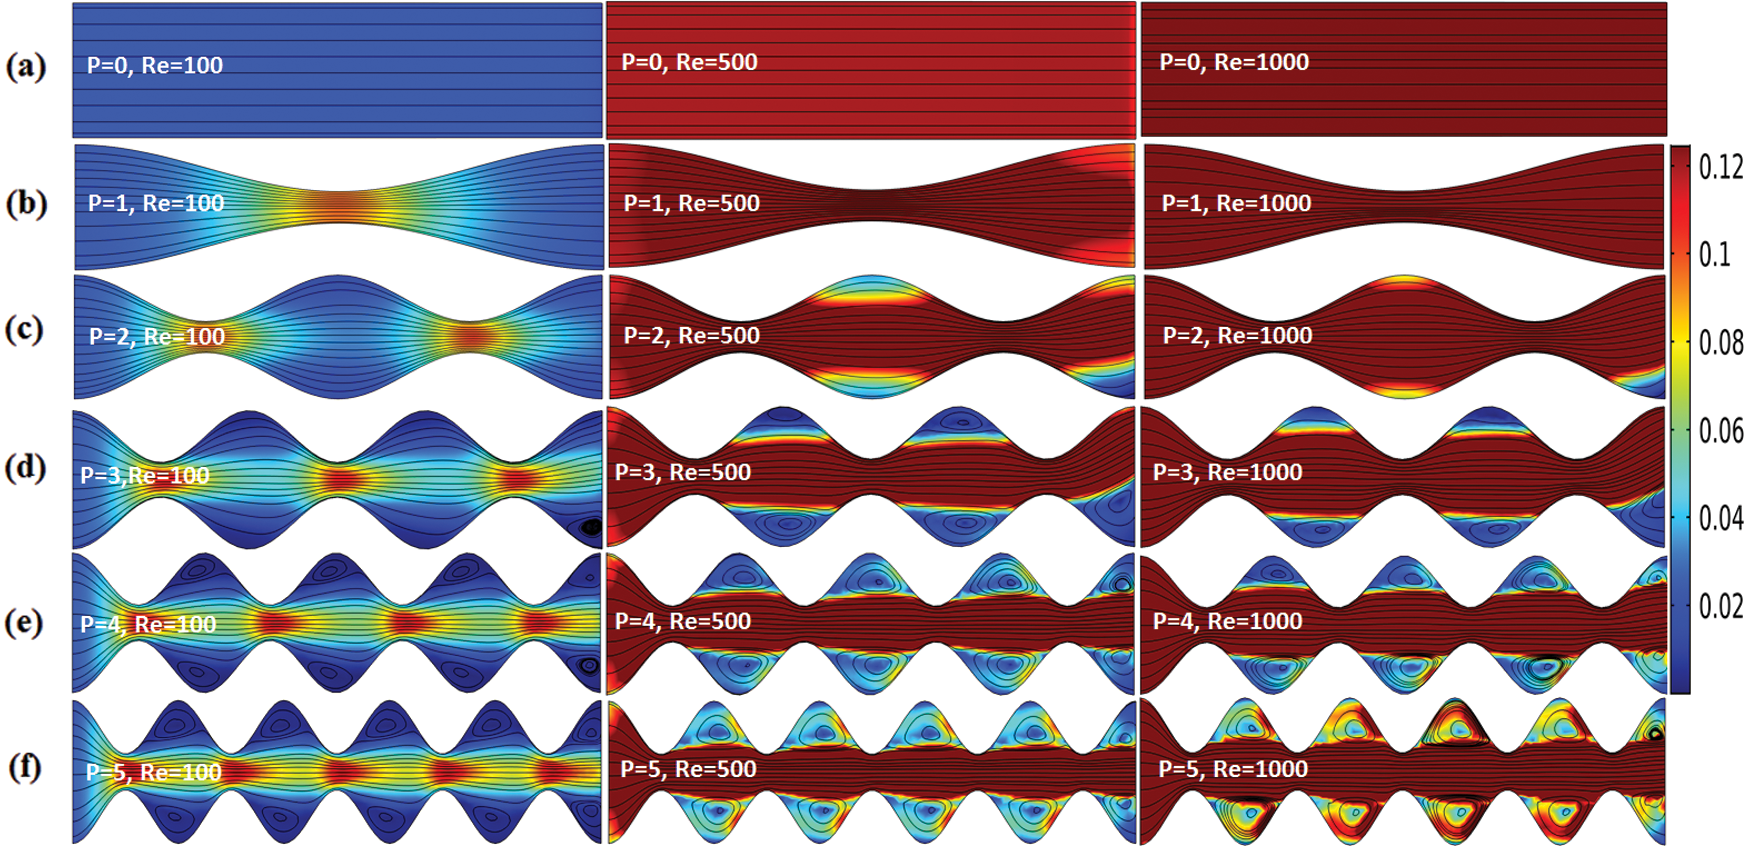
Figure 5: Streamlines of the velocity field with surface plots for

Figure 6: Speed of the fluid particles near the contraction region (a)
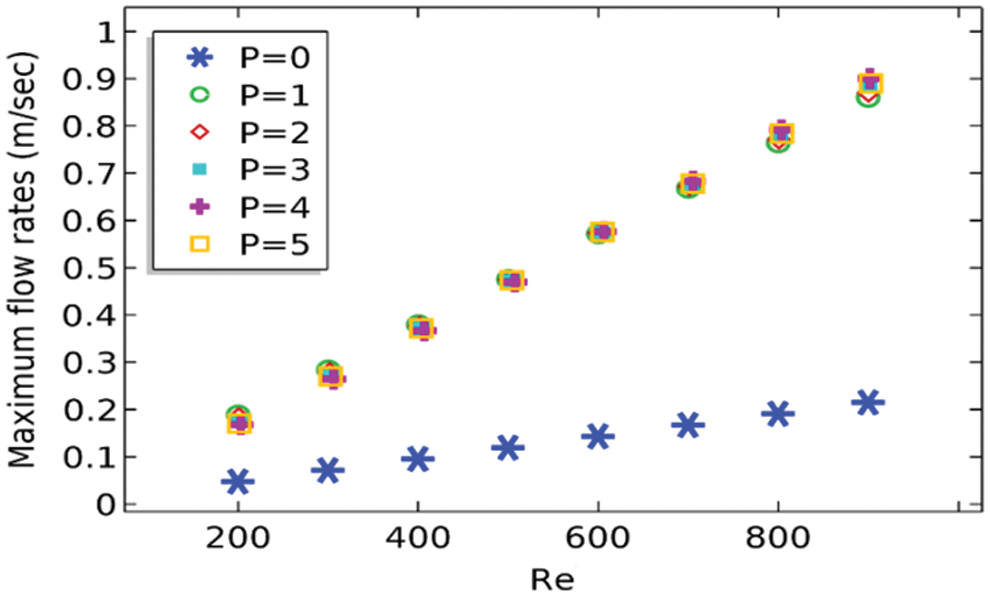
Figure 7: Maximum flow rate at the outlet of the channel against
In Fig. 7, the maximum velocity magnitude at the outlet of the channel is calculated against the Reynolds number at different values of the period P of the channel. It is obvious from the graph that constructing a channel with vibration or oscillating boundaries will produce the maximum flow rate at the outlet of the channel. Further, with the increase in Reynolds number, the maximum velocity at the outlet possessed a linear relationship with the Reynolds number. Except for the rectangular channel, all periods of the vibration of the channel are producing unique maximum velocity at the outlet of the channel for the particular Reynolds number.
Applying a linear Regression procedure, we would make the correlation that will connect the maximum velocity at the outlet of the channel in terms of Reynolds number. Following equation is valid for the period of vibration
Fig. 8 shows the computation of the axial velocity at the outlet of the channel for

Figure 8: Axial velocity profile at the outlet for the period

Figure 9: Axial velocity profile at the outlet for the indicated period of vibration of the channel for (a)
Pressure contours are obtained in Fig. 11 using two different values of the Reynolds number,
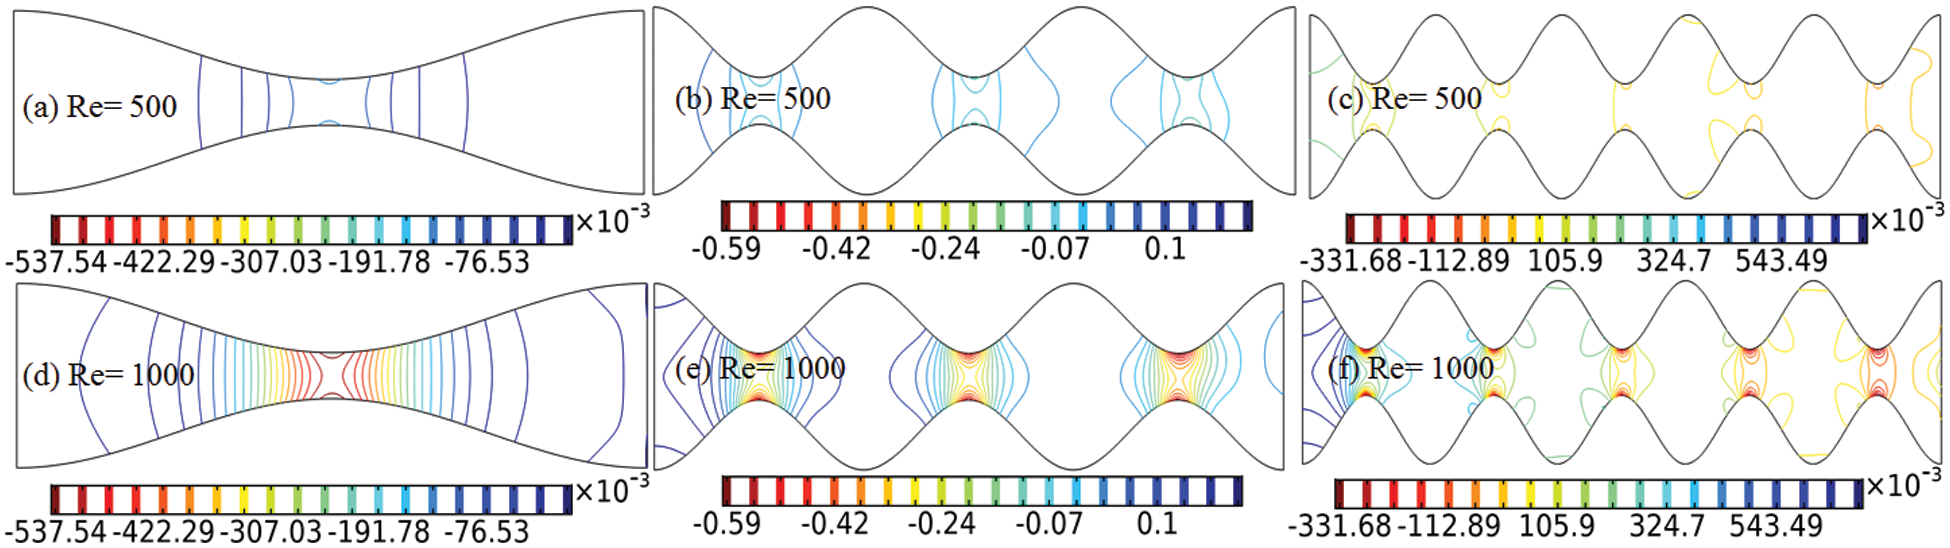
Figure 10: Pressure presentation in the domain with the periods of the vibration
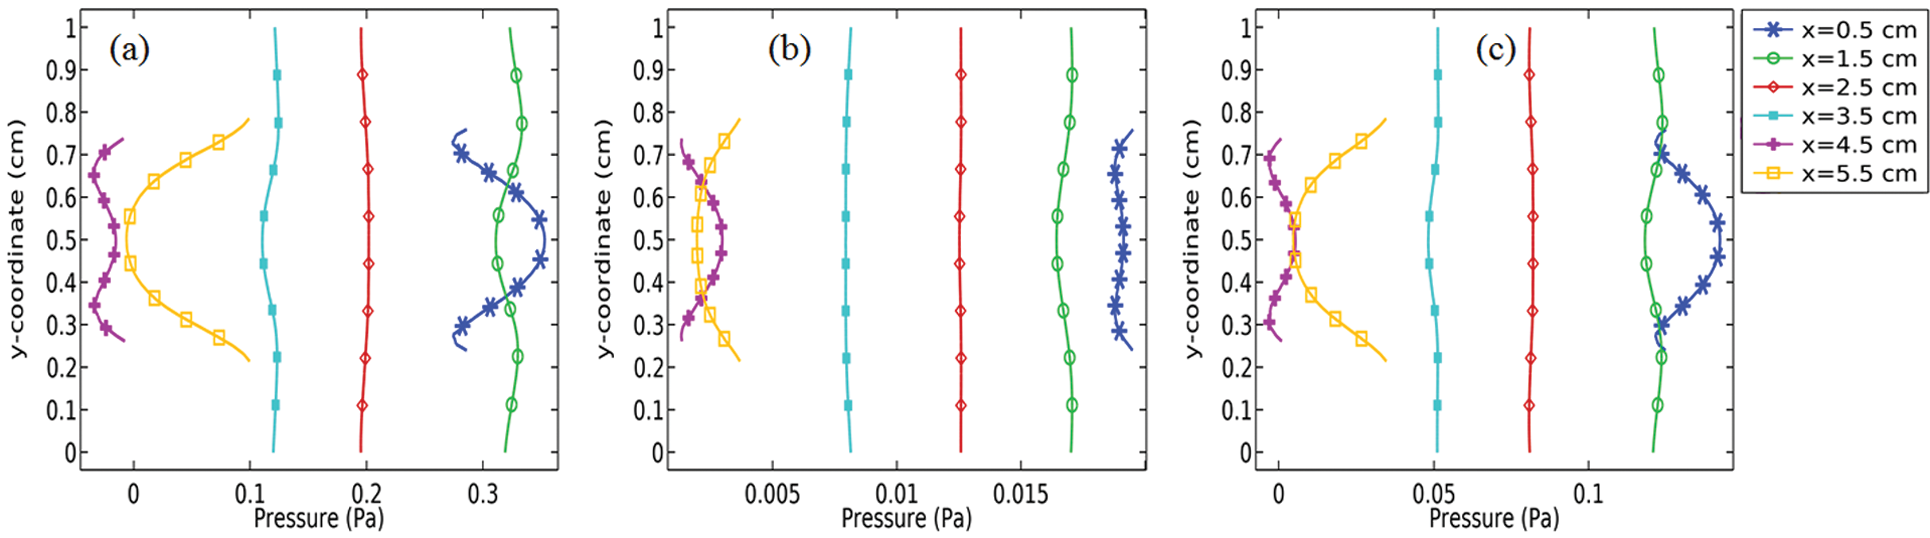
Figure 11: Estimated results of the pressure (Pa) near all contracted regions for
In Figs. 11a–11c, we have bestowed the estimation of dynamic pressure near the contracted regions against the y-axis for a particular Reynolds number with the only observation of periods
Pressure drop at the outlet of the channel is the function of Reynolds number as well as that of the period of vibration. By increasing the values of P or
Mostly in the industrial area, the wavy/curvy channels are constructed due to the need of optimum pressure in the region of interest. When the elements of any fluid passing through the contracted region the volumes are reduced which results a significant increase in the pressure. In Figs. 13a–13c to 15a–15c we describe the pressure distribution along the length of the channel. The pattern can be compared with the patterns reported in the references [24] and [25]. It is obvious from Figs. 13a–13c while the fluid came into contact at the contracted regions due to the reduction of volume the pressure increases at the region. The pressure in the channel shows a periodic variation in the channel, see Figs. 15a–15c.
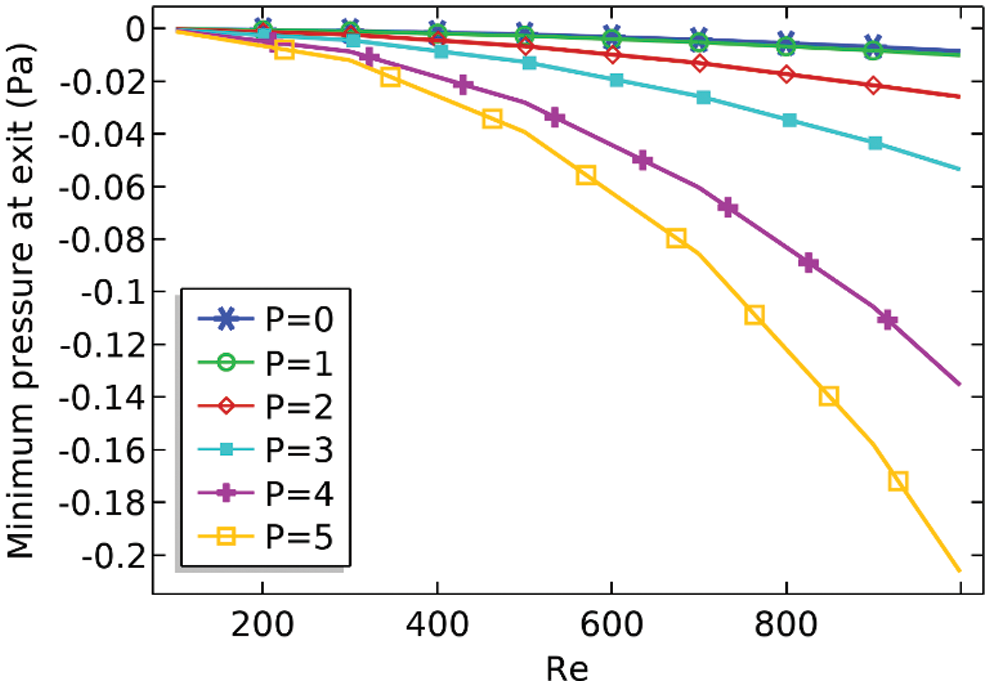
Figure 12: Minimum pressure at the outlet against the Reynolds number

Figure 13: Pressure distribution along the length of the curvy channel with the period
Also, with the increase in Reynolds number the range of periodicity increases for example Fig. 14a the range of the amplitude for pressure can be seen at

Figure 14: Pressure distribution along the length of the curvy channel with the period

Figure 15: Pressure distribution along the length of the curvy channel with the period
In the field of fluid dynamics, the wall shear stress can be regarded as the rate at which the velocity inclines while the fluid is moving along the wall. In common, shear stresses are occurring when the elements of fluid acquiring the motion relative to one another. For a simple pipe, zero velocity is assumed at the pipe wall whereas it is increasing while the fluid element is moving towards the center of the pipe. For a non-smooth pipe, the determination of the wall shear stress is essential. Here, we are going to present the graphs for wall shear stress against the length of the pipe see Figs. 16a–16c to 18a–18c. The pattern of the graphs can be matched to the pattern of the graphs reported in [24] where the channel was considered for the two period of vibration and here the problem is being focused on more period of vibration of the channel. From the graphs, it is evident that with the increase in Reynolds number the wall shear stress at the inlet of the channel increases whereas the wall shear stress at the outlet of the channel is zero for all the cases due to the zero pressure condition. The pattern of behavior of the wall shear stress along the length of the channel is not very much clear for the moderate number of periods
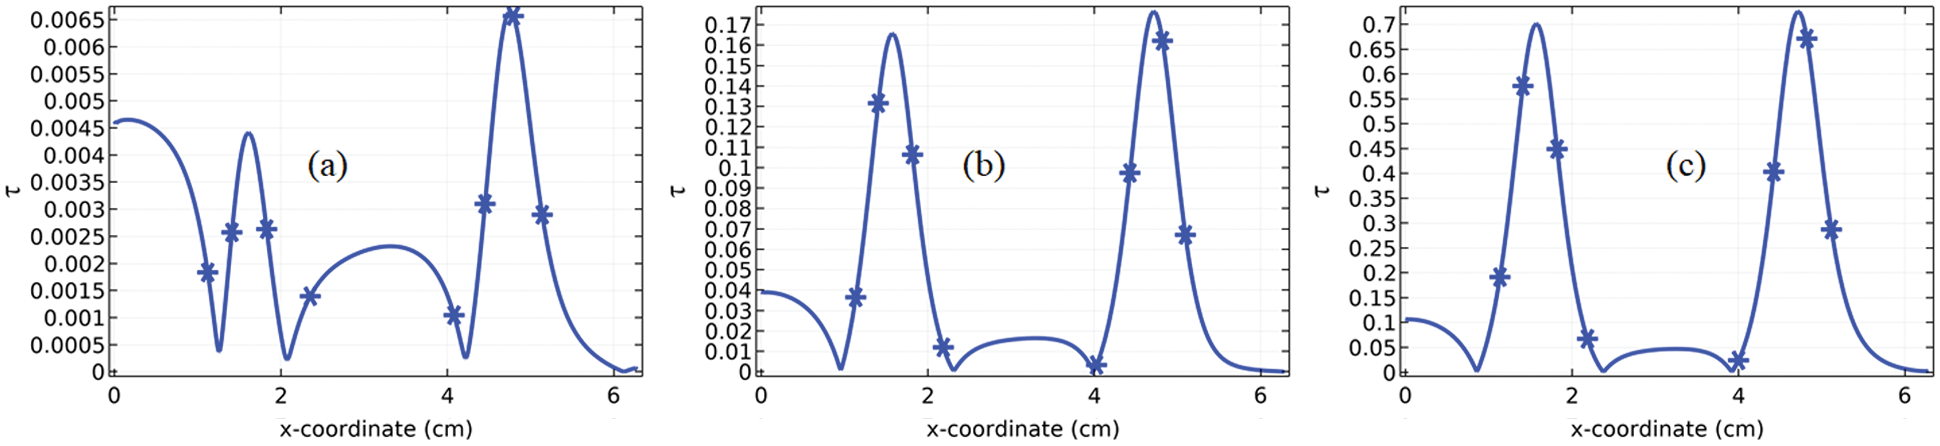
Figure 16: Wall shear stress against the length of channel for
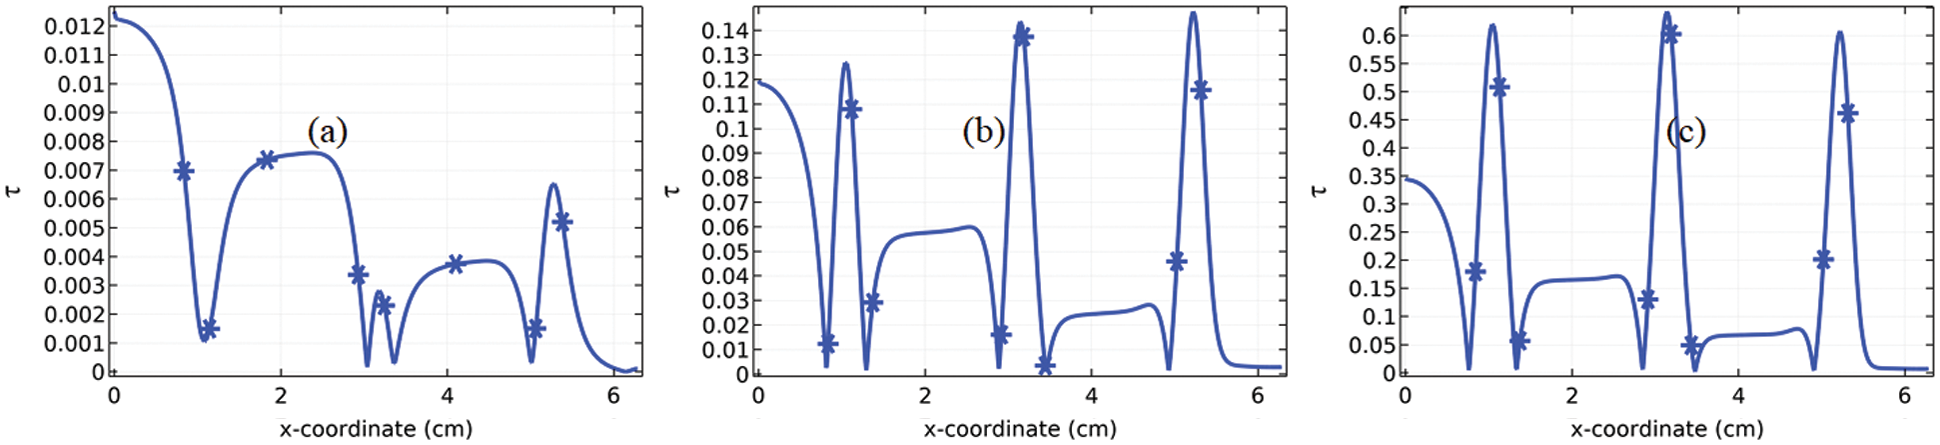
Figure 17: Wall shear stress against the length of channel for

Figure 18: Wall shear stress against the length of channel for
4.4 Measurement of Rotating Regions
It is often can be seen in the fluid flow problems which are observed under the presence of the bluff bodies, cavities and might be they can be observed due to the periodic motion of the boundaries of the channel, the fluid often rotates along its axis. The rotational regions becomes clearer when the fluid is observed under the presence of bluff bodies or obstacles rather than without of them. When fluid with any material slides down upstream of the channel, the rotating regions can be observed along the sides of the downstream. The length and intensity of these rotating regions depend upon the velocity of the fluids. The fluid needs some velocity magnitude to form the vortex along with the downstream of the region. While observing the wavy channel in the current problem the rotating regions were observed in Figs. 5d–5f. In Figs. 19a–19f, we are presenting graphs where we are measuring the rotation rate downstream of these rotating regions against the local Reynolds number.

Figure 19: Relationship of rotation rate
Although, there was no rotational region found for the period
The heat distribution in the channel is investigated by imposing a temperature at the outlet of the channel and the air is allowed to enter the domain with an initial temperature. Our concern is to lessen the temperature near to the outlet of the channel by searching such a Reynolds number and the period of the vibration of the boundaries. The temperature distributions with the surface plots in the channel are presented in Figs. 20a–20l for the particular Reynolds number as well as the Periods of the vibration of the channel. On following Fig. 10 for

Figure 20: Temperature distribution in the channel from cold place to hot place in the periods (a-c)
Therefore, the graphical presentation (see Fig. 21a) of the average temperature near the outlet of the channel against the Reynolds number is depicted for the particular periods. The graph is showing the same consequences as described above in Figs. 20a–20l. It is also apparent from the graph that the declination of the average temperature persists consistently after

Figure 21: (a) Average temperature against the Reynolds number near the outlet of the channel (b) Average Nusselt number against Reynolds number near the outlet of the channel
The present work encountered airflow and temperature distribution through a sinusoidally curved wavy channel of length
1. Maximum velocity magnitude is found at the contraction regions. At the expansion regions, small recirculating vortices are created which resist the speed of the flow while the fluid is sliding down the region. The maximum velocity magnitude at the outlet is increasing linearly with the increase in Reynolds number but it is very low for
2. The pressure in the channel is continuously decreasing after passing through contraction regions for all the Reynolds numbers and the period of vibration of the boundaries. It is suggested that using the wavy channel with an equal number of periods can be used as the pressure reducing pump in most engineering applications.
3. The pressure distribution along the length of the channel is having cyclic variation along the channel. Due to cyclic fluctuation in the pressure, it is obvious to find the maximum pressure at the expansion region and minimum pressure at the contraction region. Due to considering the periodic variation, we can obtain a regression equation involving a sinusoidal function that can cover the major points along the length of the channel. In the article, we have recommended some equations for lower, moderate, and high Reynolds numbers.
4. It was also found that for low and moderate Reynolds numbers, the shear stress at the lower wall of the channel shows a periodic variation from inlet to outlet of the channel. Whereas, for high Reynolds number, the wall shear stress at the bottom wall is decreasing after each contraction region. This means the velocity gradient after each contraction region declines than the previous.
5. By measuring the rotation rate in terms of period of vibration of the channel it was seen that for
6. A flow of heat from a cold body to a hot body was tested for the wavy channel. It was concluded that the average temperature near the hot body is decreasing for
Acknowledgment: The authors are highly indebted to anonymous referees for their helpful suggestions and comments which led to improvements of our original manuscript.
Funding Statement: This research was funded by King Mongkut's University of Technology North Bangkok. Contract no. KMUTNB-63-KNOW-20.
Conflicts of Interest: The authors declare that they have no conflicts of interest to report regarding the present study.
1. K. L. Kirsch and K. A. Thole, “Heat transfer and pressure loss measurements in additively manufactured wavy microchannels,” Journal of Turbomachinery, vol. 139, no. 1, pp. 011007 (1-92017. [Google Scholar]
2. K. L. Kirsch and K. A. Thole, “Pressure loss and heat transfer performance for additively and conventionally manufactured pin fin arrays,” International Journal of Heat and Mass Transfer, vol. 108, pp. 2502–2513, 2017 [Google Scholar]
3. K. Stone and S. P. Vanka, “Numerical study of developing flow and heat transfer in a wavy passage,” ASME. Journal of Fluids Engineering. December, vol. 121, no. 4, pp. 713–719, 1999 [Google Scholar]
4. G. V. Wang and S. P. Vanka, “Convective heat transfer in periodic wavy passages,” International Journal of Heat and Mass Transfer, vol. 38, no. 17, pp. 3219–3230, 1995 [Google Scholar]
5. J. C. F. Chow and K. Soda, “Laminar flow and blood oxygenation in channels with boundary irregularities,” ASME. Journal of Applied Mechanics, vol. 40, no. 4, pp. 843–850, 1973 [Google Scholar]
6. J. C. F. Chow and K. Soda, “Blood oxygenation in tubular oxygenators with wavy walls,” Journal of Biomechanics, vol. 9, no. 3, pp. 135–139, 1976 [Google Scholar]
7. J. A. R. Howell, W. Field and D. Wu, “Yeast cell microfiltration: Flux enhancement in baffled and pulsatile flow systems,” Journal of Membrane Science, vol. 80, no. 1, pp. 5971, 1993 [Google Scholar]
8. P. J. Bezbaruah, R. S. Das and B. K. Sarkar, “Thermo-hydraulic performance augmentation of solar air duct using modified forms of conical vortex generators,” Heat and Mass Transfer, vol. 55, no. 5, pp. 1387–1403, 2019 [Google Scholar]
9. T. T. Ngo and N. M. Phu, “Computational fluid dynamics analysis of the heat transfer and pressure drop of solar air heater with conic-curve profile ribs,” Journal of Thermal Analysis and Calorimetry, vol. 139, no. 5, pp. 3235–3246, 2020 [Google Scholar]
10. C. Saidi, F. Legay-Desesquelles and B. Prunet-Foch, “Laminar flow past a sinusoidal cavity,” International Journal of Heat and Mass Transfer, vol. 30, no. 4, pp. 649–661, 1987 [Google Scholar]
11. G. V. Wang and S. P. Vanka, “Convective heat transfer in periodic wavy passages,” International Journal of Heat and Mass Transfer, vol. 38, no. 17, pp. 3219–3230, 1995 [Google Scholar]
12. T. Nishimura, Y. Ohori and Y. Kawamura, “Flow characteristics in a channel with symmetric wavy wall for steady flow,” Journal of Chemical Engineering of Japan, vol. 17, no. 5, pp. 466–471, 1984 [Google Scholar]
13. M. Gradeck, B. Hoareau and M. Lebouché, “Local analysis of heat transfer inside corrugated channel,” International Journal of Heat and Mass Transfer, vol. 48, no. 10, pp. 1909–1915, 2005 [Google Scholar]
14. Jr, L. Goldstein and E. M. Sparrow, “Heat/mass transfer characteristics for flow in a corrugated wall channel,” ASME. Journal of Heat Transfer, vol. 99, no. 2, pp. 187–195, 1977 [Google Scholar]
15. J. E. O'Brien and E. M. Sparrow, “Corrugated duct heat transfer, pressure drop, and flow visualization,” ASME. Journal of Heat Transfer, vol. 104, no. 3, pp. 410–416, 1982 [Google Scholar]
16. V. K. Garg and P. K. Maji, “Flow and heat transfer in a sinusoidally curved channel,” International Journal of Engineering Fluid Mechanics, vol. 1, no. 3, pp. 293–319, 1988 [Google Scholar]
17. B. Ničeno and E. Nobile, “Numerical analysis of fluid flow and heat transfer in periodic wavy channels,” International Journal of Heat and Fluid Flow, vol. 22, no. 2, pp. 156–167, 2001 [Google Scholar]
18. C. C. Chang, “A combined active/passive scheme for enhancing the mixing efficiency of microfluidic devices,” Chemical Engineering Science, vol. 63, no. 12, pp. 3081–3087, 2008 [Google Scholar]
19. L. Lin, J. Zhao, G. Lu, X. D. Wang and W. M. Yan, “Heat transfer enhancement in microchannel heat sink by wavy channel with changing wavelength/amplitude,” International Journal of Thermal Sciences, vol. 118, pp. 423–434, 2017 [Google Scholar]
20. H. S. Shing and H. Y. Cheng, “Passive mixing in micro-channels with geometric variations through μPIV and μLIF measurements,” Journal of Micromechanics and Microengineering, vol. 18, no. 6, pp. 065017, 2008 [Google Scholar]
21. N. A. Quddus, S. Bhattacharjee and M. Walied, “Electrokinetic flow in a wavy channel,” in 2005 Int. Conf. on MEMS, NANO and Smart Systems, Banff, AB, Canada, IEEE, pp. 219–220, 2005. [Google Scholar]
22. X. Zheng, M. Renwei, S. Mark and Z. H. Fan, “Electroosmotically driven creeping flows in a wavy microchannel,” Microfluidics and Nanofluidics, vol. 6, no. 1, pp. 37–52, 2009. [Google Scholar]
23. J. Farooq, M. Mushtaq, S. Munir, M. Ramzan, J. D. Chung et al., “Slip flow through a non-uniform channel under the influence of transverse magnetic field,” Scientific Reports, vol. 8, no. 1, pp. 1–14, 2018. [Google Scholar]
24. M. Ramzan, H. Gul, M. Y. Malik, D. Baleanu and K. S. Nisar, “On hybrid nanofluid yamada-ota and Xue flow models in a rotating channel with modified Fourier law,” Scientific Reports, vol. 11, no. 1, pp. 1–19, 2021 [Google Scholar]
25. M. Suleman, M. Ramzan, S. Ahmad, D. Lu, M. Taseer et al., “A numerical simulation of silver–water nanofluid flow with impacts of newtonian heating and homogeneous–heterogeneous reactions past a nonlinear stretched cylinder.” Symmetry, vol. 11, no. 2, pp. 295, 2019 [Google Scholar]
26. Adnan, U. Khan, N. Ahmed, S. T. Mohyud-Din, I. Khan et al., “Al2O3 and gamma Al2O3 nanomaterials based nanofluid models with surface diffusion: Applications for thermal performance in multiple engineering systems and industries.” Computers, Materials & Continua, vol. 66, no. 2, pp. 1563–1576, 2021 [Google Scholar]
27. N. Saima, S. Waheed, A. Hussanan and D. Lu, “Analytical solution for heat transfer in electroosmotic flow of a carreau fluid in a wavy microchannel,” Applied Sciences, vol. 9, no. 20, pp. 4359, 2019 [Google Scholar]
28. D. Tripathi, S. Bhushan and O. A. Bég, “Unsteady viscous flow driven by the combined effects of peristalsis and electro-osmosis,” Alexandria Engineering Journal, vol. 57, no. 3, pp. 1349–1359, 2018 [Google Scholar]
29. D. Tripathi, S. Bhushan and O. A. Bég, “Analytical study of electro-osmosis modulated capillary peristaltic hemodynamics,” Journal of Mechanics in Medicine and Biology, vol. 17, no. 3, pp. 1750052, 2017 [Google Scholar]
 | This work is licensed under a Creative Commons Attribution 4.0 International License, which permits unrestricted use, distribution, and reproduction in any medium, provided the original work is properly cited. |