DOI:10.32604/cmc.2022.023745
| Computers, Materials & Continua DOI:10.32604/cmc.2022.023745 | |
| Article |
Detection of Osteoarthritis Based on EHO Thresholding
1Department of Computer Engineering, King Khalid University, Abha, Saudi Arabia
2Department of Computer Science, King Khalid University, Sarat Abidha Campus, Abha, Saudi Arabia
3Department of Engineering, University of Technology and Applied Sciences, Al Mussanah, Sultanate of Oman
*Corresponding Author: R. Kanthavel. Email: kanthavel2005@gmail.com
Received: 19 September 2021; Accepted: 10 November 2021
Abstract: Knee Osteoarthritis (OA) is a joint disease that is commonly observed in people around the world. Osteoarthritis commonly affects patients who are obese and those above the age of 60. A valid knee image was generated by Computed Tomography (CT). In this work, efficient segmentation of CT images using Elephant Herding Optimization (EHO) optimization is implemented. The initial stage employs, the CT image normalization and the normalized image is incited to image enhancement through histogram correlation. Consequently, the enhanced image is segmented by utilizing Niblack and Bernsen algorithm. The (EHO) optimized outcome is evaluated in two steps. The initial step includes image enhancement with the measure of Mean square error (MSE), Peak signal to noise ratio (PSNR) and Structural similarity index (SSIM). The following step includes the segmentation which includes the measure of Accuracy, Sensitivity and Specificity. The comparative analysis of EHO provides 95% of accuracy, 94% of specificity and 93% of sensitivity than that of Active contour and Otsu threshold.
Keywords: Osteoarthritis; CT images; correlation histogram; thresholding; Niblack & Bernsen algorithm; EH optimization
Osteoarthritis is a type of disease that mainly destruct the joint in knee, hip and hand and this disorder may happen when the cartilage cushion down the knee which starts to wear down [1]. Arthritis is joint inflammation which is characterized by joint stiffness which can lead to poor function. This mainly happens to age down and over weighted people. In osteoarthritis there are two main types which can be primary that happens to aged people and the secondary may occur to earlier stage due to injury in accidents, weak body conditions, and some diseases like diabetes. In our paper we are considering a CT image also termed as CT scans; to scan a knee image [2]. CT scan may show the cross-sectional images of knee so that the disorder can be defined clearly through image. The body is circled by a CT scanner and it transfers pictures to a computer. These pictures are used by the machine to create detailed images. This helps the joints, cartilage, ligaments, vessels, and bones that make up the knee to be seen by physicians and qualified technicians. CT images can be introduced with main advantages like quick access of image detection in knee, painless, availability is better compared with MRI scanning; the bones structures are visualized in good view [3]. CT scan may also view an image of a small portion of knee [4]. Fig. 1 shows the CT scan image of knee joint destruction.
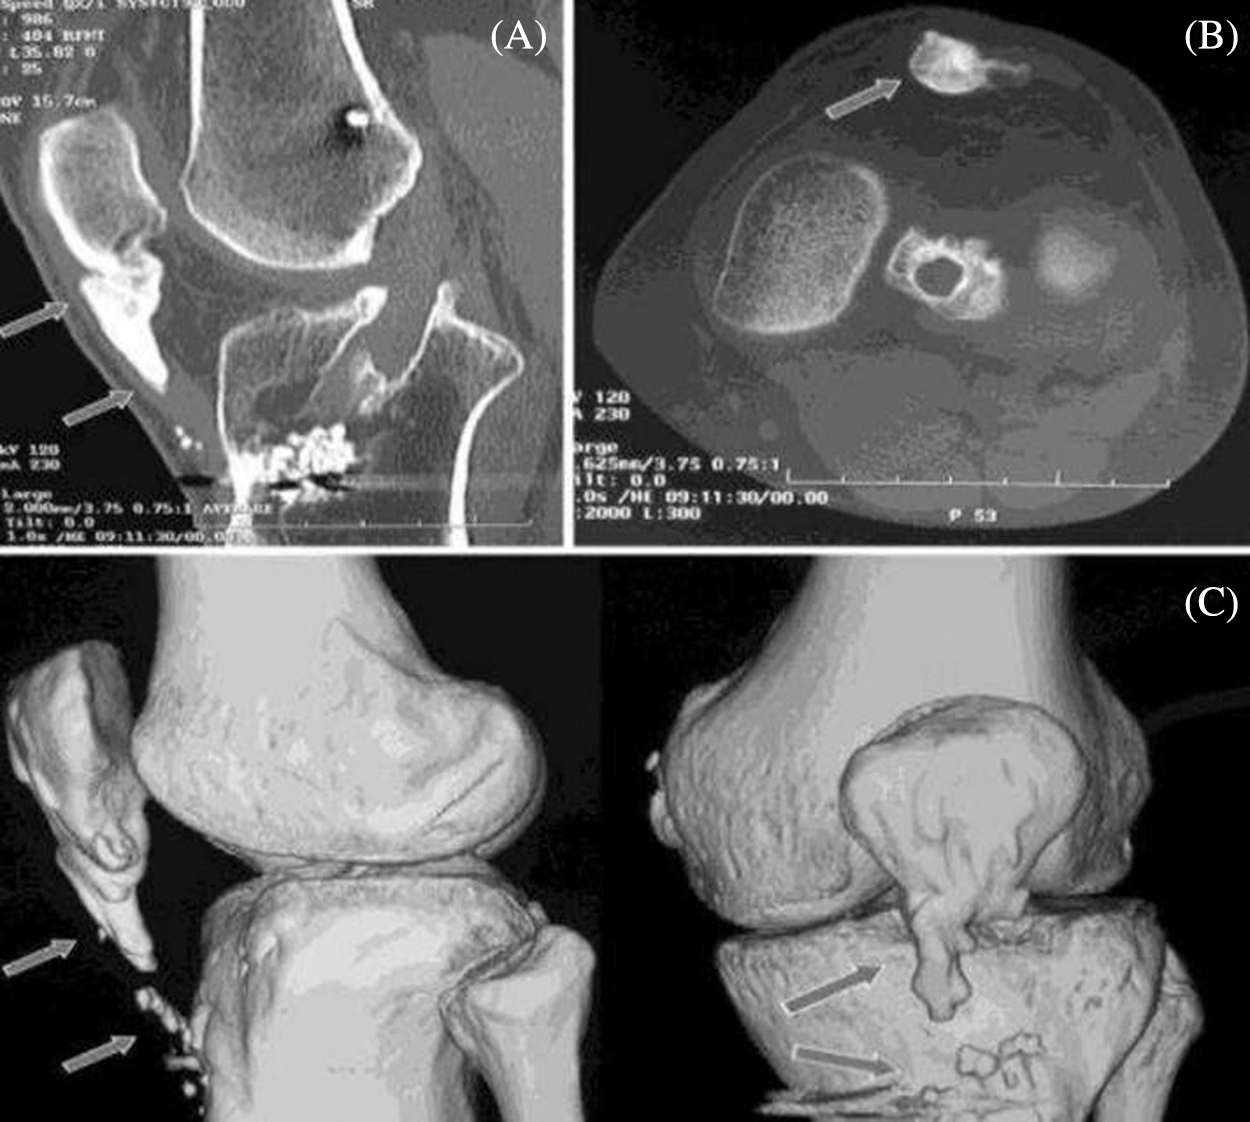
Figure 1: CT scan image of knee joint destruction
In Osteoarthritis there are several imaging techniques applied to restore the images from the disadvantage of unclear images and accuracy in image. The techniques are as follows: deep learning algorithm using Conventional Neural Networks (CNN) and for segmentation Active Contour Algorithm may be existed [5]. Though they were used to restore the clear image with accuracy still there might be a disadvantage in getting the image of knee perfectly [6]. Many Papers were done on the basis of knee joint destruction using many techniques. Most methods used previously are locating the knee joint and severity quantification. Separate models for knee joint location using either handcrafted features or CNN are not always very accurate and add more complexity while testing the existing method [7]. In order to overcome these circumstances, we are proposing an alternate method to enhance the knee image is Correlation Histogram Analysis [8]. The modification of the original histograms is often used in image enhancement procedures [9]. This segmentation method can be helpful in detecting the knee joint destruction by extracting the features by accepting the pixels in the form of arrays [10]. The main objective is to minimize the error function of the knee image. Our proposed segmentation method to optimize the knee OA is EHO. This optimization can be inspired from the herding of elephant group by nature. In order to address an optimization problem, this herding behavior of the elephant is modeled into clan updating and separation operator. The optimization of the EH is used in this work to isolate the worst pixel in the segmented grey scale image.
This section of this paper explains the related papers that deal with the Detection of Osteoarthritis Based on Thresholding methods. In 2019, Shiva and Gornale et al., have proposed a segmentation technique for evaluating knee osteoarthritis to overcome the disease using different segmentation methods. Though they have used the Prewit and Sobel edge methods, the accuracy enhancement and the classification rate are the main limitations. In 2019, Sicheng Wang et al., have done research on segmentation aware of denoising without true segmentation to generate image denoisers with better quality with no ground truth segmentation. enhancing U-SAID's generalizability in three ways: denoising unseen types of images, denoising as pre-processing for segmenting unseen noisy images, and denoising for unseen high-level tasks. To improve the accuracy of the image and to enable automatic evaluation, in 2018, Archit Raj et al., proposed an automatic knee cartilage segmentation using CNN in a 3D structure. Despite the fact that they proposed a technique to improve image accuracy, they are still in the limitation stage. In 2017, Shivan and Gornale et al., proposed a determination of OA using a histogram of oriented gradients and multiclass SVM. This method uses a HOG technique and can be processed using multiclass SVM for evaluating the KL grading system. Its results can be evaluated by medical expertizers. Still has the disadvantage of segmentation accuracy and could improve the classification rate with improved techniques for segmentation and preprocessing.
In 2019, Prajna desai et al., had proposed a paper called “Knee cartilage segmentation and thickness measurement from 2D ultrasound. This paper proposes local-phase based image processing to enhance the modality of the image, and different segmentation techniques are proposed called RW, Watershed, and graph-cut-based methods. This existing method also tried to improve the accuracy. Though it doesn't fulfill the objective of improving accuracy. In 2020, Ridhma et al., proposed a paper on the Review of automated segmentation approaches for knee images, owning the different accuracy and difficulty of the various data sets of the knee image. This paper gives various segmentation techniques in detail for making a proposal. They did a lot of research to get better results for knee image segmentation. To separate the original histogram of a 16 bit biomedical image into two Gaussian that cover the pixel region and bright pixel regions was proposed by Joyce Sia Sin Yin et al. in 2020 in “Prominent Region of Interest Contrast Enhancement for Knee MRI: Data from the Osteoarthritis Initiative”, though it has a trade-off of longer time in image processing. It is observed from the review of the literature that the existing papers talked about Detection of Osteoarthritis based on Thresholding methods. Hence, there is a need to develop an efficient Thresholding methods model for Detection of Osteoarthritis.
The color and contrast of an image can be analyzed and processed in digital images using a tool called image histograms. In our proposed work, the knee osteoarthritis image can be enhanced using a method called Correlation Histogram dependent on the gray scale level of CT images, referred to as the CHA_CT algorithm. They are ideally suited for analyzing the effect of various processing and coding algorithms. The image can be fed up with a number of pixels. Each pixel represents a tissue in a CT image, and a gray-scale value between 0 and 255 is assigned to it. Fig. 2 represents the block diagram of knee Osteoarthritis Image Enhancement.
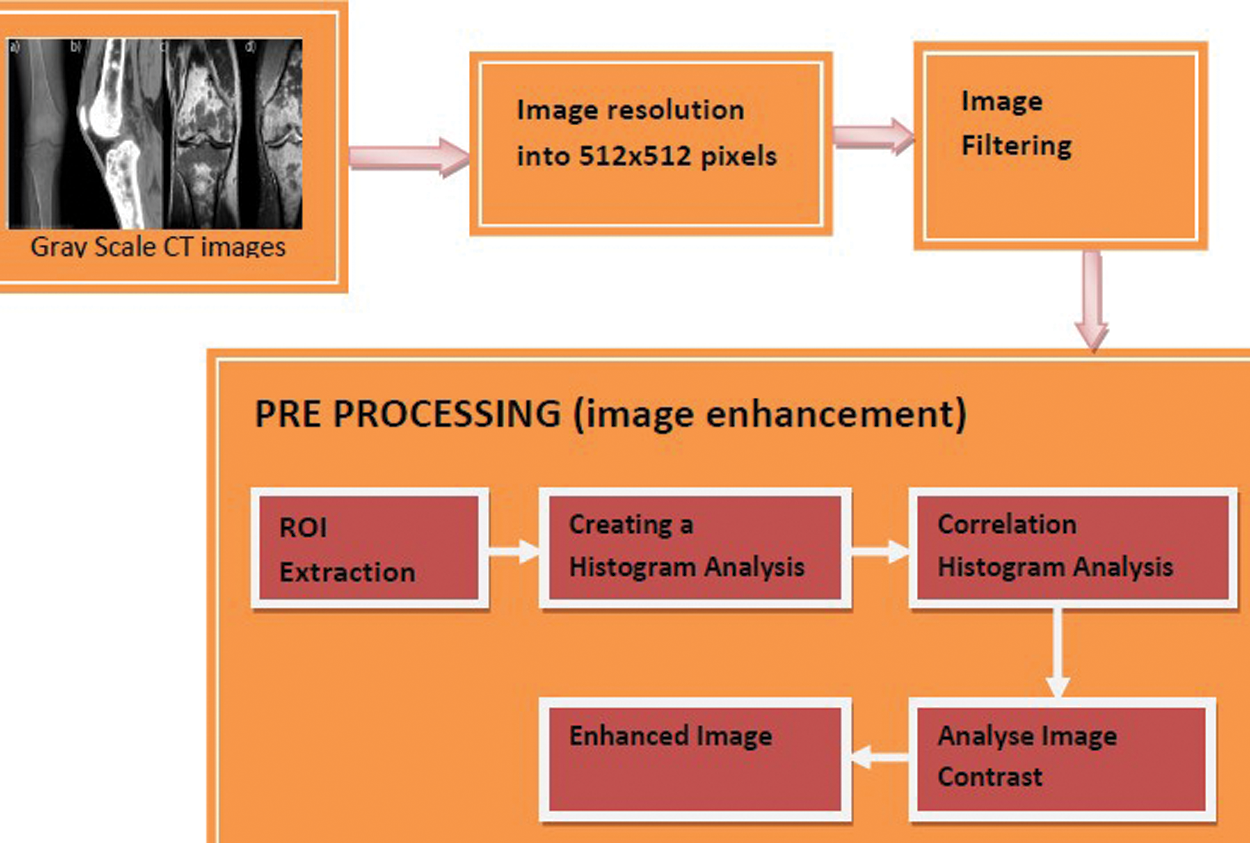
Figure 2: Block diagram of knee osteoarthritis image enhancement
In order to reduce the noise of the image along with less blurring, Median Filter can be used in our research. Because of the black and white spots that are overlaid in it, it must be called pepper and salt noise [11]. A nonlinear method for removing noise from images is median filtering. It's widely used because it's very good at removing noise while keeping the edges. The median filter replaces each value with the median value of neighboring pixels as it moves through the image pixel by pixel. Because the median is a more robust average than the mean, a single highly unrepresentative pixel in a neighborhood will have little impact on the median value. In median filter by considering a input image f (a, b), we are obtaining a adaptive median filter can be expressed as;
We extracted a Region of Interest (ROI) of 140 × 140 mm for each knee to pre-process the Osteoarthritis Initiative (OAI) images utilizing an ad-hoc template and Bone Finder software31 that allows precise completely anatomical. To standardize the communication frame between patients and data acquisition centers, this Technique was made [12]. We rotated all the knee photos after finding the bone landmarks so that the tibial layer was horizontal. The objective of pre-processing is to enhance image data that suppresses unnecessary distortions or improves some of the image features that are essential for further processing [13]. In our proposed technique pre-processing may be based on the following procedures:
• ROI extraction
• Creating histogram analysis
• Correlation of histogram
• Analyze image contrast
• Enhanced image
ROI extraction: A ROI is a part of an image chosen in any manner to process or work on [14]. A Biologically Motivated Selective Attention Model is used to create a Region of Interest based image segmentation method. How to choose a semantic object region according to a given goal is one of the most critical difficulties in image segmentation based on a ROI. In our paper we have taken a CT image to extract the particular region for enhancing to detect knee osteoarthritis. ROI extraction of knee image is representing in Fig. 3.
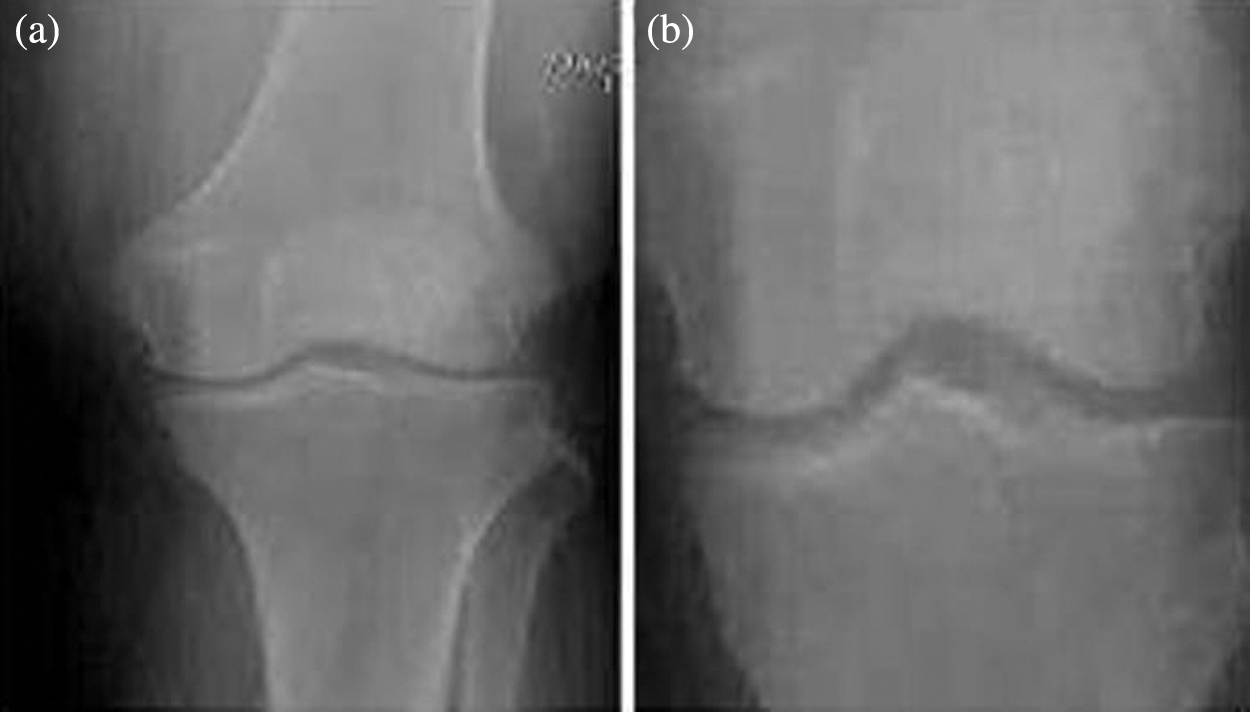
Figure 3: ROI extraction of knee image
To convert knee image into binary image in ROI extraction to enhance the knee,
Creating a Histogram Analysis: By creating a histogram analysis modifies the histogram of an input image so as to improve the visual quality of the image. Equalization may spread out the gray level in an image so what they are evenly distributed. This technique provides a flat image result as possible [15]. In ROI output image each pixel has pixel value intensity. To evaluate the centre pixel of the square between the neighboring eight-pixel intensity distributions, a 3 × 3 matrix is used. Both the neighbor pixel and centre pixel intensity are alike [16]. To evaluate the image using correlation histogram, we followed the equation be,
where, CP be the centre of pixel, W be the windows. The n1, n2, n3… are denoted as 1 and m be considered as 0. All pixels can be scanned using 3 × 3 matrixes. The histogram method is applied over the knee image made a result. Fig. 4 denotes the histogram equalization of knee image.
Figure 4: Histogram equalization of knee image
The standard deviation of the region of interest can be calculated. The enhancement parameter is calculated by,
where, RP is the number of pixels of the Region of interest,
P is the estimation of every pixel of the ROI and
l is the mean estimation of the Region of interest
The outcome is then analyzed by qualitative and quantitative analysis to determine the fundamental features of the equalized histogram image, using a total of 10 patients that are used to contrast the image for research.
Image Segmentation: This paper proposes a multilevel image thresholding strategy based on EHO for image segmentation. Image segmentation is a method for distinguishing image areas that are not overlapping [17]. A lot of techniques for segmenting image objects have been developed until now, such as thresholding-based, edge-based, region based, map cut and connectivity preserving. However, in various applications, most researchers use threshold segmentation because it is simple, accurate and durable [18]. Segmentation process block diagram is shown in Fig. 5. Threshold technique is one of the important techniques in image segmentation. This technique can be expressed as:
where, T is the threshold value.
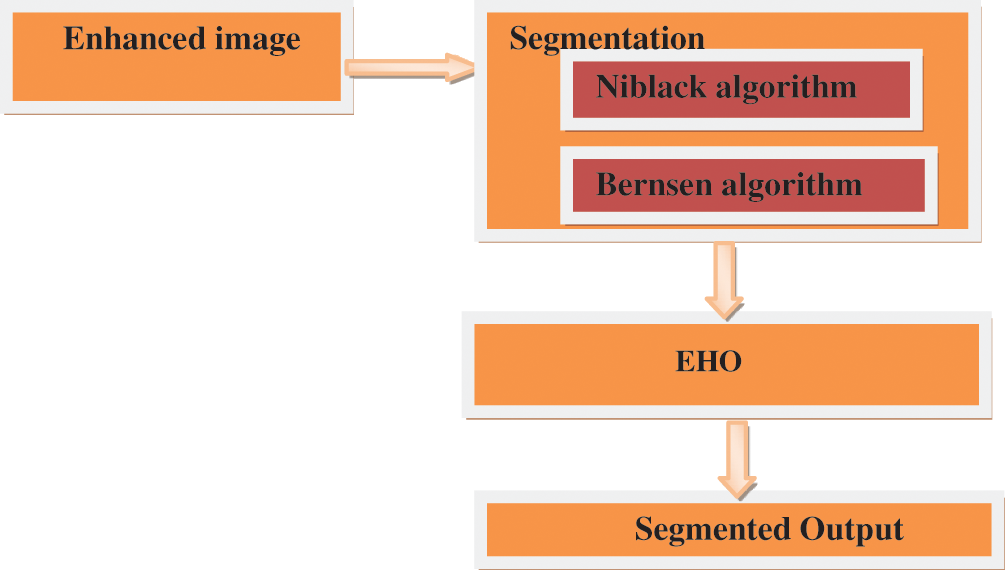
Figure 5: Block diagram of segmentation process
a, b are the coordinates of the threshold value point p (a, b)
f (a, b) are points the gray level image pixels.
Threshold image g (a, b) can be defined:
Niblack Algorithm: Niblack algorithm is a local binarization method that evaluate threshold based on local mean and local standard deviation. In Niblack method a rectangular sliding window of different size is used determine the threshold value of each pixel in the grey scale image [19]. The threshold at pixel (a, b) is calculated as;
where,
K implies constant adjacent object boundary and
Here N represents number of pixels in the gray scale image.
Bernsen Algorithm: The bernsen algorithm is adaptive binarization technique that divides the image into 5 × 5 segment then it finds the Tmax and Tmin gray level value within the segment [20]. It analyzes the nearby pixel values and limits the contrast level. The threshold value of each pixel is calculated by below equation;
where
The contrast measure of bernsen algorithm includes the following steps;
Step 1: It defines the maximum and minimum value of segmented 5 × 5 gray scale image.
Step 2: It calculate the local contract with predefined value d
Step 3: if d > I(x, y) then it determines the segment as background value.
Step 4: if d < I(x, y) contrast value, then the local contrast value is assumed as threshold value.
3.3 Elephant Herding Optimization
The detection of osteoarthritis in the knee using EH Optimized Thresholding Based Segmentation is a unique method. Thresholding is used to create binary images from a grayscale image in this manner. EHO is a metaheuristic optimization method inspired by nature and based on the herding behavior of pictures. It's used to solve the problem of multilevel image thresholding. The EHO optimization mechanism is as follows.
Step 1: Initialization
The elephant clan is selected during initialization, i.e., the gray scale section of pixels was chosen. Solution creation means that initiation is a crucial step in the process of optimization, leading you to identify the optimal solution easily.
Step 2: Fitness Calculation.
The pixel with absolute value is considered as the best pixel and considered as matriarch. After generating the solution, the fitness function is evaluated and then chooses the best solution. Optimization algorithm for the most part relies upon its fitness function to acquire the best solution.
Step 3: Updation
The movement of elephant in the clan the following state is approached through matron, then desired new location is given as,
where
The suitable elephant,
The suitable position of the elephant is obtained by the gathering of information's from all Elephants
The centre of the clan is given by dth dimension
where,
E, d-dth Dimension of the elephant in the clan E. Separation operator
The elephant clutches in the time the male elephants reach adolescence and they travel and survive solitarily [21]. The exploring ability is enhanced by the solitary action and the worst fitness is given by,
where,
The evolution of EHO is obtained by the separation and the updating operator. The obtained optimum threshold value from EHO is fed to the processing and segmentation of gray scale image using Benson and Niblack algorithm to obtain the resulted image [22].
The proposed method was implemented by Matlab 2017. The outcome of the proposed method shows the result of pre-processing and segmentation of CT image for knee osteoarthritis and the performance was evaluated with different measurement parameters as accuracy, sensitivity and specificity. To evaluate the efficiency, the output of proposed med technique is compared with different existing techniques.
In our proposed work, the sample CT bone images were considered from CT-ORG database. The sample dataset has 140 images of which 85 images were healthy (training set) and rests were used for testing purpose [23]. The resolution of the image is normalized as 512 × 512 pixel that demonstrates a clear deception of cartilage and joint [24].
The experimental result of Knee OA CT image using a correlation histogram analysis and the optimized thresholding is analysed through different steps;
From the experimental analysis, it is obvious that the osteoarthritis can be analysed and processed by this technique. As we mentioned in Fig. 6b the input CT image is enhanced using correlation histogram analysis that increased the intensity of the image. In Fig. 6c thresholding concept is applied that segmented the enhanced CT image based on Niblack and Bernsen algorithm as shown in Fig. 6d. Finally the segmented image is optimized using Elephant Herding optimization that isolated the osteoarthritis. Experimental result of the proposed technique is compared with different existing techniques to evaluate its performance.
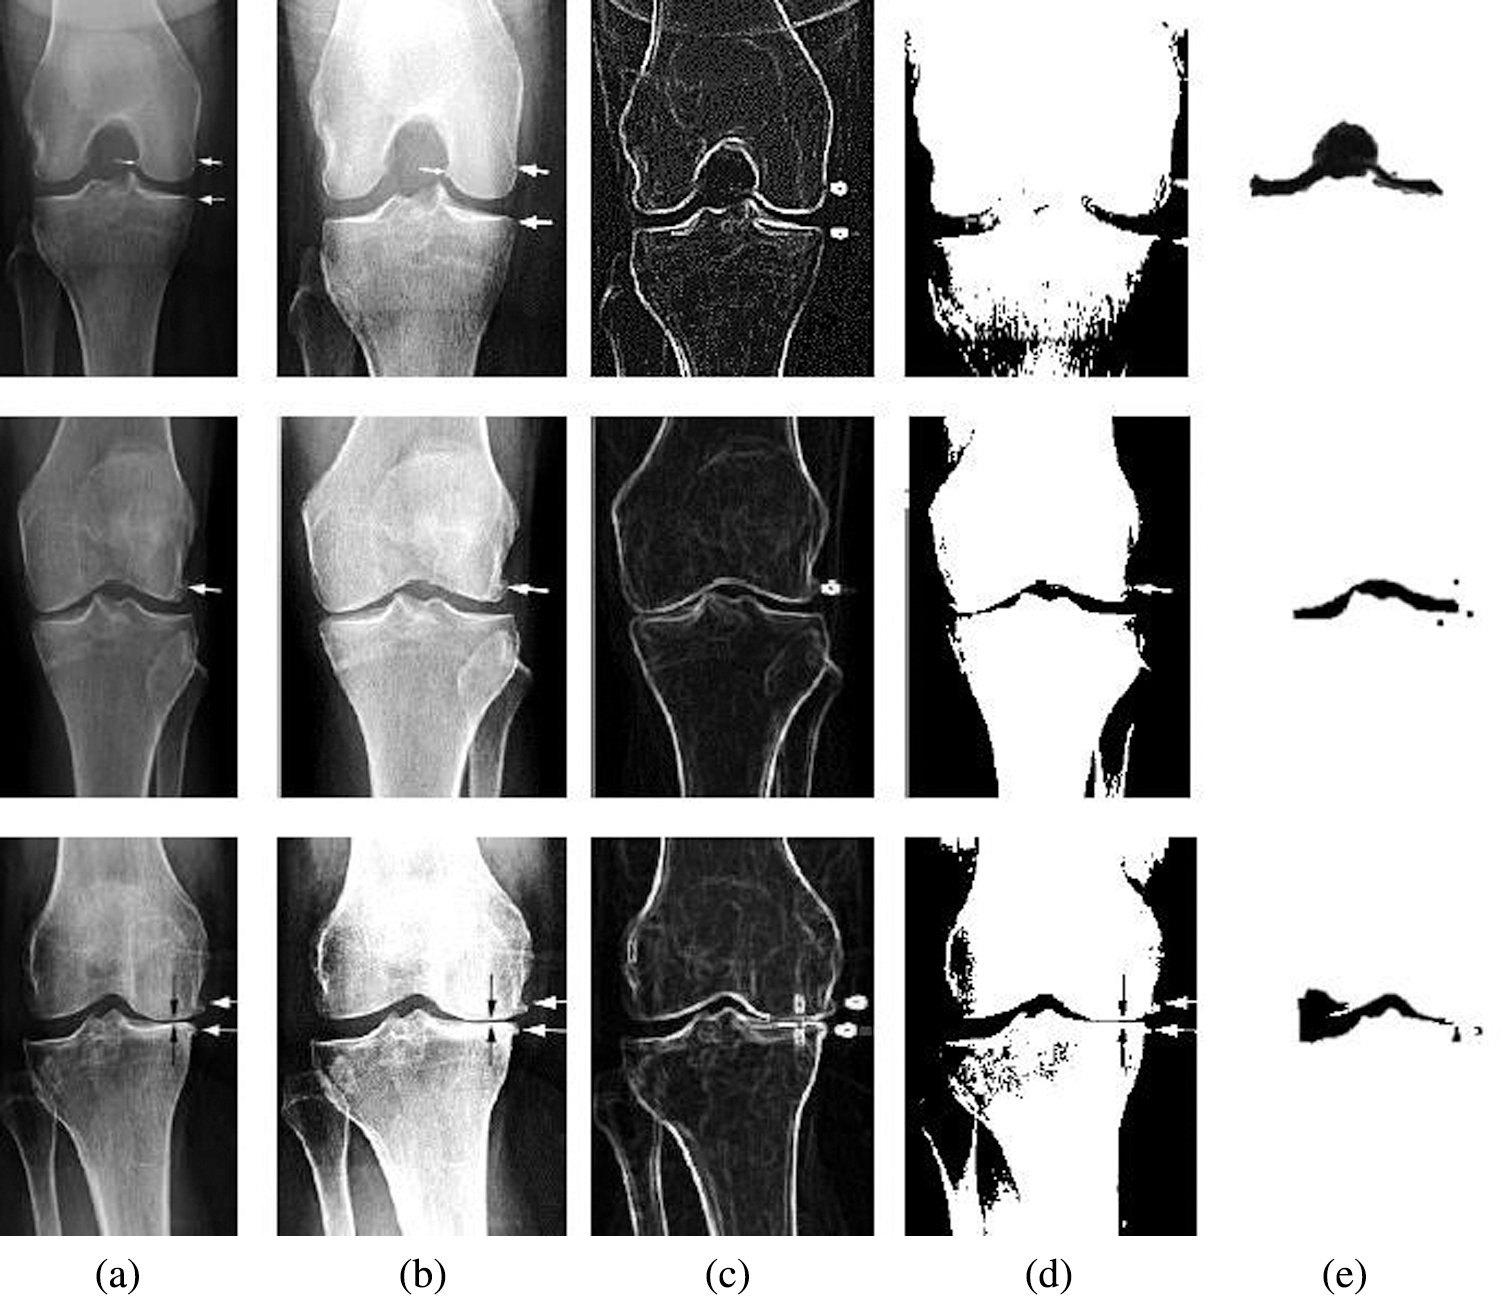
Figure 6: Experimental result of the proposed method with CT image samples (a) Sample images (b) Contrast enhanced image using correlation histogram (c) Thresholding (d) Niblack and Bernsen output (e) EH Optimized image
The experimental results were evaluated with MSE, PSNR and SSIM [25].
MSE: In the data, the MSE calculates the average square difference between the expected value and the present value of the errors. MSE represents the error ratio between the original and denoised images.
where,
PSNR: The MSE calculates the sum of the squares of the errors, i.e., the mean squared difference between the expected values and the actual value [26].
SSI: The similarity comparison of original and de-noised images is referred to as SSIM. The calculated performance evaluation metrics were averaged over the whole slice. The performance evaluation of knee OA enhancement technique is tabulated in Tab. 1.
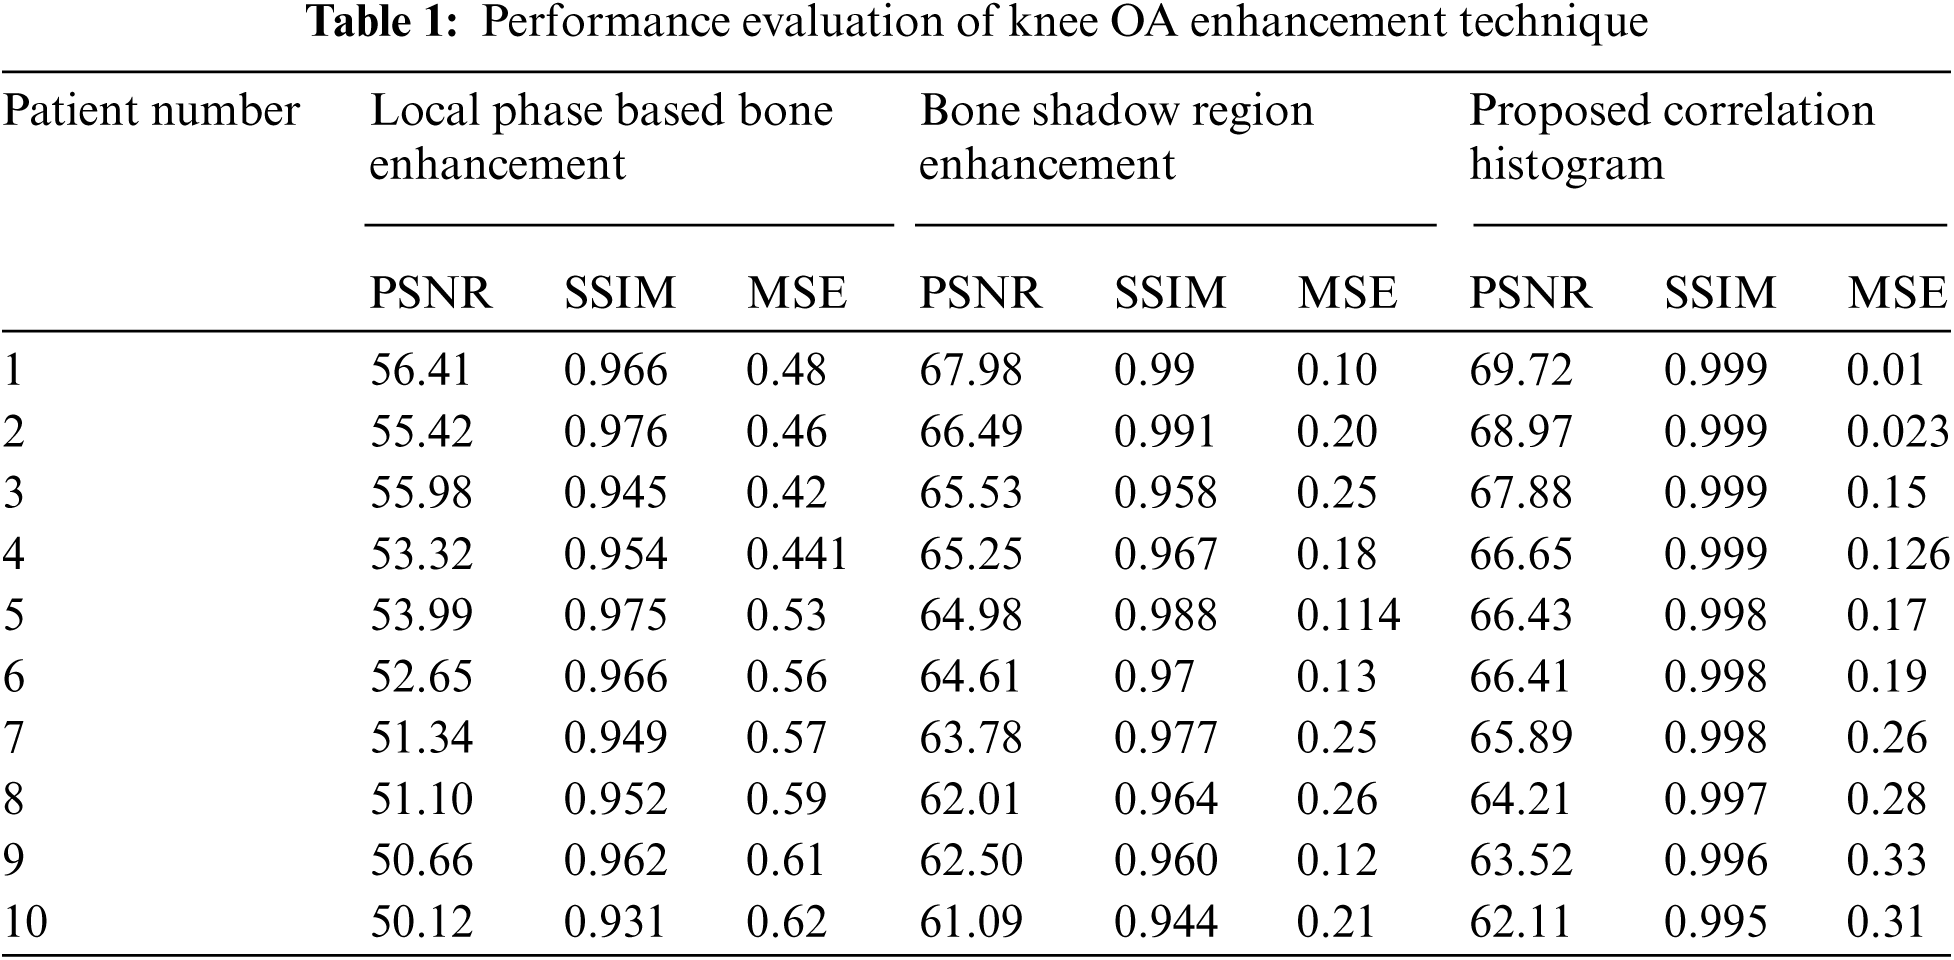
Figs. 7–9 represents the comparative analysis of the proposed technique with different existing enhancement techniques such as Local phase-based bone enhancement (LPBE) & Bone shadow region enhancement (BSRE). The analysis compares the PSNR, SSIM &MSR value of the proposed and existing techniques. Considering MSE, the proposed algorithm attains a minimum MSE of 0.01 at the maximum iteration. Considering PSNR, the highest PSNR value is attained 62.1 to 69.7 for the proposed. Considering SSIM, the graph linearly increases from 0.91 to 0.99 for the iterations. Compared to other techniques, the proposed algorithm attains a better SSIM of 0.999 at the maximum iteration. From the analysis graph it clearly shown that the proposed technique has better enhancement output. Tab. 2 signifies the Performance evaluation of knee OA segmentation.
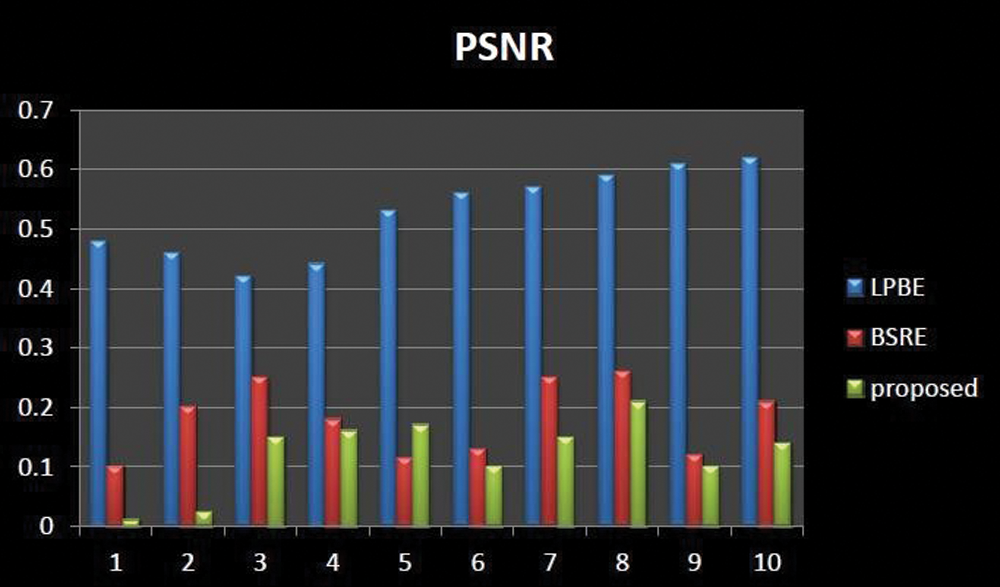
Figure 7: Comparative analysis of PSNR existing with our proposed
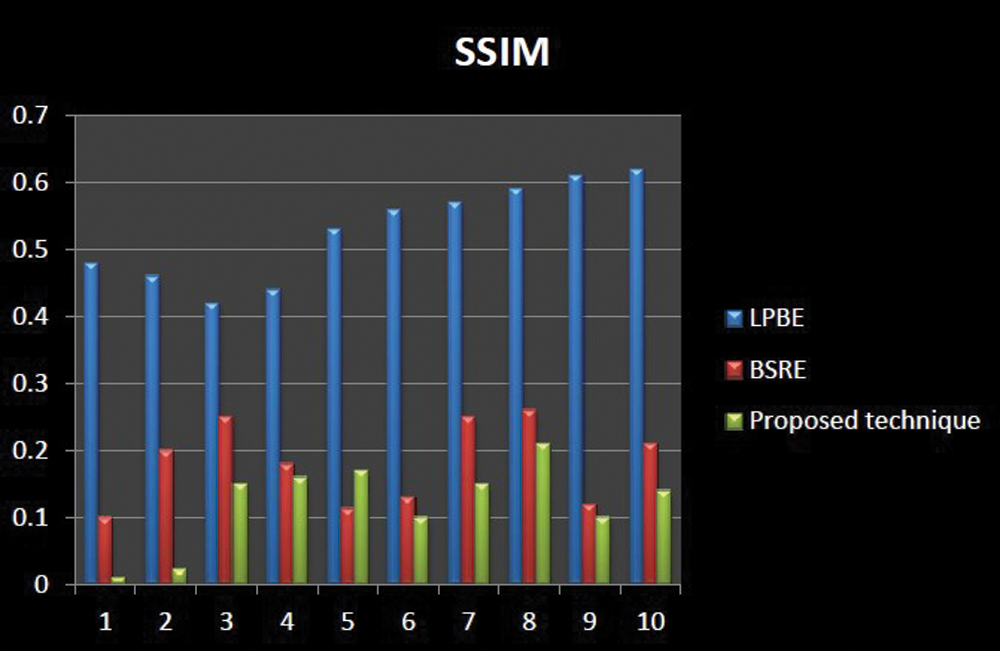
Figure 8: Comparative analysis of SSIM existing with our proposed
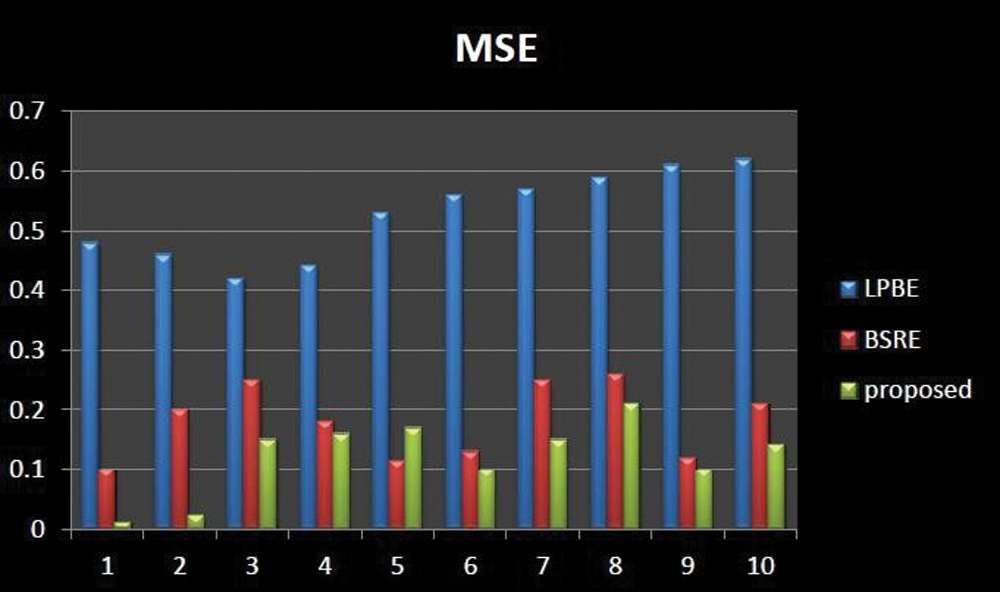
Figure 9: Comparative analysis of MSE existing with our proposed
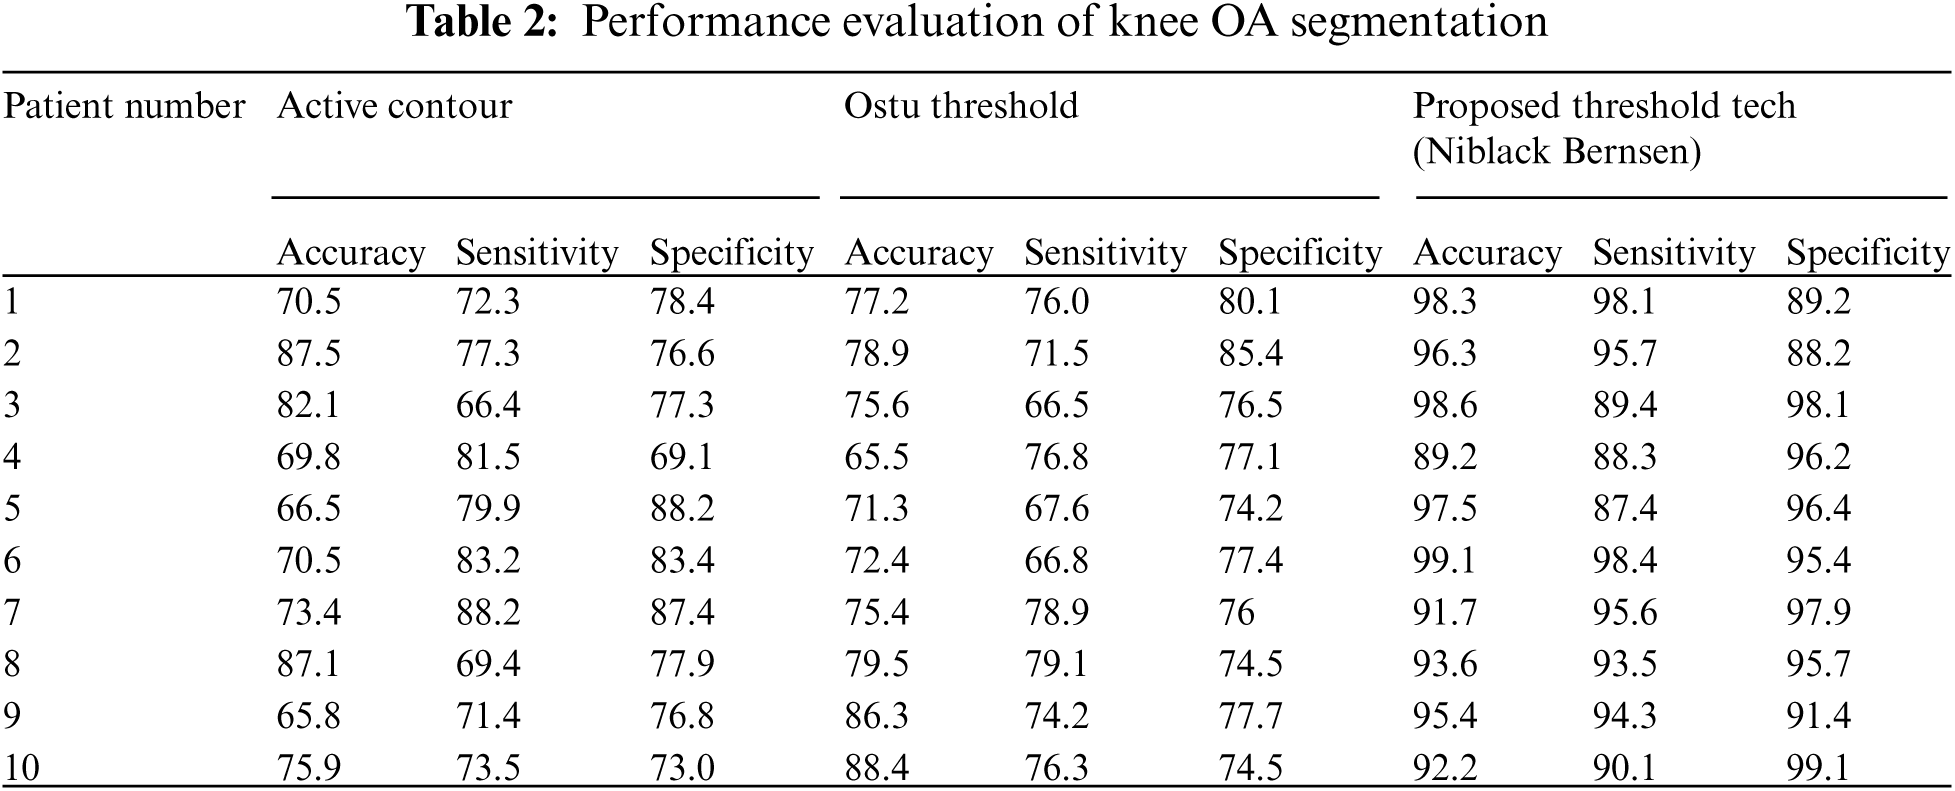
The comparative analysis of existing techniques with our proposed may show the outcome of accuracy of Knee OA segmentation technique is shown in Fig. 10. Accuracy refers to the degree to which reliable information in a spatial point is consistent with data on the categorized image. It's simple to figure out by dividing the number of correct guesses by the total number of predictions. The accuracy may be high when compared with existing techniques like Active contour and Ostu thresholding technique.
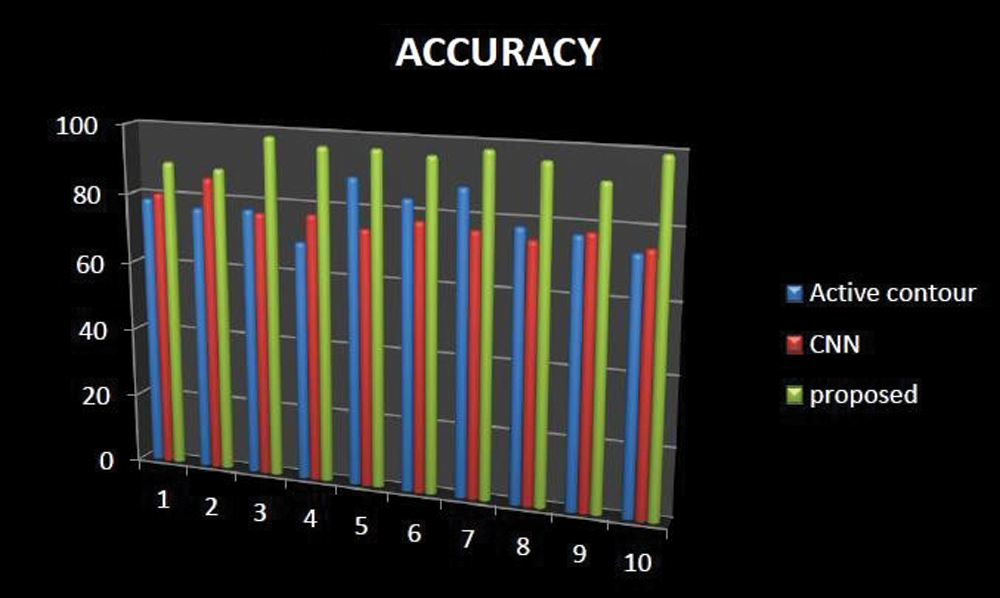
Figure 10: Comparative analysis of accuracy existing with our proposed
The percentage of actual positive values that are accurately detected is measured by sensitivity, while the percentage of negative values that are correctly identified is measured by specificity. The proportion of people who got a positive response on this test who truly have the illness is called sensitivity. The sensitivity had increased in our proposed technique when comparing with existing methods like active contour and Ostu thresholding technique is represented in Fig. 11.
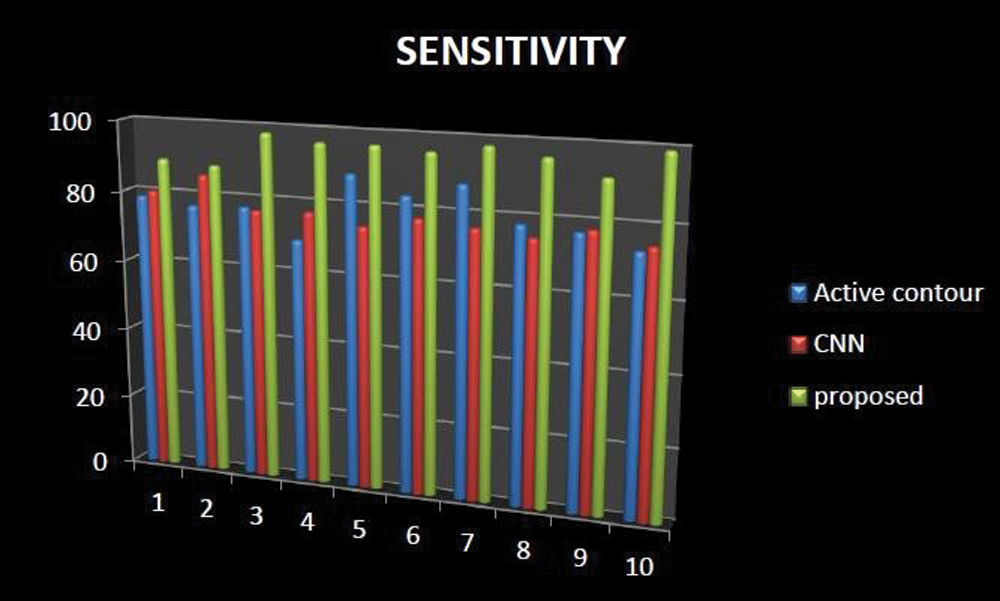
Figure 11: Comparative analysis of sensitivity existing with our proposed
The sensitivity had increased in our proposed technique when comparing with existing methods like active contour and Ostu thresholding technique, which is shown in Fig. 12. Comparison result of specificity shows our proposed technique increases. The average difference between the existing and proposed method had a great change. By using position checking and a semantic measure, Accuracy enhancement is the limitation of the work.
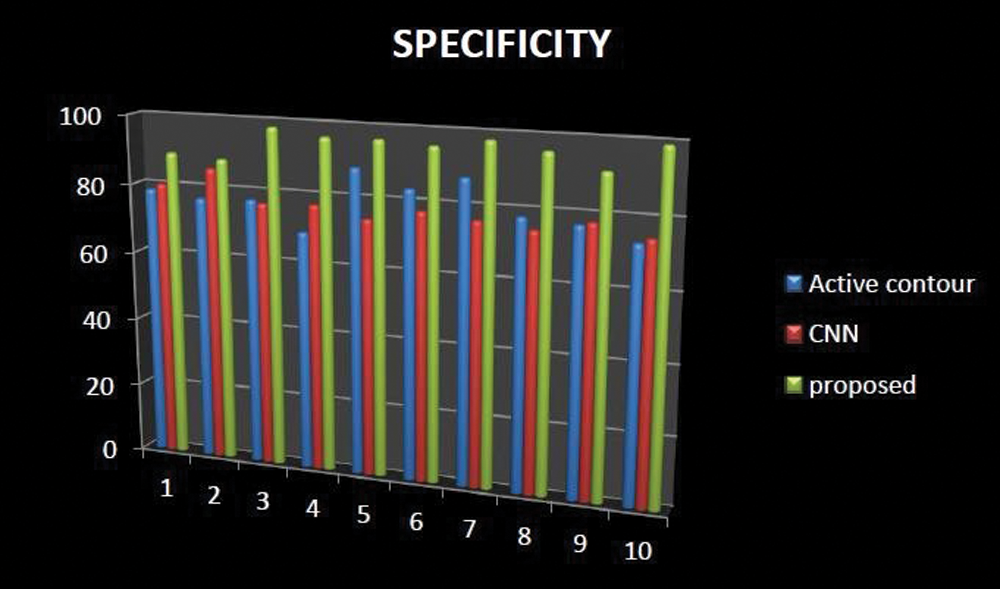
Figure 12: Specificity comparison of existing with our proposed
This paper proposes an EHO algorithm based on thresholding and segmentation to improve the efficiency of the CT image. The efficiency can be evaluated by accuracy, sensitivity and specificity. The image characteristics become more significant when the image is enhanced. The CT image enhancement relies on the image normalization followed by the enhancement of the image using histogram correlation. The further segmentation of the image takes place using the thresholding techniques named by EHO assimilated Niblack and Bernsen optimization. The time-efficient utility is needed to be enhanced in this approach for future enhancement.
Funding Statement: This research work was fully supported by King Khalid University, Abha, Kingdom of Saudi Arabia, for funding this work through a General Research Project under grant number RGP/119/42.
Conflicts of Interest: All authors declare that they have no conflicts of interest regarding the publication of this manuscript.
1. C. Kokkotis, S. Moustakidis, E. Papageorgiou, G. Giakas and D. E. Tsaopoulos, “Machine learning in knee osteoarthritis: A review,” Osteoarthritis and Cartilage, vol. 2, no. 3, pp. 1–13, 2020. [Google Scholar]
2. J. Victor, D. Van Doninck, L. Labey, B. Innocenti, P. M. Parizel et al., “How precise can bony landmarks be determined on a CT scan of the knee?,” The Knee, vol. 16, no. 5, pp. 358–365, 2009. [Google Scholar]
3. C. H. McCollough, J. T. Bushberg, J. G. Fletcher and L. J. Eckel, “Answers to common questions about the use and safety of CT scans,” Mayo Clinic Proceedings, vol. 90, no. 10, pp. 1380–1392, 2015. [Google Scholar]
4. J. Antony, K. McGuinness, N. E. O'Connor and K. Moran, “Quantifying radiographic knee osteoarthritis severity using deep convolutional neural networks,” in 23rd Int. Conf. on Pattern Recognition (ICPR), Cancun, Mexico, pp. 1195–1200, 2016. [Google Scholar]
5. A. Raj, S. Vishwanathan, B. Ajani, K. Krishnan and H. Agarwal, “Automatic knee cartilage segmentation using fully volumetric convolutional neural networks for evaluation of osteoarthritis,” in IEEE 15th Int. Symposium on Biomedical Imaging, Washington, DC, USA, pp. 851–854, 2018. [Google Scholar]
6. F. Liu, Z. Zhou, H. Jang, A. Samsonov, G. Zhao et al., “Deep convolutional neural network and 3D deformable approach for tissue segmentation in musculoskeletal magnetic resonance imaging,” Magnetic Resonance in Medicine, vol. 79, no. 4, pp. 2379–2391, 2018. [Google Scholar]
7. P. R. Desai and I. Hacihaliloglu, “Enhancement and automated segmentation of ultrasound knee cartilage for early diagnosis of knee osteoarthritis,” in IEEE 15th Int. Symposium on Biomedical Imaging (ISBI 2018), Washington, DC, USA, pp. 1471–1474, 2018. [Google Scholar]
8. P. Merkle, J. B. Singla, K. Müller and T. Wiegand, “Correlation histogram analysis of depth-enhanced 3D video coding,” in IEEE Int. Conf. on Image Processing, Hong Kong, China, pp. 2605–2608, 2010. [Google Scholar]
9. H. B. Kekre and S. D. Thepade, “Color traits transfer to grayscale images,” in First Int. Conf. on Emerging Trends in Engineering and Technology, Nagpur, India, pp. 82–85, 2008. [Google Scholar]
10. L. Vincent, “Grayscale area openings and closings, their efficient implementation and applications,” in EURASIP Workshop on Mathematical Morphology and its Applications to Signal Processing, Barcelona, Spain, pp. 22–27, 1993. [Google Scholar]
11. K. Qin, K. Xu, F. Liu and D. Li, “Image segmentation based on histogram analysis utilizing the cloud model,” Computers & Mathematics with Applications, vol. 62, no. 7, pp. 2824–2833, 2011. [Google Scholar]
12. H. Y. Chai, T. T. Swee, G. H. Seng and L. K. Wee, “Multipurpose contrast enhancement on epi-physeal plates and ossification centers for bone age assessment,” Biomedical Engineering, vol. 12, no. 1, pp. 1–19, 2013. [Google Scholar]
13. Y. C. Hum, K. W. Lai and M. I. Mohamad Salim, “Multiobjectives bihistogram equalization for image contrast enhancement,” Complexity, vol. 20, no. 2, pp. 22–36, 2014. [Google Scholar]
14. K. Wongsritong, K. Kittayaruasiriwat, F. Cheevasuvit, K. Dejhan and A. Somboonkaew, “Contrast enhancement using multipeak histogram equalization with brightness preserving,” in APCCAS IEEE Asia-Pacific Conf. on Circuits and Systems. Microelectronics and Integrating Systems Proc., Chiang Mai, Thailand, pp. 455–458, 1998. [Google Scholar]
15. M. M. Fatihin, F. Baskoro and L. Anifah, “Texture analysis of knee osteoarthritis using contrast limited adaptive histogram equalization based gray level co-occurrent matrix,” in Third Int. Conf. on Vocational Education and Electrical Engineering (ICVEE), Surabaya, Indonesia, pp. 1–4, 2020. [Google Scholar]
16. S. Kashyap, H. Zhang, K. Rao and M. Sonka, “Learning-based cost functions for 3-d and 4-d multi-surface multi-object segmentation of knee mri: Data from the osteoarthritis initiative,” IEEE Transactions on Medical Imaging, vol. 37, no. 5, pp. 1103–1113, 2017. [Google Scholar]
17. A. Raj, S. Vishwanathan, B. Ajani, K. Krishnan and H. Agarwal, “Automatic knee cartilage segmentation using fully volumetric convolutional neural networks for evaluation of osteoarthritis,” in IEEE 15th Int. Symposium on Biomedical Imaging (ISBI 2018), Washington, DC, USA, pp. 851–854, 2018. [Google Scholar]
18. S. S. Gornale, P. U. Patravali, A. M. Uppin and P. S. Hiremath, “Study of segmentation techniques for assessment of osteoarthritis in knee X-ray images,” International Journal of Image, Graphics and Signal Processing (IJIGSP), vol. 11, no. 2, pp. 48–57, 2019. [Google Scholar]
19. H. Zeng, X. Xie, H. Cui, Y. Zhao and J. Ning, “Hyper spectral image restoration via CNN denoiser prior regularized low-rank tensor recovery,” Computer Vision and Image Understanding, vol. 197, pp. 1–11, 2020. [Google Scholar]
20. S. Wang, B. Wen, J. Wu, D. Tao and Z. Wang, “Segmentation-aware image denoising without knowing true segmentation,” ArXiv preprint ArXiv, arXiv:1905.08965, pp. 1–10, 2019. [Google Scholar]
21. S. S. Gornale, P. U. Patravali, K. S. Marathe and P. S. Hiremath, “Determination of osteoarthritis using histogram of oriented gradients and multiclass SVM,” International Journal of Image, Graphics and Signal Processing, vol. 9, no. 12, pp. 41–49, 2017. [Google Scholar]
22. P. Desai and I. Hacihaliloglu, “Knee-cartilage segmentation and thickness measurement from 2D ultrasound,” Journal of Imaging, vol. 5, no. 4, pp. 1–17, 2019. [Google Scholar]
23. M. Kaur, S. Sofat and D. K. Chouhan, “Review of automated segmentation approaches for knee images,” IET Image Processing, vol. 15, no. 2, pp. 302–324, 2021. [Google Scholar]
24. J. S. S. Yin, T. T. Swee, A. B. Yahya, M. T. F. Thye, K. L. C. Hiik et al., “Prominent region of interest contrast enhancement for knee MR images: Data from the OAI,” Journal Kejuruteraan, vol. 32, no. 3, pp. 145–155, 2020. [Google Scholar]
25. H. Y. Chai, T. T. Swee, G. H. Seng and L. K. Wee, “Multipurpose contrast enhancement on epiphysis plates and ossification centers for bone age assessment,” Biomedical Engineering, vol. 12, no. 1, pp. 1–19, 2013. [Google Scholar]
26. Y. Kang, K. Engelke and W. A. Kalender, “A new accurate and precise 3-D segmentation method for skeletal structures in volumetric CT data,” IEEE Transactions on Medical Imaging, vol. 22, no. 5, pp. 586–598, 2003. [Google Scholar]
 | This work is licensed under a Creative Commons Attribution 4.0 International License, which permits unrestricted use, distribution, and reproduction in any medium, provided the original work is properly cited. |