DOI:10.32604/cmc.2022.023670
| Computers, Materials & Continua DOI:10.32604/cmc.2022.023670 | |
| Article |
Transfer Learning-based Computer-aided Diagnosis System for Predicting Grades of Diabetic Retinopathy
1College of Computer and Information Sciences, Imam Mohammad Ibn Saud Islamic University (IMSIU), Riyadh, 11432, Saudi Arabia
2Department of Electrical Engineering, Benha Faculty of Engineering, Benha University, Qalubia, Benha, 13518, Egypt
*Corresponding Author: Qaisar Abbas. Email: qaabbas@imamu.edu.sa
Received: 16 September 2021; Accepted: 25 October 2021
Abstract: Diabetic retinopathy (DR) diagnosis through digital fundus images requires clinical experts to recognize the presence and importance of many intricate features. This task is very difficult for ophthalmologists and time-consuming. Therefore, many computer-aided diagnosis (CAD) systems were developed to automate this screening process of DR. In this paper, a CAD-DR system is proposed based on preprocessing and a pre-train transfer learning-based convolutional neural network (PCNN) to recognize the five stages of DR through retinal fundus images. To develop this CAD-DR system, a preprocessing step is performed in a perceptual-oriented color space to enhance the DR-related lesions and then a standard pre-train PCNN model is improved to get high classification results. The architecture of the PCNN model is based on three main phases. Firstly, the training process of the proposed PCNN is accomplished by using the expected gradient length (EGL) to decrease the image labeling efforts during the training of the CNN model. Secondly, the most informative patches and images were automatically selected using a few pieces of training labeled samples. Thirdly, the PCNN method generated useful masks for prognostication and identified regions of interest. Fourthly, the DR-related lesions involved in the classification task such as micro-aneurysms, hemorrhages, and exudates were detected and then used for recognition of DR. The PCNN model is pre-trained using a high-end graphical processor unit (GPU) on the publicly available Kaggle benchmark. The obtained results demonstrate that the CAD-DR system outperforms compared to other state-of-the-art in terms of sensitivity (SE), specificity (SP), and accuracy (ACC). On the test set of 30,000 images, the CAD-DR system achieved an average SE of 93.20%, SP of 96.10%, and ACC of 98%. This result indicates that the proposed CAD-DR system is appropriate for the screening of the severity-level of DR.
Keywords: Diabetic Retinopathy; retinal fundus images; computer-aided diagnosis system; deep learning; transfer learning; convolutional neural network
One of the major causes of severe vision-loss among patients of diabetes is diabetic retinopathy (DR). DR is an asymptomatic disease, and it has no prior symptoms. However, many patients are suffered vision-loss without any proper diagnosis and treatment [1]. According to the statistics of [2], 285 million population have diabetes, and one-third have signs of DR. In daily practice, ophthalmologists use non-mydriatic fundus images and Computer-aided diagnosis (CAD) programs for the early assessment/grade severity level of DR. The detection of lesions caused by DR is the basis of these earliest detection of DR. Those DR-related lesions in the fundus image are unhealthy objects appear on the retinal surface such as micro-aneurysms (MA's), exudates (EX's), hemorrhages (HEM's) and cotton wool spots (CWS). The visual example of such DR-related lesions along with severity-level is shown in Fig. 1. Proliferative (PDR) and nonproliferative (NPDR) are two main types of DR, where PDR is advanced form of eye disease, and NPDR is an early sign of DR stage. As shown in this figure, there are five grades of severity-level of DR such as (severity 0: normal, severity 1: mild NPDR, severity 2: moderate NPDR, severity 3: severe NPDR and severity 4: PDR). Manual segmentation and count of DR-related lesions by clinicians is a difficult and repetitive task. Moreover, the manual grading of DR requires extensive domain-expert knowledge and reader inter-/intra-class variability experience [3–5].
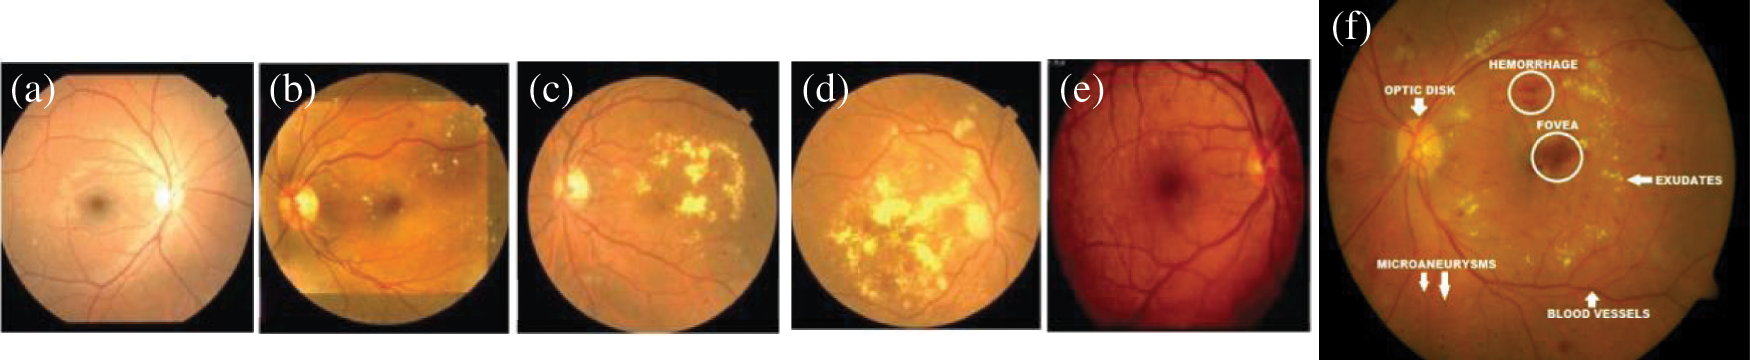
Figure 1: A visual example of five severity stages of DR and two main categories Proliferative (PDR) and nonproliferative (NPDR), where (a) Shows the (severity 0: normal), (b) Severity 1: mild NPDR, (c) Severity 2: moderate NPDR, (d) Severity 3: severe NPDR, and (e) Severity 4: PDR along with sample of DR-based lesions (f)
Previously, several CAD systems have been developed to recognize grades of DR in the clinical setting by digital retinograph images. However, those CAD systems assist ophthalmologists to better screening of patients. As a result, the CAD systems helps clinical experts to identify the early signs of eye-related abnormality, which is difficult to identify by human naked eyes. It noticed that the DR is easily detected by a CAD system to grade the severity-level by using image processing and machine-learning techniques [6] on retinograph images. Nowadays, the CAD systems for recognition of grades of DR are affected by various factors such as (1) it is very much difficult to identify DR-related lesions and anatomical structure of retinograph, (2) it is also difficult to detect accurate and early stage of retinal structure because it changes during the time, and (3) there is a dire need to develop the effective and automatic CAD system to accurate screening of DR-related diseases. Currently, many deep learning (DL) models especially deep convolution neural networks (CNN) have demonstrated outperform performance in the grading of DR severity-levels. Thus, we have used also deep transfer learning (TL) technique to recognize stages of DR with a pre-processing step to solve the above-mentioned problems. In addition, the proposed system is capable to work on much larger datasets and to reduce the inter-reader variability.
The main contribution of proposed CAD-DR classification system are as follows.
1) A preprocessing step is developed in a perceptual-oriented CIEL*a*b* color space to enhance the contrast and adjust the light-illumination.
2) A pretrain TL (DL) approach is used through expected gradient length (EGL) to eliminate the need of large number of labeled fundus images. This step reduces training efforts for CNN model.
3) To develop PCNN, the 14-layer CNN network was pre-trained using fewer labeled fundus images. This can assist PCNN system to learn simple to complex fundus feature.
4) Useful masks can be generated by the proposed PCNN system to predict and segment DR-related regions.
5) To the best of our knowledge, there is no previous CAD-DR model in the medical imaging field that works in harmony with CNN parameters to select the most informative patches and images.
6) State-of-the-art comparisons are also performed to test and evaluate the performance of proposed CAD-DR system.
The rest of the paper is organized as follows. Section 2 shows the literature review of the recent works related to the recognition of multistage of diabetic retinopathy (DR). In Section 3, the proposed methodology is described along with the acquisition dataset. Experimental results and comparisons with state-of-the-art methods are presented in Section 4. The discussion about the paper is described in Section 5 and finally, the paper concludes in Section 6.
Deep learning (DL) models especially deep convolution neural networks (CNN) have demonstrated outperform performance in the grading of DR severity levels in several settings and on several datasets when compared with traditional hand-designed methods [6]. A data science platform named Kaggle launched a DR detection competition in 2015, the top participants used different settings of CNN models on approximately 35,000 high-resolution labeled fundus images. They achieved that successful training of such CNN networks was based on the large size of annotated samples. In a previous study [7], a CNN model was developed with data augmentation to classify DR into five stages such as normal, mild NPDR, moderate NPDR, severe NPDR, and proliferative PDR. Their model was trained on more than 100,000 labeled images, yielded comparable performance with a clinical expert. Similarly, Harry et al. in [8] trained a 13-layer CNN model on 80,000 labeled images and obtained significant results in a classification of five severity-level of DR. Another study in [9], a training procedure of CNN model was completed using 8,810 images and obtained comparable results with ophthalmologists. This presents a challenge in clinical practice, as the computational systems need thousands of labeled images to be feed to learn features, representing a time-consuming and expensive process. For a real-time scenario, a well-performing algorithm requires such as a fewer data-intensive CNN model that learns with a few labeled samples. Although, it observed that the previous CAD systems tried to detect DR-related lesions [10] to recognize diabetic retinopathy. Those CAD systems are briefly described in the upcoming paragraphs and compared in Tab. 1.
Reference [11] shows the Faster-RCNN deep-learning (DL) based method to classify five stages of DR lesions without using image preprocessing step for contrast enhancement and adjustment of light illumination. To extract features from retinograph images, the authors used the DenseNet-65 DL model, and then the Faster-RCNN model is finally utilized to recognize the severity-level of DR. For evaluation of the Faster-RCNN model, they used Kaggle and APTOS datasets to achieve 97.2% of accuracy. The reference [12] showed that the current CAD systems for DR are expensive in computation and lack the ability to extract highly nonlinear features that are needed to classify it into five stages. In that study, they utilized the lowest possible learnable parameters were used to speed up the training and have faster convergence. They developed a VGG-NiN model based on the VGG16 transfer learning and spatial pyramid pooling layer. On collected datasets, they showed 83.5% classification accuracy on five stages of DR in comparison to other systems. Whereas in [13], a pretrain based transfer learning algorithm (CNN) was used to detect five stages of DR from retinograph images. They showed that the CNN model based on pretrain strategy achieved higher performance compared to other systems. Similarly, in [14], they used transfer learning (TL) with representational learning to recognize multiple stages of DR. They utilized the Inception-v4 TL pretrain model with fine-tune step. To grade DR into five stages, they used fine-tune to achieve 96.6% accuracy.
In this research [15], the author's developed preprocessing-based segmentation along They used saliency maps detection to highlight anatomical structures of lesions compared to the background. Afterward, the structure tensor technique was applied to enhance the edges of the lesions and active contours is performed to accurately segment DR-related lesions. Finally, they used the VGG-19 pretrain TL model to identify the level of severity of DR. The experiments were performed on the Kaggle dataset consists of 20,000 images. On average, they reported 82% of sensitivity and 96% of accuracy. In contradiction with the above-mentioned approaches, the researchers in [16] developed a recognition system of three stages-based DR instead of five severity-level of DR. In that study, they used semantic segmentation to detect microaneurysm along with CNN model to recognize three-stages of DR.
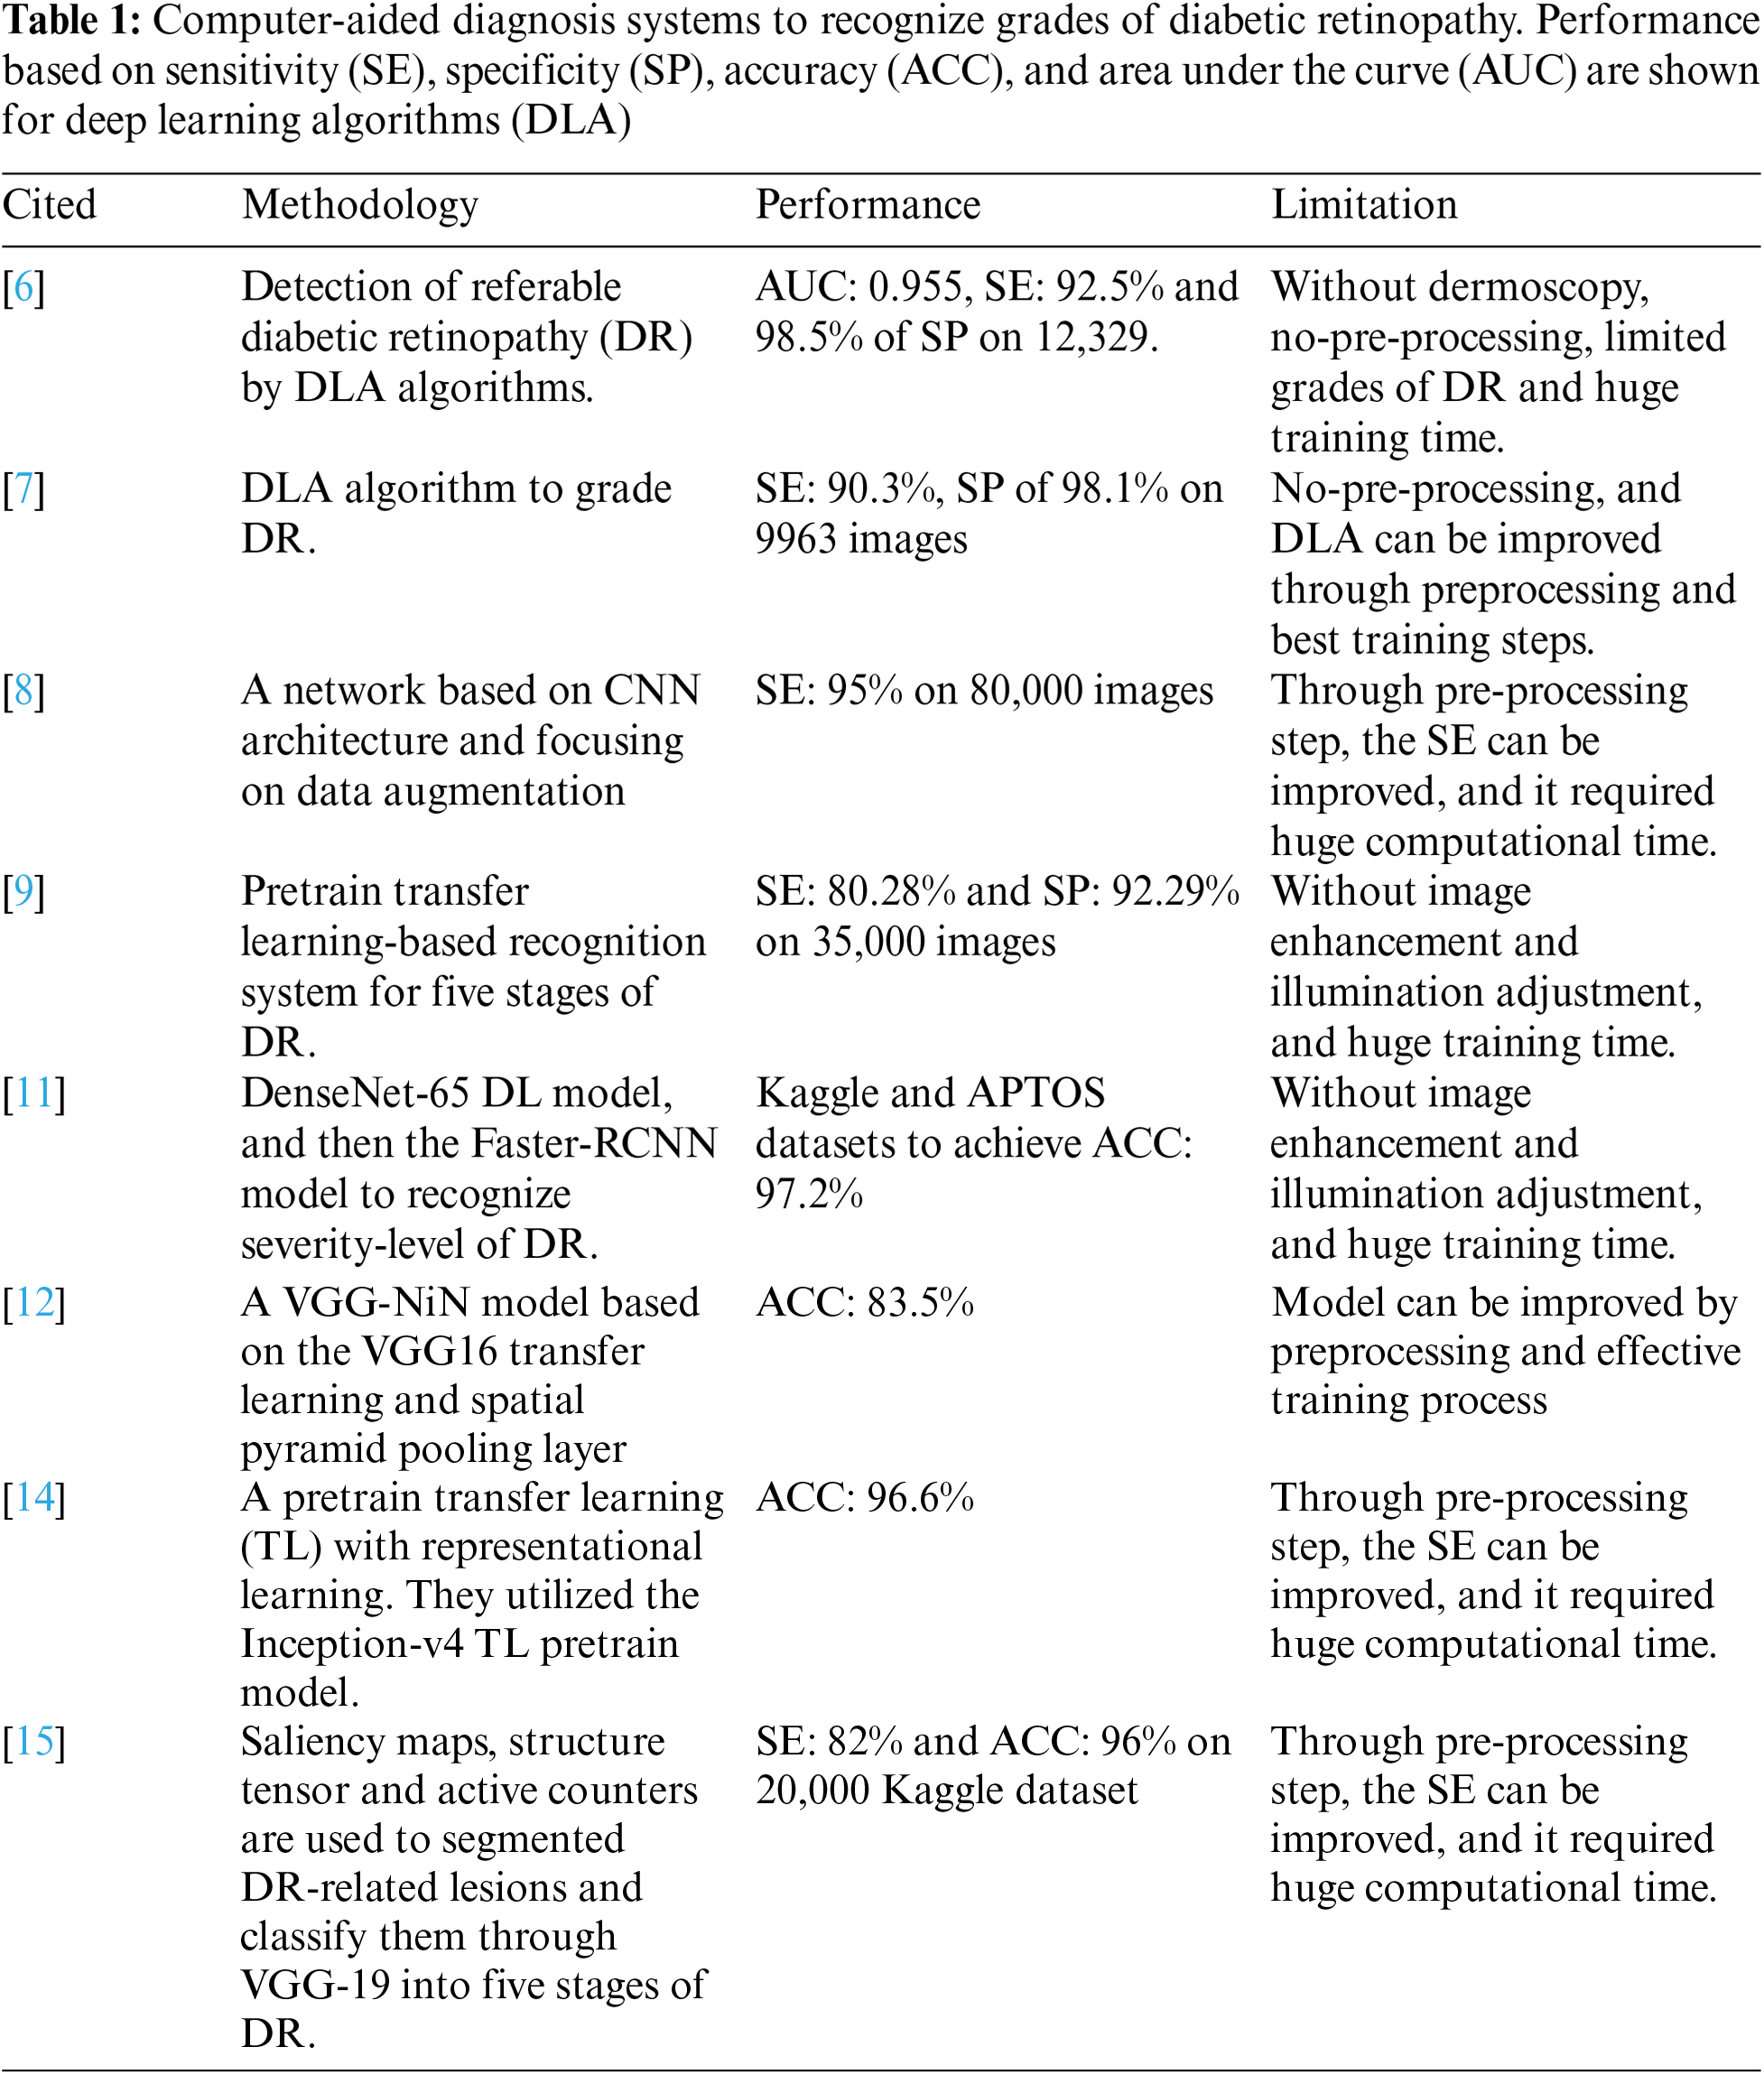
The Fig. 2 shows a systematic flow diagram of our proposed CAD-DR system through pretrain transfer-learning based model. The CAD-DR system is developed in different phases. In the first phase, the retinograph image is transferred to perceptual-oriented CIE L*a*b* uniform color space and preprocessed it to adjust light illumination and enhance the contrast. In the next phase, the fourteen layers of CNN architecture is proposed by a pretrain transfer learning strategy. In first 10 layers, the different convolutional filters are used along with ReLU, BN and max pool layers. Next, the BN, Max pool and dropout layers are integrated and lastly, the ReLU and SoftMax layers are integrated to recognize five stages of DR.
3.1 Data Acquisition and Platform
To pretrain and evaluate the proposed CAD-DR system, the retinograph images are obtained from the Kaggle platform [17]. The images in this dataset are captured from various patients in different light illumination, many age groups and different people's ethnicity. Due to these variations, it makes distortion of pixel intensity within the image and creates other variations that affect the classification results. To overcome these issues, the contrast enhancement and light adjustment of retinograph images are implemented through uniform color space and non-linear wavelet technique as stated in [18]. After image normalization, the dataset resized to 48 × 48 pixels which retained the fundus feature to identify and thus reduced memory size of dataset the GeForce GTX TITAN X 1080GPU could handle. Each image of the patient can only have one label corresponding to a single group depending on the divisions outlined for the dataset. Moreover, while testing to measure the performance of PCNN network, only unseen patches of patient images are considered.
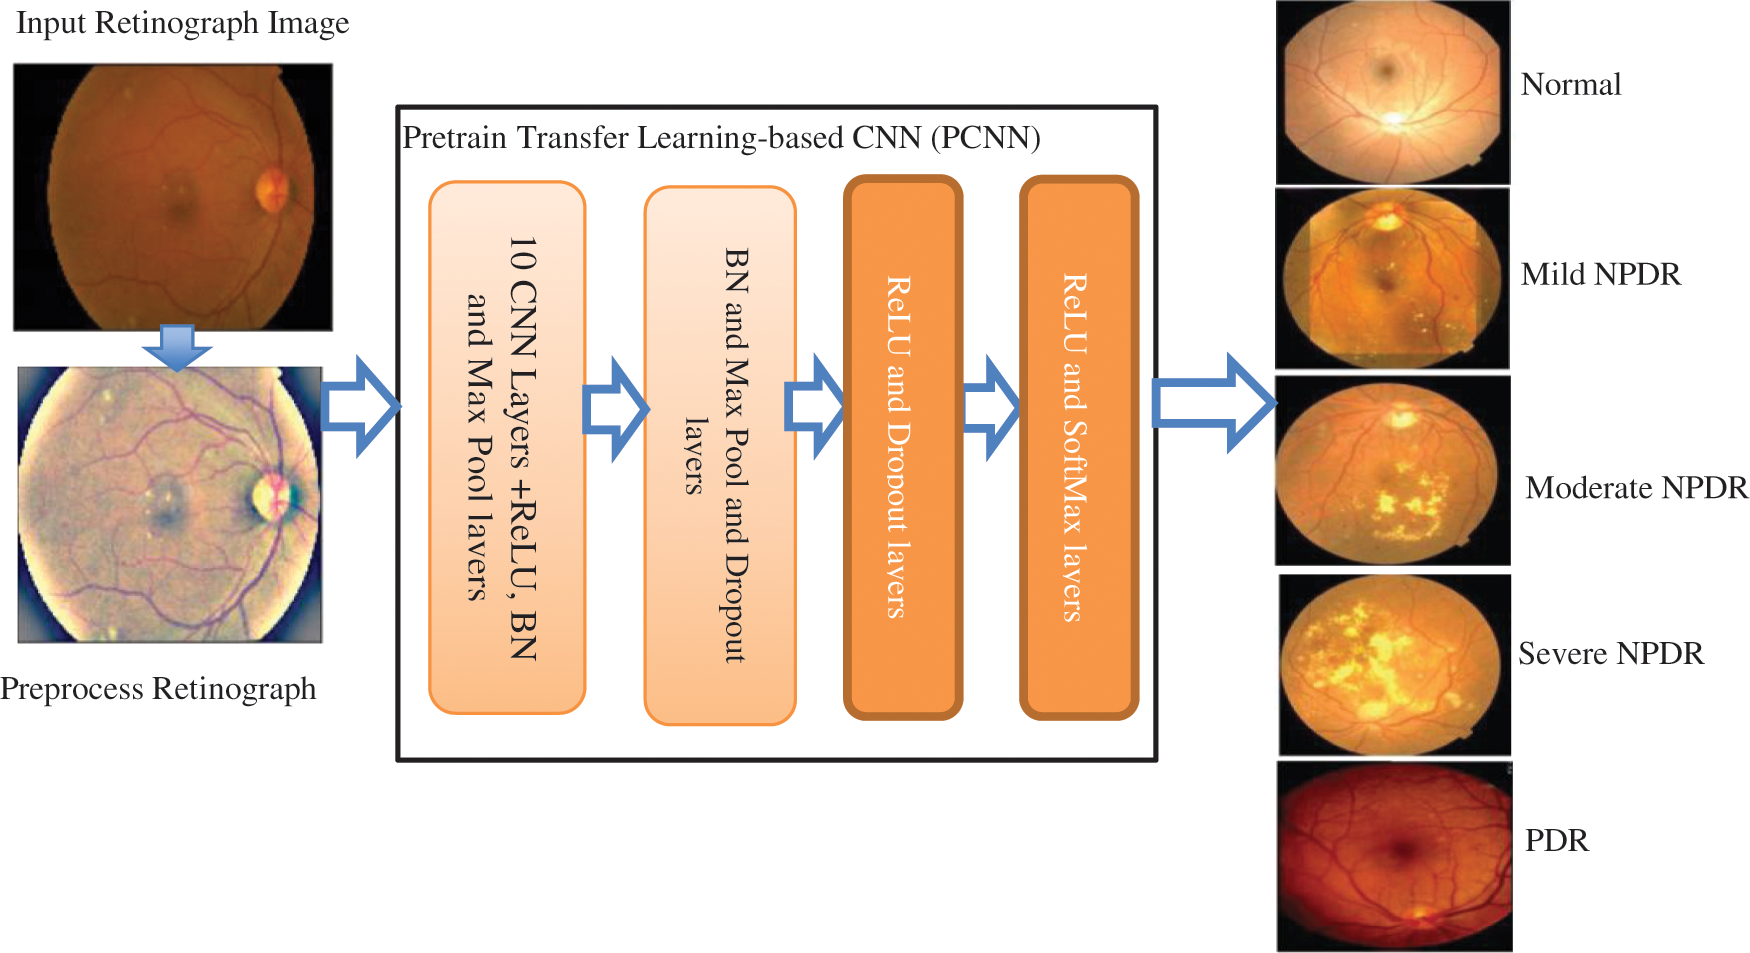
Figure 2: The proposed CAD-DR system to recognize five severity-level of diabetic retinopathy shown as a systematic flow diagram
The proposed CAD-DR based on PCNN model is trained using 80,000 images from the publicly available Kaggle dataset. Each image has a resolution of 6 M pixel and rated by the clinician for the presence of DR into five graded such as 0-normal, 1-mild DR, 2-moderate DR, 3-severe DR and 4-proliferative DR. These scales were used as labels to develop PCNN model. The training and testing procedures of PCNN are accomplished by using 50,000/30,000 images. All experimental codes were written in Python 3.6 and deep learning package Keras (http://keras.io/) with the TensorFlow (http://deeplearning.net/software/tensorflow/) backend. These platforms are used because of their low computational time, easy access to parameters and maturity level. The GeForce GTX TITAN X 1080GPU having a memory of 12 GB is the hardware used for the experiments. The proposed PCNN model classified image into each DR class in 0.04 s that shows the possibility of real-time feedback to the patient.
To avoid overfitting and to improve the localization power of the proposed CAD-DR system, a dropout of 0.5 value on dense layers 12 and 13 with data augmentation such as flipping (horizontal and vertical) and random rotation 0◦–270◦ degrees are utilized. After data augmentation and cropping steps, the dataset splits are undertaken. For this purpose, patches of each class are chosen randomly as follows: 8,760/1,314 patches for each of the classes in the training and testing splits. This data augmentation step is implemented through Albumentations library functions.
3.3 Preprocessing to Enhance Contrast and Illumination Adjustment
Retinograph images are captured from different devices and environment conditions. A visual example is displayed in the Fig. 3. As a result, the preprocessing step is trying to enhance the patterns, which are presented in the DR-related lesions at the same time to decrease the training efforts in the classification phase. The selected space is kept as close as possible to human perception because the enhancement algorithm aims to help doctors in their diagnosis of retinopathy.
Figure 3: A visual example of the preprocessing step to enhance the original input retinograph images (See Fig. (a)), correct light illumination (See Fig. (b) L* image) and improve contrast (See Fig. (c)) in a perceptual-oriented color space
In practice, the color retinograph images can be characterized in different color spaces such as HSV (hue, saturation, value), RGB (red, green, blue), CIELUV, etc. The uniform color space is dependent on the application because the color space is very important for image enhancement. The HSV and RGB are not uniform color spaces so they cannot be adopted for image enhancement. As a result, if choose the right color space then the image enhancement method is helping the ophthalmologists in the diagnosis eye-screening process. Hence, it is required that the selected space must be as close as possible to human perception. The CIE L*a*b* and CIE L*u*v* color spaces are closed to human perception, but the CIE L*u*v* color space has a problem of white adaptation that can lead to poor image enhancement results. Therefore, in this paper, we have used CIEL*a*b* color space. To perform image enhancement on retinograph images, the first step is transformed from the un-uniform RGB image into uniform perceptual-oriented color space (CIEL*a*b*). To perform this step, The only available color spaces close to human perception are CIE L*a*b* and CIE L*u*v* and both have been extensively used. It may be noted that the white adaptation in CIE L*u*v* can lead to poorer results as mentioned before. The white adaptation has a subtractive change that involves a vector displacement instead of the multiplicative normalization that will produce the desired proportional movement. Therefore, our proposed algorithm initially transform the images from the RGB color space used by the acquisition device to CIE L*a*b* color space.
Contrast enhancement method that preserves the characteristically features of the images using multiscale discrete-shearlet transform (DST), the perceptual uniform color space CIE L*a*b* and a local-influence control function. The DST technique has provided in the past an efficient multiscale directional representation of the image in a discrete framework and it is, therefore, better suited for multi-scale edge enhancement than the traditional wavelet decomposition. The method follows three main steps: firstly, the DST coefficients of L* plane in the corresponding subbands are modified by a Ben Graham's method [19] to enhance the conditions of illumination for the images so that we can augment the perceptions from eye images and contrast adjustments, respectively. Secondly, the inverse transform is applied to modify L* coefficients for a better reconstruction and visualization without generating artifacts. Thirdly, a* and b* planes are combined with this lightness component to perform the final enhancement.
3.4 Architecture of Pretrain Transfer Learning
To develop this CAD-DR system, the pretrain CNN model is utilized as a basis and the corresponding layers are selected as required to recognize five stages of DR. This research uses a 14-layer CNN architecture, shown in Fig. 4, after studying the literature for other complex image recognition tasks. It is perceived that an increased number of layers allows the network to learn the deepest features. For instance, the initial convolutional layer learns basic features like edges, while the last convolutional layer performs a learning process of DR lesions. This PCNN model consists of an input patch layer followed by the convolutional layer, max pooling, and fully connected layers. The soft-max classifier is used in the last fully connected layer to perform five severity levels of DR classification. Leaky rectifier linear unit (ReLU) with 0.01 value and then batch normalization was used as hyper-parameters after each convolutional layer to stop over-reliance on nodes in a network and to control feature maps per block. A kernel size of 3 × 3 and 2 × 2 was applied to perform max pooling. Similarly, the initialization of network layers was performed using the weights and biases from the method stated in [20]. Gaussian distribution technique was also applied to initialize the network to reduce training time and to randomly generate biases for the last fully connected layer.
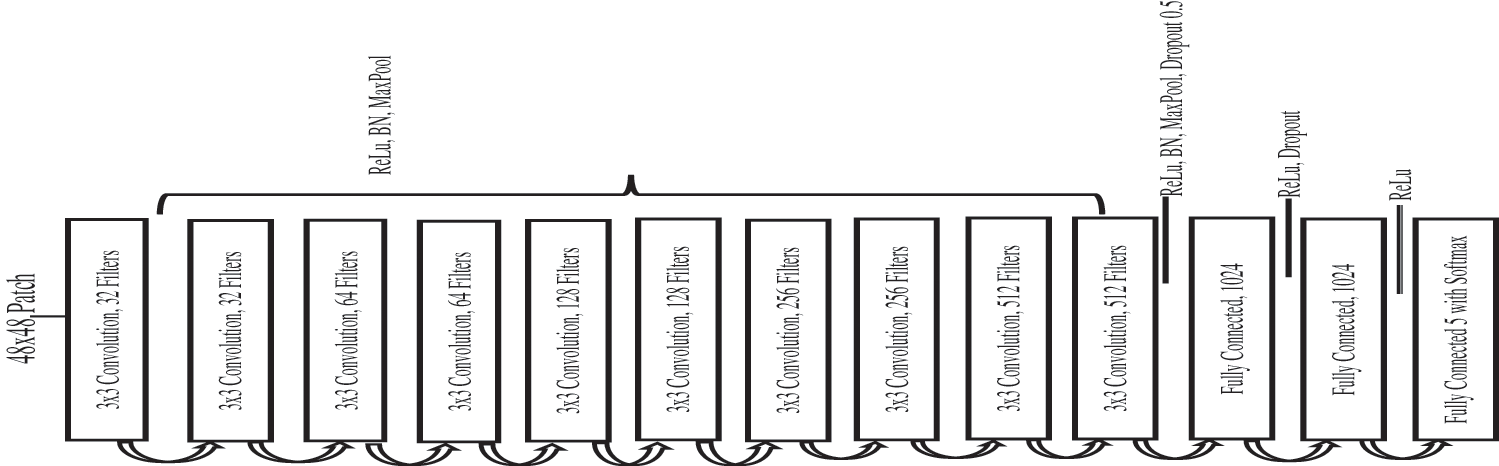
Figure 4: Proposed architecture of pretrain convolutional neural network (PCNN) model by using transfer learning-based CNN network
3.5 Procedure of Pretrain Transfer Learning
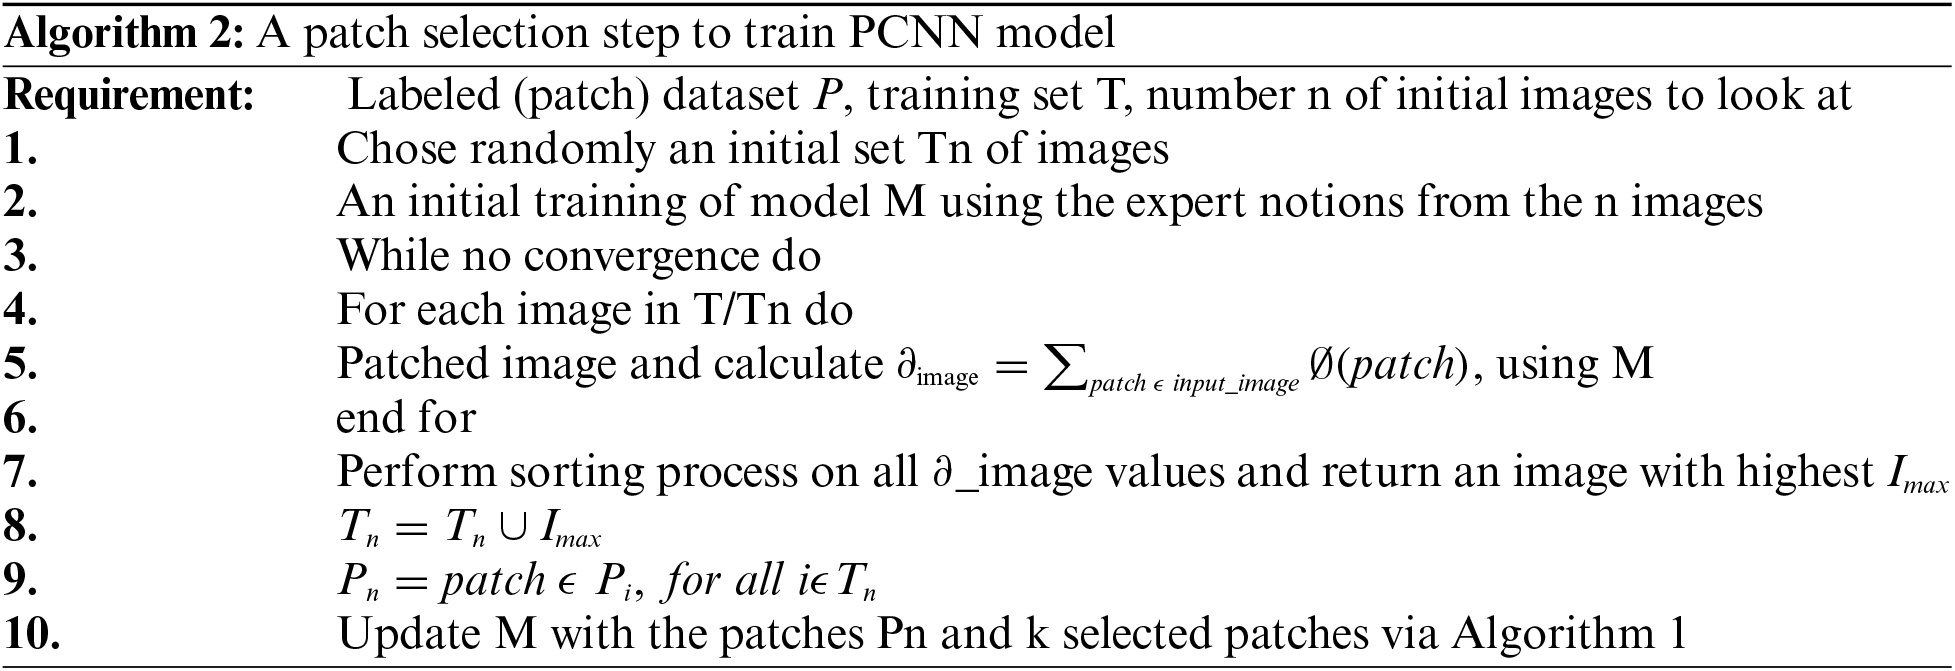
The training of our CNN was accomplished using expected gradient length (EGL) [21,22] to decrease image labelling efforts during CNN training and to make CNN intelligent to learn features from the relevant data. It trained PCNN system from scratch using a well-known optimization algorithm called Stochastic Gradient Descent (SGD) to optimize parameters by utilizing one instance or sample batches instead of complete training samples. Eq. (1) illustrates SGD cost function J optimization using model parameters
where

In Eq. (1), Jc( shows a gradient operator. A training sample ith with its label is then used to estimate the cost function Jc(Jc(

To calculate the loss function of PCNN model, the categorical cross-entropy (CCE) loss function is utilized and applied after SoftMax function for taking the final decision of five severity level of diabetic retinopathy. The CCE loss function is also known as SoftMax Loss. In practice, it is a combination of SoftMax activation with a cross-entropy (CE) loss. If the CCE loss is used, then the PCNN network model is trained to output a probability over the CC classes for each image. The CE Loss is defined as:
where, the parameter
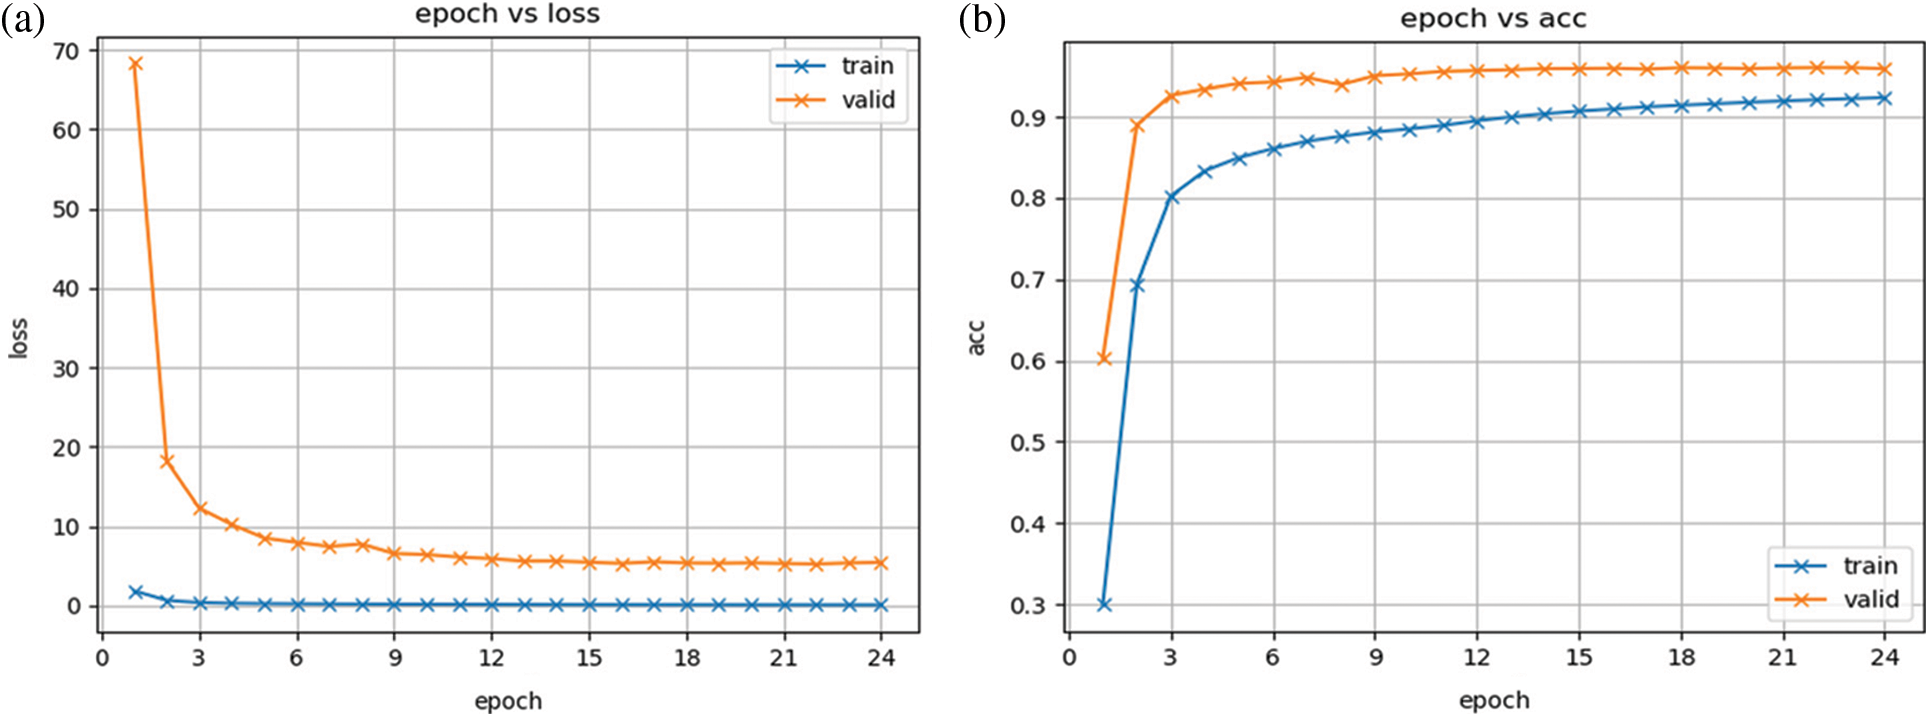
Figure 5: Proposed architecture of pretrain convolutional neural network (PCNN) model by using transfer learning-based CNN network
The proposed PCNN model to recognize severity-level of DR is formed by stacking the fourteen layers of the network including dropout and SoftMax layers. Transfer learning is used for the convolutional layers of the PCNN network. Fine tuning is also applied to the fully connected layers of the PCNN. The hyper-parameters along with their values are shown in Tab. 2. An adaptive learning rate is used so that the learning process can be speeded up and over-fitting can be avoided. Initially, the learning rate is set to 0.01. Iterations are monitored and if the validation loss does not improve for five consecutive iterations, then the learning rate is decreased by a factor of 0.1. In addition, we used batch size of 8, minimum learning rate of 0.0001, initial learning rate of 0.01, momentum of 0.9, number of epochs of 24 and network layers of 14 to test and train the PCNN model.
Five evaluation metrics have been used to evaluate and compare our model with other systems. These commonly used metrics are accuracy, F1-score, sensitivity, specificity, and ROC-AUC. The F1 score is the harmonic mean of the precision and recall. We have included F1 score as a metric because there is a large class imbalance. Since F1 score is the harmonic mean of precision and recall, it is considered a better metric than accuracy in such cases. A higher F1 score implies a better system. Sensitivity is used to measure true positive rate which in our case means the correct identification of vessel pixels. In contrast, specificity measures the true negative rate and that corresponds to the ability of identification of non-vessel pixels by our model. AUC is used to measure the ability of the model at discriminating between vessel pixels and non-vessel pixels. ROC graph plots the true positive rate against the true negative rate at various thresholds and AUC is the area under the ROC curve. The higher the AUC the better the model. The suitability of the proposed PCNN system for five severity level of DR was evaluated on 30,000 test images using the statistical metrics, i.e., sensitivity (SE), specificity (SP) and an accuracy. We define SE as the number of images correctly classified as having DR among the total amount with DR and SP as the number of images correctly identified as having no DR out of the total number with no DR. The accuracy is defined as the number of patients that are correctly classified by the system.
4.3 Results Analysis and Comparisons
This retinograph images’ dataset is divided into 40% of the testing set and the rest as the training set. Also, we have split again the training set into 40% and assigned it to the validation set, and the rest is used for training purposes. On a total of 30,000 images in the dataset, the 60% is working as the training set, 20% as the validation set, and 20% as the test set. There are 24 epochs performed based on the 10-fold cross-validation set. The Fig. 5 displays the proposed model training and testing loss versus accuracy diagram. From this figure, it is noticed that this plot is displayed without performing any fine-tune of the proposed model. In addition, this figure shows that the change between the predicted stage of DR by our model and the true value in the form of the loss function, which is measured by a category cross-entropy.
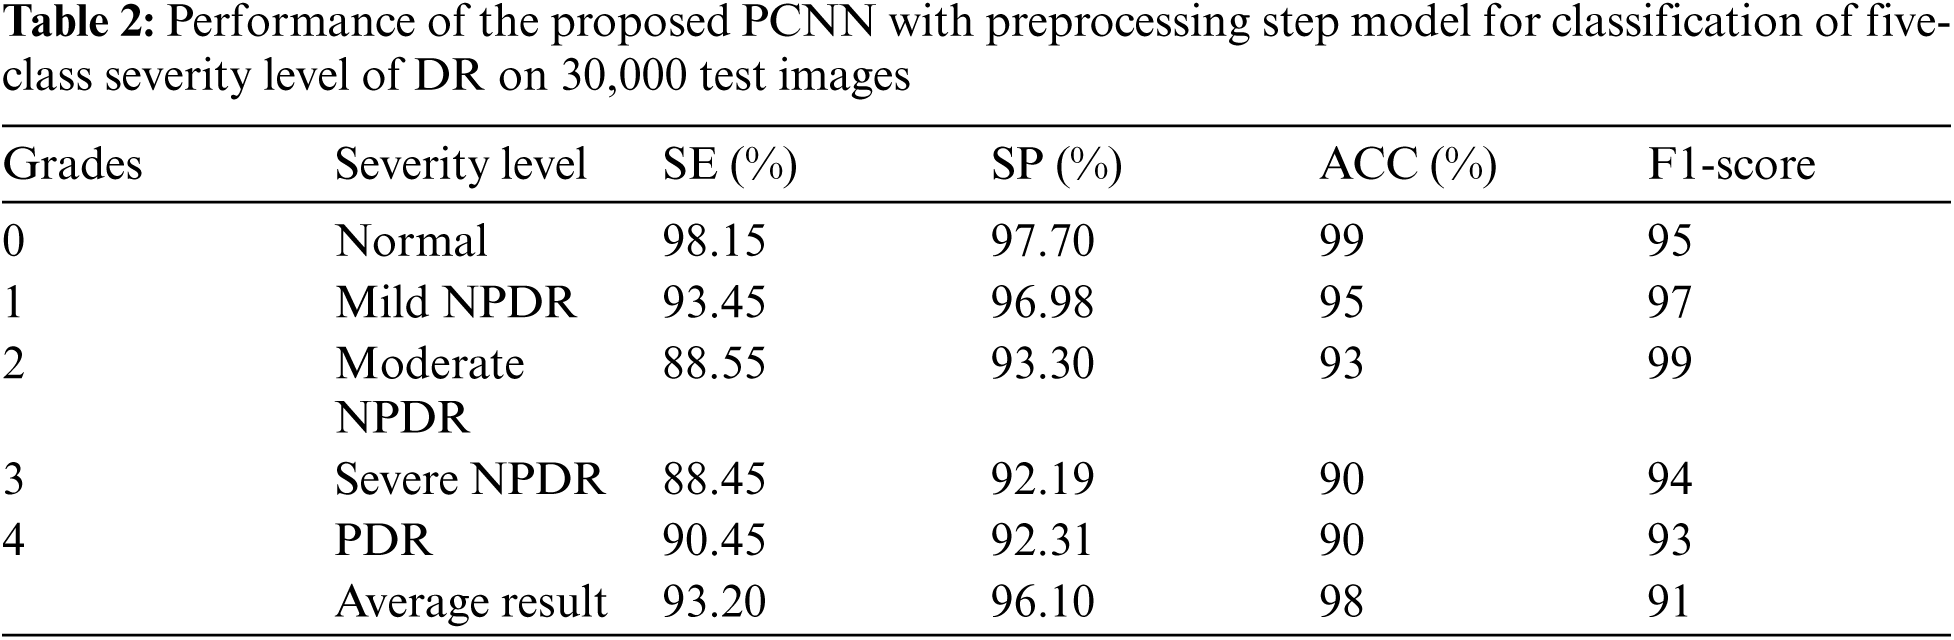
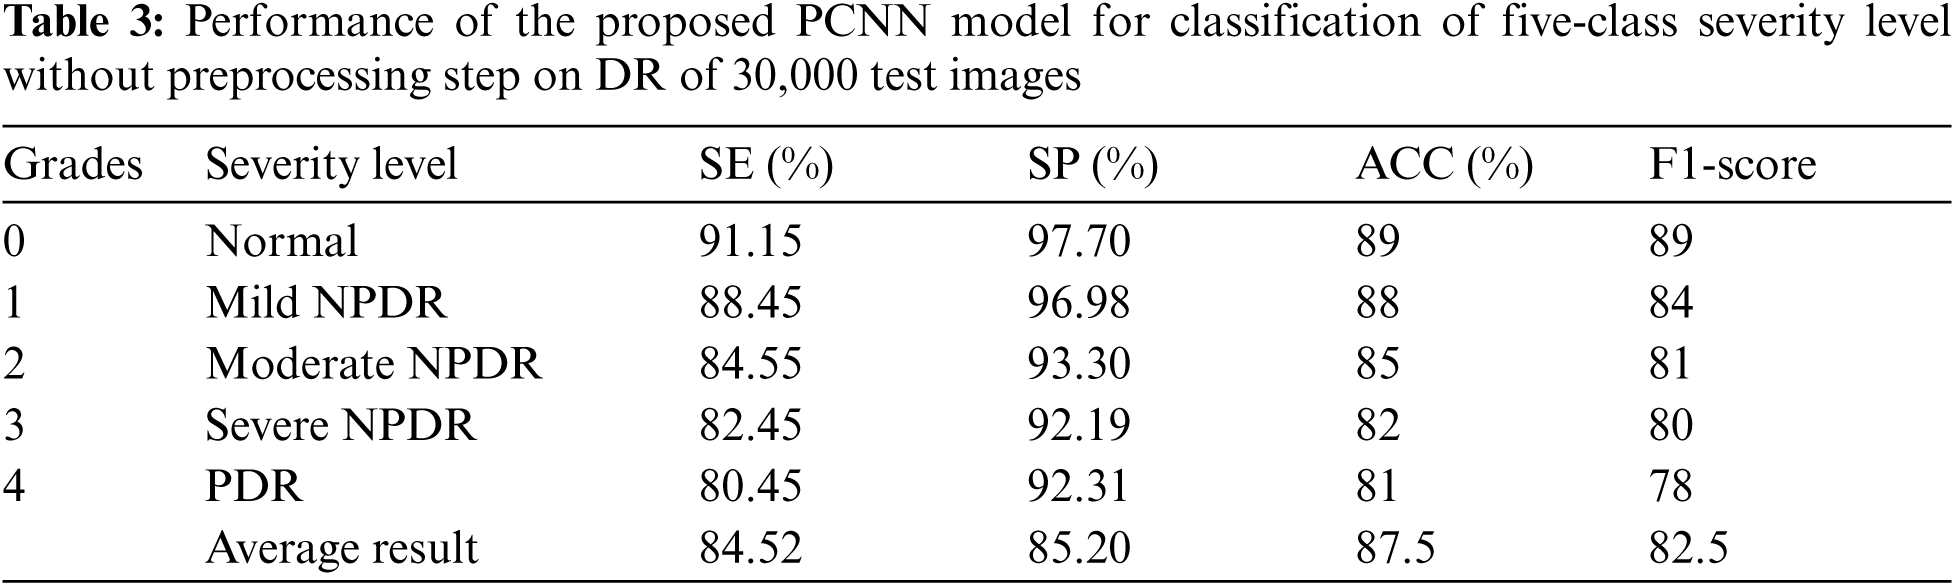
Fig. 6 shows the confusion metrics to achieve the results for recognition of five stages of diabetes retinopathy. This confusion metric is calculated based on 20,000 retinograph images. This metric is calculated based on proposed architecture of pretrain convolutional neural network (PCNN) model by using transfer learning-based CNN network. On average, the 0.90 detection accuracy is obtained to predict five stages. However, if training and testing datasets are increased to 30,000 then the detection accuracy is increased too. The Tab. 2 reports the highly acceptable SE values for normal (98.15%), mild (93.45%) and proliferative (90.45%) DR classes of the proposed CAD-DR system by using preprocessing step and pretrain PCNN architecture. While the values of SP and classification accuracy for five-classes of DR were found up-to-the-mark. The proposed PCNN is significantly improved in SE of 93.20%, SP of 96.10% and an accuracy of 98% on the 30,000 test samples. However, the Tab. 3 shows the lower results because we did not use preprocessing step. We have also compared the PCNN transfer learning model with other transfer learning (TL) algorithms such as VGG16, VGG16noFC1, VGG16noFC2 and InceptionV3. On average, the results are mentioned in Tabs. 4 and 5 describes the parameter used to compare the different TL models. The PCNN model is outperformed compared to all other TL algorithms because of use of effective layers with loss function.
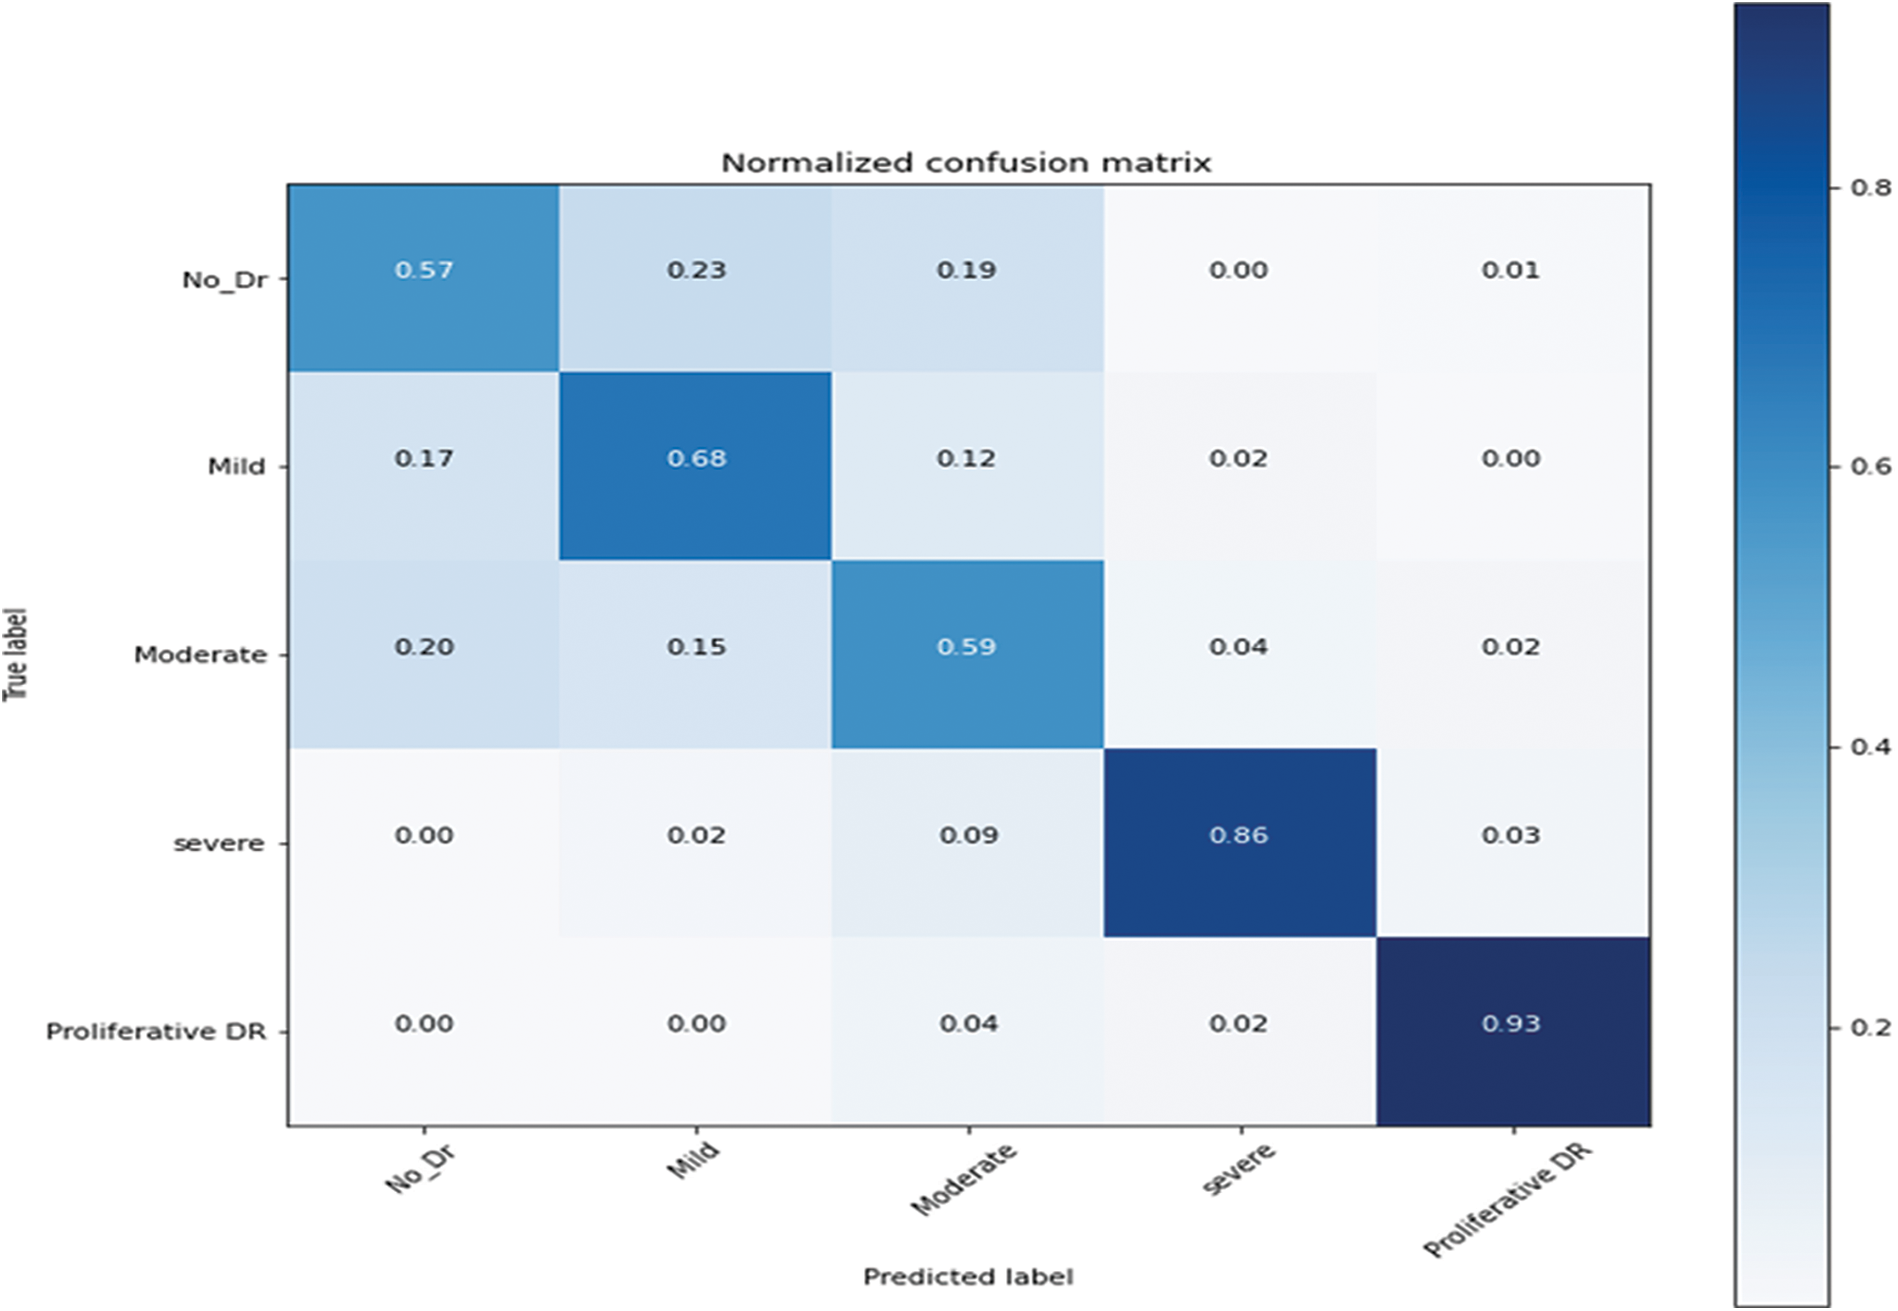
Figure 6: Confusion metric of pretrain convolutional neural network (PCNN) model by using transfer learning-based CNN network on 20,000 retinograph images


We have also performed comparisons of the proposed CAD-DR system with other state-of-the-art systems such as CNN-Pratt-2016 [8], DenseNet-Albahli-2021 [11], and VGG-Khan-2021 [12] in terms of recognition of five stages of DR. We have implemented by ourselves other state-of-the-art DR systems such as CNN-Pratt-2016, DenseNet-Albahli-2021 and VGG-Khan-202. The authors are requested to read those papers for detailed implementation of these papers. We have selected these DR-related systems because those are closely related to our proposed CAD-DR system. Those comparisons are performed and evaluated based on different training and testing ratios on 30,000 test images. Tab. 6 indicates the performance of the proposed PCNN model that is outperformed compared to other systems for recognition of five stages of DR.

Statistics show that many diabetic patients have a high probability of severe vision-loss by diabetic retinopathy (DR). In daily practice, ophthalmologists use non-mydriatic fundus images and Computer-aided diagnosis (CAD) programs for the early assessment/grade severity level of DR. Those earliest assessment of DR is based on the recognition of lesions related to DR. These DR-related lesions appear as unhealthy objects such as micro-aneurysms (MA's), exudates (EX's), hemorrhages (HEM's) and cotton wool spots (CWS) on the retinal surface in the fundus image. Manual segmentation and count of DR-related lesions by clinicians is a difficult and repetitive task. Moreover, the manual grading of DR requires extensive domain-expert knowledge and reader inter-/intra-class variability experience. As a result, several CAD systems have been developed in the past to recognize grades of DR in the clinical setting by digital retinograph images. However, those CAD systems assist ophthalmologists to better screening of patients. As a result, the CAD systems helps clinical experts to identify the early signs of eye-related abnormality, which is difficult to identify by human naked eyes. It noticed that the DR is easily detected by a CAD system to grade the severity-level by using image processing and machine-learning techniques [6] on retinograph images. Nowadays, the CAD systems for recognition of grades of DR are affected by various factors such as (1) it is very much difficult to identify DR-related lesions and anatomical structure of retinograph, (2) it is also difficult to detect accurate and early stage of retinal structure because it changes during the time, and (3) there is a dire need to develop the effective and automatic CAD system to accurate screening of DR-related diseases. Thus, there is a dire need to make DR diagnosis on much larger datasets and to reduce the inter-reader variability.
Deep learning (DL) models especially deep convolution neural networks (CNN) have demonstrated outperform performance in the grading of DR severity levels in several datasets and settings compared to traditional hand-designed methods [6]. A data science platform named Kaggle launched a DR detection competition in 2015, the top-most competitors used different settings of CNN models on approximately 35,000 high-resolution labeled fundus images. They achieved that successful training of such CNN networks was based on the large size of annotated samples. In a previous study [7], a CNN model was developed with data augmentation to classify DR into five stages such as normal, mild NPDR, moderate NPDR, severe NPDR, and proliferative PDR. Their model was trained on more than 100,000 labeled images, yielded comparable performance with a clinical expert. Similarly, Harry et al. in [8] trained a 13-layer CNN model on 80,000 labeled images and obtained significant results in a classification of five severity-level of DR. Another study in [9], a training procedure of CNN model was completed using 8,810 images and obtained comparable results with ophthalmologists. This presents a challenge in clinical practice, as the computational systems need thousands of labeled images to be feed to learn features, representing a time-consuming and expensive process. For a real-time scenario, a well-performing algorithm requires such as a fewer data-intensive CNN model that learns with a few labeled samples. Although, it observed that the previous CAD systems tried to detect DR-related lesions [10] to recognize diabetic retinopathy. Those CAD systems have already been briefly described in the Tab. 1.
To develop this CAD-DR system, a preprocessing step is performed in a perceptual-oriented color space to enhance the DR-related lesions and then a standard pre-train PCNN model is improved to get high classification results. The architecture of the PCNN model has three main phases. Firstly, the training process of the proposed PCNN is accomplished by using the expected gradient length (EGL) to decrease the image labeling efforts during the training of the CNN model. Secondly, the most informative patches and images were automatically selected using a few pieces of training labeled samples. Thirdly, the PCNN method generated useful masks for prognostication and identified regions of interest. Fourthly, the DR-related lesions related to the classification task such as micro-aneurysms, hemorrhages, and exudates were detected and then used for recognition of DR. The PCNN model is pre-trained on the publicly available Kaggle benchmark making use of a high-end graphical processor unit (GPU). The obtained results demonstrate that the CAD-DR system outperforms when compared to other latest, state-of-the-art systems in terms of sensitivity (SE), specificity (SP), and accuracy (ACC). On the test set of 30,000 images, the CAD-DR system obtained an average SE of 93.20%, SP of 96.10%, and ACC of 98%. Some of the example images are described in Fig. 7 that are correctly classified by proposed PCNN model. We have achieved good results based on several improvements to the CAD-DR system such as a preprocessing step is developed in a perceptual-oriented CIEL*a*b* color space to enhance the contrast and adjust the light-illumination. A pretrain TL (DL) approach is used through expected gradient length (EGL) to eliminate the need of large number of labeled fundus images. This step reduces training efforts for CNN model. This result indicates that the proposed CAD-DR system is appropriate for the screening of the DR severity-levels.
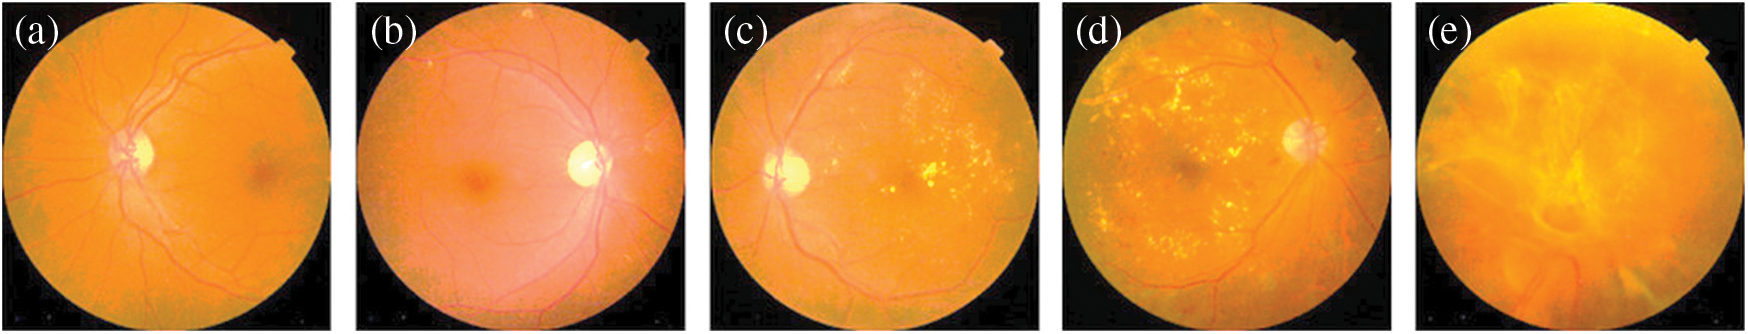
Figure 7: Fundus images depicting the five stages of diabetic retinopathy: (a) Without DR, (b) Mild, (c) Moderate, (d) Severe and (e) PDR
In this paper, a new pre-train scheme of the CNN model (PCNN) is presented to develop a label efficient training mechanism in the domain of retinal fundus images for diagnosis of DR. In addition, we have also developed a preprocessing step in a perceptual-oriented color space to enhance the contrast and adjust the light illumination. This proposed CAD-DR system is outperformed compared to other state-of-the-art systems on 30,000 retinograph images. The DR-related lesion patterns are identified by the proposed PCNN system into five classes. Moreover, an additional interpretation layer is utilized to identify those image areas that should be labeled by the clinical expert. In this paper, an improved computer-aided diagnosis (CAD) system to assist ophthalmologists was developed. The presented PCNN architecture was evaluated on 80 thousand fundus images, and the achieved results illustrate the feasibility of the presented grading system for DR-related lesion detection and classification of the five-class severity level of DR. PCNN system was found useful for human evaluation such as the high value of SE and SP rates. To complete this PCNN system, fast image analysis methods with stable interpretation are utilized. Upon completion of PCNN model training, the classification of DR stages was accomplished in 0.04 s. Keeping these conditions, the obtained SE and SP rates indicate that a vast majority of the images were accurately classified into one of the five-stages of DR. To the best of our knowledge, there is no previous CAD-DR model in the medical imaging field that works in harmony with CNN parameters to select the most informative patches and images. The proposed PCNN method is computationally challenged when dealing with large-scale data. This issue can be resolved with standard sampling techniques. As future work, the other existing deep-learning (DL) methods scheme can be utilized to train a CNN model detecting and classifying diabetic maculopathy on the large-scale annotated datasets.
Acknowledgement: The authors extend their appreciation to the Deanship of Scientific Research at Imam Mohammad Ibn Saud Islamic University for funding this work through Research Group no. RG-21-07-01.
Consultant Works: We would also like to thank Dr. M. Arfan Jaffar for serving as a consultant to critically reviewed the study proposal and participated in technical editing of the manuscript.
Funding Statement: Deanship of Scientific Research at Imam Mohammad Ibn Saud Islamic University for funding this work through Research Group no. RG-21-07-01.
Conflicts of Interest: The authors declare that they have no conflicts of interest to report regarding the present study.
1. C. Ying, Z. Min, Z. Liang, Z. Lixin, K. Jian et al., “Prevalence and risk factors for diabetic retinopathy in a cross-sectional population-based study from rural southern China: Dongguan eye study,” BMJ Open, vol. 9, no. 9, pp. 1–10, 2019. [Google Scholar]
2. D. S. W. Ting, G. C. M. Cheung and T. Y. Wong, “Diabetic retinopathy: Global prevalence, major risk factors, screening practices and public health challenges: A review,” Clinical & Experimental Ophthalmology, vol. 44, no. 4, pp. 260–277, 2016. [Google Scholar]
3. Q. Imran, M. Sharif, M. Yasmin, M. Raza and M. Y. Javed, “Computer aided systems for diabetic retinopathy detection using digital fundus images: A survey,” Current Medical Imaging Reviews, vol. 12, no. 4, pp. 234–241, 2016. [Google Scholar]
4. Q. Imran, J. Ma and Q. Abbas, “Recent development on detection methods for the diagnosis of diabetic retinopathy,” Symmetry, vol. 11, no. 6, pp. 1–34, 2019. [Google Scholar]
5. Q. Abbas, I. Fondon, A. Sarmiento, S. Jiménez and P. Alemany, “Automatic recognition of severity level for diagnosis of diabetic retinopathy using deep visual features,” Medical & Biological Engineering & Computing, vol. 55, no. 11, pp. 1959–1974, 2017. [Google Scholar]
6. L. Zhixi, S. Keel, C. Liu, Y. He, W. Meng et al., “An automated grading system for detection of vision-threatening referable diabetic retinopathy on the basis of color fundus photographs,” Diabetes Care, vol. 41, no. 12, pp. 2509–2516, 2018. [Google Scholar]
7. V. Gulshan, L. Peng, M. Coram, M. C. Stumpe, D. Wu et al., “Development and validation of a deep learning algorithm for detection of diabetic retinopathy in retinal fundus photographs,” Jama, vol. 316, no. 22, pp. 2402–2410, 2016. [Google Scholar]
8. P. Harry, F. Coenen, D. M. Broadbent, S. P. Harding and Y. Zheng, “Convolutional neural networks for diabetic retinopathy,” Procedia Computer Science, vol. 90, pp. 200–205, 2016. [Google Scholar]
9. M. Raju, V. Pagidimarri, R. Barreto, A. Kadam, V. Kasivajjala et al., “Development of a deep learning algorithm for automatic diagnosis of diabetic retinopathy,” Studies in Health Technology and Informatics, vol. 245, pp. 559–563, 2017. [Google Scholar]
10. Q. Abbas and M. E. Ibrahim, “DenseHyper: An automatic recognition system for detection of hypertensive retinopathy using dense features transform and deep-residual learning,” Multimedia Tools and Applications, vol. 79, no. 41, pp. 31595–31623, 2021. [Google Scholar]
11. S. Albahli, T. Nazir, A. Irtaza and A. Javed, “Recognition and detection of diabetic retinopathy using densenet-65 based faster-rcnn,” Computers, Materials & Continua, vol. 67, no. 2, pp. 1333–1351, 2021. [Google Scholar]
12. Z. Khan, F. G. Khan, Z. U. A. Rehman, S. Shah et al., “Diabetic retinopathy detection using VGG-NIN a deep learning architecture,” IEEE Access, vol. 9, pp. 61408–61416, 2021. [Google Scholar]
13. G. Thomas, A. Sampaul, Y. H. Robinson, E. G. Julie, V. Shanmuganathan et al., “Intelligent prediction approach for diabetic retinopathy using deep learning based convolutional neural networks algorithm by means of retina photographs,” Computers, Materials & Continua, vol. 66, no. 2, pp. 1613–1629, 2021. [Google Scholar]
14. F. Nawaz, M. Ramzan, K. Mehmood, H. U. Khan, S. H. Khan et al., “Early detection of diabetic retinopathy using machine intelligence through deep transfer and representational learning,” Computers, Materials & Continua, vol. 66, no. 1, pp. 1631–1645, 2021. [Google Scholar]
15. V. Sudha and T. R. Ganeshbabu, “A convolutional neural network classifier VGG-19 architecture for lesion detection and grading in diabetic retinopathy based on deep learning,” Computers, Materials & Continua, vol. 66, no. 1, pp. 827–842, 2021. [Google Scholar]
16. L. Qiao, Y. Zhu and H. Zhou, “Diabetic retinopathy detection using prognosis of microaneurysm and early diagnosis system for non-proliferative diabetic retinopathy based on deep learning algorithms,” IEEE Access, vol. 8, pp. 104292–104302, 2021. [Google Scholar]
17. Kaggle diabetic retinopathy detection competitiont. 2019. [Online]. Available: https://www.kaggle.com/c/diabetic-retinopathy-detection. [Google Scholar]
18. Q. Imran, J. Ma and K. Shaheed, “A hybrid proposed fundus image enhancement framework for diabetic retinopathy,” Algorithms, vol. 12, no. 1, pp. 1–14, 2019. [Google Scholar]
19. E. E. Reber, R. L. Michell and C. J. Carter, “Kaggle diabetic retinopathy detection competition report,” Technical Report, Kaggle, 2015. [Google Scholar]
20. K. He, X. Zhang, S. Ren and J. Sun, “Delving deep into rectifiers: Surpassing human-level performance on imagenet classification,” in Proc. of the IEEE Int. Conf. on Computer Vision, Santiago, Chile, pp. 1026–1034, 2015. [Google Scholar]
21. K. Alex, I. Sutskever, and G. E. Hinton, “Imagenet classification with deep convolutional neural networks,” Advances in Neural Information Processing Systems, vol. 60, no. 6, pp. 1097–1105, 2012. [Google Scholar]
22. S. Karen and A. Zisserman, “Very deep convolutional networks for large-scale image recognition,” ArXiv Preprint ArXiv: 1409.1556v6, pp. 1–4, 2014. [Google Scholar]
 | This work is licensed under a Creative Commons Attribution 4.0 International License, which permits unrestricted use, distribution, and reproduction in any medium, provided the original work is properly cited. |