DOI:10.32604/cmc.2022.023628
| Computers, Materials & Continua DOI:10.32604/cmc.2022.023628 | |
| Article |
Fake News Classification Using a Fuzzy Convolutional Recurrent Neural Network
Department of Mathematics and Computer Applications, Maulana Azad National Institute of Technology (MANIT), Bhopal, Madhya Pradesh, India
*Corresponding Author: Dheeraj Kumar Dixit. Email: dheeraj.dixit26@gmail.com
Received: 14 September 2021; Accepted: 04 November 2021
Abstract: In recent years, social media platforms have gained immense popularity. As a result, there has been a tremendous increase in content on social media platforms. This content can be related to an individual's sentiments, thoughts, stories, advertisements, and news, among many other content types. With the recent increase in online content, the importance of identifying fake and real news has increased. Although, there is a lot of work present to detect fake news, a study on Fuzzy CRNN was not explored into this direction. In this work, a system is designed to classify fake and real news using fuzzy logic. The initial feature extraction process is done using a convolutional recurrent neural network (CRNN). After the extraction of features, word indexing is done with high dimensionality. Then, based on the indexing measures, the ranking process identifies whether news is fake or real. The fuzzy CRNN model is trained to yield outstanding results with 99.99 ± 0.01% accuracy. This work utilizes three different datasets (LIAR, LIAR-PLUS, and ISOT) to find the most accurate model.
Keywords: Fake news detection; text classification; convolution recurrent neural network; fuzzy convolutional recurrent neural networks
The term ‘fake news’ was not heard frequently until a few years ago. However, when society entered the digital age and people began using social media more frequently, significant problems arose among mankind regarding how people receive news. In the digital age, fake news, information bubbles, news manipulation, and lack of trust are considered to be emerging issues in this regard [1]. Fake news can be identified and understood based on its intent and origin. Based on this understanding, various techniques—for example, machine learning, natural language processing, and artificial intelligence (AI)—have been designed to overcome the problems of fake news and related issues. The issue of fake news has been considered over the past year using different techniques, and various explanations have been determined.
Recently, the New York Times Magazine described fake news as “a story created for a lie.” Fake news has been defined with the proper subject being more important than opposing metrics. The creation of fake news has been influenced such that it could remember the trust over journalism at its true form; it is also intended to generate profits from broadcasting [2].
In today's society, the extensive spread of fake news has become more complicated as information is shared without any limits, making it easy to spread fake news. Developments in AI enable fake news to be spread automatically without manual support. This circumstance has had horrific effects, as many people blindly trust anything they read on social media. Recreational and new users of digital media also appear to be fooled easily by fake news. News checking is considered a form of deception, for example, when someone sends fraudulent spam texts or emails. This issue is worth solving since it can foster crime, political instability, and misery [3].
Fake news is characterized by glaring contradictions and inaccurate data—in this way, the dispersion of fake news is similar to that of spam texts and emails. Fake news is often spread through three noteworthy mechanisms. The first is movement of society, by which spam messages are generally found in close to home messages or on explicit audit sites. Thus, they locally affect only a few crowds. Meanwhile, the effect of counterfeit news in online interpersonal organizations can be enormous because of the substantial numbers of international clients. It is also supported by the broad data sharing and engendering that these clients engage in.
The second mechanism is crowds’ drive. Rather than getting spam messages inactively, clients in online interpersonal organizations look for, obtain, and share news data without considering its accuracy or validity.
The third mechanism is ID trouble. In this case, spam messages are relatively easy to recognize based on their correlations with bountiful standard messages (in messages or survey sites). In the interim, distinguishing false news with erroneous data is extremely challenging since it requires both intensive proof-gathering and fact-checking because of the absence of other similar news stories [4].
These mechanisms of fake news present new difficulties in the identification task. Other than distinguishing fake news stories, recognizing phony newsmakers and subjects will become more significant, which will help prevent fake news producers from entering informal online communities [5]. Text mining could help with this process, as it makes it relatively easy to convert large amounts of text data into small chunks based on specific problems [6].
This paper aims to improve the accuracy of fake news identification that is currently possible with existing techniques. The technique studied here differentiates variations between fake news and real news with maximum accuracy. Fake news identification with the help of AI has become a very important field that has attracted the attention of researchers throughout the world [7]. Despite its recent prominence in research, the accuracy of fake news detection has not improved significantly due to the ineffective news data implied on their content.
The proposed model has been compared with several existing techniques, and their accuracies have been compared. The proposed model performs better than the existing methods when classifying news spread via social media as fake or real. The classification of data is based on the incorporation of a fuzzy approach with an estimation of features and ranking of words. The sentiments of texts also play a vital role in fake new identification [8].
The paper exhibits the following aspects, which might be useful for further advancing this type of research in this direction:
1. This proposed method applies fuzzy convolutional recurrent neural networks (CRNNs) on three different datasets, showing better results than previous methods.
2. This paper will serve as a reference for scholars working in the field of news detection.
3. This paper mathematically defines the fuzzy concept for CRNN algorithm training.
4. This paper proposes a model that is more accurate than previous models regarding news classification based on an ISOT dataset.
This paper is organized as follows. This section (Section I) presented a general description of fake news classification. In the next section (Section II), the existing literature related to fake news classification is presented. Section III presents the operation of a CRNN and fuzzy CRNN for classifying fake news presented on social media. In Section IV, the dataset information and comparison are presented. In Section V, the overall operation of the proposed fuzzy CRNN is described, followed by simulation results and a comparative analysis. Finally, Section VI provides the overall conclusions and suggestions for future research.
Recent techniques for detecting fake news mainly concentrate on the content of the news and the information within a social context [9,10]. When classifying fake news, the features of the news content are primarily obtained from the text and visuals. These features are also used to detect the types of precise writing [11] and the emotions that usually accompany fake news content [12,13]. Many researchers have studied identification techniques through a level of information based on their content and context [14].
Moreover, the representation of text has been designed along with the use of tensor factors that express techniques and deep neural systems that can accurately detect fake news [15]. Features based on visuals (namely, images and videos) have been developed to express different characteristics of fake news. These techniques are used within a basic social context according to correlations between three types of features: (i) features based on the user, (ii) features based on the post, and (iii) features based on the network. Features based on the user have been are obtained for measuring their characteristics [16]. Features based on the post emphasize their involvement in social media considering the types of perspectives, as well as the involvement of users on their credibility [17,18].
Considering the extensive spreading of fake news in social media, additional studies have been considered based on the usage of social networks to identify fake news. As an example, fake news detection at the earliest is done using social learning and relationships based on the user, detection through semi-supervised techniques, detection through unsupervised techniques, and the features on meta [19]. The researchers, in correlation with the context, the issues that have been studied by the scholars for fake news by Kaggle fake news dataset. Specifically, the research uses various machine learning techniques through term frequency and inverse document frequency to extract features when identifying fake news [20].
In classical sentiment analysis, a statistical correlation between words is considered while the dependency factor between aspect and sentiment word is ignored [21]. Another research has simulated the classification technique to detect fake news using a linear regression (LR)-based unigram model. They obtained an accuracy rate of 89.00%. When a linear support vector machine was used as a classifier, an accuracy rate of 92% was obtained. Afterward, they used convolutional neural networks (CNNs) to detect fake news and obtained an accuracy rate of 92.10% [22].
In [23], deep learning techniques were used to detect fake news, achieving an accuracy rate of 93.50%. Research in [24] classified fake news classification using a hybrid model in which the relationships among users were considered as a significant feature for detecting fake news. This method yielded an accuracy rate of 89.20%. Another author used various machine learning techniques to classify fake news using a linguistic analysis and word count-based approach, attaining an accuracy rate of 87.00% using a support vector machine as a classifier [25]. Another author [26] proposed a technique for detecting fake news using a deep CNN known as FNDNet, which correctly detected fake news 98.26% of the time.
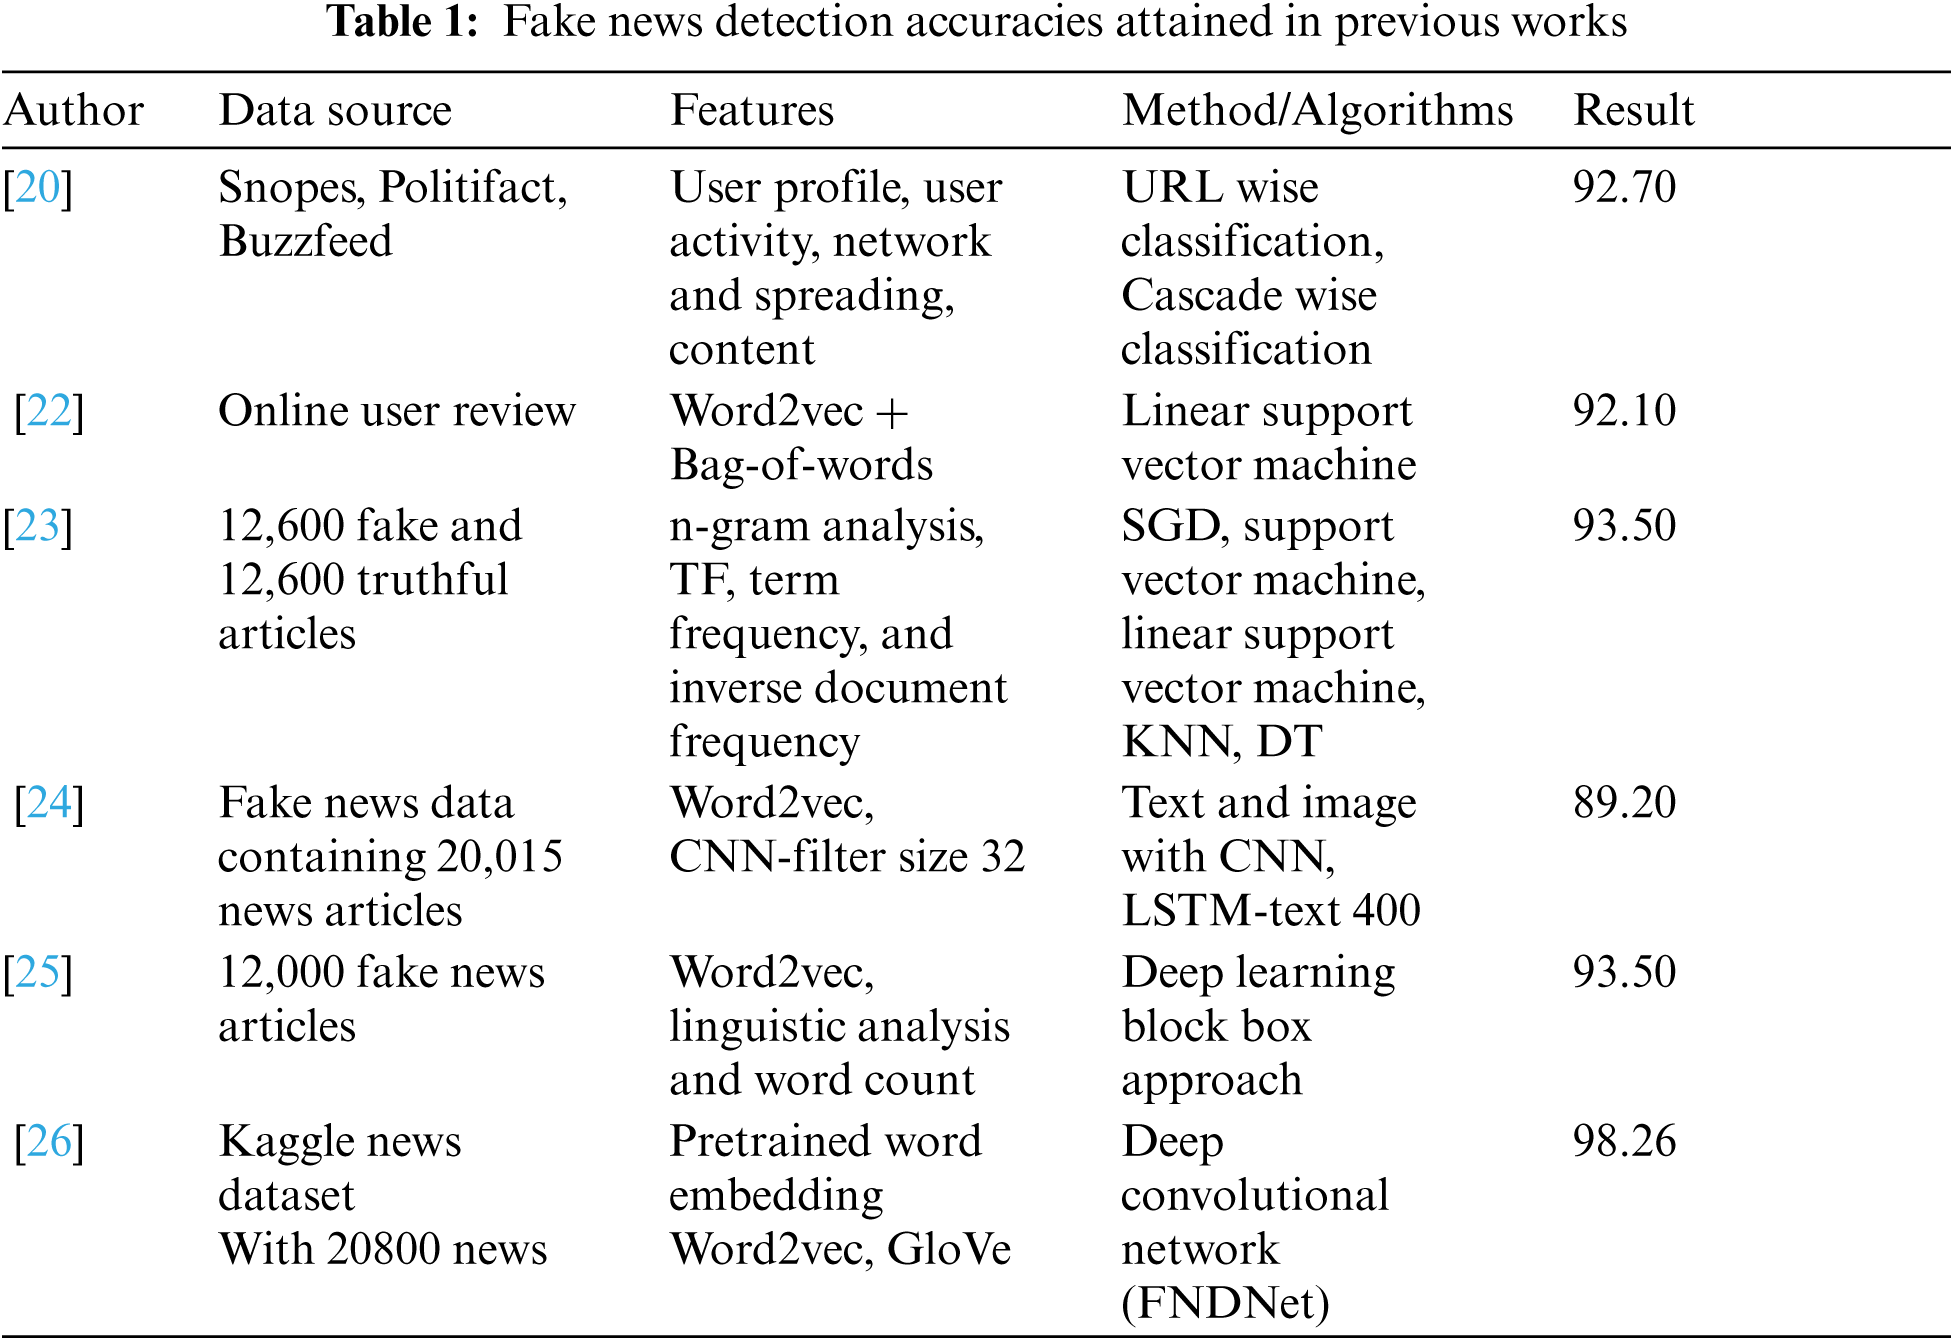
Bangyal et al., in 2019 proposed improved Bat algorithm by enhancing its exploitation capabilities and avoids escaping from local minima. They have shown the efficiency of improved bat algorithm over gradient descent and other population based techniques with Feed Forward Neural Network on UCI dataset. They have seen that improved bat algorithm shown better optimization [27]. Taun-Linh Nguyen et al. proposed a fuzzy CNN model for sentiment analysis. Using this network, the authors extracted a high level of emotional features (approx. 78.85%) using Twitter data [28]. Khattak et al. in 2021 build an expanded ontological relation with to classify the sentiments of user reviews. In [29], an extended set of linguistic rules for concept feature pair extraction with enhanced set ontological relations have been proposed. Then machine learning technique is used for sentiment classification with an accuracy of 87.5%. Tab. 1 lists several important works related to this one, along with their accuracy rates.
The design proposed in the present study presents a fake news detection architecture comprised of various stages (Fig. 2). Initially, the dataset was preprocessed to generate tokenized words, which meant the original news statements in real-world language format were converted into a list of integers representing the words in the same sequence as in the input string statement. Then, these tokenized sentences were replaced with word embedding, resulting in a matrix with the same number of columns as the sentence length. The number of rows is equal to the usual dimension size for the word embeddings.

Figure 2: Flow of data through proposed architecture
At first, the training is done for news classification on these word embeddings with the help of CRNNs. Then, these CRNNs are stripped from the last dense layers, and these layers are replaced with a fuzzy c-means classifier, which is again trained with the dataset; however, this time, the CRNN layers are not updated during training.
The final resultant model combines fuzzy c-means and CRNN architecture, where the CRNN encodes the sentence into an n-dimensional feature vector, which works as a reduced representation of the input statement. Then, this n-dimensional feature vector is passed on to the fuzzy c-means, which classifies the input statement as either real or fake.
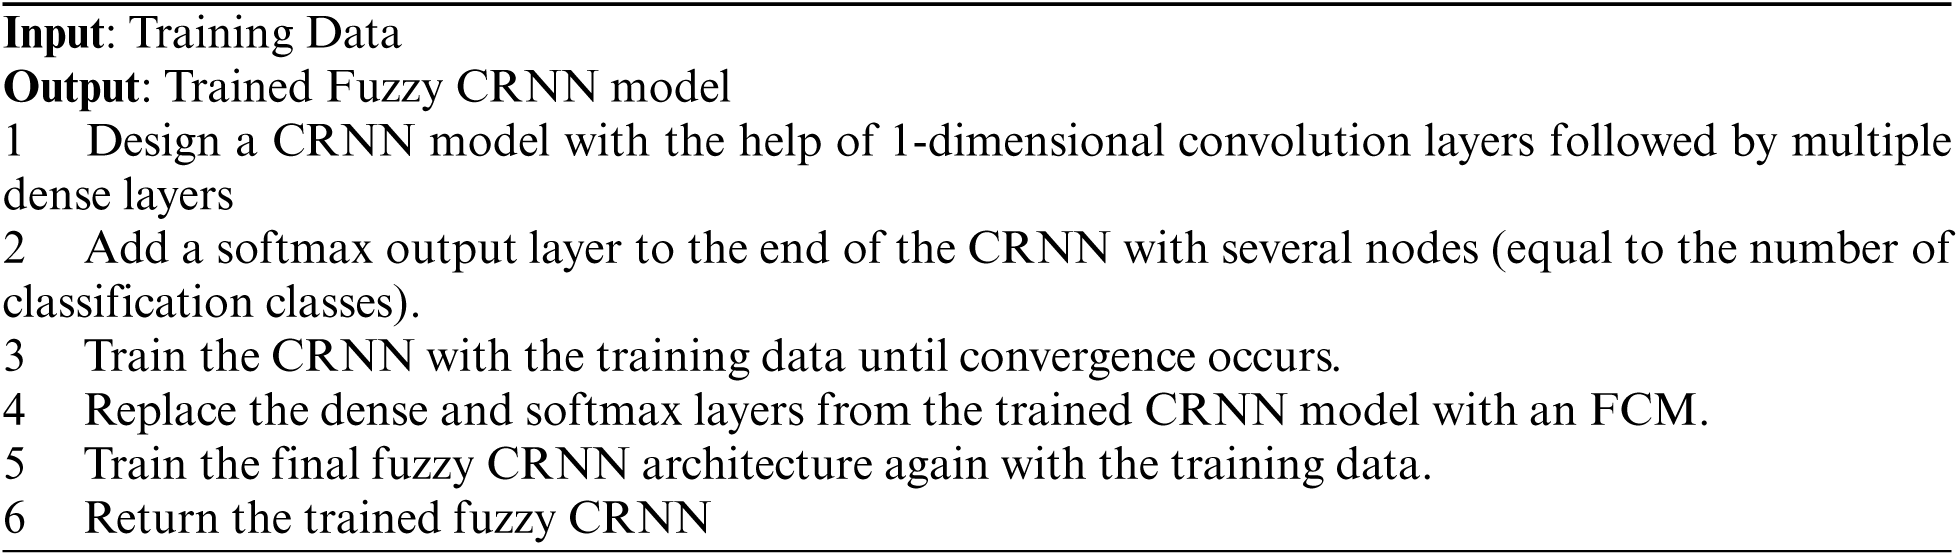
Pseudo-Code for the Proposed Architecture
3.1 One-Dimensional Convolution Layer
In general, CNNs are considered artificial neural networks that specialize in recognizing patterns in images while sharing the parameters with the help of corresponding kernels. This allows the model to encode image-specific features into a model with an understandable format while providing a reduced number of trainable parameters. These convolution operations employ 2-dimensional convolutional layers that operate on 2-dimensional inputs (i.e., inputs with height and width).
While these 2-dimensional convolutional layers are perfect for 2-dimensional data, they are not helpful for 1-dimensional data like time series, text, audio, and signal data. Such 1-dimensional data comprise a single value or a specific length of data in a sequential format. Due to this sequential format in one dimension, 1-dimensional convolution layers work perfectly when all the advantages of 2-dimensional convolutions are applied. A convolutional operation (with the kernel moving in a timestamp) is shown in Fig. 1.
1-dimensional convolution layers process a finite number of data points equal to the length of the kernel in a sequential format (sometimes referred to as a temporal axis). These kernels are then shifted ahead into the temporal axis for another finite number of steps defined by the stride value of the kernel. These 1-dimensional convolution layers work the same as the 2-dimensional convolution layers; the key difference is that the shifting of the kernel is done on only one axis.
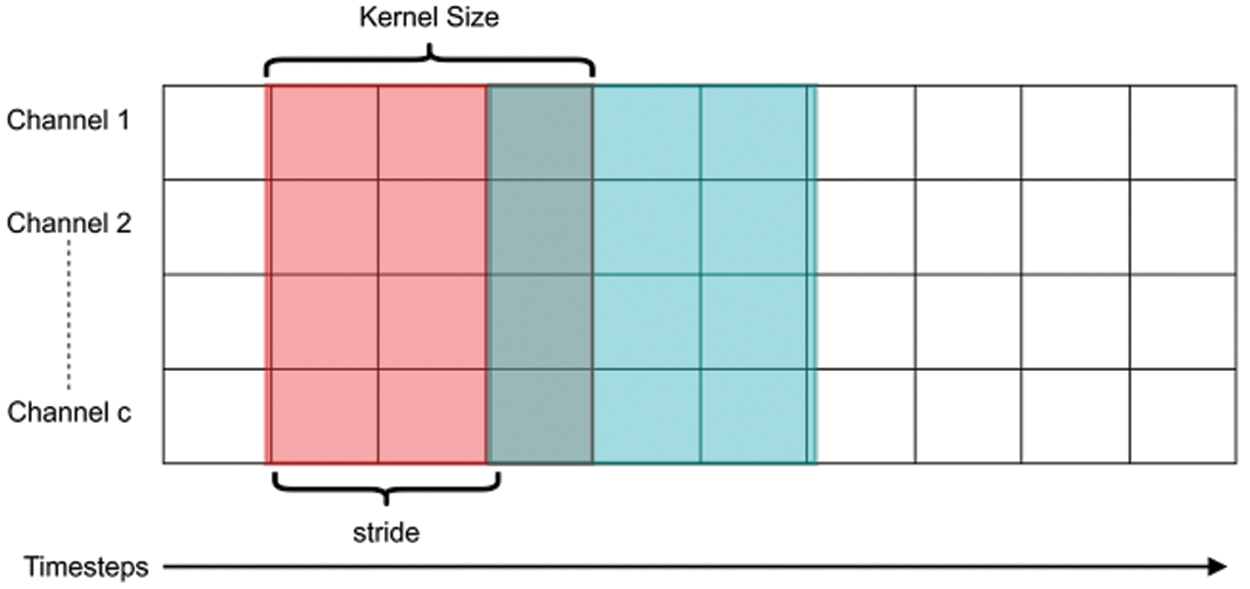
Figure 1: Convolution filter operation on 1-dimensional data
Traditional clustering algorithms work by defining centroid points, which are classified based on their closeness to one of the centroids. One drawback of this approach is that a single element can belong to only one class at a time. This hard clustering of the data points could lead to incorrect classification results for points that are approximately equidistant from two centroids.
Fuzzy clustering is a soft clustering technique in which each data sample can belong to more than one centroid at a time, thereby allowing a data sample to belong to a centroid for all the centroids. With these values, the user can categorize the data points into different classes and obtain more detailed correlations with all the centroids [30].
Fuzzy c-means clustering is the most widely used fuzzy clustering algorithm. It is very similar to the K-means algorithm, which is commonly used in machine learning research.
For a given set of data samples
The squared distance between the corresponding data sample and cluster node is represented in Eq. (1).
Since the data samples are in vectorized format, the above equation can be modified into a vectorized A-norm form as in Eq. (2).
The partitions and the degree of association for all data samples and the corresponding cluster centers can be collectively represented as partition matrix
When multiplied with the distance values calculated earlier, this weighted partition matrix gives a squared error value between the data sample and the corresponding cluster. This value is weighted by the partition matrix for each data sample with each cluster center, which is represented by
Summation is performed to generalize the squared errors for all cluster centers for each corresponding data sample. The outcome is an
The above equation can be termed the generalized overall weighted sum of squared sum error for the complete dataset. A cost function (see Eq. (3)) can be defined for a given set of data samples and clusters (with the help of the above equation). Eq. (3) calculates the overall loss of the given data sample and cluster association system.
For a given data sample to belong to a specified cluster, the degree of membership should be high. In other words, the data point should be closer to the center of the cluster it is a member of than to any other cluster center. To achieve this, a minimization operation is performed on the given cost function Eq. (4):
where
The cost function is minimized by updating the partition matrix and the cluster center vectors with each iterative step. This reduces the overall cost for the given dataset and the corresponding cluster centers.
With each minimization step, all cluster centers are updated using Eq. (5).
The partition matrix helps define how much of the data sample's weight belongs to a corresponding cluster. This can be calculated using Eq. (6).
The overall model's architecture is divided into two parts: CRNN and FCM. The CRNN handles the model's input (processing it in sequential format with the help of 1-dimensional convolution layers) and generates an f-dimensional feature vector. This vector is a form of the input statement that has been encoded into an f-dimensional feature space. This f-dimensional vector is then passed to the FCM for classification into two categories: real news and fake news.
Since there are only two classification categories, the FCM generates two values for each data sample, and each value corresponds to the degree to which that sample belongs to the corresponding class. This final value is evaluated, and the final class (either real news or fake news) is obtained. Fig. 2 is a flowchart illustrating the process of detecting fake news.
LIAR is a publicly available dataset for fake news detection [31]. It contains manually labeled short statements collected from various domains from POLITIFACT.COM. It includes 12,800 human-labeled short statements. Each statement was evaluated in two stages—first by the POLITIFACT.COM's editors and then through an analysis of 200 randomly sampled instances by journalists. The statements were recorded between 2007 and 2016.
The complete dataset was classified into six groups based on their truthfulness ratings: pants-fire, false, barely-true, half-true, mostly-true, and true. For this research, the main task was to simply classify statements as real or fake. This task was achieved by merging the six labels of the LIAR dataset into two categories as follows:
Fake Category -> {pants-fire, false, barely-true}
Real Category -> {half-true, mostly-true, true}
The LIAR-PLUS dataset is an extension of the original LIAR dataset [32]. In the LIAR-PLUS dataset, the justifications used for the statements were updated by automatically extracting the claims provided in the original articles. The justifications were extracted from the conclusion or summary sections of the texts, which were filtered out based on the use of ‘verdict’ and related words. These extended justifications were added as support statements for the fact-checking claims. They also provided more detailed information about each data sample.
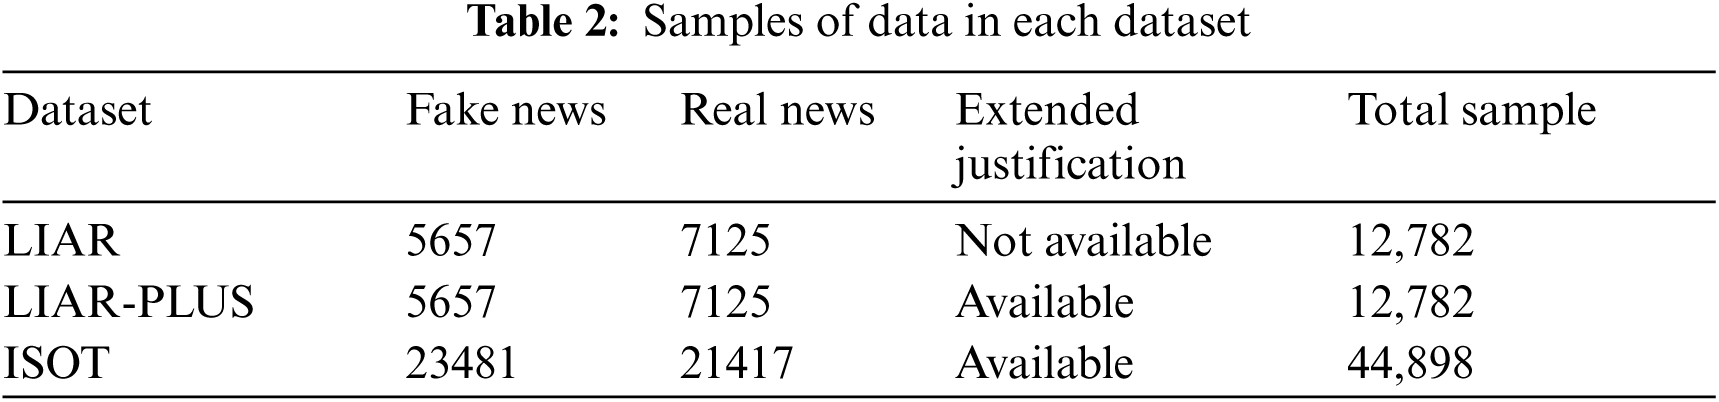
The ISOT fake news dataset [33] contains several thousand fake news and truthful articles obtained from various legitimate sources. The truthful articles were broadly obtained by legally crawling articles from Reuters.com, while the fake news articles were collected from multiple sources validated by POLTIFACT.COM. The dataset contains 44,898 sample statements and their corresponding body texts. Of these statements, 21,417 belong to the real news category, and 23,481 belong to the fake news category (Tab. 2).
Multiple models were trained on the above-specified datasets with the proposed techniques. The complete experiment configuration, training steps, and results are stated below.
The complete simulation has been carried out for the proposed fuzzy CRNN using the Python tool. Their architecture has been considered, and the experiment was carried out using a PC with Windows 10 OS, 4GB RAM, and an Intel I5 processor.
The key tasks performed for the complete training of a fuzzy CRNN model comprise initial CRNN training, transferring knowledge to fuzzy c-means, and training the combined fuzzy CRNN architecture. More detailed descriptions of the configuration and steps are provided in the following sections.
This section describes the general experimental configurations and all the steps taken to prepare the dataset. The process starts with the initial unprocessed news statements in paragraph format and ends with a clean, structured sequential embedding format that can be understood by the proposed architecture (Fig. 3).
The main sequential tasks performed on all the statements in all the datasets during data cleaning are listed below:
• Removal of URLs
• Removal of numbers
• Removal of punctuation
• Conversion of all characters into lowercase
• Splitting of words at spaces and converting them into a list format.
• Removing words containing one or two letters
• Rejoining the list into a string without losing the sequential information.
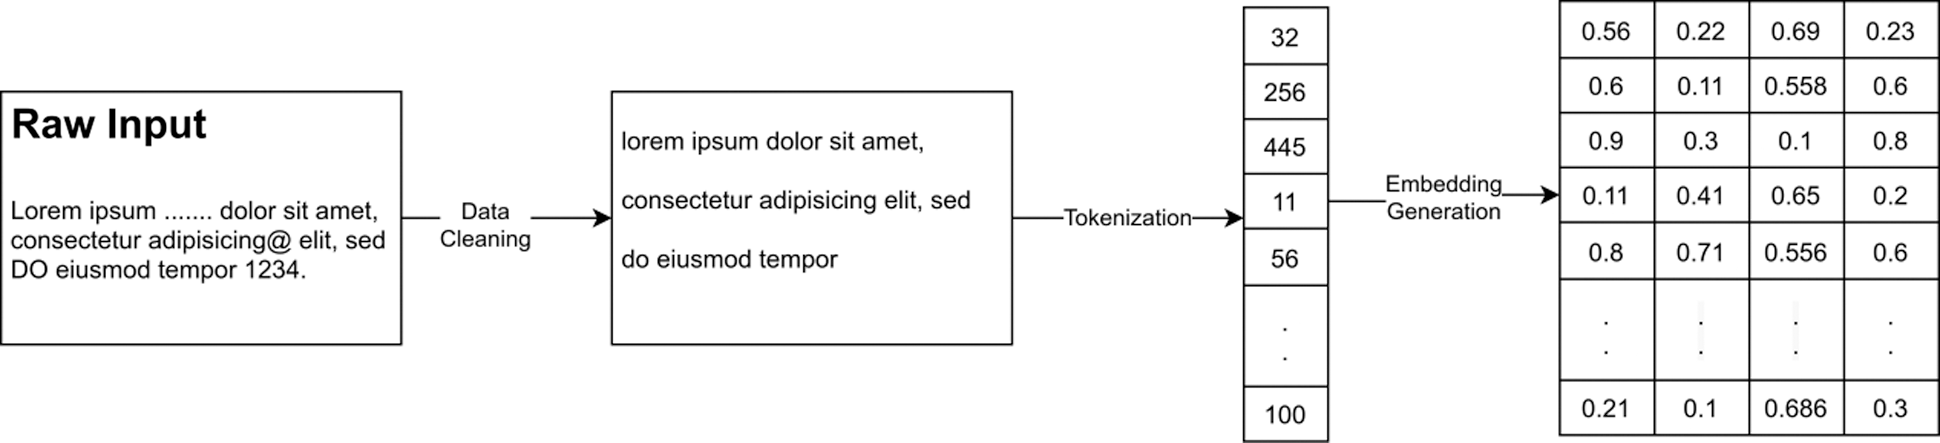
Figure 3: The complete data preprocessing pipeline
After the data cleaning process, the retrieved data are standardized data with no punctuation, special symbols, or redundant spaces.
Even after the data are cleaned and standardized, they are not understandable because machine learning models work with numbers. Therefore, the textual information needs to be converted into a numerical form without losing any information. Word tokenization is employed to achieve this.
Even if the dataset is sufficiently large, situations can arise where the model encounters a word that is not in the tokenization dictionary, meaning that its corresponding token is not generated. These types of words are called out of vocabulary tokens and are assigned index 0 as their token index.
After the tokenization dictionary is generated, the statements are converted into a list of words split at spaces. These words are then replaced by their corresponding token values, yielding a numeric representation of the textual data without losing any information. The statements comprising the real-world textual data do not need to be of equal length. This results in variable statement lengths in the dataset, which could lead to model overfitting based on the sentence lengths.
Input padding is employed to overcome this variable-length input problem. Input padding invlolves utilizing a predefined fixed input length. Based on this length, all statements are padded with out of vocabulary tokens. Statements longer than the predefined input length are truncated (starting at the end) until the predefined input length is attained. While this could lead to the loss of information, the fixed input length is determined based on the overall dataset sample length—therefore, the amount of information loss is minimized for all data samples.
Even after the words are tokenized into numbers, a large corpus of textual data is needed for the model to understand the real contexts and meanings of the tokenized words. Pre-trained word embeddings can be used to overcome this problem. These word embeddings are vectorized, encoded forms of individual words. For this research, Global Vectors for Word Representation (GLoVe) pre-trained embeddings were used. These were trained on a vast corpus of Wikipedia 2014 textual data.
Fig. 3 depicts all the data preprocessing steps. First, the input data go through the data cleaning process. Then, the sentences are tokenized. After this, word embedding is performed.
For the proposed model, a sentence encoder (in the form of a convolution recurrent neural network) is required to process the input in a sequential format and produce encoded sentences. When the encoded form of the input data is generated, the neural network architectures can work on high-dimensional data; only important information from this high-dimensional data is extracted and used. This process reduces the dimensionality of the input while maintaining its unique representational value. These encoded input data are then passed to the fuzzy c-means for classification. It is essential to reduce the dimensionality of the high-dimensional data because FCMs work efficiently with low-dimensional data.
Since a CRNN (Fig. 4) is employed for input data encoding or dimensionality reduction and FCM is used for classification, the proposed approach can combine the positive aspects of each. As a result, an efficient and accurate classification architecture is provided, and the overall complexity and computation needs are reduced. The word embedding is then passed through CNNs and dense layers, eventually leading to classification as real or fake news.
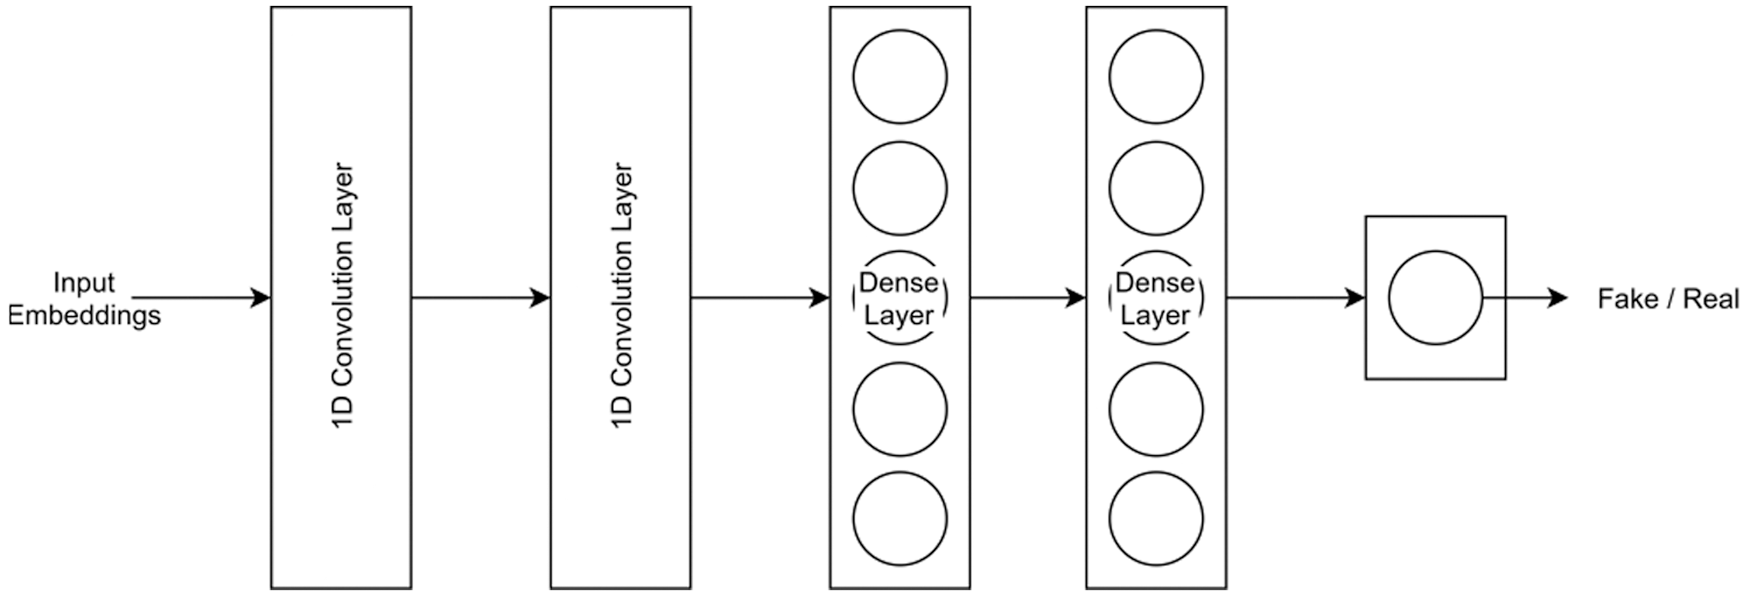
Figure 4: CRNN model for encoder training
The CRNN is trained in a supervised way by being given input statements in the form of sequential word embeddings. It then classifies the statements into the corresponding categories (fake or real). After a considerable number of training iterations, the CRNN training is terminated, and the CRNN is truncated from the last layers; only the 1-dimensional convolution layers are kept, which serve as the encoder for the FCM. The convolutional layers are used for features extraction from the data and recurrent layer is just a single layer which will also act as 1D convolutional layer and after passing from several layers fuzzy system is used to classify the result instead of neuron units.
After training the CRNN as the encoder, the CRNN layers are frozen for further updating by training. Also, the FCM is attached to the end of the encoder to relay the encoded low-dimensional output of the CRNN into the FCM. This, combined with the fuzzy CRNN architecture (Fig. 5), is then trained with the dataset. However, since the CRNN layers are frozen for training, they work only as encoders, and training is done only on the FCM section of the architecture.
The FCM is trained until a considerable loss is achieved; the final architecture is called a fuzzy CRNN. A fuzzy CRNN can categorize temporal or sequential input into finite categories while allowing an input sample to belong to more than one category. This kind of categorization is not possible with traditional K-means algorithms.
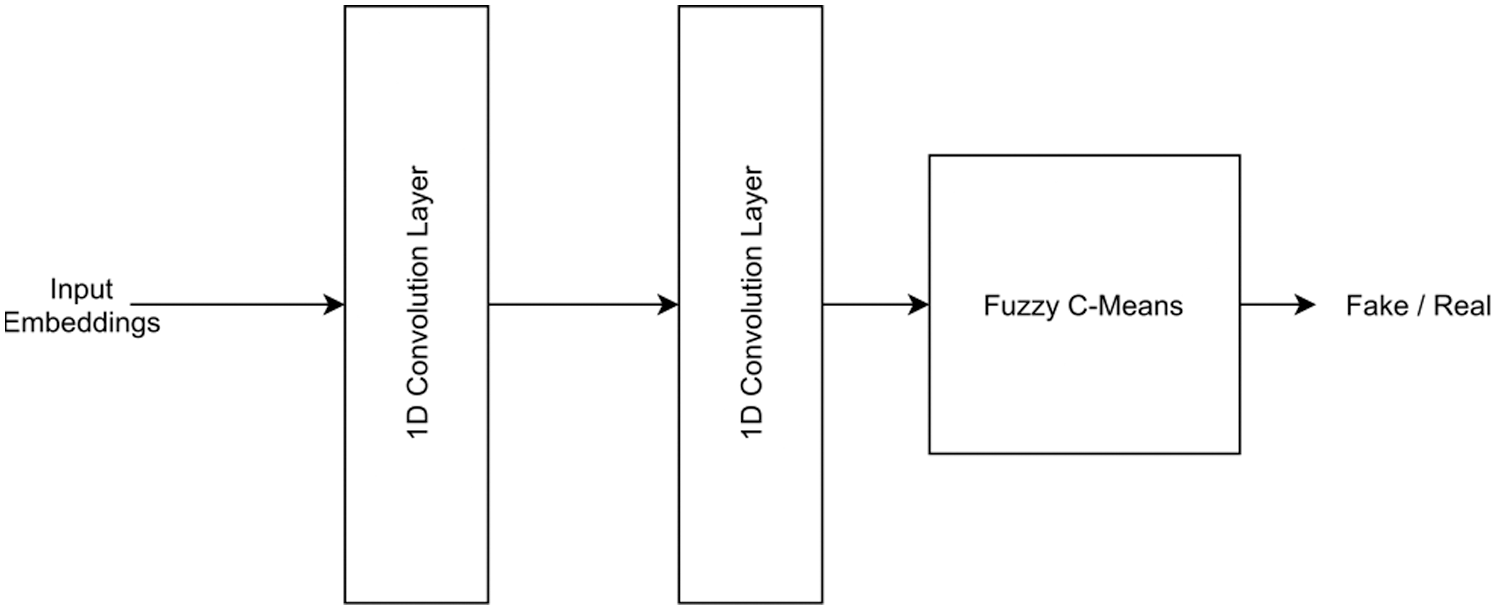
Figure 5: Fuzzy CRNN connected with frozen CRNN layers
The proposed fuzzy CRNN is evaluated based on the parameters of precision, recall, accuracy, and F1 score. All parameters were evaluated using the classification report of the best model. The classification report provides details about the accuracy, recall, precision, and F1 score, and some data samples were evaluated to support the evaluation [34]. The formulas used to calculate accuracy, recall, precision, and F1 score are as follows.
Accuracy: resolves the proximity for detection by the classifier and is determined by Eq. (7).
Recall: detects the positive sample by the proposed Fuzzy CRNN represented in Eq. (8).
Precision: provides the ratio of true positive (TP) values to the total predicted values expressed by Eq. (9).
F1 score: the ratio between the average mean of precision and recall expressed by Eq. (10).
TP is a forecast value that is expected to be positive and is determined as positive in an AI model. A false positive (FP) is defined as a forecast value that is expected to be negative initially and later shown to be positive by an AI model. A true negative (TN) is a forecast value expected to be negative and shown to be negative by the AI model. Finally, a false negative (FN) is a forecast value expected to be positive but later shown to be negative by the AI model.
The proposed architecture was trained and tested on three datasets—namely, the LIAR dataset, LIAR-PLUS dataset, and ISOT dataset. All these datasets’ details are provided in previous sections.
LIAR Dataset
For the LIAR dataset, the target classes or labels were divided into six sections based on the severity or truthfulness of the statements. However, for binary classification (i.e., fake/real classification), these six labels were merged into two labels. Specifically, the false, barely-true, and pants-fire labels were grouped into the fake news category, and the true, mostly-true, and half-true categories were grouped into the real news category.
With these label groupings, a GLoVe embedding of 300 dimensions was used for word embedding, while the CRNN reduced the input data to 64-dimensional encoded vectors. These vectors were used as input for the FCM substructure for classification. The classification report of the LIAR dataset is shown in Fig. 6.
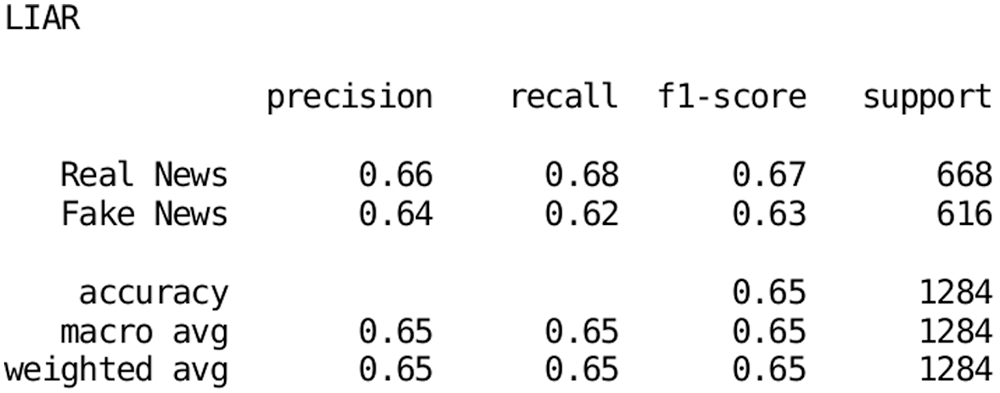
Figure 6: Classification report for the proposed architecture on the LIAR dataset
The overall accuracy rate is 65%, which is higher than that of the same binary classification problem as discussed in [31]. The proposed model was 66% accurate in the real news case and 64% accurate in the fake news category. Similarly, the proposed method yielded 68% recall in the real news category and 62% recall in the fake news case. Also, support values differed (668 in the real news class and 616 in the fake news class).
LIAR-PLUS Dataset
In the case of the LIAR-PLUS dataset, the labels were in the same format as the LIAR dataset; the added information comprised extended justification statements. While the labels were grouped similarly to the case of the LIAR dataset, the extended justification statements were also concatenated into the news statements, thereby making a combined input with both the news statement and its justification.
With this label grouping and combined statement and justification input, a GLoVe embedding of 200 dimensions was used for word embedding. Meanwhile, the CRNN reduced the input data into 64-dimensional encoded vectors, which were used as input for the FCM substructure for classification. The classification report for the LIAR-PLUS dataset is shown in Fig. 7.
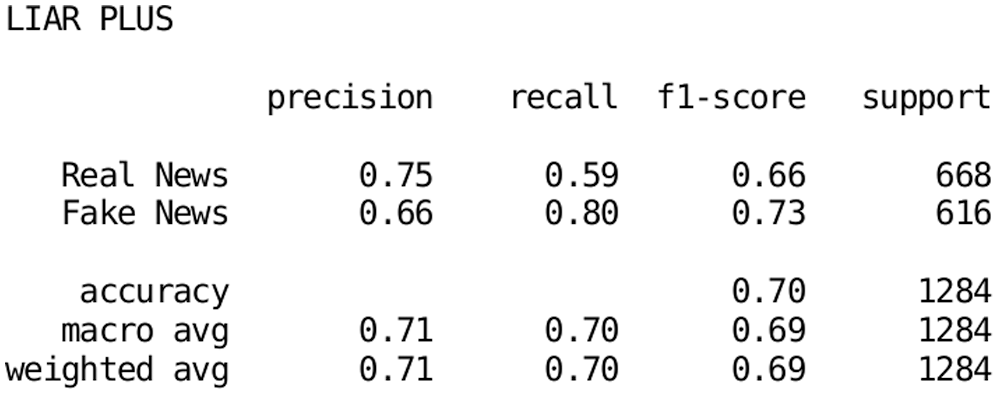
Figure 7: Classification report for the proposed architecture on the LIAR-PLUS dataset
The proposed architecture was able to predict fake news with more accuracy and confidence than real news. The overall architecture also yielded high performance and low-computation-extensive predictions when compared to traditional neural network approaches. The LIAR-PLUS dataset yielded an accuracy of 70% (75% in the real news category and 66% in the fake news category). This difference occurred because the support values for each class differ (668 in the real news class and 616 in the fake news class).
ISOT Dataset
The ISOT dataset also contained the news title and statement, making it similar to the LIAR-PLUS dataset. However, the ISOT dataset also combined the title and statement to form a single complete news statement.
With the combined news title and statement input, the GLoVe embedding of 200 dimensions was used as word embedding, and the CRNN reduced the input data to 64-dimensional encoded vectors. These vectors were used as input for the FCM substructure for classification. The classification report for the ISOT dataset is shown in Fig. 8.

Figure 8: Classification report for the proposed architecture on the ISOT dataset
The proposed architecture yielded 99.99 ± 0.01% accuracy for the validation dataset while having lower computational costs than the other implementations. The results show that the precision, recall, and F1 score provide 99.99 ± 0.01% accuracy with 4283 support instances in each class.
Fig. 9 below shows the confusion matrix for the classification.
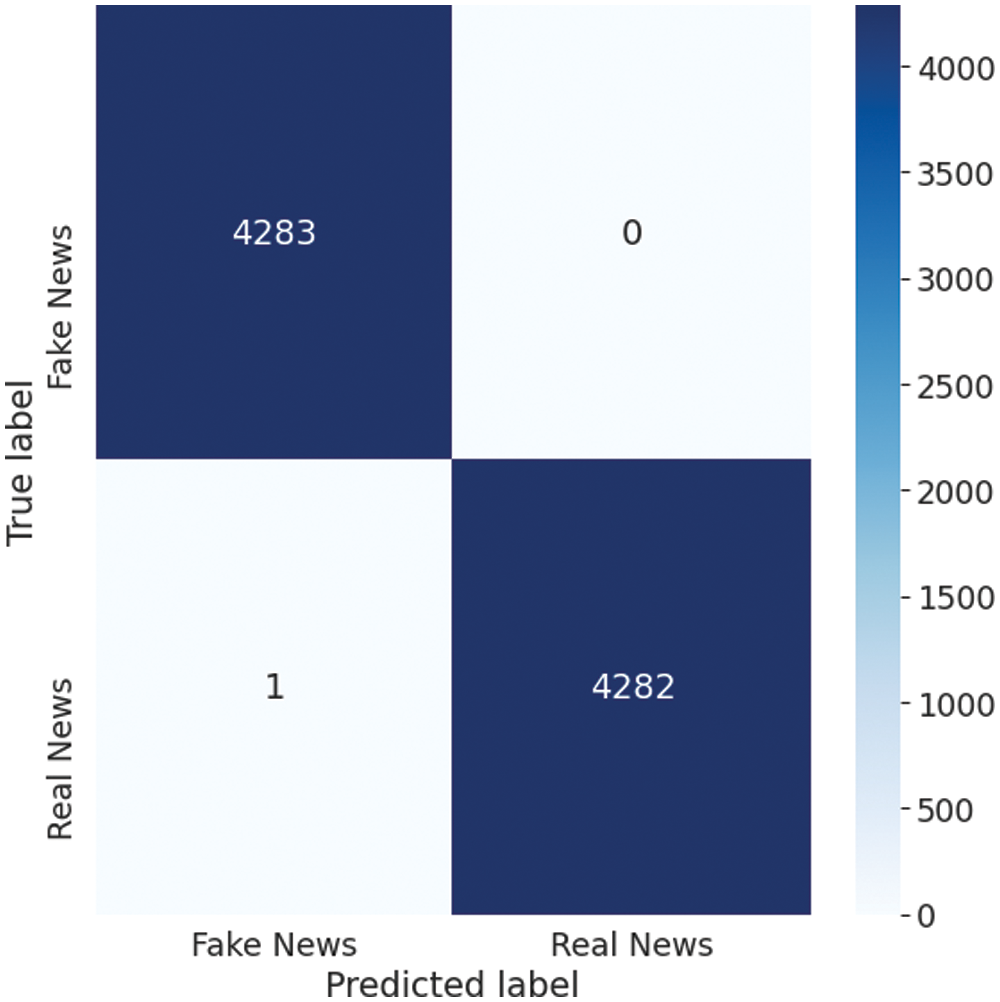
Figure 9: Confusion matrix for the proposed architecture on the ISOT dataset
The confusion matrix reveals important results related to several factors, such as accuracy, precision, recall, and F1 score. The accuracy of the model can be calculated using the confusion matrix as follows:
This implies that the proposed model has achieved 99.99% accuracy. On executing the model on thirty different time, 99.99 ± 0.01% accuracy has been achieved.
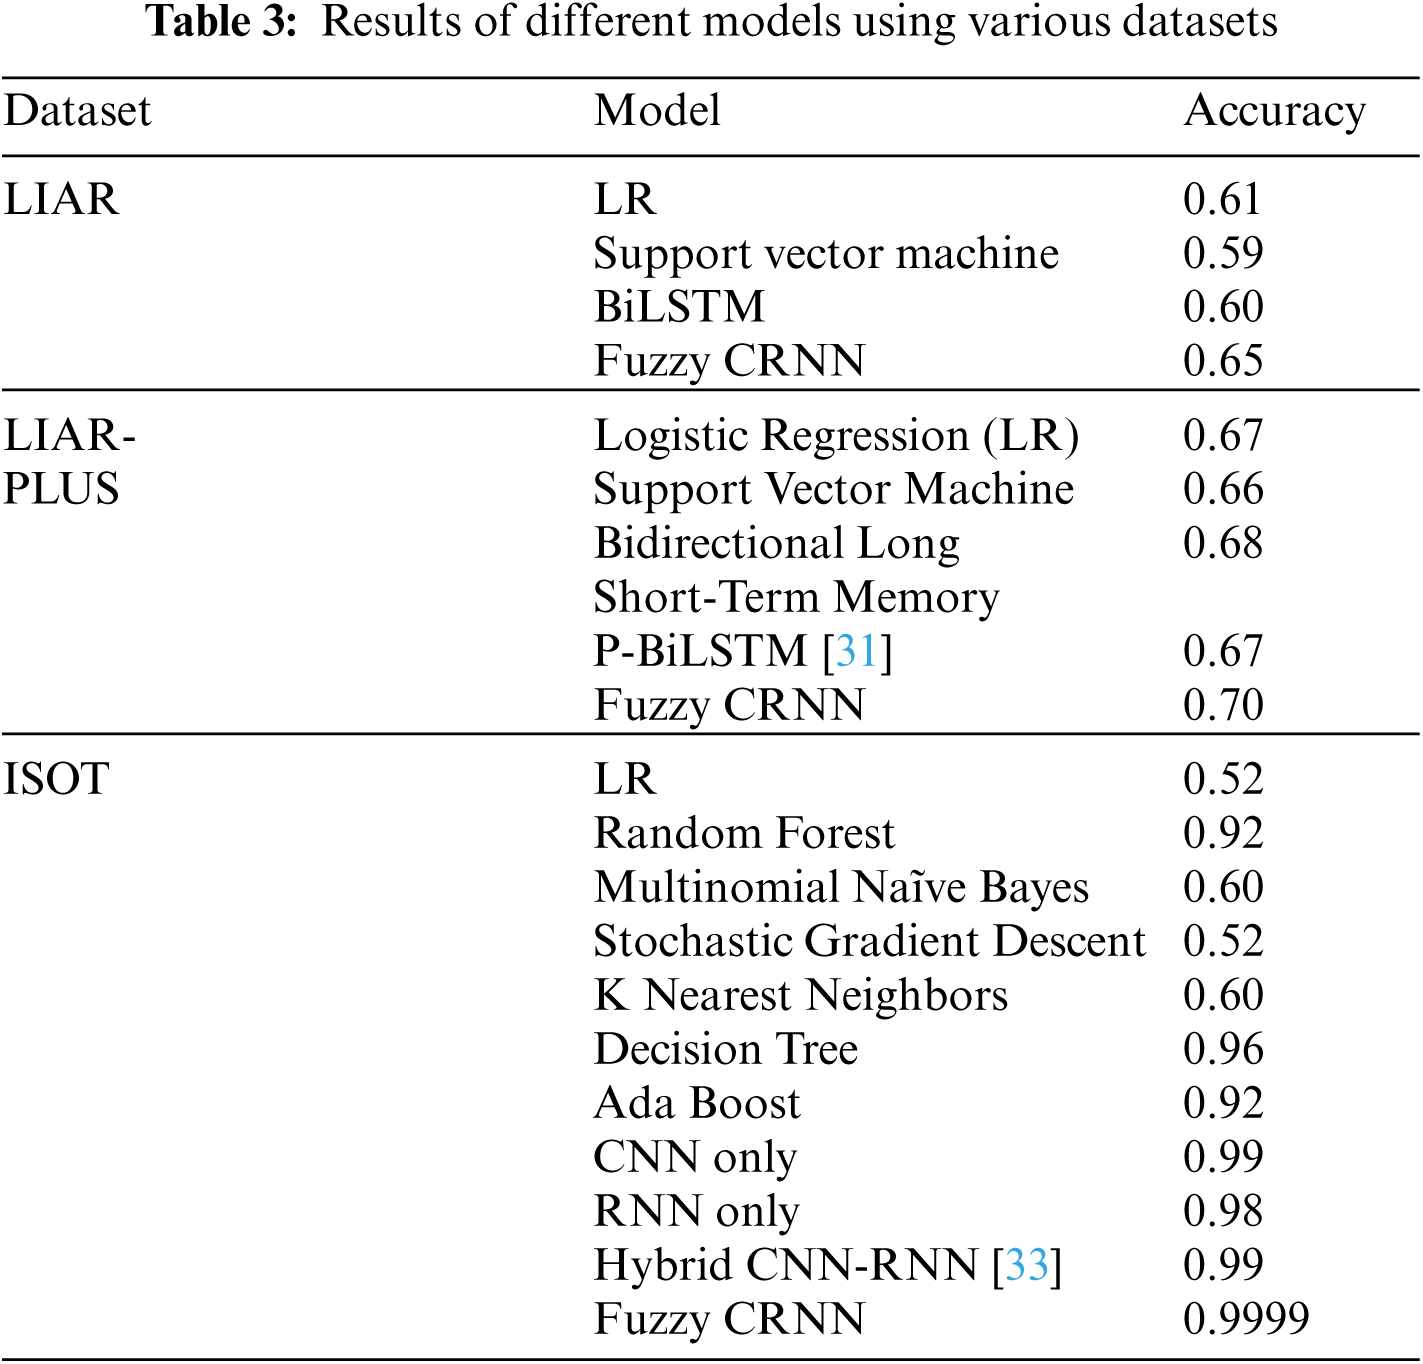
Tab. 3 compares the proposed architecture with other supervised classification models when used for the same binary classification problem with the respective datasets. The table also contains performance results from [32] for the LIAR and LIAR-PLUS dataset and from [33] for the ISOT dataset.
This paper describes the development of an algorithm combining a CRNN and fuzzy c-means algorithm. This combination led to high generalization, the CRNNs ability to process high-dimensional data, and the fuzzy c-means’ ability to allow a data sample to belong to more than one class into a single architecture simultaneously. The proposed approach has been examined using LIAR, LIAR-PLUS, and ISOT datasets. The results showed that the proposed approach yielded 65%, 70%, and 99.99 ± 0.01% accuracy on the LIAR, LIAR-PLUS, and ISOT datasets, respectively. Although, in this work nearly 100% accuracy has been achieved but there are various other methods which have been already given almost same result. So, the importance of doing this work, lies in exploring the Fuzzy CRNN method in fake news classification and testing its accuracy on three different datasets which have been never done. From this all, it can be said that this research interest lies into exploring the possibility to enhance the efficiency or providing theoretical evidence of FCRNN into fake news classification.
The key advantages of the proposed approach are as follows:
• It can handle variable-length inputs.
• Fuzzy c-means can replace the dense layers of the traditional network, thereby reducing overall computation and memory costs without hindering the model's accuracy.
• The same proposed architecture can be employed on other natural language processing tasks.
• The initial encoder can be replaced with pre-trained sentence embedding generators.
• Unsupervised training can be employed for CRNN encoder training.
• The encoder can be easily replaced by another encoder, thereby adding to the robustness of modifications in the architecture.
There is room for advancement of this work in the following ways:
• Better sentence encoding approaches can be employed to more efficiently encode the input statements for FCM input.
• The CRNN and FCM can be trained in a parallel fashion in a single training session.
The most noteworthy limitations of this work are as follows:
• The FCM depended heavily on the CRNN's encoding ability for its final predictions.
• The FCM does not perform well with high-dimensional input data.
Funding Statement: The authors received no specific funding for this study.
Conflicts of Interest: The authors declare that they have no conflicts of interest to report regarding the present study.
1. V. Agarwal, H. P. Sultana, S. Malhotra and A. Sarkar, “Analysis of classifiers for fake news detection,” Procedia Computer Science, vol. 165, pp. 377–383, 2019. [Google Scholar]
2. P. Bahad, P. Saxena and R. Kamal, “Fake news detection using Bi-directional LSTM-recurrent neural network,” Procedia Computer Science, vol. 165, pp. 74–82, 2019. [Google Scholar]
3. C. Zhang, A. Gupta, C. Kauten, A. V. Deokar and X. Qin, “Detecting fake news for reducing misinformation risks using analytics approaches,” European Journal of Operational Research, vol. 279, no. 3, pp. 1036–1052, 2019. [Google Scholar]
4. S. S. Jadhav and S. D. Thepade, “Fake news identification and classification using DSSM and improved recurrent neural network classifier,” Applied Artificial Intelligence, vol. 33, no. 12, pp. 1058–1068, 2019. [Google Scholar]
5. J. Thorne, M. Chen, G. Myrianthous, J. Pu, X. Wang et al., “Fake news stance detection using a stacked ensemble of classifiers,” in Proc. EMNLP Workshop: Natural Language Processing meets Journalism, Copenhagen, Denmark, pp. 80–83, 2017. [Google Scholar]
6. S. M. Basha and D. S. Rajput, “An innovative topic-based customer complaints sentiment classification system,” International Journal of Business Innovation and Research, vol. 20, no. 3, pp. 375–391, 2019. [Google Scholar]
7. T. Traylor, J. Straub and N. Snell, “Classifying fake news articles using natural language processing to identify in-article attribution as a supervised learning estimator,” in 2019 IEEE 13th Int. Conf. on Semantic Computing (ICSC), CA, USA, pp. 445–449, 2019. [Google Scholar]
8. S. M. Basha and D. S. Rajput, “A roadmap towards implementing parallel aspect level sentiment analysis,” Multimedia Tools and Applications, vol. 78, no. 1, pp. 1–30, 2019. [Google Scholar]
9. J. Zhang, L. Cui, Y. Fu and F. B. Gouza, “Fake news detection with the deep diffusive network model,” arXiv preprint arXiv abs/1805.08751, 2018. [Google Scholar]
10. J. Z. Pan, S. Pavlova, C. Li, N. Li, Y. Li et al., “Content-based fake news detection using knowledge graphs,” in Int. Semantic Web Conf., Monterey, CA, USA, Springer, Cham, pp. 669–683, 2018. [Google Scholar]
11. S. Ghosh and C. Shah, “Towards automatic fake news classification,” Proceedings of the Association for Information Science and Technology, vol. 55, no. 1, pp. 805–807, 2018. [Google Scholar]
12. Y. Liu and Y. F. B. Wu, “Early detection of fake news on social media through propagation path classification with recurrent and convolutional networks,” in the Thirty-Second AAAI Conf. on Artificial Intelligence, New Orleans, Louisiana, USA, 2018. [Google Scholar]
13. Y. Wang, F. Ma, Z. Jin, Y. Yuan, G. Xun et al., “Eann: event adversarial neural networks for multi-modal fake news detection,” in Proc. of the 24th ACM SIGKDD Int. Conf. on Knowledge Discovery & Data Mining, London, UK, pp. 849–857, 2018. [Google Scholar]
14. L. Wu and H. Liu, “Tracing fake-news footprints: characterizing social media messages by how they propagate,” in Proc. of the Eleventh ACM Int. Conf. on Web Search and Data Mining, CA, USA, pp. 637–645, 2018. [Google Scholar]
15. K. Shu, D. Mahudeswaran and H. Liu, “Fake news tracker: A tool for fake news collection, detection, and visualization,” Computational and Mathematical Organization Theory, vol. 25, no. 1, pp. 60–71, 2019. [Google Scholar]
16. R. Basak, S. Sural, N. Ganguly and S. K. Ghosh, “Online public shaming on twitter: detection, analysis, and mitigation,” IEEE Transactions on Computational Social Systems, vol. 6, no. 2, pp. 208–220, 2019. [Google Scholar]
17. S. M. Basha and D. S. Rajput, “A supervised aspect level sentiment model to predict overall sentiment on tweeter documents,” International Journal of Metadata, Semantics and Ontologies, vol. 13, no. 1, pp. 33–41, 2018. [Google Scholar]
18. S. Yang, K. Shu, S. Wang, R. Gu, F. Wu et al., “Unsupervised fake news detection on social media: A generative approach,” in Proc. of the Thirty-Third AAAI Conf. on Artificial Intelligence, Hawaii, USA, pp. 5644–5651, 2019. [Google Scholar]
19. F. Monti, F. Frasca, D. Eynard, D. Mannion and M. M. Bronstein, “Fake news detection on social media using geometric deep learning,” arXiv preprint arXiv: 1902.06673, 2019. [Google Scholar]
20. H. Karimi, P. Roy, S. S. Sadiya and J. Tang, “Multi-source multi-class fake news detection,” in Proc. of the 27th Int. Conf. on Computational Linguistics, New Maxico, USA, pp. 1546–1557, 2018. [Google Scholar]
21. S. M. Basha and D. S. Rajput, “Parsing based sarcasm detection from literal language in tweets,” Recent Patents on Computer Science, vol. 11, no. 1, pp. 62–69, 2018. [Google Scholar]
22. M. Giatsoglou, M. G. Vozalis, K. Diamantaras, A. Vakali, G. Sarigiannidis et al., “Sentiment analysis leveraging emotions and word embeddings,” Expert Systems with Applications, vol. 69, pp. 214–224, 2017. [Google Scholar]
23. H. Ahmed, I. Traore and S. Saad, “Detection of online fake news using n-gram analysis and machine learning techniques,” in Int. Conf. on Intelligent, Secure, and Dependable Systems in Distributed and Cloud Environments, Vancouver, Canada, Springer, Cham, pp. 127–138, 2017. [Google Scholar]
24. Y. Yang, L. Zheng, J. Zhang, Q. Cui, Z. Li et al., “TI-CNN: convolutional neural networks for fake news detection,” arXiv preprint arXiv:1806.00749, 2018. [Google Scholar]
25. N. O'Brien, S. Latessa, G. Evangelopoulos and X. Boix, “The language of fake news: opening the black-box of deep learning based detectors,” in Proc. of the Thirty-Second Annual Conf. on Neural Information Processing Systems (NeurIPS), Montréal, Canada, 2018. [Google Scholar]
26. R. K. Kaliyar, A. Goswami, P. Narang and S. Sinha, “FNDNet–a deep convolutional neural network for fake news detection,” Cognitive Systems Research, vol. 61, no. C, pp. 32–44, 2020. [Google Scholar]
27. W. H. Bangyal, J. Ahmad and H. T. Rauf, “Optimization of neural network using improved bat algorithm for data classification,” Journal of Medical Imaging and Health Informatics, vol. 9, no. 4, pp. 670–681, 2019. [Google Scholar]
28. T. L. Nguyen, S. Kauvri, and M. Lee, “A fuzzy convolutional neural network for text sentiment analysis,” Journal of Intelligent and Fuzzy Systems, vol. 35, no. 6, pp. 6025–6034, 2018. [Google Scholar]
29. A. Khattak, M. Z. Asghar, Z. Ishaq, W. H. Bangyal and I. A. Hameed, “Enhanced concept-level sentiment analysis system with expanded ontological relations for efficient classification of user reviews,” Egyptian Informatics Journal, vol. 22, no. 4, pp. 455–471, 2021. [Google Scholar]
30. P. Kumar and R. S. Thakur, “An approach using fuzzy sets and boosting techniques to predict liver disease,” CMC-Computers Materials & Continua, vol. 68, no. 3, pp. 3513–3529, 2021. [Google Scholar]
31. W. Y. Wang, “Liar, liar pants on fire”: A new benchmark dataset for fake news detection,” arXiv preprint arXiv: 1705.00648, pp. 422–426, 2017. [Google Scholar]
32. T. Alhindi, S. Petridis and S. Muresan, “Where is your evidence: improving fact-checking by justification modeling,” in Proc. of the First Workshop on Fact Extraction and VERification (FEVER), Brussels, Belgium, pp. 85–90, 2018. [Google Scholar]
33. J. A. Nasir, O. S. Khan and I. Varlamis, “Fake news detection: A hybrid CNN-RNN based deep learning approach,” International Journal of Information Management Data Insights, vol. 1, no. 1, pp. 100007, 2021. [Google Scholar]
34. G. Chaubey, D. Bisen, S. Arjaria and V. Yadav, “Thyroid disease prediction using machine learning approaches,” National Academy Science Letters, vol. 44, pp. 233–238, 2021. [Google Scholar]
 | This work is licensed under a Creative Commons Attribution 4.0 International License, which permits unrestricted use, distribution, and reproduction in any medium, provided the original work is properly cited. |