DOI:10.32604/cmc.2022.023581
| Computers, Materials & Continua DOI:10.32604/cmc.2022.023581 | |
| Article |
Decision Support System for Diagnosis of Irregular Fovea
1Shah Abdul Latif University, Khairpur, 77150, Pakistan
2Sukkur IBA University, Sukkur, 7720, Pakistan
3Shaheed Benazir University, Layari Karachi, 77202, Pakistan
*Corresponding Author: Muhammad Irshad Nazeer. Email: Irshad.nazeer@iba-suk.edu.pk
Received: 13 September 2021; Accepted: 02 November 2021
Abstract: Detection of abnormalities in human eye is one of the well-established research areas of Machine Learning. Deep Learning techniques are widely used for the diagnosis of Retinal Diseases (RD). Fovea is one of the significant parts of retina which would be prevented before the involvement of Perforated Blood Vessels (PBV). Retinopathy Images (RI) contains sufficient information to classify structural changes incurred upon PBV but Macular Features (MF) and Fovea Features (FF) are very difficult to detect because features of MF and FF could be found with Similar Color Movements (SCM) with minor variations. This paper presents novel method for the diagnosis of Irregular Fovea (IF) to assist the doctors in diagnosis of irregular fovea. By considering all above problems this paper proposes a three-layer decision support system to explore the hindsight knowledge of RI and to solve the classification problem of IF. The first layer involves data preparation, the second layer builds the decision model to extract the hidden patterns of fundus images by using Deep Belief Neural Network (DBN) and the third layer visualizes the results by using confusion matrix. This paper contributes a data preparation algorithm for irregular fovea and a highest estimated classification accuracy measured about 96.90%.
Keywords: Machine learning; deep belief neural network; eye disease; fovea
Although retinopathy images reveals very vital information regarding the diagnosis of eye diseases (ED) but machine level interpretation (MLI) requires intelligent algorithms to train the computers. Since retinal sub components (RSC) on a fundus image are observed with similar colour movements (SCM) having minor variations. For example, SCM of optical nerve, retinal vessels, fovea, blood clots and others could be found with minor variation in SCM as shown in Fig. 1. MLI base algorithms needs optimization to detect RSC as a set of objects because every object has its own significance, morphometric shapes and sizes. A huge number of patients with ED are being reported annually [1] and the people are suffering from various eye diseases such as cataract, glaucoma, diabetic retinopathy etc., [2,3]. However, due to the deceiving nature of perforated blood vessels (PBV) where macular features (MF) and fovea features (FF) are very difficult to discernment because MF and FF are closely relative with minor variations in SCM As shown in Fig. 1, therefore it is very hard to identify abnormalities of MF and FF at early stage [4]. Graph cut segmentation provides assistance in object detection in such situations where color base segmentation is required [5] but loss of vital information (VI) can be reduced as background information (BI) [6] which might be crucial for MLI to instruct the computers [7]. Some of the very nice approaches have been seen over the past few years to diagnose the diseases of retina [8–12]. This paper proposes a novel technique to classify the irregularities of fovea with highest accuracy and proposed method comprises over data preparation such as color segmentation of retinal nerves, segmentation of veins, selection of macula and fovea [13,14]. Feature selection have been performed by using region of interest (ROI). A classification model is trained to construct the decision model where deep belief neural network (DBN) have been used to build the decision model and to estimate the weighted edges, arcs [15] and nodes as associated features to classify the diseases of retinopathy [16,17]. The results of the system are shown by using confusion matrix, precision, recall measure and approximated accuracy of prosed system is measured about 96.90% with five epochs. This research uses a real world dataset of 2400 fundus images along with socio economic variables race, gender because social attributes are very influential upon the retinal anatomies and their behavior to local environment. The used datasets were acquired from civil hospital Kamber, Pakistan.

Figure 1: Micro architectural components of retina
The reset of paper is organized as: Section II presents the literature review. Section III explains the methodology. Section IV shows the results whereas Section V discusses and concludes the results.
Traditionally, eye fundus examination is the primary source to diagnose the abnormalities of eye diseases. An ophthalmologist dilates the pupil of the eye to view deep retinal components [18,19]. There are several types of retinal components where each component is integral part of eye fundus. Among these, very common are optic disk, optic cup, retinal artery, retinal vein, macula and fovea [20].
The main concern of our proposed decision support system is to predict the irregularities of fovea damages human vision. The following three apps and systems in the literature relates to our work.
First, A mobile app proposed in [21] diagnoses eye disease. This app diagnoses the 30 types of eye disease on the basis of eye redness. No details of computational methodology are provided but a survey for usability of app have been conducted. A system is proposed by using computer vision, feature engineering and machine techniques to pre-process eye images, select appropriate features by noise reduction and construct a decision model by using machine learning techniques such as convolution neural networks.
Second, a system proposed in [22] for neurological disorders uses unsupervised machine learning techniques such as KNNs. In data preparation threshold segmentation is used with approximated average entropy. The objective of the system was to identify the human feelings such happy and sad from the video eyes, whereas this paper proposes a system to identify the abnormalities of retina caused by diabetes.
Third, a system in [23] for detection of retinal nerves proposes using computer vision techniques. The objective of the system is to propose an algorithm to detect the nerves by assessing the Euclidean spaces of the feature vectors between minimizing and maximizing the feature spaces. This paper contributes a data-preparation method and appropriate features selection method for retinal vessels detection as well as fovea by considering critical region.
A comparison of machine learning techniques was experimented in [24] for detection of microaneurysms in diabetic retinopathy by considering as critical step to diagnose the disease at early stage. The methodology comprised over three stages having filter banks of Gaussian mixture model, support vector machine and m-Mediods to detect the objects with higher accuracy approximated 99.40% classify the features microaneurysms, whereas our proposed system classifies the fovea and macular degeneration with 96.90% accuracy.
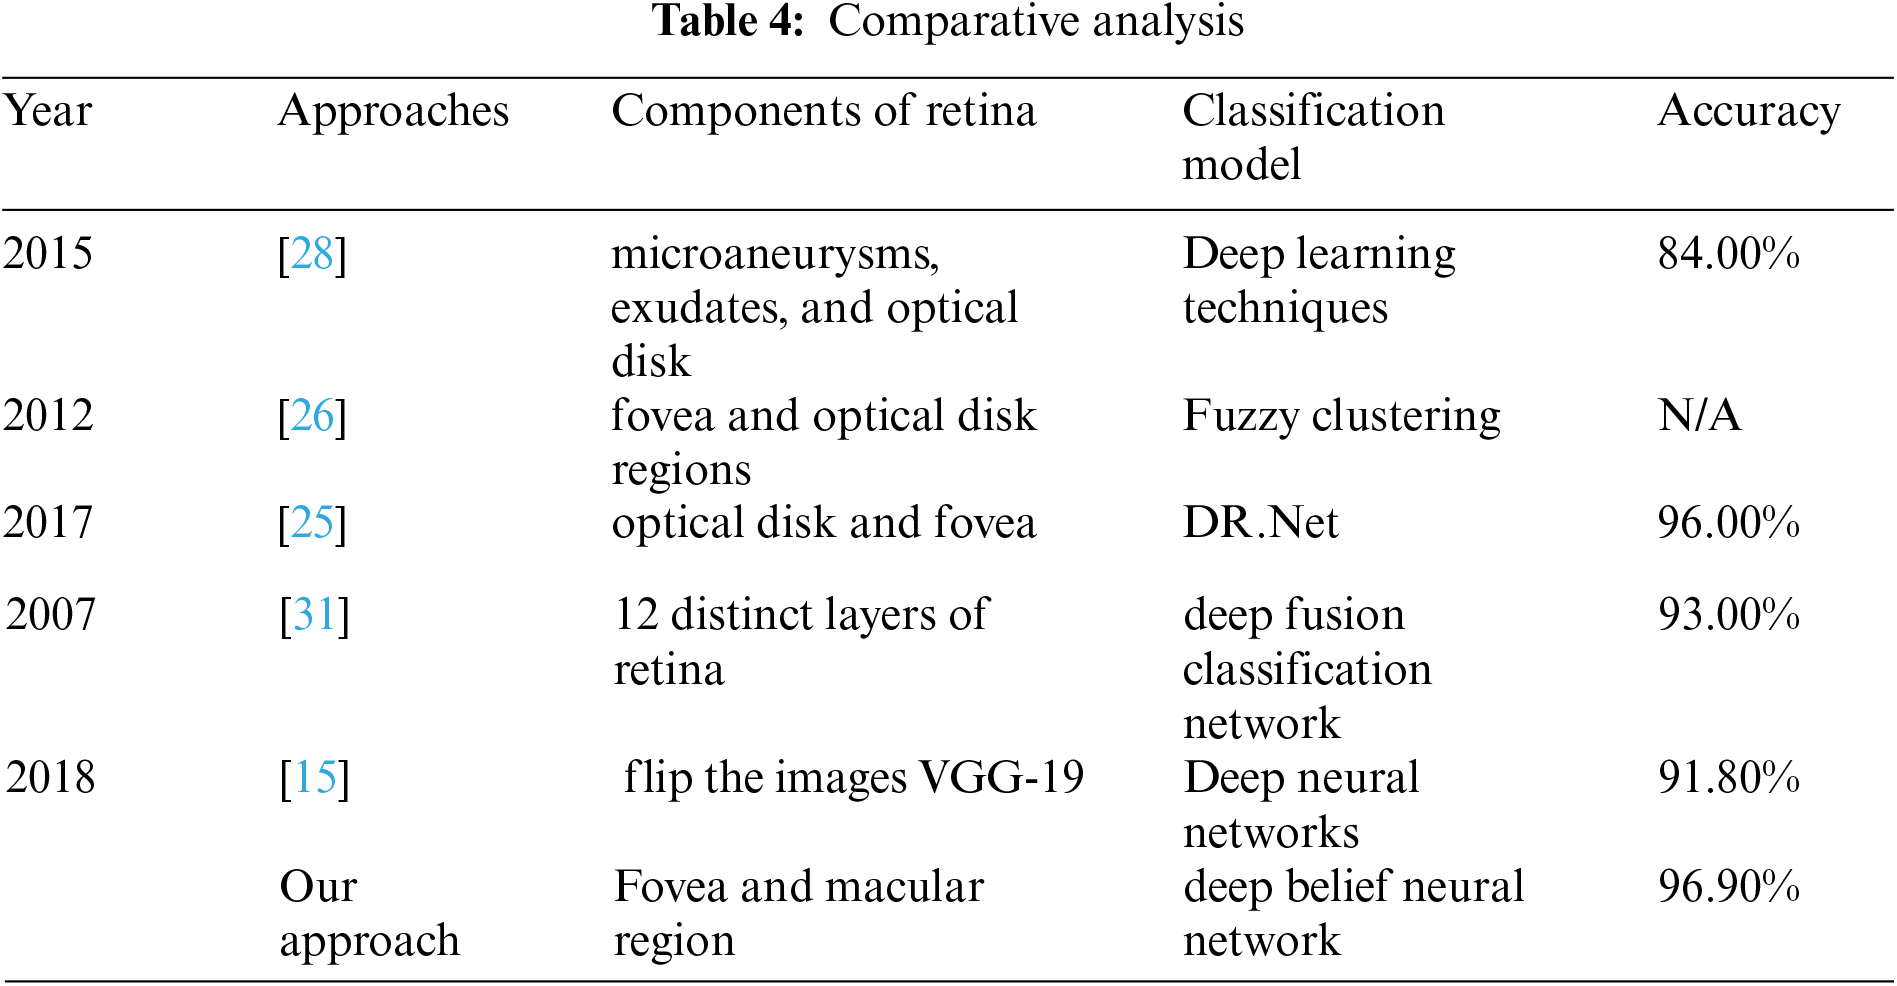
A system [25] for classification of diabetic retinopathy was proposed by considering the features of retina such as microaneurysms, exudates, and optical disk. The measured accuracy of the system was about 84% overall, whereas our proposed system uses deep learning techniques and approximated accuracy measured about 96.90% overall.
A system [26] for classification of diabetic retinopathy was proposed to detect the presence and severity of exudates in various regions of retina and significantly vessel's disorders in fovea and optical disk regions. Fuzzy clustering technique was used to classify the images of retinopathy meanwhile accuracy was not shown in their approach.
An accuracy comparison of three datasets were presented in [27]. Features of optical disk and fovea were extracted and the DR. Net machine learning technique was proposed. Obtained best accuracy was approximated as 96.00%, whereas we use deep belief neural network and select the macular region features to investigate the abnormalities in retina.
A system [28] for proposed for classification of diabetic retinopathy. The features of 12 distinct layers were extracted and classification model was constructed by using deep fusion classification network machine learning technique. Obtained accuracy was measured as 93.00%, whereas we extracted fovea sounded features and obtained 96.90 accuracy.
A system [29] was proposed for classification of fundus images of diabetic retinopathy. VGG-19 model was used to flip the images. Deep neural networks were used to construct the classification model. The approximated accuracy the system was 91.80%, whereas our proposed system trains the classifier to reduce the chances of overfitting problems.
The proposed approach falls into the category of productive mining of machine learning and offers novel algorithm to pre-process the fundus images. The core purpose of proposed approach is to select the features of critical region of retina called fovea as shown in Fig. 2. Since fovea percepts the vision spectrum of human and clarity of vision field is depending upon critical region fovea. Therefore, the fovea features (FF) may be selected carefully for further analysis of every retinal diagnostic process. The proposed solution has three phases: Pre-Process, classification and performance evaluation.

Figure 2: Workflow for decesion support system for classification of fovea
3.1 Phase 1: Pre-Process and Feature Selection
Vessels of the retinal image produces red grow which is sign of a healthy retina but when doctors particularly observe the retina with dilated iris; it opens a new window to examine the retinal changes on account of diabetic retinopathy. Since the minor variation in red color is really difficult to segment the vessels because sub-components of fundus image (FI) are observed with similar colour movement (SCM). Let suppose a color image consists upon the hue, saturation and intensity at every pixel where second derivation of colour color is segmented to visualize the major and minor vessels around the retinal disc [30]. Consider an input image several number of sub-components of FI with SCM
The global segmentation could be approximated as global over
Where each pixel is a presentation of energy levels of color as likelihood for object detection. In the third step adaptive threshold segmentation is done to convert the detected objects in transparent color and to enquire the optimized intensities, since the RGB combination tackles the number of
A continuous image could be reconstructed a set of objects in Gerry scale where
Let's consider a region of interest is a round circle with
The function
DBN (Deep Belief Neural Network) is used to classify the fovea as critical region of human eye retina. The DBN provides strong interpretation of associated variables by constructing the deep layers where each layer learns layer wise approach RBM using the contrastive divergence. DBN supports multiclass classification approach by making several number of class label attributes as set of hypothesis p(x).
The unobserved variables may also be observed by considering each hypothesis
by layer and tunes itself by optimizing the lower bound constraints of associated variables as presented in Tab. 1. The results of the constructed model are presented as per following details.
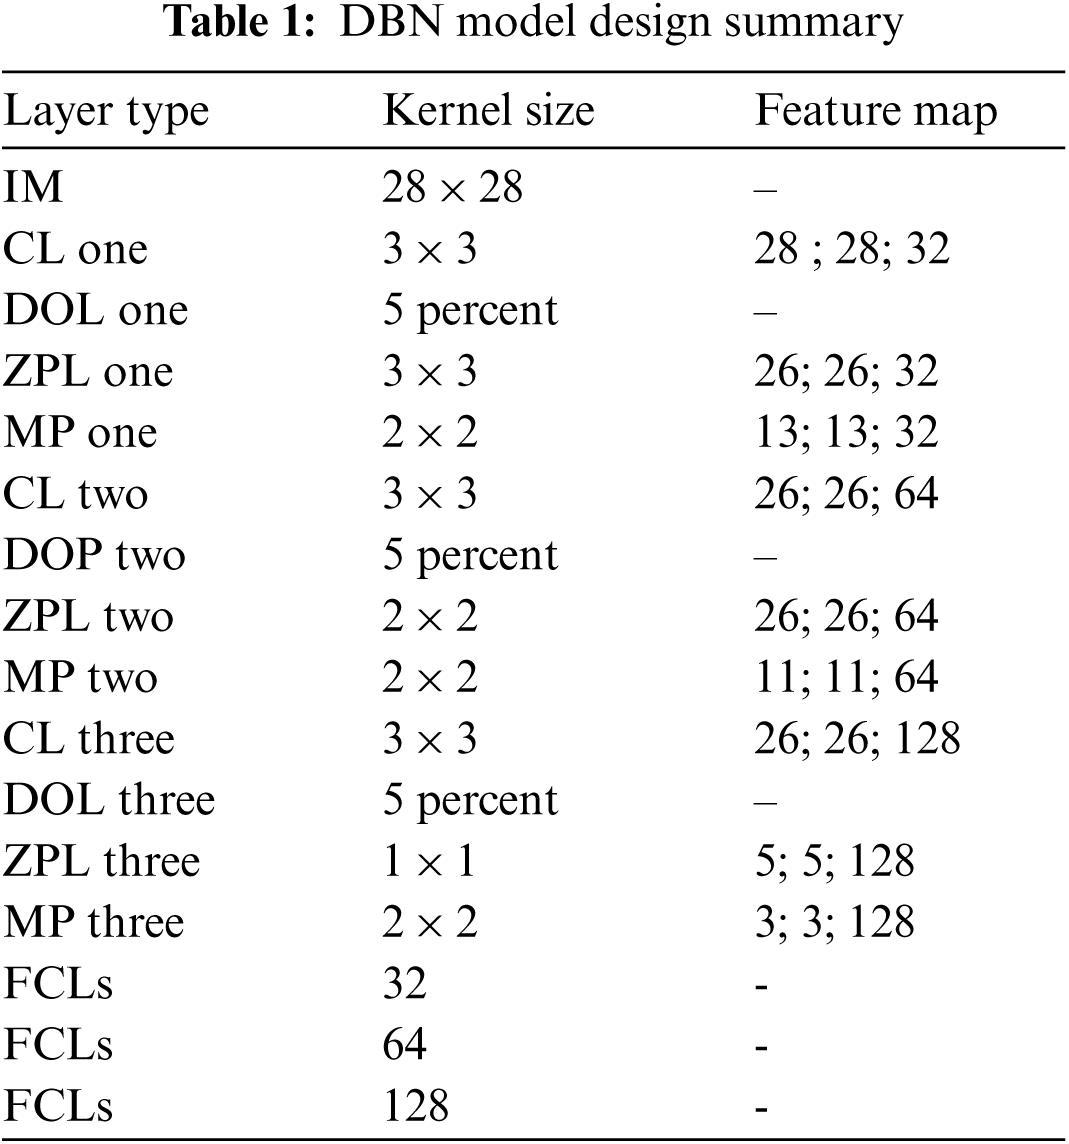
In DBN model design, Tab. 1 contains Input Image (IM), Convocational Layer (CL), Drop out Layer (DOL), Zero Padding Layer (ZPL), Max Pooling (MP), fully connected Layers (FCLs)
3.3 Phase 3: Performance Evaluation
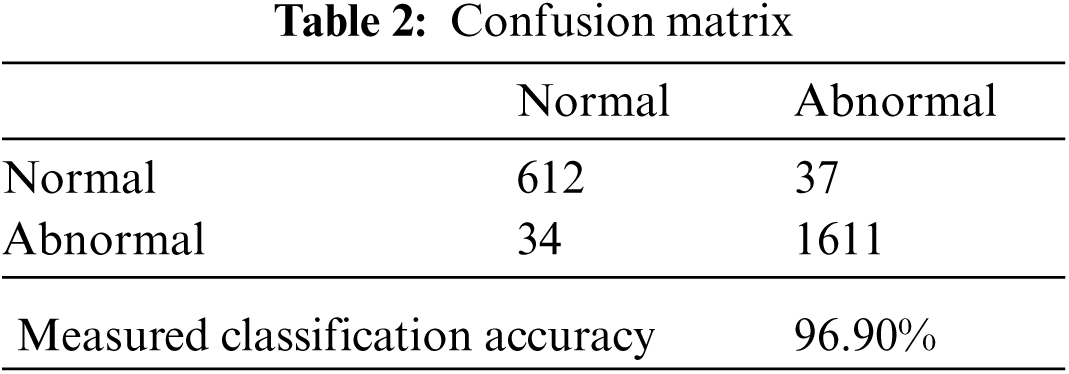
On a confusion matrix accuracy (Acc) is a measure where addition of true positives and false positives quantities are made and divided with the addition of all false, true and false negative quantities as presented in Eq. (4), whereas a confusion matrix calculated with diagonal quantities where true positives are those observations which are classified as normal class and in other identity column, the observations are said to classified as abnormal class and reset of quantities are considered as miss-classified for both classes respectively as defined in Tab. 2.
The precision measure calculates the all number of true positives observations divided by addition of true positives and false positives observations observed by a classification model as per Eq. (5). Often precision approximation is used to represent the quantification that a number of observations are identified by the classification and recall measure represents the number of observations which are accurate on testing times as per Eq. (6).
Fovea is a significant part of retina which is also kwon as vision field, it is situated at the center of macula. In diabetic retinopathy there are fair chances of retinal disorders due to the fluctuation of glucose levels consistently. High blood pressure is also one of the contributing factor to bring the changes in any sub component of retina. There are some types of cataract such as pre-mature cataract, mature cataract, and hyper mature cataract. There are faire chances of retina damage if it is not treated at earlier because black cataract and hyper mature cataract are potential for disk damage. Macular degeneration would be cause for vision loss as shown in Fig. 3.

Figure 3: Preprocessing techniques (A) Arties and Veins segmented with coulr senmentation, (B) Segmentation of optical nerve, (C) Threshold segmentation, (D) Feature selection using ROI
We use real world datasets received from Kamber, Pakistan. The dataset contains around 2400 fundus images which are carefully captured with the assistance of cannon CR-1 digital camera. Majority of patients came for screening purposes, most of the patients were diagnosed with cataracts, glaucoma, diabetic retinopathy, etc., we carefully selected 2300 images to build the decision model to extract the insight knowledge of macular region information. Fovea is located in macular region. Pixel intensities of retina are almost similar with minor variations therefore very hard to detect. In our preprocessing method we use color segmentation algorithm to detect the nerves and veins. The color of veins and nerves is almost similar with is out of scope of this paper, however we consider the objects which are present in macular region. We convert the image in grey scale to and convert into binary image with binary threshold method than the image features are selected with the assistance of region of interest in circular shape because the morphology of macula is round in its features as shown in Fig. 3. All images are labeled by an experienced ophthalmologist. The results show that a total number of 2294 observation were recorded from 2300 normal fovea images, see Tabs. 2 and 3, are printed into confusion matrix. Out of these 649 fovea 612 were belonging to the normal class label attribute and 1611 were belonging to the abnormal class label attribute. False positive were recorded for class label normal as 34 and 37 were observed for true negative. Further analysis of the confusion matrix is presented into, see Tab. 3, where the precision for the class label attribute for normal class yes were measured about 94.29% whereas recall measure was approximated as 94.73%. Since the abnormal class label attribute's precision was measured as 97.93% and recall measure was approximated as 97.75%. The measured classification accuracy is about 96.90%. Tab. 4 shows the information of accuracies previously obtained for macular region.
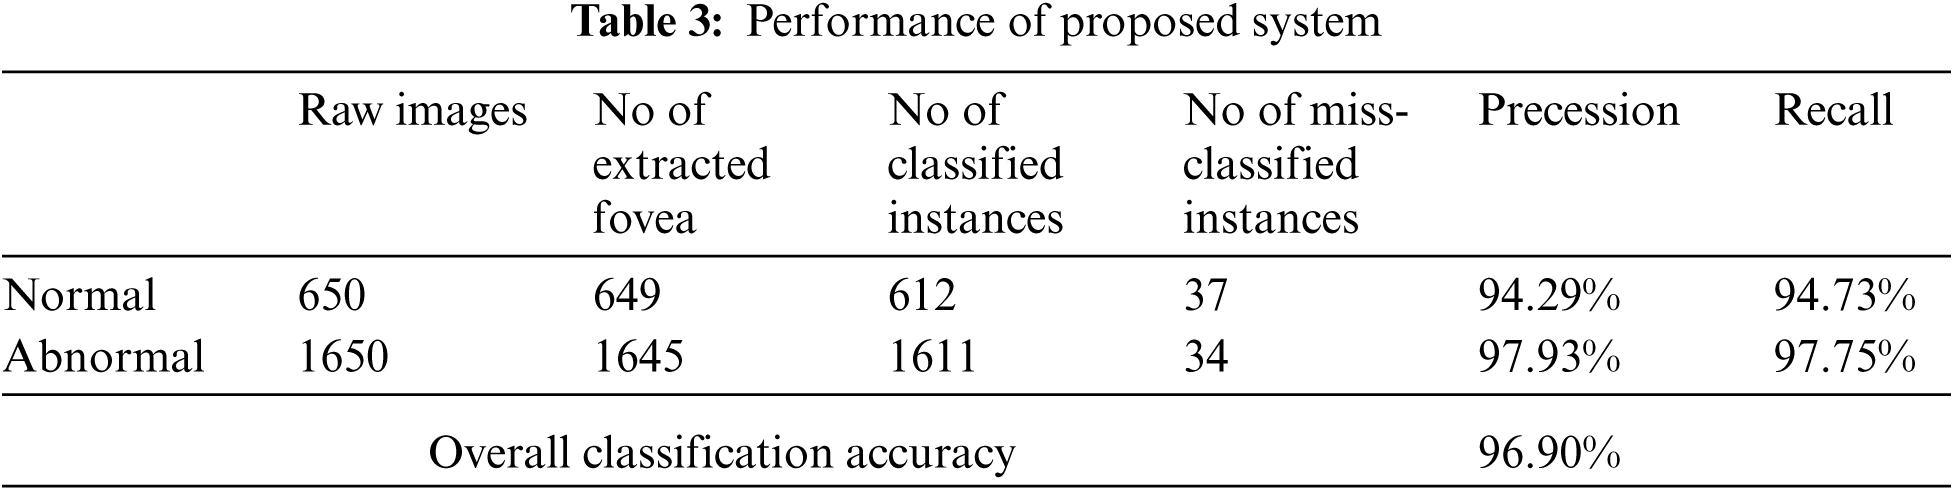
Decision support systems for diagnosis of retinal diseases would assist the doctors to predict the early changes and could protect the humans from vision loss. This paper proposes a system which contributes (A) a preprocessing method (b) highest classification accuracy to classify fovea features (FF) and predicts irregular fovea (IF). In fundus images preprocessing; we selected macular feature (MF) and further we selected fovea features (FF) by considering the fovea as critical region of retina. The three layered system perform preprocessing at first layer and at the second layer constructs decision model by using DBN (deep belief neural network) as classification model with optimal settings; however, third layer presents the results by using precision and recall measures to estimate the overall accuracy. The precision for the class label attribute normal was measured about 94.29% whereas recall measure was approximated as 94.73%. Since the abnormal class label attribute's precision was measured as 97.93% and recall measure was approximated as 97.75%. The measured classification accuracy is about 96.90%.
Acknowledgement: The thankful to the Department of Ophthalmology, Health Department, Kamber, Pakistan providing datasets and annotation of class label attributes.
Funding Statement: The authors received no specific funding for this study.
Conflicts of Interest: The authors declare that they have no conflicts of interest to report regarding the present study.
1. J. Lee, S. Cho, J. Song, M. Lee, S. H. Kim et al., “Development of decision support software for deep learning-based automated retinal disease screening using relatively limited fundus photograph data,” Electronics, vol. 10, no. 2, pp. 163, 2021. [Google Scholar]
2. T. Saba, S. Akbar, H. Kolivand, and S. A. Bahaj, “Automatic detection of papilledema through fundus retinal images using deep learning,” Microscopy Research and Technique, vol. 2021, no. 7, pp. 1–12, 2021. [Google Scholar]
3. A. Kwasigroch, B. Jarzembinski and M. Grochowski, “Deep CNN based decision support system for detection and assessing the stage of diabetic retinopathy,” in Proc. 2018 Int. Interdisciplinary PhD Workshop (IIPhDW), Świnouście, Poland, pp. 111–116, 2018. [Google Scholar]
4. U. R. Acharya, E. Y. K. Ng, L. W. J. Eugene, K. P. Noronha, L. C. Min et al., “Decision support system for the glaucoma using gabor transformation,” Biomedical Signal Processing and Control, vol. 15, pp. 18–26, 2018. [Google Scholar]
5. J. Escorcia-Gutierrez, J. Torrents-Barrena, M. Gamarra, P. Romero-Aroca, A. Valls et al., “A color fusion model based on markowitz portfolio optimization for optic disc segmentation in retinal images,” Expert Systems with Applications, vol. 174, no. 11, pp. 114697, 2021. [Google Scholar]
6. B. Remeseiro, A. M. Mendonça and A. Campilho, “Automatic classification of retinal blood vessels based on multilevel thresholding and graph propagation,” the Visual Computer, vol. 37, no. 6, pp. 1247–1261, 2021. [Google Scholar]
7. C. Wang, M. Oda, Y. Hayashi, Y. Yoshino, T. Yamamoto et al., “Tensor-cut: A tensor-based graph-cut blood vessel segmentation method and its application to renal artery segmentation,” Medical Image Analysis, vol. 60, no. 2, pp. 101623, 2020. [Google Scholar]
8. R. Martins, “BW-Eye ophthalmologic decision support system based on clinical workflow and data mining techniques-image registration algorithm,” arXiv, 2015. [online] Available: https://arxiv.org/abs/1312.4752. [Google Scholar]
9. M. U. Akram, S. Khalid and S. A. Khan, “Identification and classification of microaneurysms for early detection of diabetic retinopathy,” Pattern Recognition, vol. 46, no. 1, pp. 107–116, 2013. [Google Scholar]
10. M. D. Abràmoff, M. Niemeijer, M. S. Suttorp-Schulten, M. A. Viergever, S. R. Russell et al., “Evaluation of a system for automatic detection of diabetic retinopathy from color fundus photographs in a large population of patients with diabetes,” Diabetes Care, vol. 31, no. 2, pp. 193–198, 2008. [Google Scholar]
11. M. K. Hasan, M. A. Alam, M. T. Elahi, S. Roy and R. Martí, “DRNet: Segmentation and localization of optic disc and fovea from diabetic retinopathy image,” Artificial Intelligence in Medicine, vol. 111, no. 10, pp. 2001, 2021. [Google Scholar]
12. Z. Gao, J. Li, J. Guo, Y. Chen, Z. Yi et al., “Diagnosis of diabetic retinopathy using deep neural networks,” IEEE Access, vol. 7, pp. 3360–3370, 2018. [Google Scholar]
13. M. Islam, T. N. Poly, B. A. Walther, H. C. Yang and Y. C. J. Li, “Artificial intelligence in ophthalmology: A meta-analysis of deep learning models for retinal vessels segmentation,” Journal of Clinical Medicine, vol. 9, no. 4, pp. 1018, 2020. [Google Scholar]
14. Y. Kwon, J. H. Won, B. J. Kim and M. C. Paik, “Uncertainty quantification using Bayesian neural networks in classification: Application to biomedical image segmentation,” Computational Statistics and Data Analysis, vol. 142, pp. 106816, 2018. [Google Scholar]
15. M. Abdar, F. Pourpanah, S. Hussain, D. Rezazadegan, L. Liu et al., “A review of uncertainty quantification in deep learning: Techniques, applications and challenges,” Information Fusion, vol. 76, no. 1, pp. 243–297, 2021. [Google Scholar]
16. Y. Xia, Y. Zhang, F. Liu, W. Shen and A. L. Yuille, “Synthesize then compare: Detecting failures and anomalies for semantic segmentation,” in Proc. 16th European Conf. on Computer Vision (ECCV), Glasgow, UK, pp. 145–161, 2020. [Google Scholar]
17. M. Pocevičiūtė, G. Eilertsen and C. Lundström, “Survey of XAI in digital pathology,” Artificial intelligence and machine learning for digital pathology,” Lecture Notes in Computer Science, vol. 12090, pp. 56–88, 2020. [Google Scholar]
18. K. Shankar, Y. Zhang, Y. Liu, L. Wu and C. H. Chen, “Hyperparameter tuning deep learning for diabetic retinopathy fundus image classification,” IEEE Access, vol. 8, pp. 118164–118173, 2020. [Google Scholar]
19. T. Saba, S. T. F. Bokhari, M. Sharif, M. Yasmin and M. Raza, “Fundus image classification methods for the detection of glaucoma: A review,” Microscopy Research and Technique, vol. 81, no. 10, pp. 1105–1121, 2018. [Google Scholar]
20. X. Li, T. Pang, B. Xiong, W. Liu, P. Liang et al., “Convolutional neural networks based transfer learning for diabetic retinopathy fundus image classification,” in Proc. 10th Int. Congress on Image and Signal Processing, BioMedical Engineering and Informatics (CISP-BMEI), Shanghai, China, pp. 1–11, 2017. [Google Scholar]
21. M. M. López, I. De la Torre Díez, J. C. P. Jimeno and M. López-Coronado, “A mobile decision support system for red eye diseases diagnosis: Experience with medical students,” Journal of Medical Systems, vol. 40, no. 6, pp. 151, 2017. [Google Scholar]
22. J. I. Orlando, E. Prokofyeva, M. Del Fresno and M. B. Blaschko, “Convolutional neural network transfer for automated glaucoma identification,” in Proc. 12th Int. Symposium on Medical Information Processing and Analysis, Tandil, Argentina, pp. 101600, 2017. [Google Scholar]
23. N. Singh and R. C. Tripathi, “Automated early detection of diabetic retinopathy using image analysis techniques,” International Journal of Computer Applications, vol. 8, no. 2, pp. 18–23, 2010. [Google Scholar]
24. A. El-Tanboly, M. Ismail, A. Shalaby, A. Switala, A. El-Baz et al., “A computer-aided diagnostic system for detecting diabetic retinopathy in optical coherence tomography images,” Medical Physics, vol. 44, no. 3, pp. 914–923, 2017. [Google Scholar]
25. S. Roychowdhury, D. D. Koozekanani and K. K. Parhi, “Screening fundus images for diabetic retinopathy,” in Proc. 46th Asilomar Conf. on Signals, Systems and Computers, Pacific Grove, CA, USA, pp. 1641–1645, 2013. [Google Scholar]
26. P. Jitpakdee, P. Aimmanee and B. Uyyanonvara, “A survey on hemorrhage detection in diabetic retinopathy retinal images,” in Proc. 9th Int. Conf. on Electrical Engineering/Electronics, Computer, Telecommunications and Information Technology, Phetchaburi, Thailand, pp. 1–4, 2012. [Google Scholar]
27. S. B. Sujith-Kumar and V. Singh, “Automatic detection of diabetic retinopathy in non-dilated RGB retinal fundus images,” International Journal of Computer Applications, vol. 47, no. 19, pp. 26–32, 2015. [Google Scholar]
28. W. Kusakunniran, Q. Wu, P. Ritthipravat and J. Zhang, “Hard exudates segmentation based on learned initial seeds and iterative graph cut,” Computer Methods and Programs in Biomedicine, vol. 158, no. 5, pp. 173–183, 2007. [Google Scholar]
29. X. Xu, C. Chen, W. Ding, P. Yang, H. Lu et al., “Automated quantification of superficial retinal capillaries and large vessels for diabetic retinopathy on optical coherence tomographic angiography,” Journal of Biophotonics, vol. 12, no. 11, 2019. [Google Scholar]
30. C. Agurto, E. S. Barriga, V. Murray, S. Nemeth, R. Crammer et al., “Automatic detection of diabetic retinopathy and age-related macular degeneration in digital fundus images,” Investigative Ophthalmology and Visual Science, vol. 52, no. 8, pp. 5862–5871, 2010. [Google Scholar]
31. K. K. D. Ramesh, G. K. Kumar, K. Swapna, D. Datta and S. S. Rajest, “A review of medical image segmentation algorithms,” EAI Endorsed Transactions on Pervasive Health and Technology, vol. 1, no. 1, pp. 1–9, 2021. [Google Scholar]
32. A. F. Fadzil, N. E. Abd-Khalid and S. Ibrahim, “Amplification of pixels in medical image data for segmentation via deep learning object-oriented approach,” International Journal of Advanced Technology and Engineering Exploration, vol. 8, no. 74, pp. 77–82, 2021. [Google Scholar]
 | This work is licensed under a Creative Commons Attribution 4.0 International License, which permits unrestricted use, distribution, and reproduction in any medium, provided the original work is properly cited. |