DOI:10.32604/cmc.2022.023492
| Computers, Materials & Continua DOI:10.32604/cmc.2022.023492 | |
| Article |
Contrast Correction Using Hybrid Statistical Enhancement on Weld Defect Images
1Advanced Computing (AdvCOMP), Centre of Excellence, Universiti Malaysia Perlis (UniMAP), Pauh Putra Campus, Arau, 02600, Perlis, Malaysia
2Faculty of Electrical Engineering Technology, Universiti Malaysia Perlis (UniMAP), Pauh Putra Campus, Arau, 02600, Perlis, Malaysia
3Faculty of Electronic Engineering Technology, Universiti Malaysia Perlis (UniMAP), Pauh Putra Campus, Arau, 02600, Perlis, Malaysia
4Faculty of Engineering, the Islamic University, 54001, Najaf, Iraq
5Faculty of Chemical Engineering Technology, Universiti Malaysia Perlis (UniMAP), Arau, 02600, Perlis, Malaysia
*Corresponding Author: Wan Azani Mustafa. Email: wanazani@unimap.edu.my
Received: 10 September 2021; Accepted: 22 October 2021
Abstract: Luminosity and contrast variation problems are among the most challenging tasks in the image processing field, significantly improving image quality. Enhancement is implemented by adjusting the dark or bright intensity to improve the quality of the images and increase the segmentation performance. Recently, numerous methods had been proposed to normalise the luminosity and contrast variation. A new approach based on a direct technique using statistical data known as Hybrid Statistical Enhancement (HSE) is presented in this study. The HSE method uses the mean and standard deviation of a local and global neighbourhood and classified the pixel into three groups; the foreground, border, and problematic region (contrast & luminosity). The datasets, namely weld defect images, were utilised to demonstrate the effectiveness of the HSE method. The results from the visual and objective aspects showed that the HSE method could normalise the luminosity and enhance the contrast variation problem effectively. The proposed method was compared to the two (2) populor enhancement methods which is Homomorphic Filter (HF) and Difference of Gaussian (DoG). To prove the HSE effectiveness, a few image quality assessments were presented, and the results were discussed. The HSE method achieved a better result compared to the other methods, which are Signal Noise Ratio (8.920), Standard Deviation (18.588) and Absolute Mean Brightness Error (9.356). In conclusion, implementing the HSE method has produced an effective and efficient result for background correction and quality images improvement.
Keywords: Contrast; enhancement; image; statistic; weld defect
Image enhancement is an important topic in image analysis to help humans and computer vision algorithms obtain accurate analysis information. The visual quality and specific image properties, such as brightness, contrast, signal to noise ratio, resolution, edge sharpness, and colour accuracy, were improved through the enhancement process [1,2]. Many researchers have studied contrast enhancement techniques to enhance the quality of images [3–5]. Contrast enhancement can be categorised into two types; (1) direct method and (2) indirect method [6,7]. The direct method enhances the details by defining or detecting the contrast, while the indirect method improves the contrast without specifying a specific contrast region. The indirect methods are not efficient and effective since it extends the global distribution of the intensity compared to the direct method [8].
In various inspections, industrial radiography is regarded as among the essential non-destructive testing procedures. Due to the dispersed X-rays, radiography images frequently possess a low signal-to-noise ratio. For the welding defects’ inspection, a number of non-destructive testing (NDT) methods exist. When uneven illumination, noise, and contrast are involved, enhancing welding defects in radiography images becomes non-trivial. Weld defect X-radiography images, in particular, are often low-contrast, with the defects appearing on the image's wider background region. Image processing techniques can be utilised to increase image contrast and accomplish enhanced defect detection. Guo et al. [9] presented a welding defect detection technique utilising a generative adversarial network mixed with transfer learning in 2021, based on imbalanced radiography images. First, a novel model called contrast enhancement with a conditional generative adversarial network is suggested, which may be utilised as a creative global resampling approach for X-ray image's data augmentation. Subsequently, Mirzapour et al. [10] proposed total variations (TV)-based techniques implemented as high pass edge-enhancing filters in an indirect manner. The adoption of all three techniques resulted in better image contrast, allowing for enhanced image detail visualisation, according to qualitative operator perception findings. However, there were minor performance variations between the outputs of distinct algorithms, particularly near the image features’ edges. Furthermore, in histogram-based segmentation techniques, the histogram mode plays a crucial role, while several techniques are classified based on histogram mode, for instance, multimodal, bimodal, and unimodal. As a result, a previous assessment of the image's histogram mode is required, resulting in the selection of the suitable segmentation approach and the avoidance of any ineffective attempts. Using the non-maxima suppression technique, a novel method for automatically determining the image's histogram mode is suggested. The suggested approach is used to a dataset of X-radiography weld images, where the assessment accuracy is good [11].
Despite the fact that various artificial intelligence (AI)-based technologies are being utilised to detect defects in radiography images, the final decision is still determined by a human visual inspection. As a result, radiographic images must be enhanced to help the inspection process. Moreover, Chang et al. [12] studied a technique for radiographic testing (RT) weld image enhancement relying on phase symmetry, which is associated with human vision principles. Because phase symmetry is independent of an image's greyscale and contrast information, it is appropriate for RT images with low contrast and greyscale values. The method is contrasted to frequently employed methods, with the findings indicating that it outperforms state-of-the-art procedures. The three methods employed are interpolated convolution (IC), normalised convolution (NC), and recursive filtering (RF), as reported by Yahaghi et al. [13]. According to the qualitative operator perception findings, using all three techniques improves image contrast, allowing for better visualisation of image detail. However, there are minor variations in performance across the outputs of the various algorithms, particularly near the borders of image features. To improve the identification of weld defects in radiography images of welded objects, an interlaced multistage bilateral filtering and wavelet thresholding were applied. In actual noisy radiography images, it may successfully eliminate the defect regions [14]. MSRE is a novel algorithm for radiographic image enhancement proposed by Dang et al. [15]. Linear weighting between an original radiography image and its contrast-limited adaptive histogram equalisation image is used in the first phase of enhancement. Next, the weighted image is smoothed while the fault edges are properly preserved using anisotropic diffusion filtering. In the final stage, the filtered image is enhanced with a fuzzy enhancement algorithm, resulting in a new image with high contrast, definition, and strong edge intensity. One of the most critical influencing variables in the process of weld radiography image's defect evaluation is image quality. For example, Azani Mustafa et al. [8] offered a new quality enhancement approach based on the human visual system to increase the digital images’ contrast and brightness of weld radiography film. This work first introduces the human visual resolution ability of gray and the digital imaging model, followed by the gray-level mapping transformation function.
Saleh et al. [16] presented a survey on mathematical equations for homomorphic filtering in the frequency domain for different applications such as imaging applications, biometric, medical, and robotic vision. A few modification equations based on the homomorphic filter was presented, and they concluded that the shape of the filter is similar. Still, the performance of each filter might be different from each other. Previous studies concentrated on proposing a new algorithm to control the illumination effect. In 2006, Delac et al. [17] proposed a slight modification of the original homomorphic filtering algorithm. In this method, the authentic images were divided into sub-images based on the horizontal and vertical directions, where the homomorphic filtering was applied on each sub-images individually. Finally, the sub-results from the filtering stage were merged and represented as the normalised output image. The technique had significantly enhanced the contrast and eliminate the illumination in the face images. Besides, the above finding is consistent with the study by Fan et al. [18] that proposed a different modification of the homomorphic filtering equation. This study focuses on modifying the Gaussian high pass filter, known as Difference of Gaussian (DoG) filtering. The resulting performance has corrected the illumination and preserved the edge and details in the entire image. However, by proposing a new modified algorithm, a few selection parameters

To summarise, it is challenging to analyse images with substantial brightness and contrast change using automatic computer-based screening and detection techniques. Many different properties of various image processing systems have been offered based on the literature. In this study, a few kinds of literature gave a strong motivation to propose a new enhancement method, given by:
1. A good contrast enhancement should consider both global and local information [23,24].
2. Contrast and luminosity enhancement are important. However, it is a very challenging task and is impossible to construct a perfect mathematical model, especially for badly illumination [25].
3. The luminosity and contrast problem greatly affected the segmentation performance [26–28].
4. Mean value can represent the luminosity, and standard deviation can represent contrast variation [29].
2 Hybrid Statistical Enhancement (HSE) Method
The algorithm is developed using MATLAB 2017 from Toshiba laptop (L50A) with processor Intel® Core™ i5–4200 M CPU @ 2.50 GHz. All the images was provided by Materials Technology Group using x-tray capturing technique. All the processed images are in greyscale photos, where the size of each image is 320 × 120 pixels, 72 dpi, and 8-bit depth. Defects that are present in the high intensity area (or the region of interest) are low in intensity and thus are usually excluded from the region of interest (ROI) [30,31]. In this study, the proposed method is known as ‘hybrid’ because it combines the local and the global details information [23]. Besides that, image enhancement methods can be divided into global and local methods [32,33]. A local methods use local image information to process a given area in the image. Often image characteristics differ from region to region, reasonable to use context-sensitive approaches when enhancing the contrast. In conclusion, global contrast enhancement techniques enhance the overall contrast by depending on the global content of the image. However, local enhancement methods improve image details, block discontinuities, noise amplification, and unnatural image modifications [7]. Illumination (luminosity and contrast) is described as a non-uniform intensity that appears as the darkest or brightest region on the original image. Recently, illumination variation is still a challenging problem in the enhancement research area. When the lighting condition is changed, the intensity appears variously. More specifically, the changes caused by the variation of lighting could be more significant than the difference between the appearance of individuals. Reflections and shadows are two main categories of appearance variation due to illumination variation. The direction of the light source may cause the image to turn too bright or too dark. The flow of the proposed method is illustrated in Fig. 1.

Figure 1: The flow chart of the proposed HSE method
The statistical parameters such as mean and standard deviation were used in this method. According to Foracchia et al. [29], the luminosity and contrast can be presented by mean and standard deviation levels. The main function of the standard deviation is to measure the spread of the intensity from the mean value. It measures the difference between the grey level of a target pixel and the mean of the grey levels of the surrounding pixels in the region [25]. Based on Fig. 1, upon determining the statistical parameters of the local standard deviation and the local mean for each 3 × 3 windowing size, the original image was classified into three groups: foreground, border, and problematic (contrast & luminosity) region. The foreground region (object) of the image was assumed to be darker than the background, while the problematic region was considered the region with contrast or luminosity intensity. “Border region” means the edge between the foreground and the problematic region. Initially, for a specific
2.1 Foreground (Object) Region Detection
The detection of the foreground region is essential to avoid any changes of the intensity level and automatically remain the original foreground information. In this experiment, all the foreground pixels were assumed to have lower intensity than the background and problematic pixels. The main purpose of this condition is to determine the foreground region in the original image. Based on statistical parameters (mean and standard deviation) from Section 2, a situation was set as follows;
Here,
Equation (1) is based on the local standard deviation involved within the dark region (foreground). The value of the local standard deviation was lower than the global value. In addition, Eq. (1) can represent the problematic region since the illumination region also shows the smallest value in terms of standard deviation. Thus, Eq. (2), based on the local mean, was proposed to find a specific foreground region. The local mean value was lower in the dark part (lower intensity) than the global mean, as demonstrated in Fig. 2. Also, Fig. 2 shows the example of different intensities to represent the two regions: (b) the problematic region and (c) the foreground.
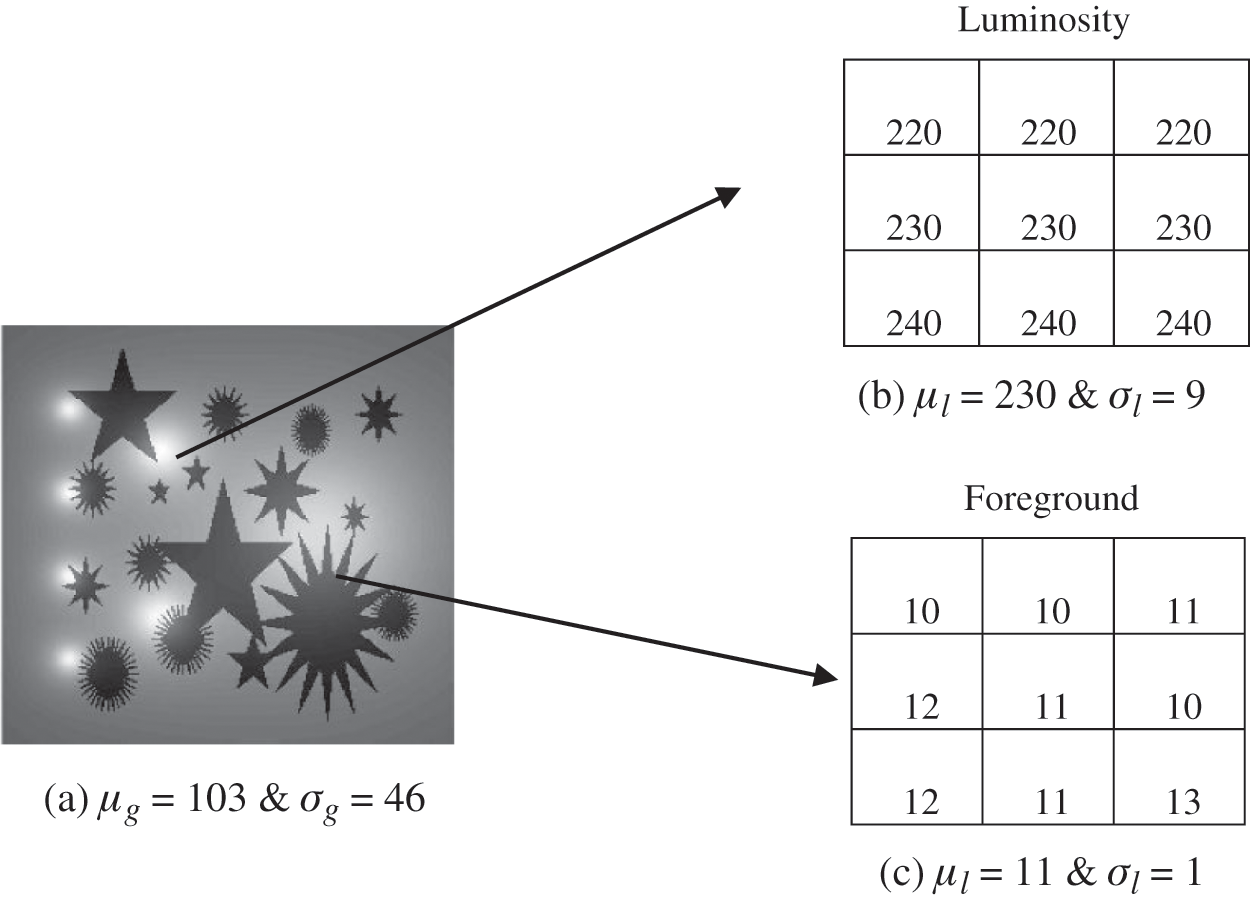
Figure 2: An intensity difference: (a) the original image; (b); the problematic region; and (c); the foreground region
In the non-uniform image, several groups of intensity levels appeared, as shown in Fig. 2. Fig. 2b represents a luminosity problem region with a high-intensity level. In this situation, the mean (230) and standard deviation (9) is the highest value compared to the other region. Meanwhile, Fig. 2c represents the foreground region with lower intensity level (mean = 11 and standard deviation = 1). The black region coordinates were assumed as the foreground region. A certain background region was marked with black because the intensity level of the specific background was almost similar to the foreground (object) intensity. This problem can be solved in the second level stage. The literature review stated that it is impossible and challenging to separate the foreground and the background region when the intensity is almost similar [20,25]. In this situation, the original intensity marked as black colour remains unchanged.
This section focuses on the border region because it is very significant to remain at the object's edge. The border intensity is essential, especially in separating the background and the foreground in the segmentation stage. The non-uniform contrast image is tough to determine the borderline, especially when the luminosity exists on the borderline. To produce a good quality image, the borderline should be detected. In a normal condition, the background image shows slightly brighter compared to the foreground, while darker compared to the problematic region. This section aims to solve the border region problem between the backgrounds (bright) and the foreground (dark).
The border region condition is denoted as the following;
where
According to Eq. (3), the border region indicates that the standard deviation for each 3 × 3 windowing size is higher than the global standard deviation. Usually, there are several intensity values in the border region, such as luminosity (high intensity) and foreground (low intensity). This situation occurred because the border region's intensity value has the most significant difference between each other. In addition, the standard deviation in this region is higher than the other region because it consists of a large intensity variation. To remain the edge of the object, the intensity remained unchanged.
2.3 Problematic Region Detection
In this section, the problematic region is defined as a contrast variation and luminosity region. According to the literature reviews, the contrast region's luminosity contributed significantly to the segmentation result performance [27,28,36]. In this work, the problematic region focused on normalising and enhancing the intensity pixel. Usually, in the active region, the intensity value is higher compared to the background and foreground. This region is assumed as the bright region. The proposed condition to detect the problematic region is denoted as follows;
where
As explained in Section 2.1, a local standard deviation smaller than the global standard deviation also represent a problematic region. Eqs. (4) and (5) based on the local mean condition was proposed to detect problematic areas. The problematic intensity has a higher mean value typically compared to the global mean value. All problematic regions, especially the contrast variation and luminosity, were denoted by the black colour region. The problematic intensity was replaced with a new intensity based on the normalisation technique to normalise the area. This region was normalised and enhanced before performing the post-processing stage since this effect can influence the segmentation result performance.
The final conditions can be simplified as follows;
According to Eq. (6), only the intensity of the problematic region was changed and normalised. A new intensity based on the normalisation technique (Eq. (7)) replaced the original intensity on the specific area. The foreground (object) intensity and the border remained to keep the original information. Fig. 3 illustrates the original image and the output image after applying the three conditions. The original idea, namely ‘coin’, shows a terrible contrast problem. The histogram for each photo is displayed in Fig. 3. The histogram of the original image is illustrated, where a red circle marks the problematic region. The intensity in the complex area was replaced with a specific normalisation value.

Figure 3: The comparison result after applying the proposed method (a); the original ‘coin’ image, (b) histogram plot for original, (c); the enhanced ‘coin’ image (d); histogram plot after applying the HSE method
In the normalisation technique, the main goal is to correct the problematic intensity to produce a balanced contrast image. The threshold value k was obtained based on the Otsu method by dividing the image into two regions: background and problematic regions. The intensity of the background region remained unchanged, where only the inappropriate intensity was corrected using the proposed algorithm. Fig. 4 shows the histogram plotting to demonstrate the normalisation approach.
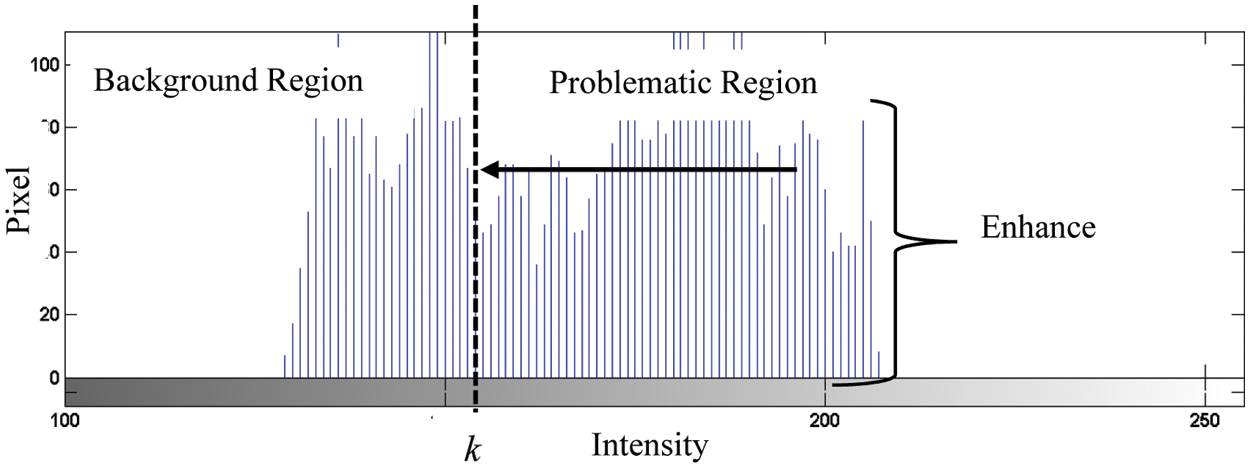
Figure 4: Normalisation technique on the problematic region
A few things need to be considered, such as the original intensity and the threshold value to propose a normalisation algorithm. The original intensity is crucial to retain the original information details of an image. Meanwhile, the optimal threshold value is needed as a boundary to separate background and problematic regions. According to Fig. 4, the disconcerting intensity was compressed until the k value. The suggested normalisation
where
In conclusion, if the intensity pixel is higher, it is set as the problematic region and below set as the background region. The problematic intensity was changed and normalised to improve the quality of the image. Based on this method, only the problematic region was corrected, and the original foreground (object) intensity was remained unchanged. The final equation to represent both conditions are denoted in Eq. (8)
where
In this experiment, 20 weld defect images were used [37]. A few images from the weld defect dataset used in this research are listed in Fig. 5. All images present a non-uniform intensity, noise and unbalanced brightness. Based on the observation, the foreground intensity is almost similar to the background intensity, which gives a challenging task in the segmentation process.
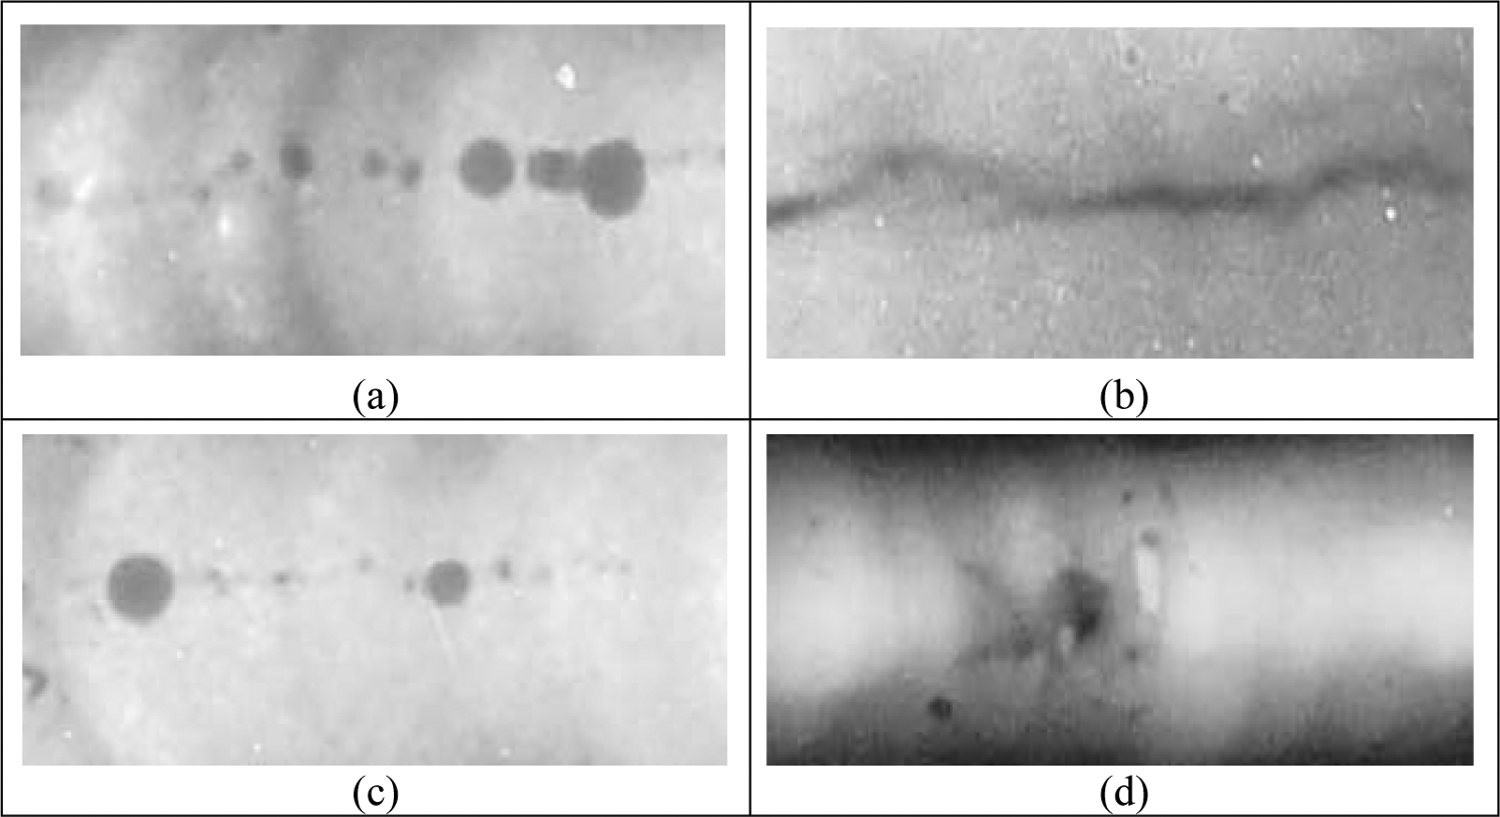
Figure 5: The weld defect images (a–d) were tested in this work
The HSE method was applied to 20 images. Fig. 6 illustrates the comparison between the original image and the resulting image after using the HSE method. The red circle mark in the histogram Fig. 6a shows the problematic region in the image's middle part. However, after performing the HSE method, the difficult area is normalised, as shown in Fig. 6b. Based on the histogram, the standard deviation also decreases from 28.190 to 15.644, indicating uniform intensity.
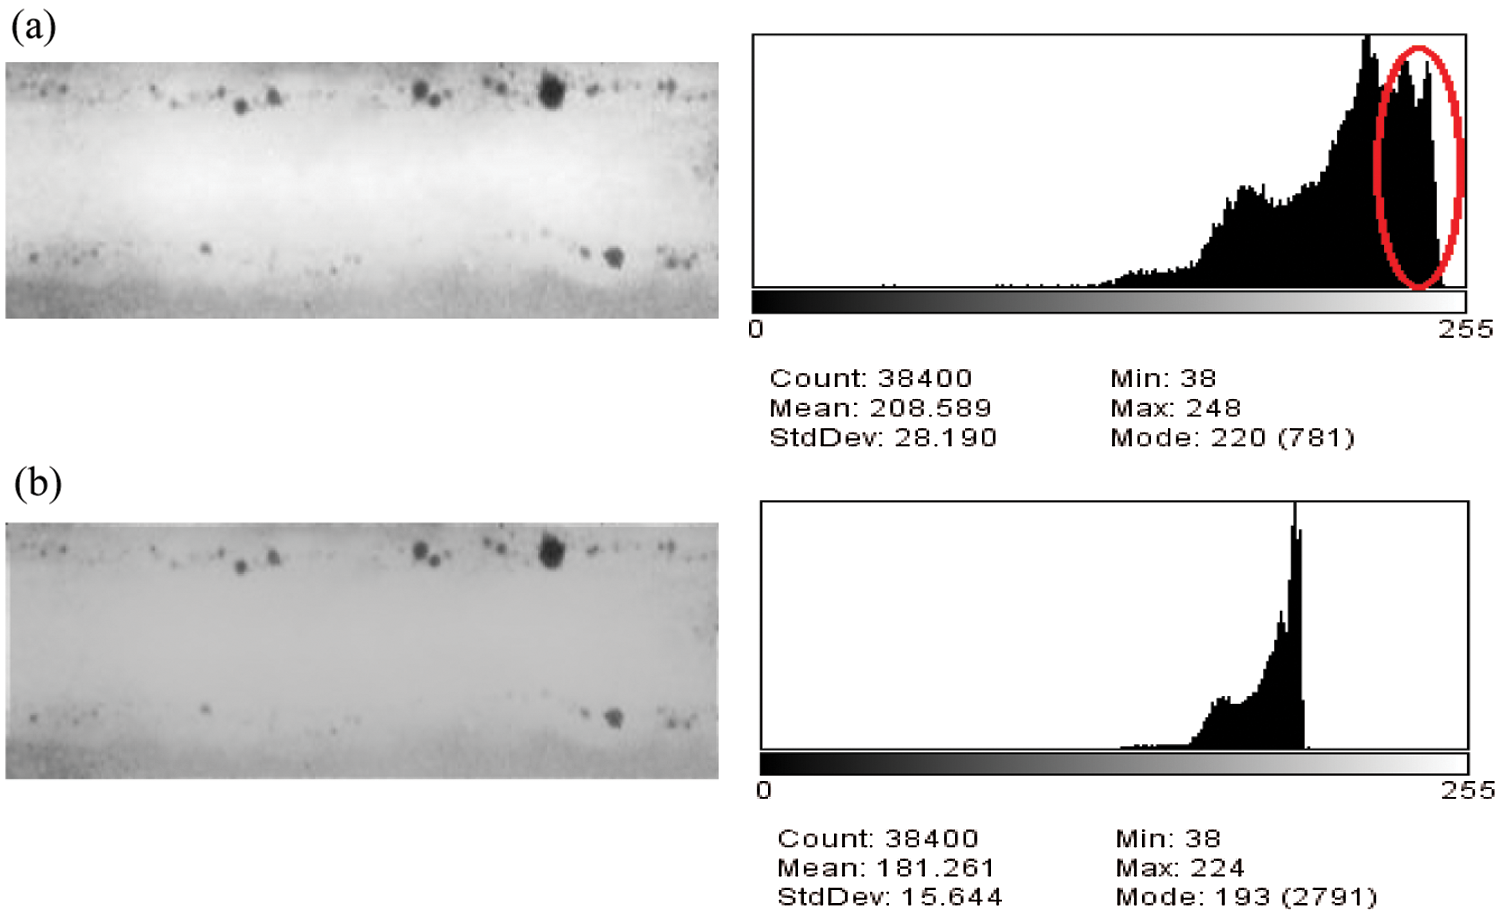
Figure 6: Weld defects image and histogram; (a) original and (b) after applying HSE method
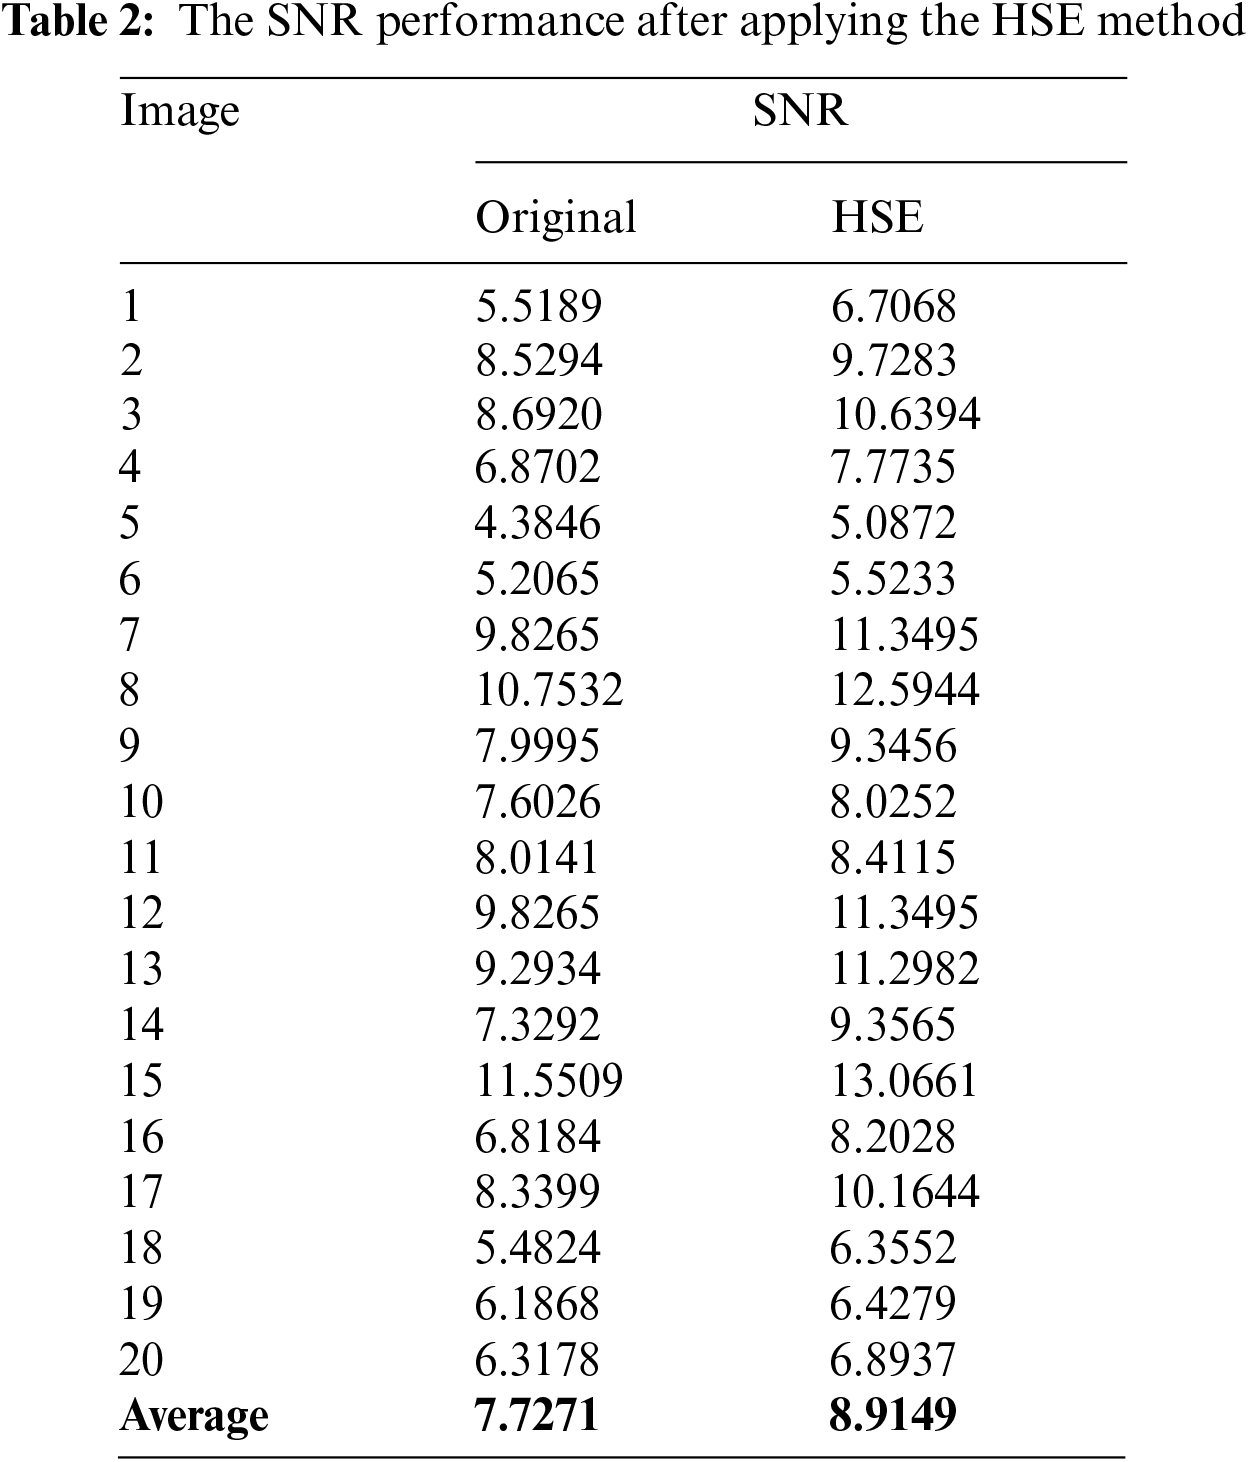
An image quality metric such as SNR helps assess the image quality after the pre-processing. Mathematically, it has been proven that higher SNR enhances the image and reduces the noise [38]. SNR is applied to the original image compared with the HSE image as they are on the same scale, as illustrated in Tab. 2. The performance of HSE is higher compared to the authentic images (original = 6.3178 and proposed = 6.8937). In substance, the performance of the HSE method enhanced the contrast variations in the picture after the correction technique. According to Tab. 2, all 20 images show an increment in SNR after applying the HSE method. The results showed that the average SNR of the images increased by 13.32% (from 7.7271 to 8.9149), producing uniform illumination. Obviously, the HSE-based method reduced the contrast and luminosity in the distorted images, creating balanced and uniform images while retaining a large amount of information.
In this experiment, the HSE method is compared with the DoG method [18] and Modified Homomorphic (MH) [19]. To evaluate the ability of the enhancement method to maintain the mean brightness, the AMBE and the standard deviation was used as the performance measurement. AMBE is defined as the absolute difference between the original and output mean. At the same time, standard deviation measures the optimal intensity to represent the relationship between initial intensity and mean value for the whole image. Generally, the low value of AMBE and standard deviation are required for good enhancement and better brightness preservation [39,40]. The comparison of a few resulting images is presented in Fig. 7. Based on the observation, HSE enhanced the picture in visual perception compared to DoG and MH methods. The background intensity was more uniform and smooth. The DoG and MH methods cause high image contrast with noise.
Tab. 3 compares three normalisation methods, namely the DoG, MH, and HSE methods. The highest value of AMBE indicates a poor performance in the case of contrast enhancement, as displayed by the MH method (AMBE = 31.1126) and DoG method (AMBE = 26.0324), respectively. However, the HSE method gave a lower value of AMBE (9.3563), which shows that the HSE method preserves the naturalness of the original defect image. Besides, comparisons based on standard deviation again show that the performance of the HSE method obtained 18.5880, which is lower than the other methods. The highest standard deviation value came from the DoG method (35.5984) since it produces a degraded and non-uniform image. In the case of the MH method, the standard deviation is 33.1033. Finally, this result indicates that the HSE method is effective and efficient in normalising and enhancing the illumination compared to DoG and MH methods.
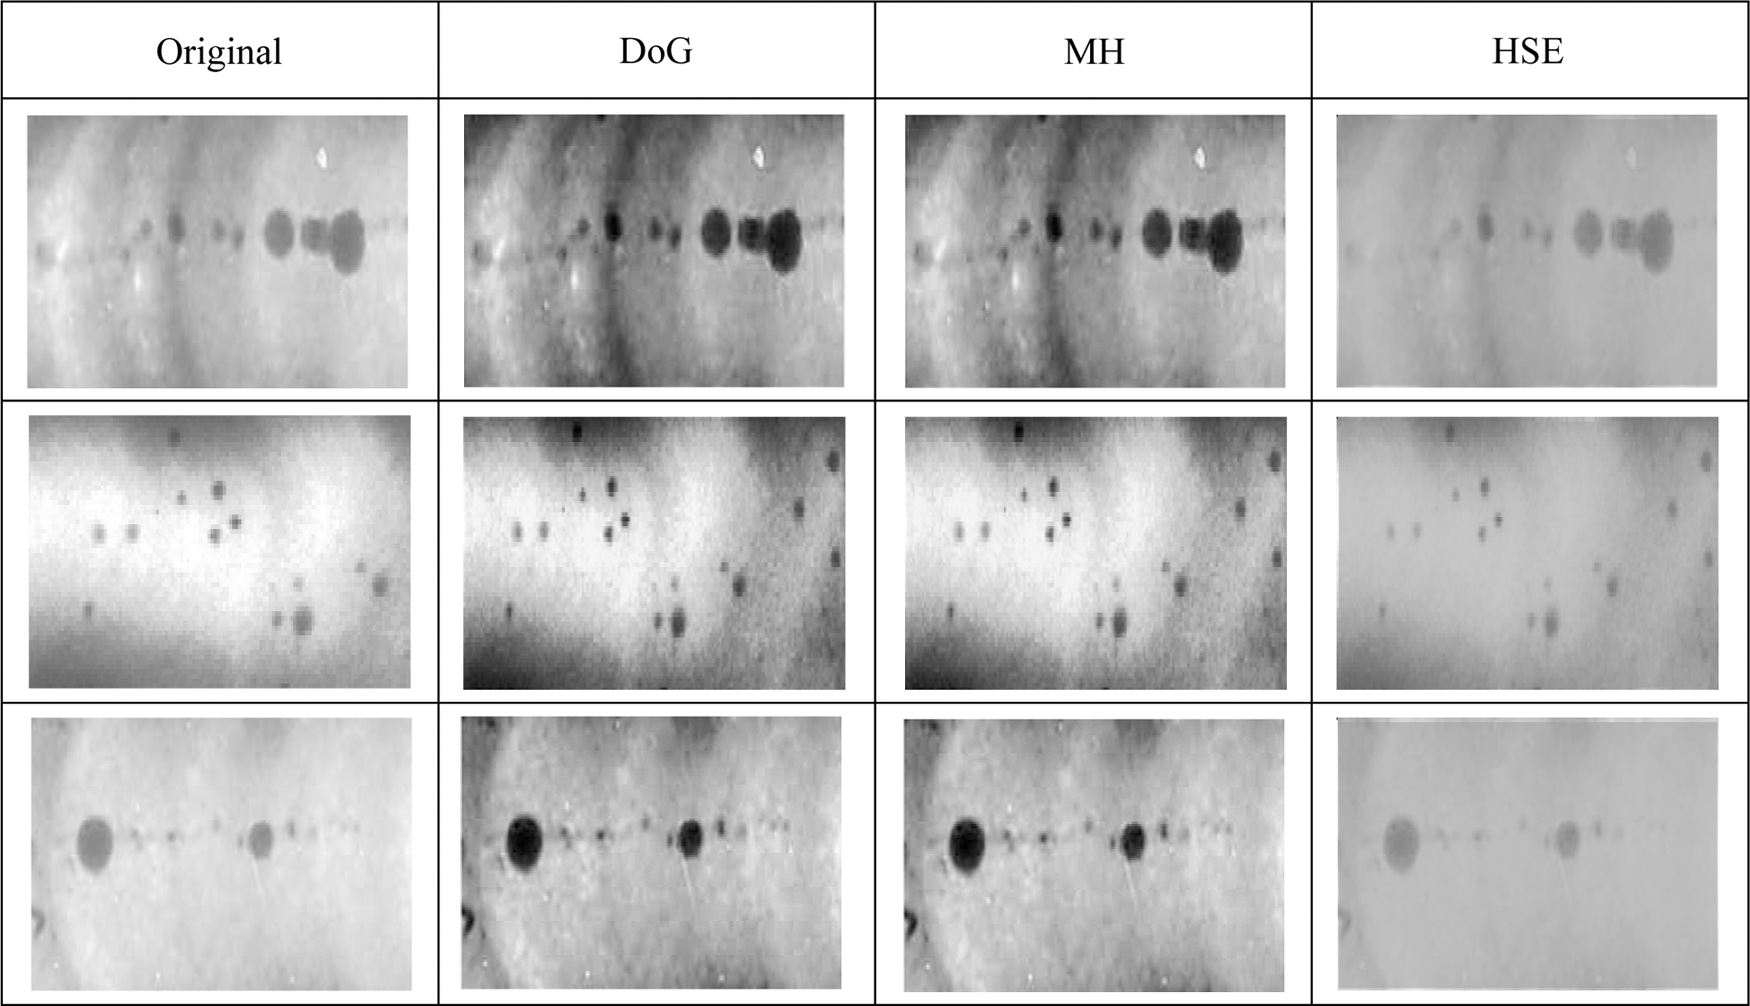
Figure 7: Comparison of resulting images based on different normalisation methods
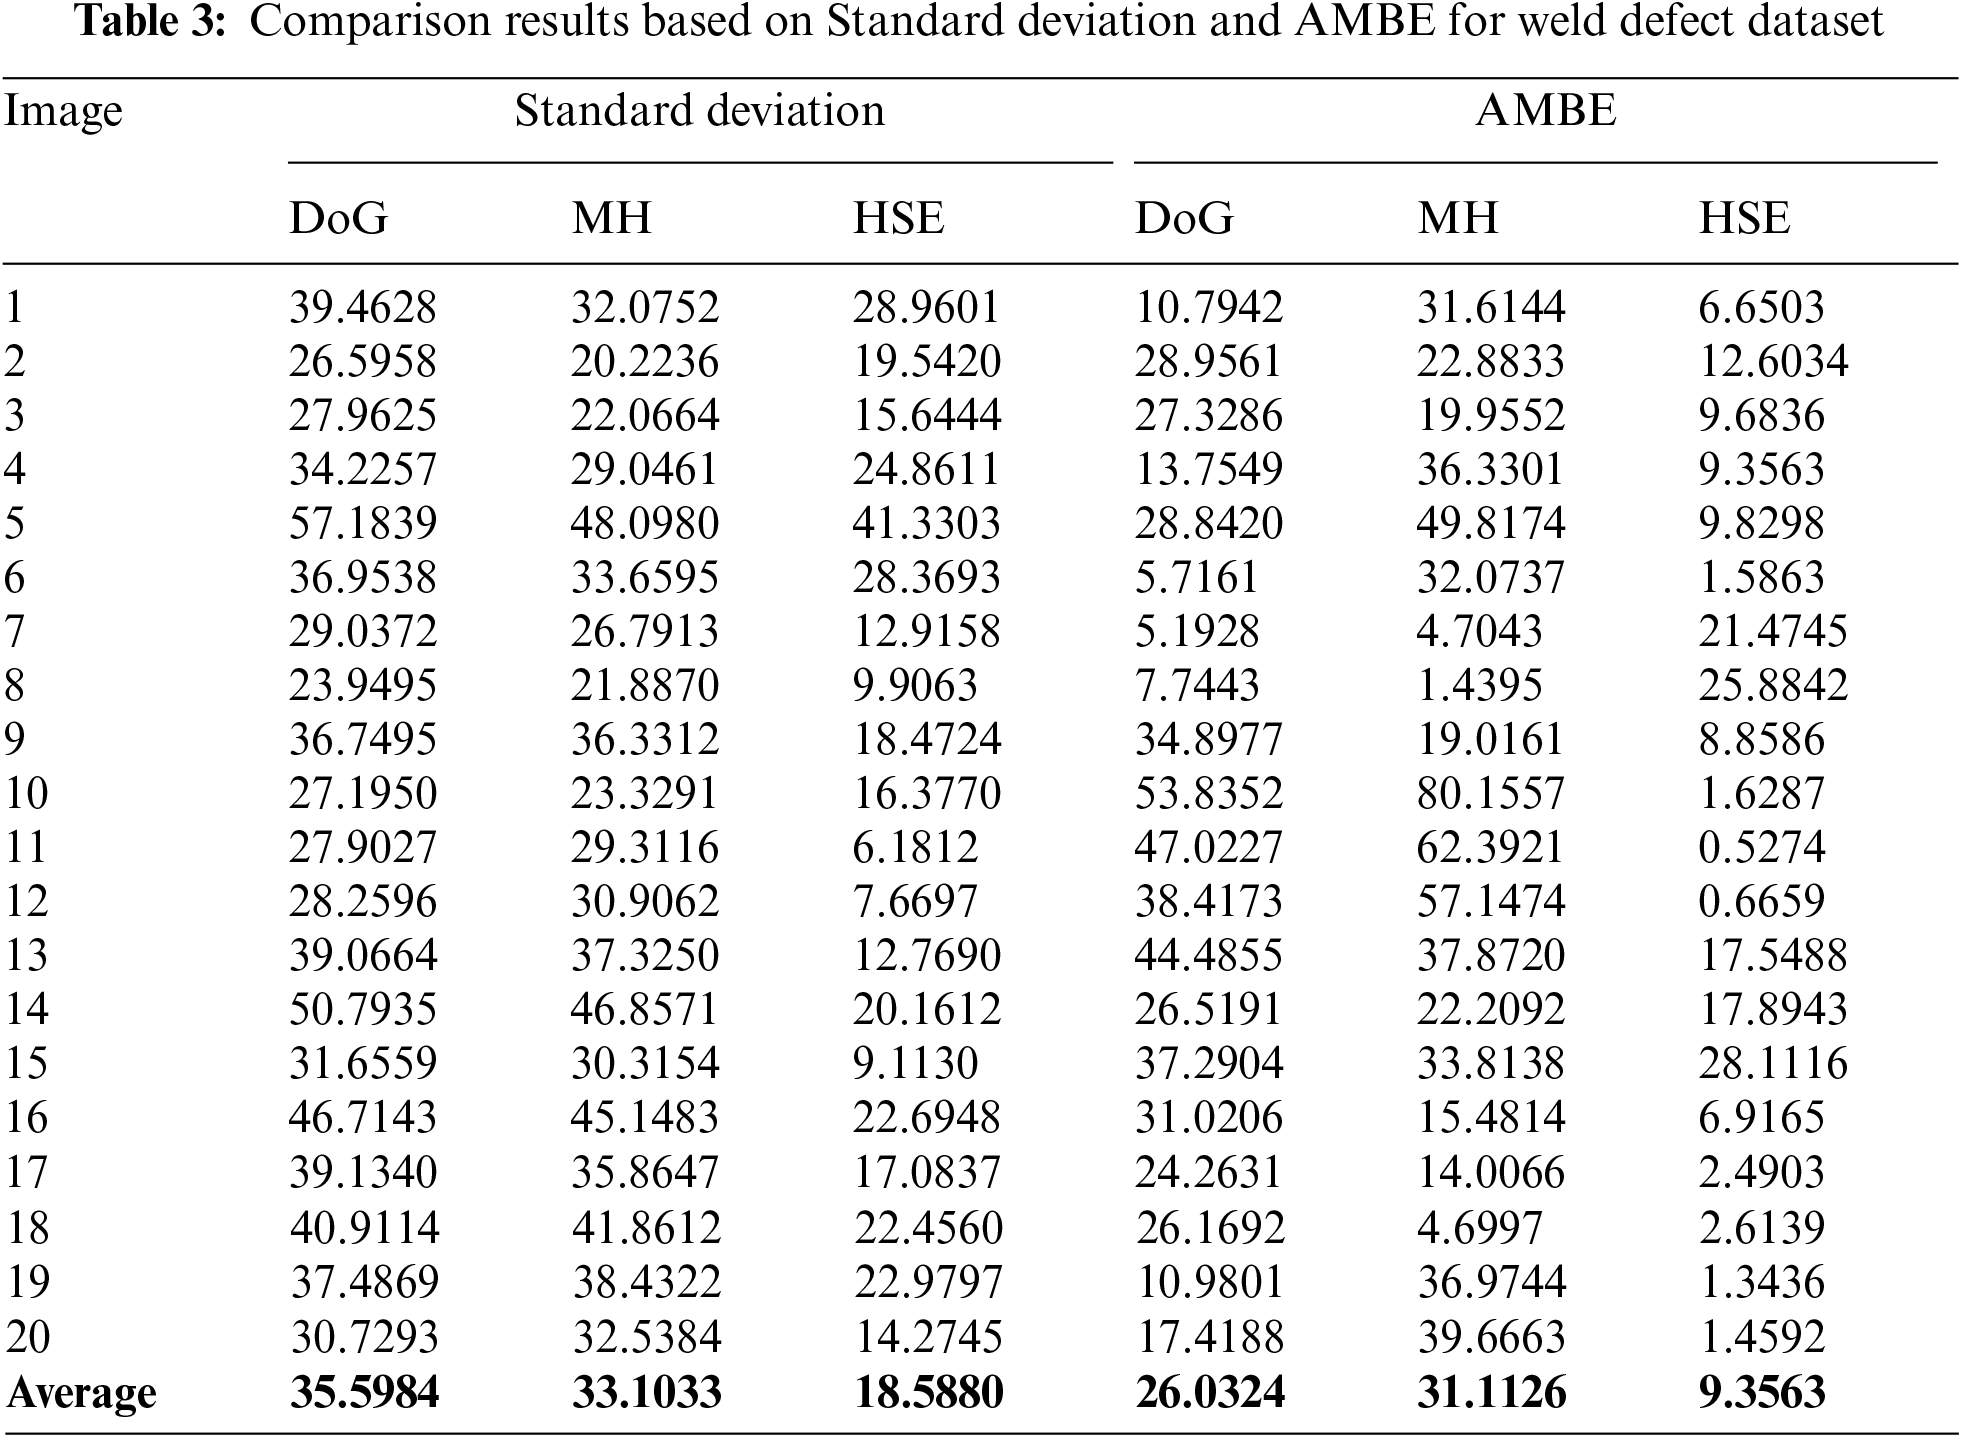
Image enhancement is one of the most important images processing issues in improving image quality. Generally, image enhancement can be divided into two categories: indirect methods and direct methods. In this study, a straightforward technique was implemented by detecting a specific region with luminosity and contrast problems by enhancing the intensity based on global and local information. The main objective is to normalise the problematic region (contrast & luminosity), which automatically improved the segmentation result. A new enhancement method was developed known as a Hybrid Statistical Enhancement (HSE) method. This technique utilised statistical parameters such as mean and standard deviation, dividing the original image into three groups: foreground, border, and problematic region (contrast & luminosity). The HSE method is used to enhance and reduce the effect of non-uniform illumination, proved by the increment (%) of the result. Finally, all the image quality assessments show an incremented result after using the enhanced images. The result of enhancement in SNR terms shows that the HSE method achieved the highest with 8.92 (weld defect dataset) compared to the other methods. A few normalisation methods were applied in this research for comparison purposes, such as Homomorphic Butterworth and DoG methods. Many types of quality assessments were utilised, such as SNR, AMBE, and standard deviation. All the results show that the HSE method successfully enhances the image and automatically improves the image quality compared to other normalisation methods. In the current work, the threshold information is provided by the Otsu threshold. They are chosen due to their simplicity and ease of use. The Otsu threshold value is used as a separation point between the object and the problematic region. In addition, the Otsu value is used in the normalisation process and the original intensity to replace the problematic intensity. However, in some cases, the detected threshold tend to produce undesired results. Literature reviews have indicated the effect of contrast and luminosity variation in the segmentation process. Although many researchers proposed an enhancement method, they only focused on contrast variation enhancement. Perhaps a better thresholding method can be tested to improve the results. In future, the proposed method can be applied to other types of the dataset, such as medical and satellite images.
Funding Statement: The authors received no specific funding for this study.
Conflicts of Interest: The authors declare that they have no conflict of interest to report regarding the present study.
1. R. C. Gonzalez and R. E. Woods, in Digital Image Processing, Prentice Hall, Upper Saddle River, NJ, USA, 2008. [Google Scholar]
2. S. Sharma, in Fundamentals of Digital Image Processing, S.K. Kataria & Sons, New Delhi, 2013. [Google Scholar]
3. W. A. Mustafa and H. Yazid, “Illumination and contrast correction strategy using bilateral filtering and binarization comparison,” Journal of Telecommunication, Electronic and Computer Engineering, vol. 8, no. 1, pp. 67–73, 2016. [Google Scholar]
4. W. A. Mustafa and H. Yazid, “Contrast and luminosity correction based on statistical region information,” Advanced Science Letters, vol. 23, no. 6, pp. 5383–5386, 2017. [Google Scholar]
5. W. A. Mustafa and M. M. M. A. Kader, “Contrast enhancement based on fusion method: A review,” Journal of Physics: Conference Series, vol. 1019, no. 012025, pp. 1–7, 2018. [Google Scholar]
6. V. a Kotkar and S. S. Gharde, “Review of various image contrast enhancement,” International Journal of Innovative Research in Science, Engineering and Technology, vol. 2, no. 7, pp. 2786–2793, 2013. [Google Scholar]
7. A. Saleem, A. Beghdadi and B. Boashash, “Image fusion-based contrast enhancement,” EURASIP Journal on Image and Video Processing, vol. 10, no. 1, pp. 1–17, 2012. [Google Scholar]
8. W. Azani Mustafa, H. Yazid, A. Alkhayyat, M. Aminudin Jamlos and H. A. Rahim, “Effect of direct statistical contrast enhancement technique on document image binarization,” Computers, Materials & Continua, vol. 70, no. 2, pp. 3549–3564, 2022. [Google Scholar]
9. R. Guo, H. Liu, G. Xie and Y. Zhang, “Weld defect detection from imbalanced radiographic images based on contrast enhancement conditional generative adversarial network and transfer learning,” IEEE Sensors Journal, vol. 21, no. 9, pp. 10844–10853, 2021. [Google Scholar]
10. M. Mirzapour, E. Yahaghi and A. Movafeghi, “The performance of three total variation based algorithms for enhancing the contrast of industrial radiography images,” Research in Nondestructive Evaluation, vol. 32, no. 1, pp. 10–23, 2021. [Google Scholar]
11. M. Malarvel and H. Singh, “An automatic assessment of histogram mode on x-radiography weld image using non-maxima suppression,” in Proc. of the 3rd Int. Conf. on Smart Systems and Inventive Technology, ICSSIT 2020, Tirunelveli, India, pp. 529–534, 2020. [Google Scholar]
12. Y. Chang, J. Gao, H. Jiang and Z. Wang, “A novel method of radiographic image enhancement based on phase symmetry,” Insight: Non-Destructive Testing and Condition Monitoring, vol. 61, no. 10, pp. 577–583, 2019. [Google Scholar]
13. E. Yahaghi and M. E. Hosseini-Ashrafi, “Comparison of the performance of three domain transform filters for radiographic contrast enhancement of welded objects,” Insight: Non-Destructive Testing and Condition Monitoring, vol. 62, no. 6, pp. 352–356, 2020. [Google Scholar]
14. E. Yahaghi, M. Mirzapour, A. Movafeghi and B. Rokrok, “Interlaced bilateral filtering and wavelet thresholding for flaw detection in the radiography of weldments,” European Physical Journal Plus, vol. 135, no. 1, pp. 1–10, 2020. [Google Scholar]
15. C. Dang, J. Gao, Z. Wang, F. Chen and Y. Xiao, “Multi-step radiographic image enhancement conforming to weld defect segmentation,” IET Image Processing, vol. 9, no. 11, pp. 943–950, 2015. [Google Scholar]
16. S. A. M. Saleh and H. Ibrahim, “Mathematical equations for homomorphic filtering in frequency domain: A literature survey,” in Int. Conf. on Information and Knowledge Management, Hawaii USA, vol. 45, pp. 74–77, 2012. [Google Scholar]
17. K. Delac, M. Grgic and T. Kos, “Sub-image homomorphic filtering technique for improving facial identification under difficult illumination conditions,” in Int. Conf. on Systems, Signals and Image Processing, Bratislava, Slovakia, pp. 95–98, 2006. [Google Scholar]
18. C. -N. Fan and F. -Y. Zhang, “Homomorphic filtering based illumination normalization method for face recognition,” Pattern Recognition Letters, vol. 32, no. 10, pp. 1468–1479, 2011. [Google Scholar]
19. H. Shahamat and A. A. Pouyan, “Face recognition under large illumination variations using homomorphic filtering in spatial domain,” Journal of Visual Communication and Image Representation, vol. 25, no. 5, pp. 970–977, 2014. [Google Scholar]
20. C. N. Fan and F. Y. Zhang, “Homomorphic filtering based illumination normalization method for face recognition,” Pattern Recognition Letters, vol. 32, pp. 1468–1479, 2011. [Google Scholar]
21. H. G. Adelmann, “Butterworth equations for homomorphic filtering of images,” Computers in Biology and Medicine, vol. 28, no. 2, pp. 169–81, 1998. [Google Scholar]
22. L. Xiao, C. Li, Z. Wu and T. Wang, “An enhancement method for X-ray image via fuzzy noise removal and homomorphic filtering,” Neurocomputing, vol. 195, pp. 56–64, 2016. [Google Scholar]
23. K. Hasikin and N. A. Mat Isa, “Adaptive fuzzy contrast factor enhancement technique for low contrast and nonuniform illumination images,” Signal, Image and Video Processing, vol. 8, no. 8, pp. 1591–1603, 2012. [Google Scholar]
24. S. Zhou, J. Wang, S. Zhang, Y. Liang and Y. Gong, “Active contour model based on local and global intensity information for medical image segmentation,” Neurocomputing, vol. 186, pp. 107–118, 2016. [Google Scholar]
25. J. Liu, X. Wang and M. Chen, “Illumination and contrast balancing for remote sensing images,” Remote Sensing, vol. 6, pp. 1102–1123, 2014. [Google Scholar]
26. M. A. Bakhshali, “Segmentation and enhancement of brain mr images using fuzzy clustering based on information theory,” Soft Computing, vol. 21, no. 22, pp. 1–8, 2016. [Google Scholar]
27. N. J. Dhinagar and M. Celenk, “Ultrasound medical image enhancement and segmentation using adaptive homomorphic filtering and histogram thresholding,” in Conf. on Biomedical Engineering and Sciences, Langkawi, Malaysia, pp. 349–353, 2012. [Google Scholar]
28. G. Schaefer, M. I. Rajab, M. Emre Celebi and H. Iyatomi, “Colour and contrast enhancement for improved skin lesion segmentation,” Computerized Medical Imaging and Graphics, vol. 35, no. 2, pp. 99–104, 2011. [Google Scholar]
29. M. Foracchia, E. Grisan and A. Ruggeri, “Luminosity and contrast normalization in retinal images,” Medical Image Analysis, vol. 9, pp. 179–190, 2005. [Google Scholar]
30. C. Ajmi, S. El Ferchichi, A. Zaafouri and K. Laabidi, “Automatic detection of weld defects based on hough transform,” in 2019 Int. Conf. on Signal, Control and Communication, SCC 2019, Hammamet, Tunisia, pp. 1–6, 2019. [Google Scholar]
31. R. Abdelkader, N. Ramou, M. Khorchef, N. Chetih and Y. Boutiche, “Segmentation of x-ray image for welding defects detection using an improved chan-vese model,” In Materials Today: Proceedings, vol. 42, no. 2, pp. 2963–2967, 2021. [Google Scholar]
32. S. N. A. M. Kanafiah, M. Y. Mashor, W. A. Mustafa and Z. Mohamed, “A novel contrast enhancement technique based on combination of local and global statistical data on malaria images,” Journal of Biomimetics, Biomaterials and Biomedical Engineering, vol. 38, pp. 23–30, 2018. [Google Scholar]
33. W. A. Mustafa and H. Yazid, “Image enhancement technique on contrast variation: A comprehensive review,” Journal of Telecommunication, Electronic and Computer Engineering, vol. 9, no. 3, pp. 199–204, 2017. [Google Scholar]
34. K. Saeed and M. Albakoor, “Region growing based segmentation algorithm for typewritten and handwritten text recognition,” Applied Soft Computing, vol. 9, no. 2, pp. 608–617, 2009. [Google Scholar]
35. J. Ruiz-del-Solar and J. Quinteros, “Illumination compensation and normalization in eigenspace-based face recognition: A comparative study of different pre-processing approaches,” Pattern Recognition Letters, vol. 29, pp. 1966–1979, 2008. [Google Scholar]
36. M. A. Bakhshali, “Segmentation and enhancement of brain mr images using fuzzy clustering based on information theory,” Soft Computing, vol. 20, pp. 1–8, 2016. [Google Scholar]
37. H. Yazid, H. Arof, H. Yazid, S. Ahmad, A. A. Mohamed and F. Ahmad, “Discontinuities detection in welded joints based on inverse surface thresholding,” NDT and E International, vol. 44, no. 7, pp. 563–570, 2011. [Google Scholar]
38. N. Gupta and R. Jha, “Enhancement of high dynamic range dark images using internal noise in dwt domain,” Communications in Computer and Information Science, vol. 276, pp. 66–74, 2013. [Google Scholar]
39. M. Sundaram, K. Ramar, N. Arumugam and G. Prabin, “Histogram modified local contrast enhancement for mammogram images,” Applied Soft Computing Journal, vol. 11, no. 8, pp. 5809–5816, 2011. [Google Scholar]
40. M. Moniruzzaman, M. Shafuzzaman and M. F. Hossain, “Brightness preserving bi-histogram equalization using edge pixels information,” in Int. Conf. on Electrical Information and Communication Technology (EICT), Khulna, Bangladesh, pp. 1–5, 2014. [Google Scholar]
 | This work is licensed under a Creative Commons Attribution 4.0 International License, which permits unrestricted use, distribution, and reproduction in any medium, provided the original work is properly cited. |