DOI:10.32604/cmc.2022.023316
| Computers, Materials & Continua DOI:10.32604/cmc.2022.023316 | |
| Article |
AMDnet: An Academic Misconduct Detection Method for Authors’ Behaviors
1Nanjing University of Information Science & Technology, Nanjing, 210044, China
2Engineering Research Center of Digital Forensics, Ministry of Education, Nanjing, 201144, China
3Nanjing University (Suzhou) High and New Technology Research Institute, Suzhou, 215123, China
4Jiangsu Union Technical Institute, Wuxi, 214145, China
5Department of Electrical and Computer Engineering, University of Windsor, ON, N9B 3P4, Canada
*Corresponding Author: Jin Han. Email: hjhaohj@126.com
Received: 03 September 2021; Accepted: 08 November 2021
Abstract: In recent years, academic misconduct has been frequently exposed by the media, with serious impacts on the academic community. Current research on academic misconduct focuses mainly on detecting plagiarism in article content through the application of character-based and non-text element detection techniques over the entirety of a manuscript. For the most part, these techniques can only detect cases of textual plagiarism, which means that potential culprits can easily avoid discovery through clever editing and alterations of text content. In this paper, we propose an academic misconduct detection method based on scholars’ submission behaviors. The model can effectively capture the atypical behavioral approach and operation of the author. As such, it is able to detect various types of misconduct, thereby improving the accuracy of detection when combined with a text content analysis. The model learns by forming a dual network group that processes text features and user behavior features to detect potential academic misconduct. First, the effect of scholars’ behavioral features on the model are considered and analyzed. Second, the Synthetic Minority Oversampling Technique (SMOTE) is applied to address the problem of imbalanced samples of positive and negative classes among contributing scholars. Finally, the text features of the papers are combined with the scholars’ behavioral data to improve recognition precision. Experimental results on the imbalanced dataset demonstrate that our model has a highly satisfactory performance in terms of accuracy and recall.
Keywords: Academic misconduct; neural network; imbalanced dataset
In the last few years, scientific research around the world has shown an increasingly open position, as the emergence of excellent academic papers has contributed positively to social development. However, due to the low-risk and high-profit incentives of academic misconduct, an increasing number of violations of academic regulations are being frequently exposed, raising heightened attention from governments and the public. As cited in [1], the Office of Science and Technology Policy of the United States defines academic misconduct as “the fabrication, tampering with, or plagiarizing when recommending, conducting, or reporting research, or when seriously deviating from the accepted rules of the scientific community, excluding honest errors or discrepancies in data interpretation or assessment.” This definition has been universally recognized and accepted by scholars. In May 2019, the China Press and Publication Administration issued the “Academic Publishing Standards: Definition of Academic Misconduct in Journals” [2]. This standard provides a detailed classification and definition of many different forms of academic misconduct, further regulating academic production activities.
Despite these regulations, many studies have found that academic misconduct is still on the rise. Since 1975, the number of papers withdrawn due to some kind of misconduct has increased by nearly 10 times as a percentage of published articles. Grieneisen et al. [3] analyzed databases of multiple disciplines and collected 4449 retracted articles in 4 disciplines. Their research confirmed that the trend of withdrawals is on the rise, with most withdrawals due to misconduct. Although the number of retracted articles still accounts for a small proportion of the total number of publications, many researchers believe that the current academic frauds are only the tip of the iceberg. Therefore, how to prevent and detect academic misconduct in time has become an increasingly important topic.
Fig. 1 depicts the number of article retractions in different countries counted on Retraction Watch from 2015 to 2020. It can be observed that although most of the 9 countries have experienced a decline in the number of retracted manuscripts during these five years, the overall number of manuscripts withdrawn is still on the rise. 2020 is a special year as the outbreak of Corona Virus Disease 2019 (COVID-19) may be the main reason for the decline. While papers related to COVID-19 have increased, such as the telemedicine system proposed by Abdulkareem et al. [4] and the use of machine learning models to predict confirmed cases by Antor et al. [5], the overall trend is still a decline in 2020.
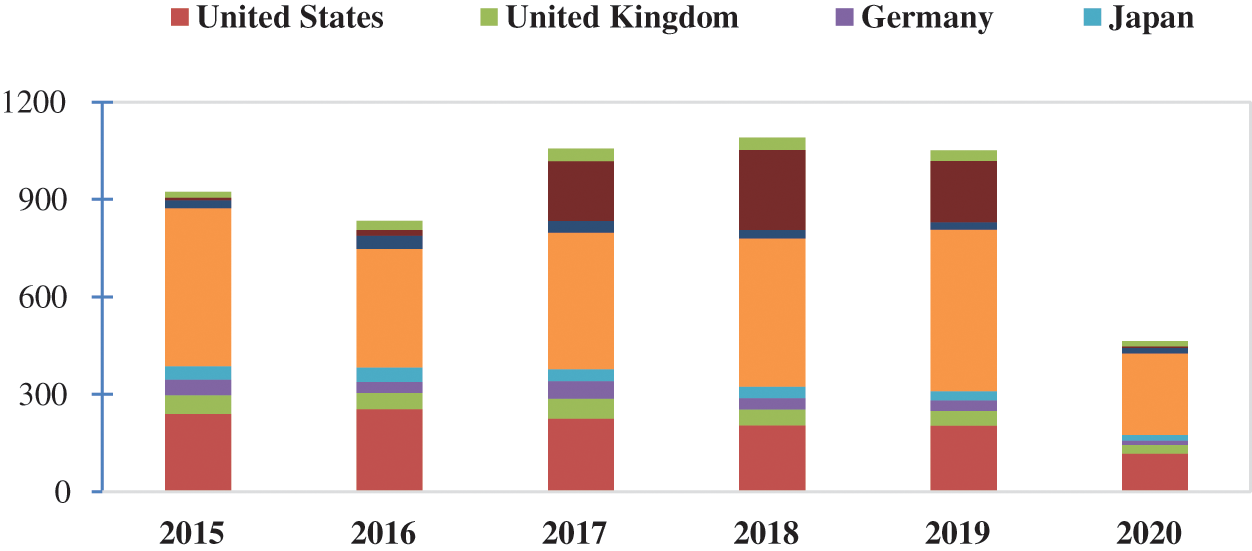
Figure 1: Trends of paper withdrawals on Retraction Watch in different countries from 2015 to 2020
The current mainstream techniques in character-based or non-text element detection only consider the content of papers, and can only detect cases of a single plagiarism type. At the same time, these methods cannot examine dynamic features from the outside. In this paper, academic misconduct is captured not only through paper content, but also through the user's external behavior. The model learns by forming a dual network group that processes text features and user behavior features to detect potential academic misconduct. This method is proven experimentally to improve accuracy and recall, and the model's performance is further improved after combining text features.
In summary, this study proposes an academic misconduct detection network (AMDnet) which includes the following innovative features:
1) The academic misconduct detection method adopts a fusion model combining user behaviors and text content, in which the user behavior module captures abnormal operations and the text content analysis module calculates the probability of paper plagiarism. The proposed model overcomes the limitation that only a single plagiarism type can be detected.
2) For the first time, we use real submission data for testing, and filter a large amount of data to obtain effective learning features.
3) The AMDnet framework learns the representation of cross-domain features by employing a network group.
The rest of this article is structured as follows: Chapter 2 introduces past work on detecting academic misconduct; Chapter 3 presents a neural network algorithm for detecting academic misconduct; Chapter 4 describes the processing and experimental scheme of the dataset, and Chapter 5 evaluates the model's performance and experimental results. Chapter 6 draws a conclusion.
Analyzing data from the Retraction Watch Database, Wu et al. [6] found that the number of papers retracted due to plagiarism accounted for the majority, reaching nearly 61%. Hence, the research on plagiarism, one type of academic misconduct, has been occupying the mainstream, while the discovery and detection of other types of academic misconduct have mainly occurred through human experience.
As shown in Fig. 2, from a technical perspective, plagiarism detection techniques are classified into two main categories: external plagiarism detection and internal plagiarism detection. External plagiarism detection methods compare suspicious documents with a collection of documents assumed to be genuine (reference collection), and retrieve all documents showing similarities that exceed a threshold as potential sources [7]. Generally speaking, the collection of suspicious documents using this method is usually very large. It is computationally unfeasible to compare the input article with all the documents in the collection. To improve detection efficiency, most external plagiarism detection methods are divided into two stages: candidate retrieval and detailed analysis [8]. The main task of the selective retrieval stage is to retrieve documents that share content with the input from the suspicious documents so as to reduce the amount of calculation in the next stage. In the detailed analysis stage, a careful document comparison is completed to identify parts of the input document that are similar to the source document.
The concept of internal plagiarism detection was first proposed by Eissen et al. [9]. This method assumes that each author has their own writing style and uses this to identify articles by different authors. The internal plagiarism detection method includes two tasks [10]: style vulnerability detection, which detects paragraphs with different styles; and author identification, which identifies the author of a document or paragraph. The main difference between internal plagiarism detection and external plagiarism detection is that the internal method does not require any reference documents.
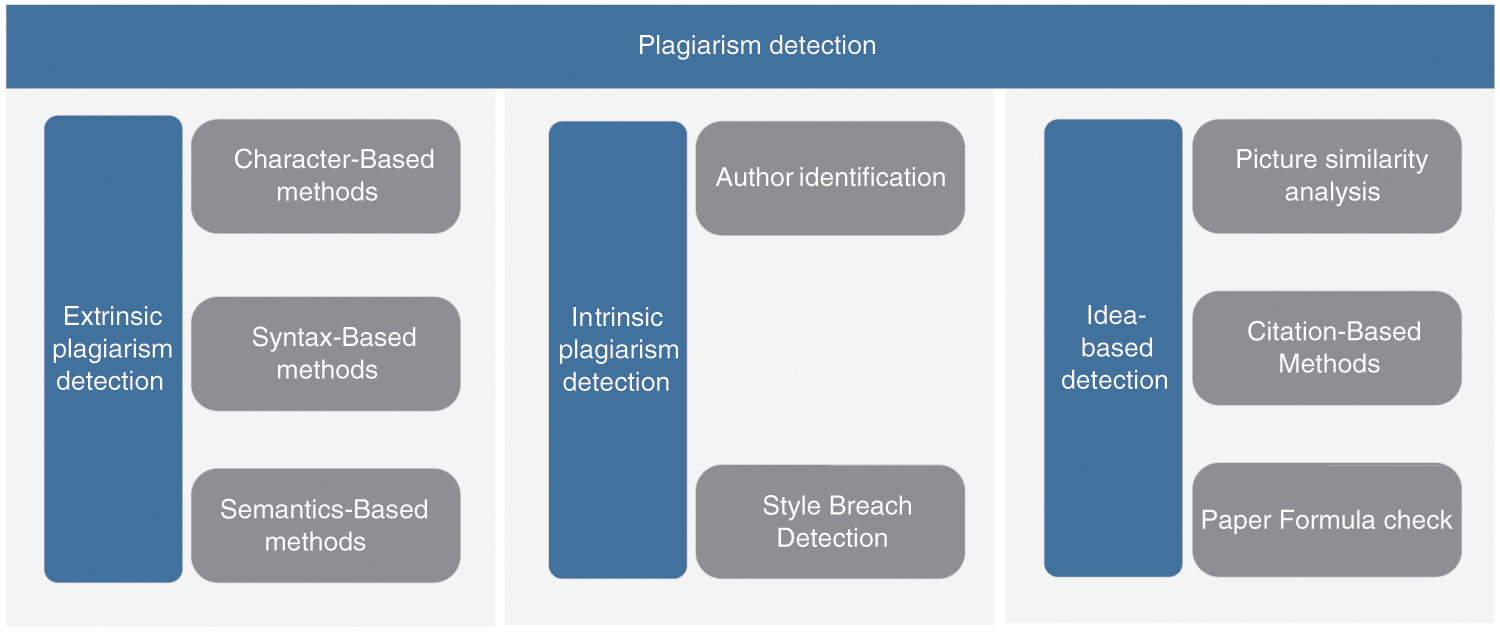
Figure 2: Plagiarism detection technology classification system
In the past few decades, scholars have proposed many specific detection techniques to realize external or internal plagiarism detection. Character-based detection technology is a frequently used technology, most suitable for identifying copy and paste. Grozea et al. [11] used 16-gram to match the similarity of 16 consecutive entity sequences and to detect similar content. Tschuggnall et al. [12] detect suspicious places in a text document by analyzing the grammar of the sentences. Elhadi et al. [13] use syntactic location tags to represent text structure and as the basis for analysis, in which documents containing the same location tag features are used to identify the source of plagiarism. The semantic-based detection method is currently more important. This method can find the relevance between words and words, sentences and sentences, and paragraphs and paragraphs, so as to detect the similarity of papers at the semantic level, thereby improving the accuracy of detection. AlSallal et al. [14] proposed a new weighting method and used Latent Semantic Analysis (LSA) as the style feature for internal plagiarism detection. Resnik et al. [15] used the WordNet model to calculate semantic similarity. Salvador et al. [16] improved the weighting process by using skip-grams, and then applied graph similarity measures to generate semantic similarity scores for documents.
All of the above detection and recognition methods are based on analyses of the text content. Foltýnek et al. [17] called the technology of analyzing non-text elements to identify academic misconduct as idea-based methods. This type of method is an important supplement and expansion of text-based analysis methods, and enriches the technical ideas for detecting various types of academic misconduct. Gipp et al. [18] proposed citation-based plagiarism detection and analyzed the citation patterns in academic literature, checking, for instance, whether the same citations appear in a similar order in two documents. Meuschke et al. [19] proposed a detection method based on mathematical expressions, and through experiments showed that mathematical expressions are effective features independent of the text. Acuna et al. [20] analyzed the graphic elements in the literature, and used image similarity detection algorithms to find a large number of image reuse and plagiarisms.
Current research focuses mainly on the detection of plagiarism-type academic misconduct. Systematic research on other types of misconduct is insufficient. However, research has been carried out on the detection of various abnormal user behaviors in social networks, such as building neural network models to detect deceptive comments [21], and detecting malicious social bots through graph networks [22]. Taking those approaches into account, this paper analyzes user information and behavior data in the Tech Science Press (TSP) online submission system, and finds that some users display repeated submissions, one-site multiple submissions, and other problems. Thus, we propose an academic misconduct user classification model. This research method provides a new idea for academic misconduct detection and further supplements idea-based methods.
The main purpose of this paper is to identify scholars who have a high probability of academic misconduct by building a neural network that can analyze scholars’ non-text behavioral data. The classification model for academic misconduct has three main tasks: data preprocessing, in which behavioral data and text data are processed respectively; data sampling, which samples imbalanced and unevenly distributed data to improve classification accuracy; and result output, where the final result is calculated by a multilayer perceptron. The flow chart of the model is shown in Fig. 3.
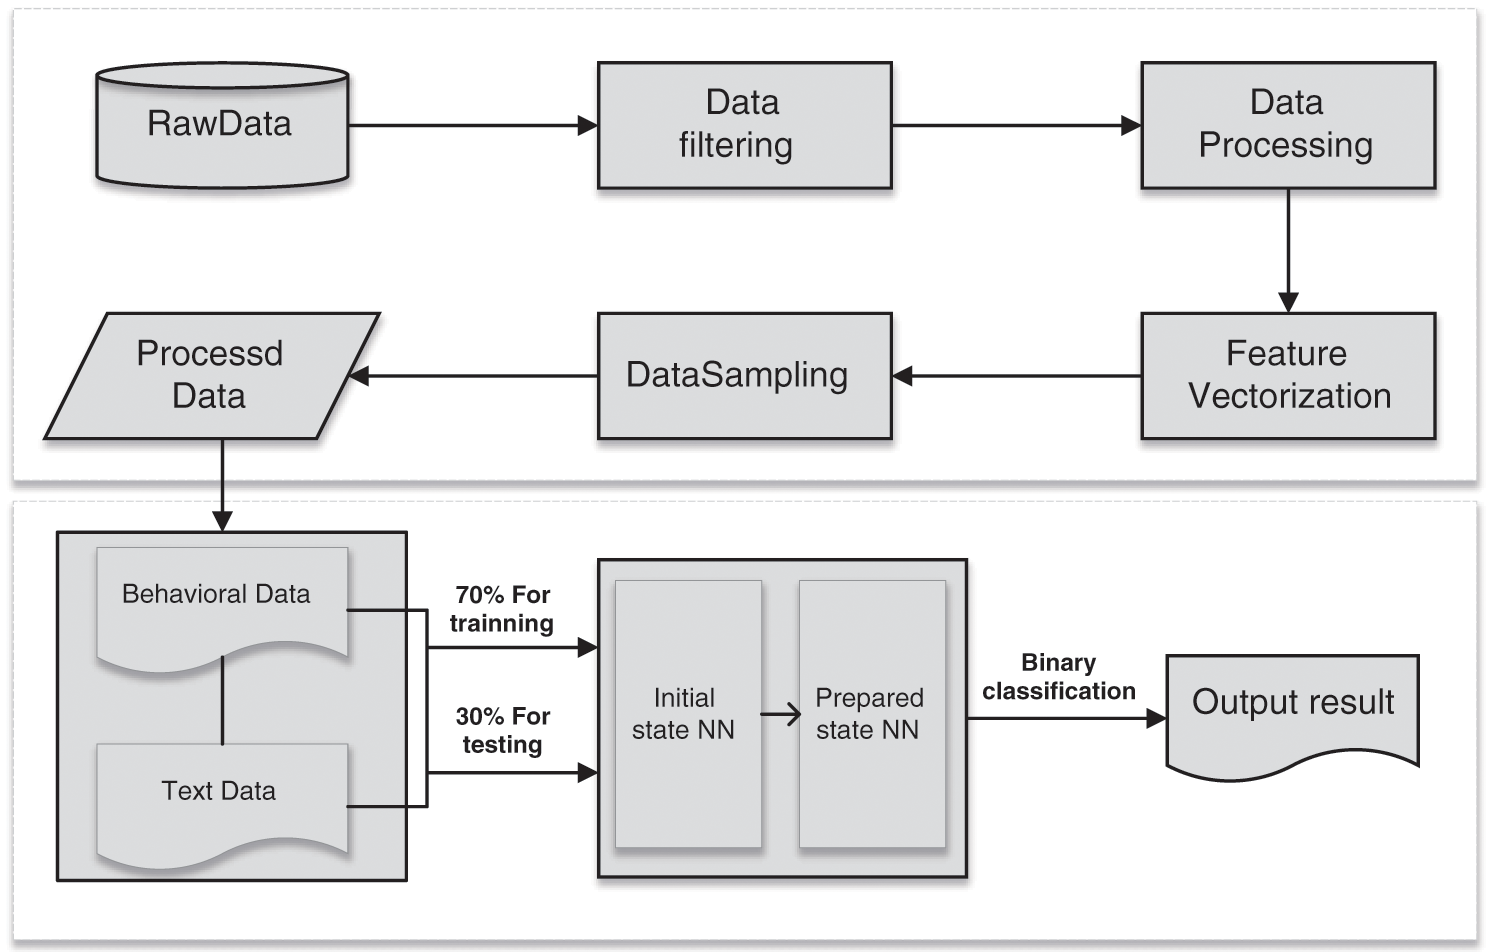
Figure 3: Flowchart of the author classification model for academic misconduct
The small proportion of true misconduct among all scholar users means that the data we use for experiments is an imbalanced dataset, which is reflected in a 1:13 ratio of positive to negative cases (see Section 4.1 below). The disparity between the positive class sample size and the negative class sample size will affect the performance of the classifier model to some extent, so it is necessary to use resampling techniques to overcome this problem.
The random oversampling technique is a method of increasing the number of minority class samples. SMOTE [23] is an improved method of random oversampling. We use this technique to enrich our positive class sample instead of simply replicating it. The data processing flow is as follows.
• Calculation of the K nearest neighbors of each minority sample
First, set the oversampling magnification to determine the number of synthesized samples, then select a sample X arbitrarily from the positive sample set, calculate the distance from this sample to all other positive samples by Euclidean distance, and then sort the distance from smallest to largest to obtain the top K nearest neighbors to sample X. Here, K is a hyperparameter.
• Linear interpolation
For each positive sample X, randomly select M samples from its K nearest neighbors, then interpolate on the straight line between X and the M samples respectively; that is, a new sample is synthesized at any point on the line. The interpolation formula is as follows:
Here,
• Generation of new dataset
The positive samples generated by simulating a few samples are not copies of the original samples, but can be regarded as new samples similar in feature space, and we merge the original positive samples with the new samples to form a new positive class sample set. The ratio of positive and negative samples is expanded from the original 1:13 to 1:1.
The proposed model needs to process two different types of data, so a neural network model based on word vectors and a multilayer perceptron is used to build the whole framework. The initial word vector is converted by the Word2vec model into a low-dimensional vector for subsequent semantic analysis. The multilayer perceptron takes the computed text data and the preprocessed behavioral data as input and obtains the output vector through multilayered neural units. The overall structure of the model is shown in Fig. 4.
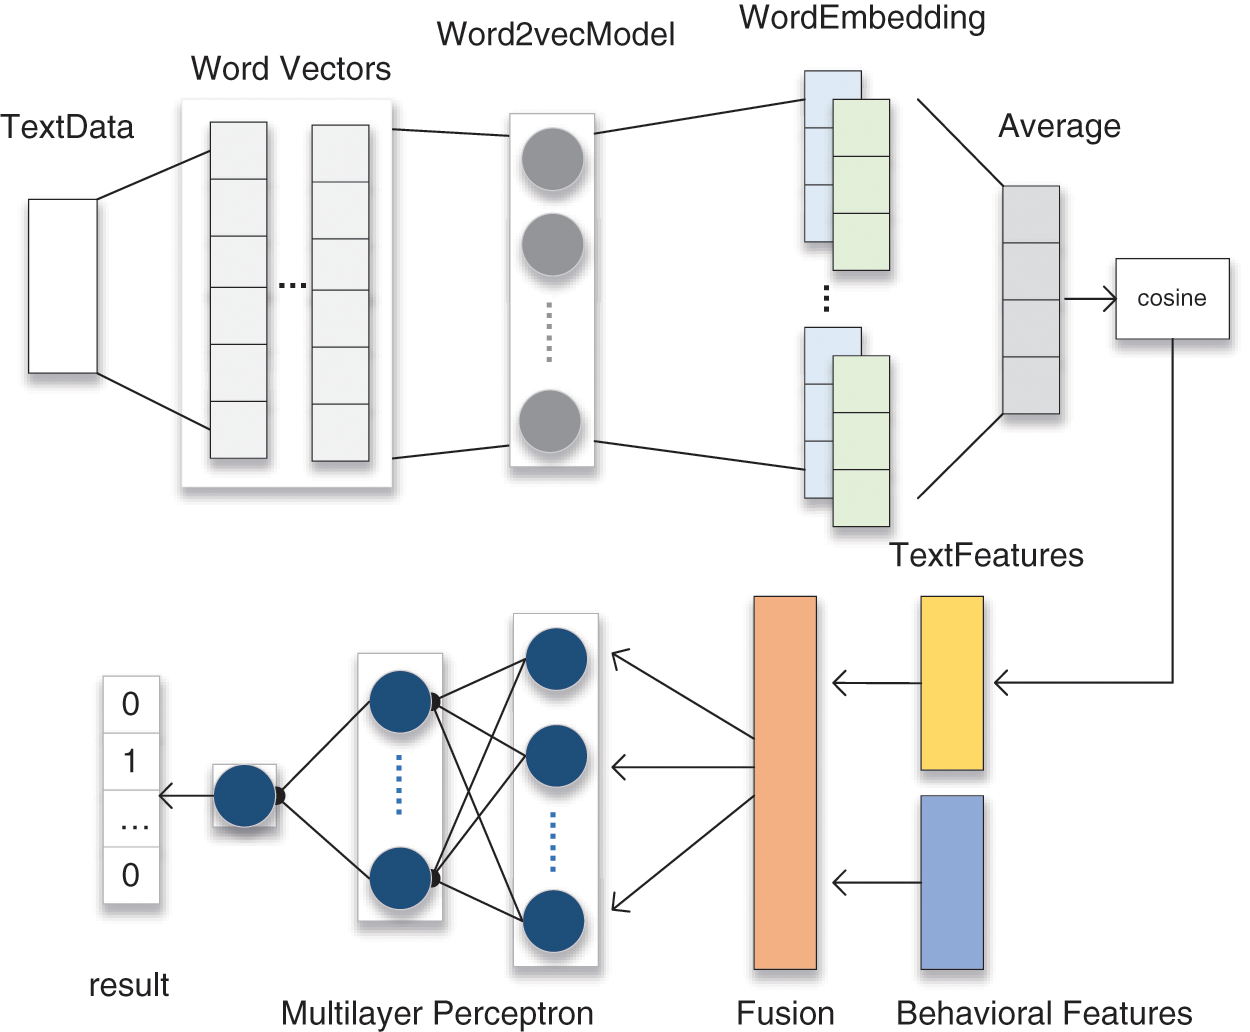
Figure 4: Neural network framework combining scholar behavior and text features
3.2.1 Word Vector Model Module
In observing and analyzing the dataset, we found that some academic users usually modify the title and abstract of the paper to ‘skin the paper’ for the purpose of misconduct. The related findings are as follows:
1) Authors will submit similar papers to different journals or sections repeatedly to get a higher probability of acceptance. Generally, these papers have previously been rejected by editors for publication.
2) Authors sometimes submit a slightly revised paper to a different journal or section as a completely new paper in order to deceive editors.
In response to these phenomena, we decided to use the text data from the authors’ submissions for analysis. By calculating the semantic similarity of the text data and analyzing the repetition ratio, similar papers can be identified quickly. The hierarchical structure of the model based on word vectors is shown in Fig. 5.
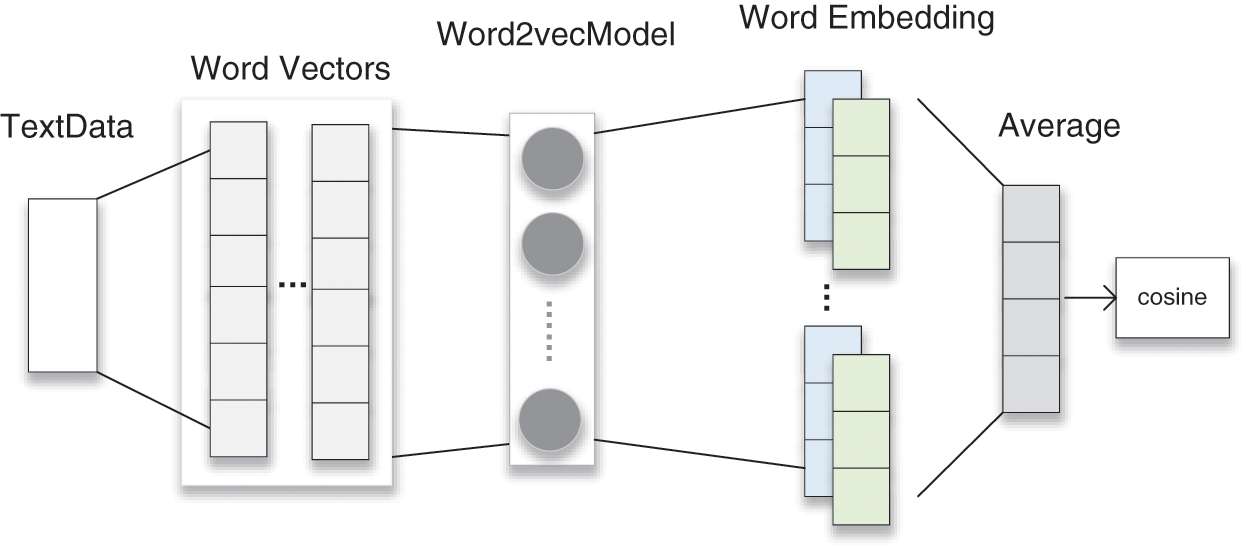
Figure 5: Hierarchy of text semantic analysis module
First, paper titles and abstracts are stored in pairs and processed for the status of the component words in the data preprocessing stage; they are then fed into the model as input. Subsequently, each word is weighted with Term Frequency–Inverse Document Frequency (TF-IDF) weights so that keywords in the text are given different levels of attention to improve the similarity matching accuracy. The word vectors with weights are then fed into the pre-trained Word2vec model. Participles are then mapped by the Word2vec model into another low-dimensional word vector space and are represented by a set of new vectors. In this space, the distance between words with similar semantics becomes shorter, whereas the distance between words with more distant relationships becomes longer, which produces a natural clustering effect. Finally, we average the word embedding vectors of each word segmentation to obtain the representation of the entire text in vector space, and then use the cosine formula to calculate the cosine of the angle between the vectors to obtain the similarity between the texts.
3.2.2 Multilayer Perceptron Module
This paper introduces the innovation of using data on scholars’ submission behavior to assess the probability of misconduct, and to construct a multilayered neural network which performs calculations on two different kinds of data to classify scholars. The processing in Sections 3.2.1 produce data coded into a computable form for the neural network. Two kinds of data are combined through the aggregation layer to generate the final input set, and the output vector is finally returned after the multilayer perceptron calculation. The structure of the neural network model incorporating multiple features is shown in Fig. 6.
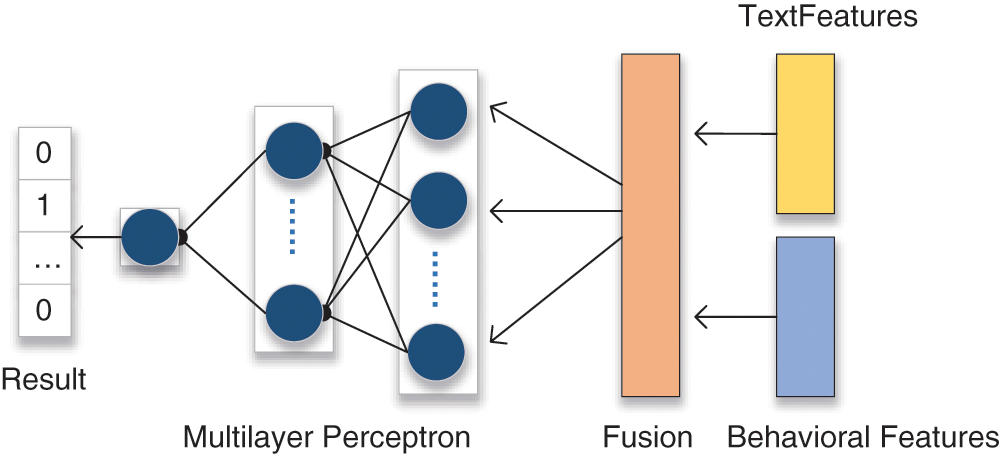
Figure 6: Hierarchy of neural network fused with multiple features
The multilayer perceptron network consists of three layers. The first layer is the input layer and is composed of six neural units. Each neuron processes different feature data, such as the number of submissions, the frequency of submissions, and title similarity. After testing, five neurons are set in the hidden layer. Too many neurons will trigger the possibility of overfitting, while too few neurons will lead to a decrease in prediction accuracy. To keep the weights updated continuously and to accelerate the convergence, we use a Parametric Rectified Linear Unit (PReLU) [24] as the activation function in this layer. The specific formula is as follows.
For the binary classification problem, only one output unit needs to be set in the output layer of the neural network. The SoftMax activation function is then used to obtain the output vector.
In this section, we present the details of experiments and propose different experimental schemes based on the experimental data. Experimental results are then analyzed and discussed.
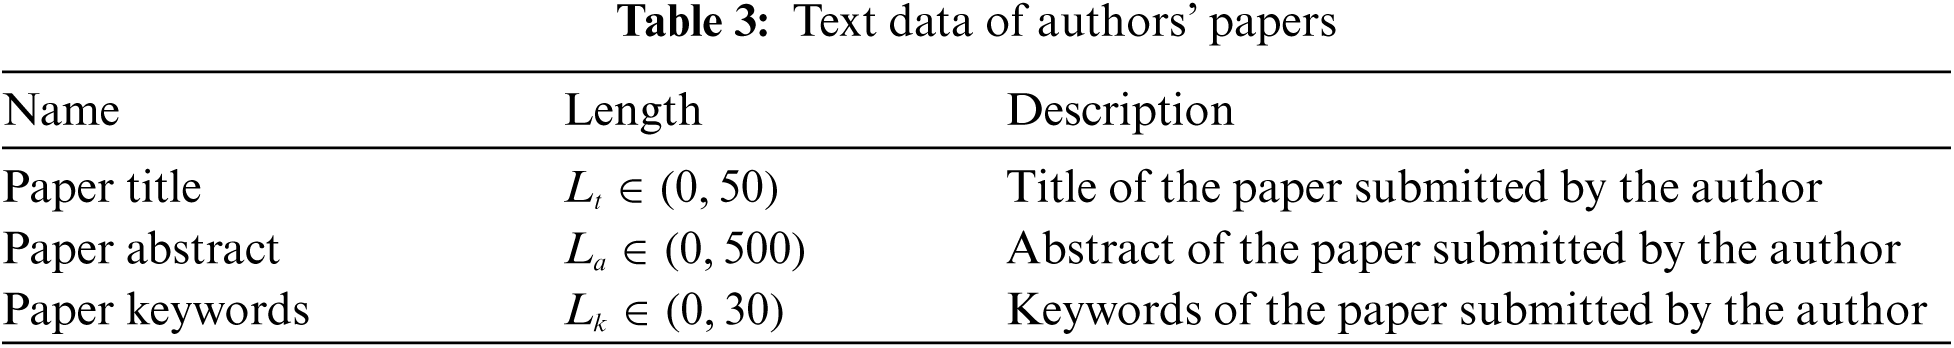
The relevant parameters of the model in this study were finally determined after many tests. The parameters stipulate that the length of the paper title shall be calculated by the number of words, the length of the title shall not exceed 50, the abstract shall not exceed 500, and the keywords shall not exceed 30. To facilitate calculations, the difference between paper numbers is used as a measure of the interval between paper submissions. The activation function of the hidden layer in the neural network is set as the PReLU function, and the activation function of the output layer is set as the SoftMax function. The model is used with the Adam optimizer [25], which sets the learning rate to 0.01, the batch size to 200, and the epoch count to 100.
The experimental data in this study come from the submission system used by TSP, a publisher with which we cooperate. While the publisher publishes a large number of academic papers every year, it has also found many malicious submissions, such as multiple submissions and duplicate submissions. We collected a series of 25,238 items of behavioral data, basic information on scholars, and summary data of papers from 1,823 users from 2020 to 2021, including paper titles and submission behavior data.
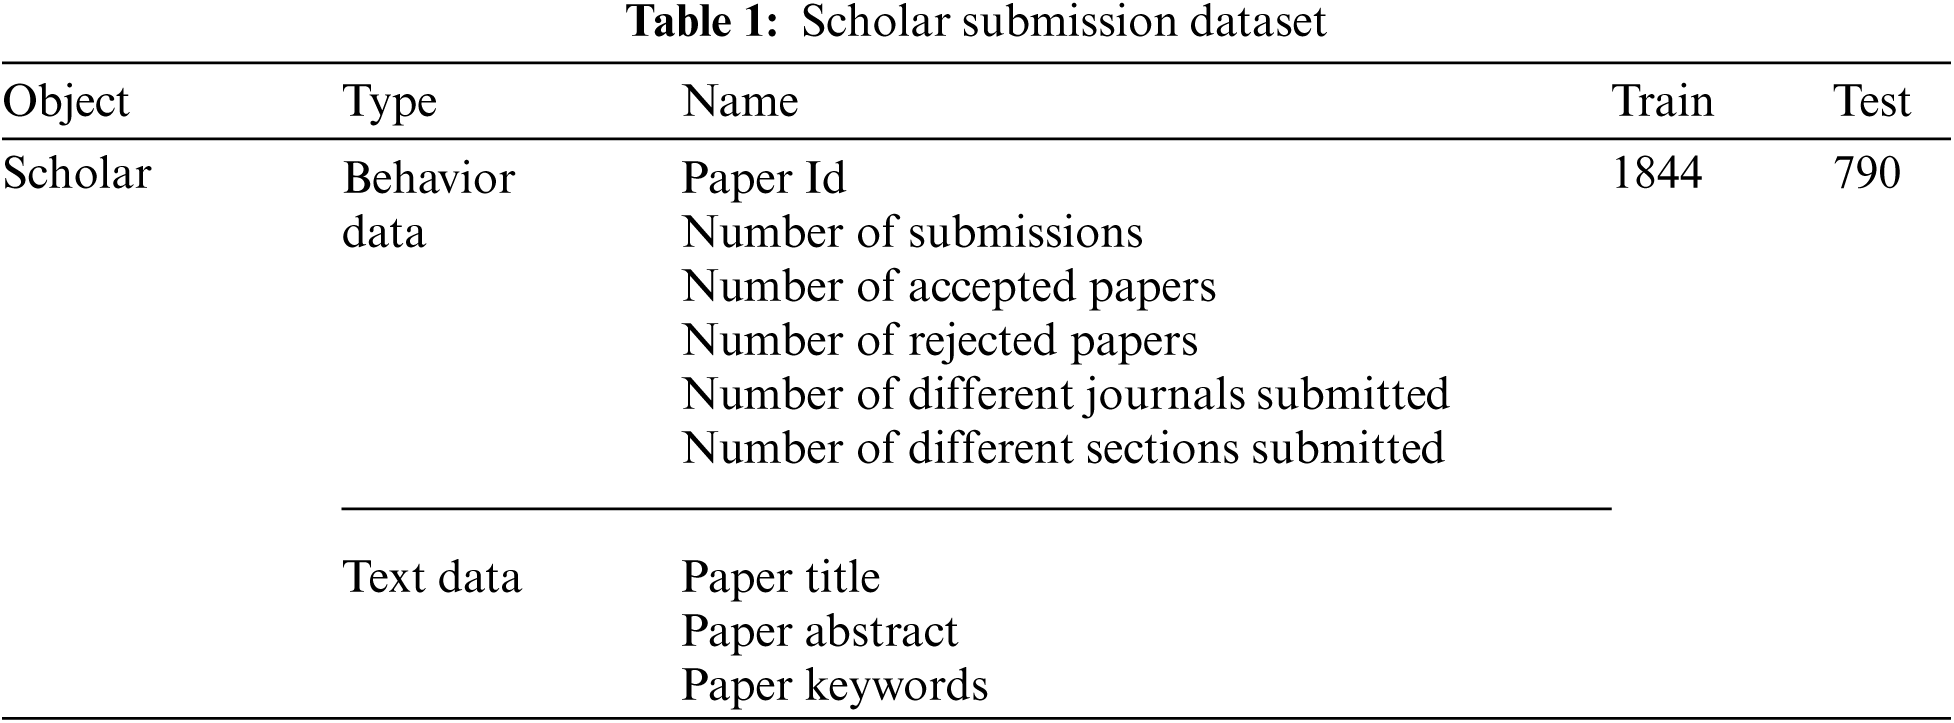
There were many records with little or no relevance to this experiment because of low correlation or because they were too evenly distributed (for instance, scholar username, scholar login registration time, etc.). Therefore, we removed these records from the data, counted contributors who submitted more than twice, and constructed the dataset for this experiment after re-screening. As shown in Tab. 1, the scholar users are divided into positive and negative cases, and the ratio of positive to negative cases is about 1:13.
In order to test the performance of the model, we use accuracy, precision and recall as the evaluation metrics, as expressed in the formulae below. False Positives (FP) denotes the number of true negative samples predicted as positive samples, True Positives (TP) denotes the number of true positive samples predicted as positive samples, True Negatives (TN) denotes the number of true negative samples predicted as negative samples, and False Negatives (FN) denotes the number of true positive samples predicted as negative samples.
Due to the imbalance of the sample set, Receiver Operating Characteristic (ROC) curve is used to reflect the sensitivity and accuracy of the model under different thresholds. Area Under Curve (AUC) [26] represents the area under the ROC curve, which can be used to measure the generalization performance of the model and can be a more intuitive indication of the classification effectiveness. The True Positive Rate (TPR) value will be used as the horizontal coordinate of the ROC curve as shown in Eq. (6). The False Positive Rate (FPR) value will be used as the vertical coordinate as shown in Eq. (7), and AUC is calculated by the formula shown in Eq. (8).
In the above, M and N are the numbers of positive and negative samples respectively,
4.3.1 Experimental Scheme Using Behavioral Data
Here, we describe the innovative attempt to use scholar behavior data to analyze the probability of academic misconduct.
To better test the effect of the data on the classification results, we specified and limited the range of data values. Among them, an excessive number of submitted papers and submission frequencies are considered to have an abnormal tendency; paper acceptance and rejection rates measure the scientific level of the authors; and the number of different journals or special issues to which papers are submitted is used as a feature to calculate the probability of duplicate submissions and multiple submissions. In this experiment, 70% of the samples are used as the training set, and the remaining 30% as the test set. The experimental data are shown in Tab. 2.
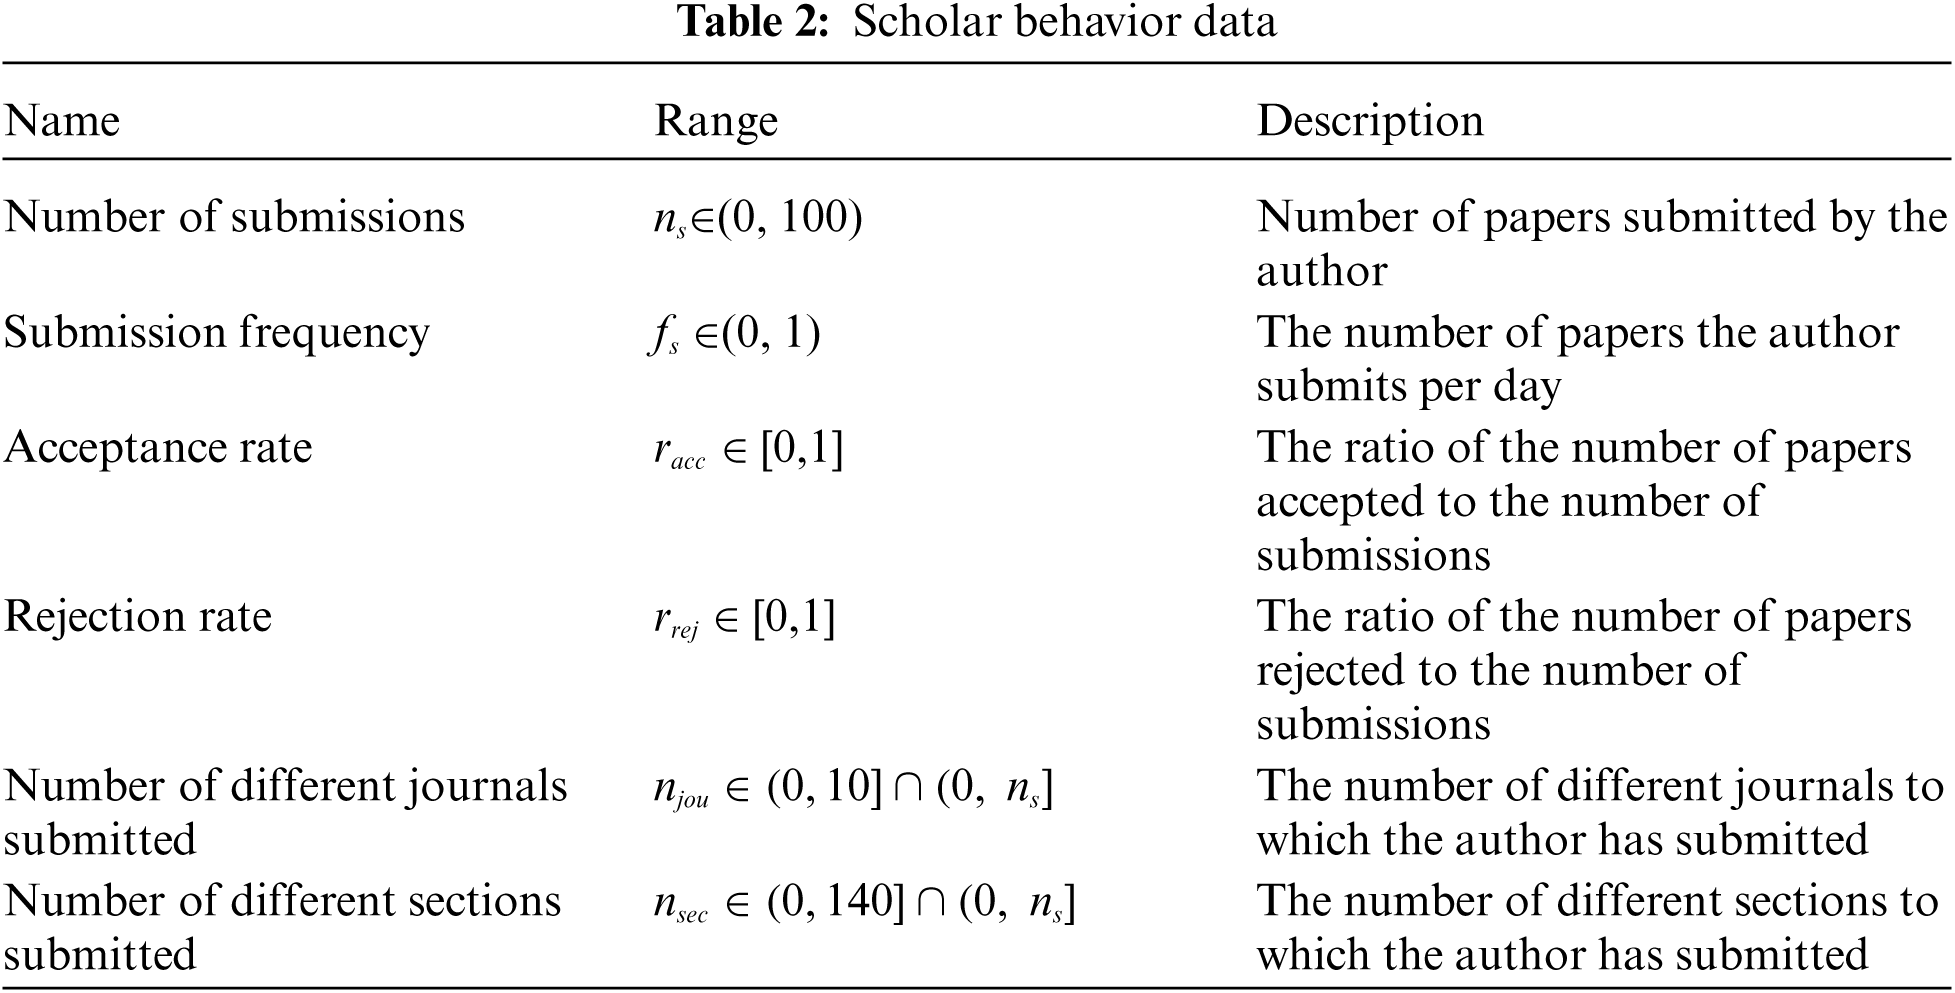
Fig. 7 shows the results of the model evaluation after using scholar behavior data only. The results show that scholars with academic misconduct can be effectively detected by using behavioral data as features. The upper left figure shows the loss value of the model under training and testing. As the epochs increase, the loss values gradually stabilize and are maintained at around 0.38 and 0.3 respectively. The upper right figure evaluates the accuracy of the model. It can be seen that after 100 iterations, the accuracy of the test set is close to the accuracy level of the training set, reaching about 84%. Because the dataset is an imbalanced dataset, which contains far fewer positive samples than negative samples, the accuracy of the model is not a good reflection of the model's performance. The recall rate in the lower left figure is used to measure the level of positive samples identified by the classifier. It can be observed that the average recall of the model reaches the better result of about 88%. The lower right figure shows the ROC curve. The dashed black line represents the random classifier, and the solid red curve measures the model's ability. The AUC value of 0.9 shows objectively that the model has a good performance.
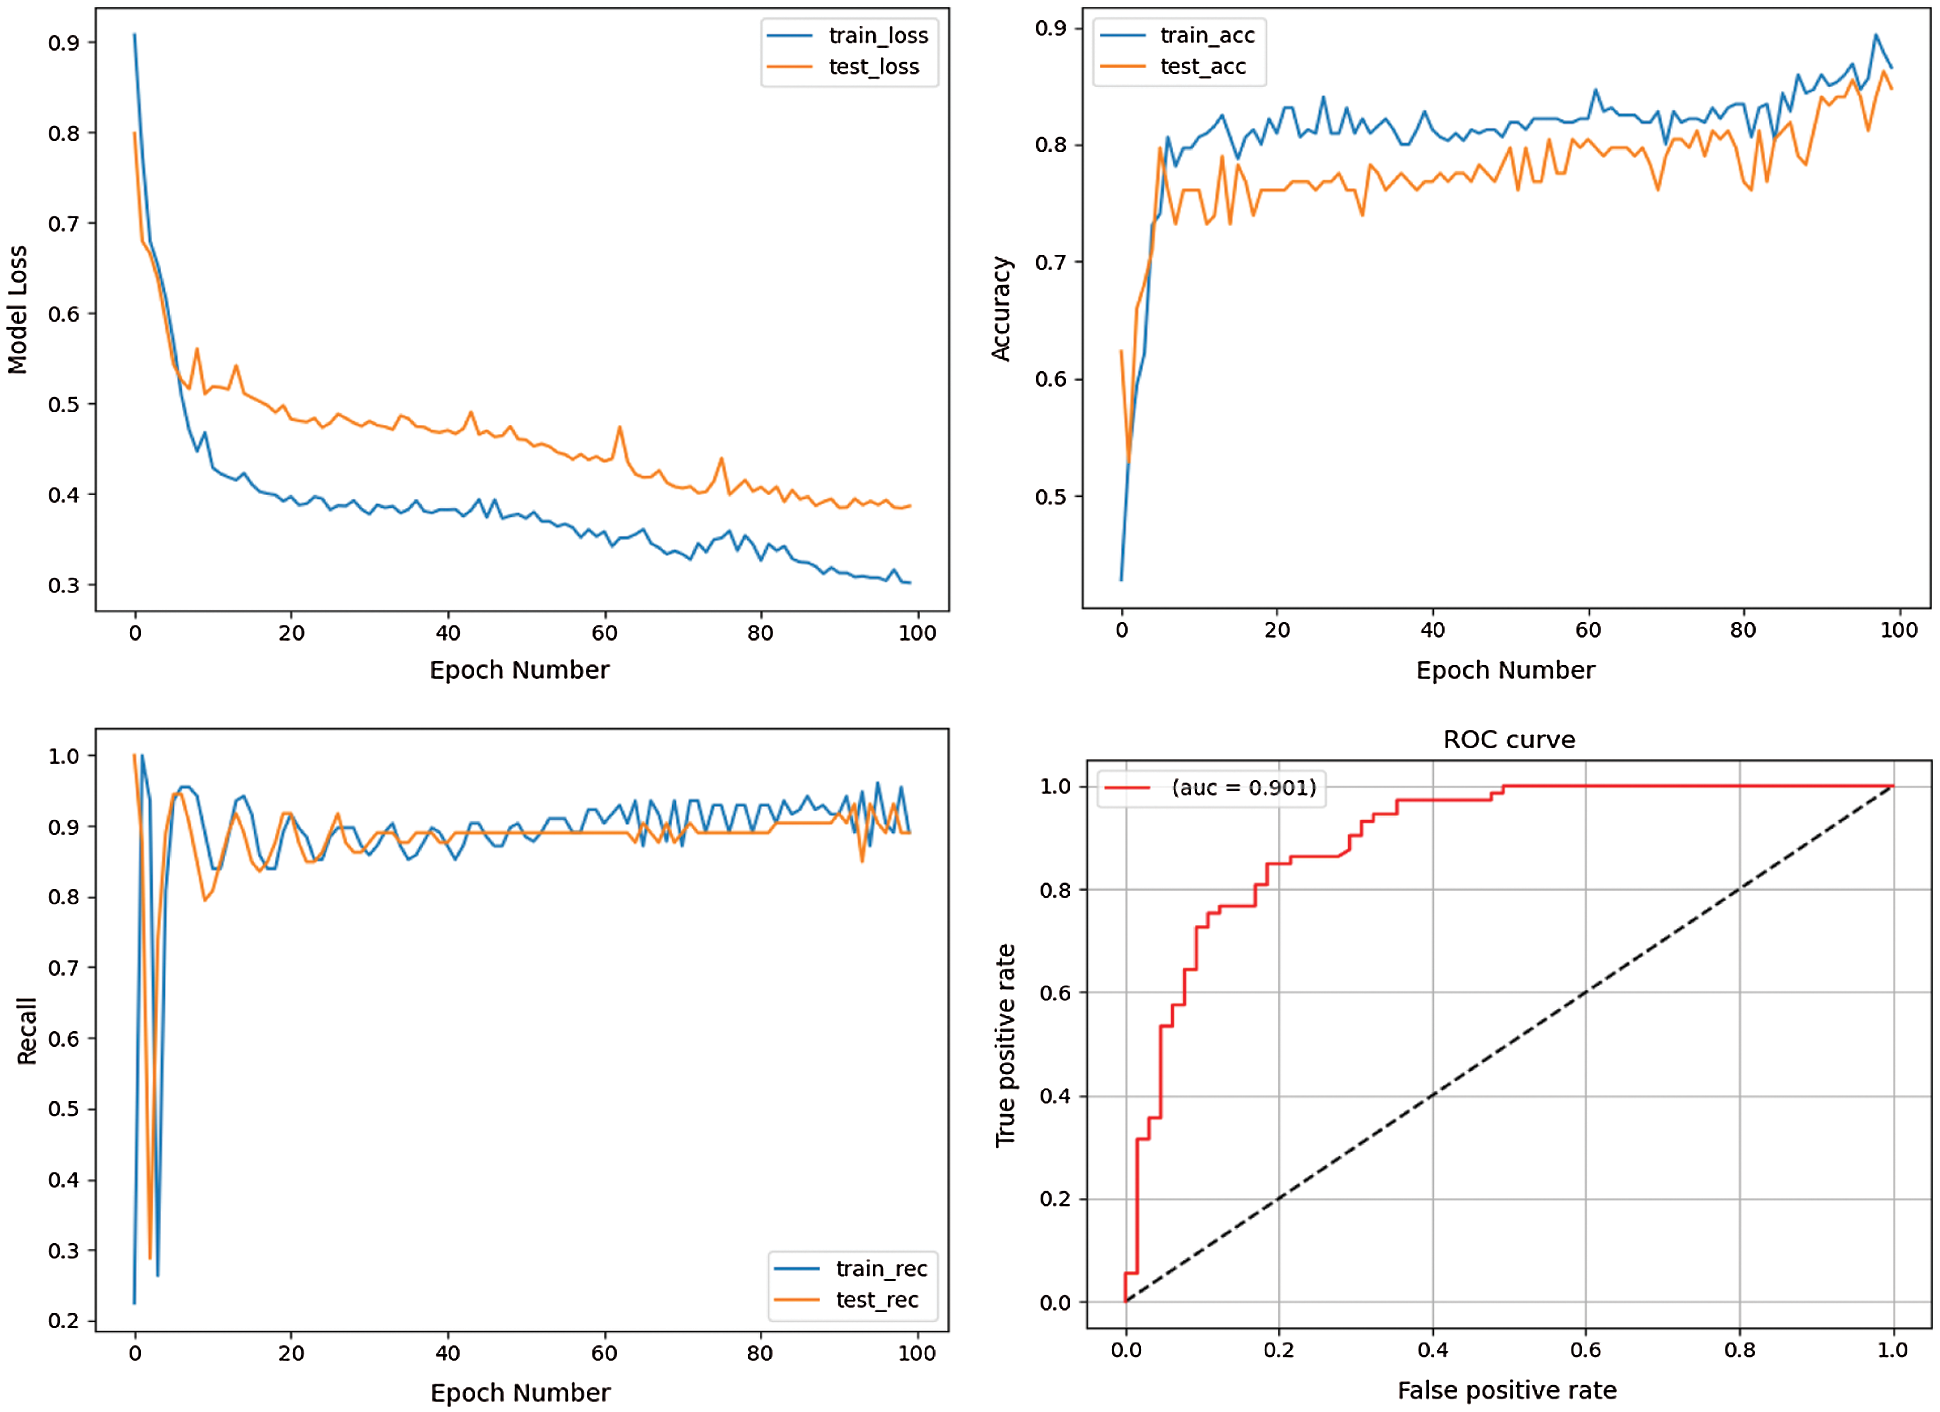
Figure 7: Model performance using behavioral features as input (loss, accuracy, recall, and ROC curve)
4.3.2 Experimental Scheme Combining Behavioral and Text Data
The text data which is used in the mainstream plagiarism method will be added to our behavioral data to test the comprehensive effect of two different data types on the classification results. Here again, the text data length is restricted to filter noise, as shown in Tab. 3.
To test whether the detection performance can be further improved by adding text features, the experiment shown in Fig. 7 is continued with text data, and the results are shown in Fig. 8. In terms of loss rate, both the test set and the training set show better performance, indicating that the model is better trained. As for the accuracy rate, both have gained a large improvement from the original highest point of less than 90% to a basically stable point of 90%. On the other hand, the recall rate of the model has not changed significantly and is basically maintained at the same level as the original one, indicating that adding text data does not have a significant effect on improving the recall rate. The AUC value of the ROC curve, however, is 0.925, which is larger than the 0.901 in Fig. 7 and shows that the combination of text features and behavioral features can enable the model to perform better.
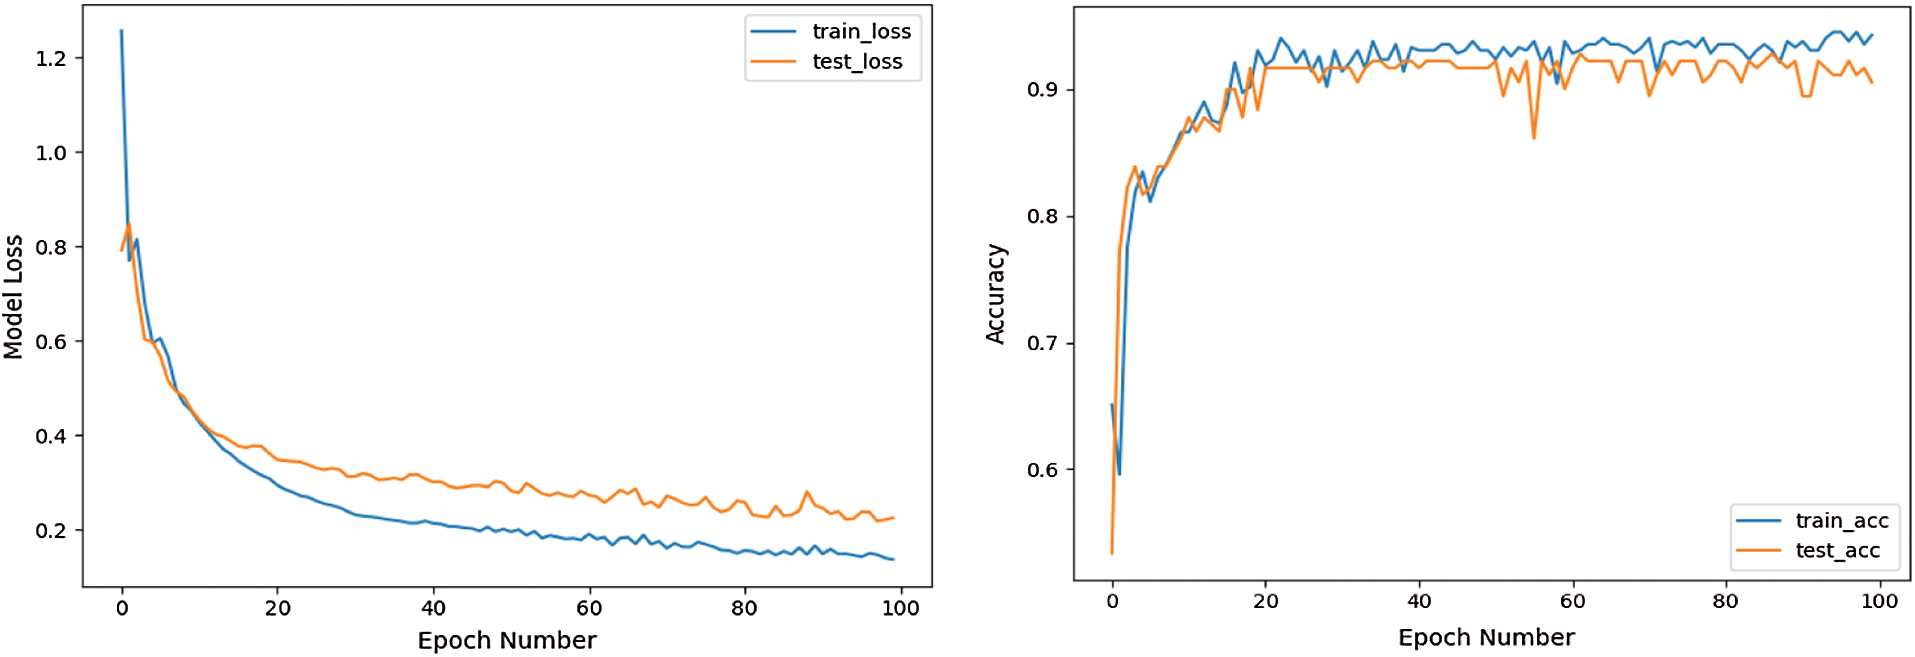
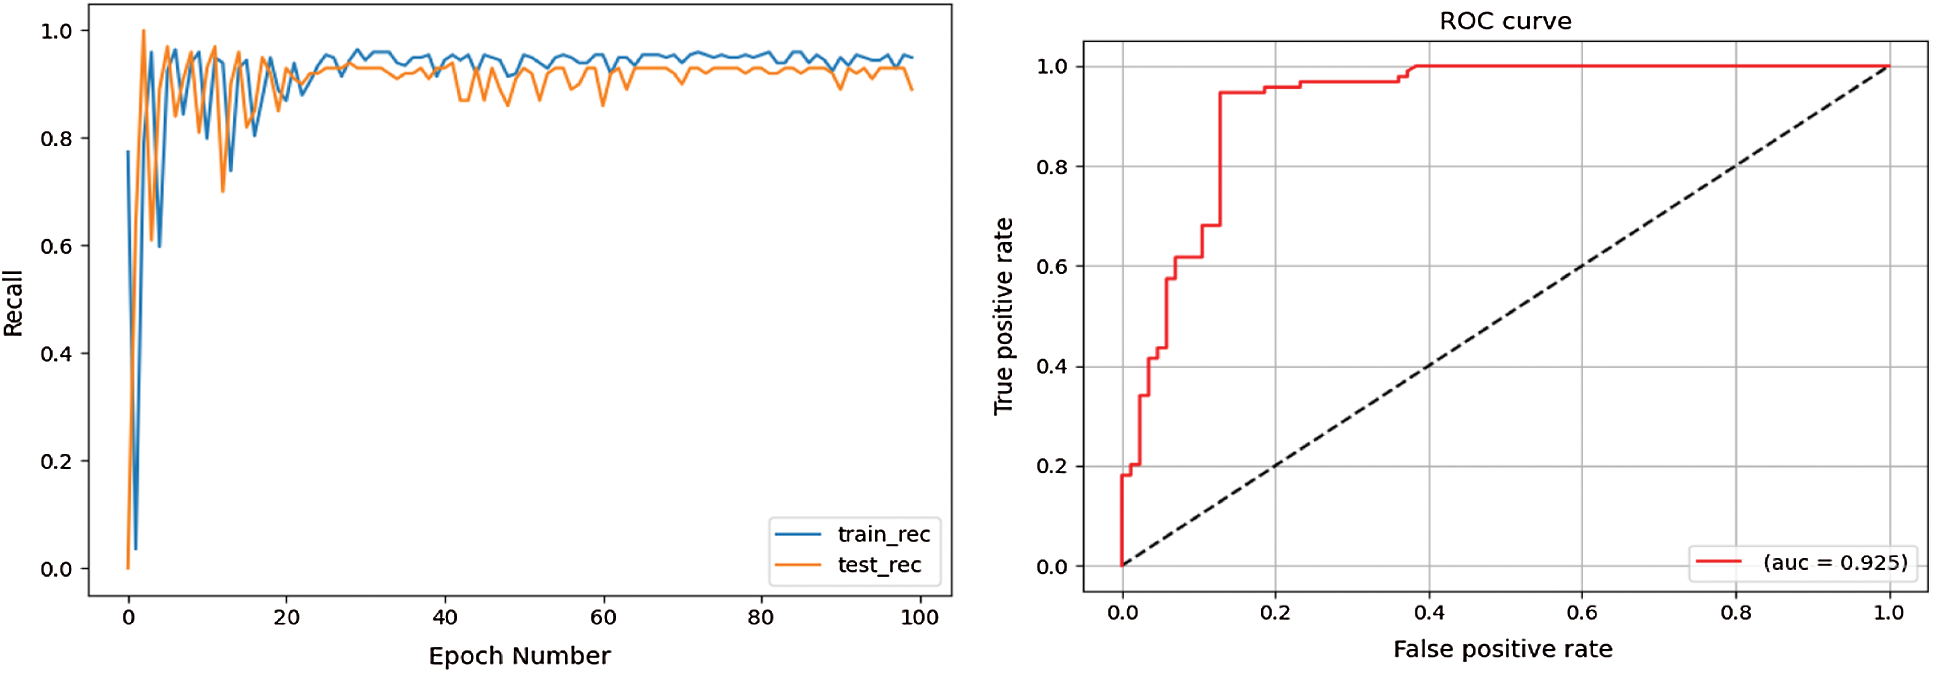
Figure 8: Model performance combining behavioral and text features (loss, accuracy, recall, and ROC curve)
The analysis and mining of text data can detect plagiarism effectively, but have difficulties finding other forms of academic misconduct. The experimental results here show that, by using website data on scholars’ behavior in the submission process, we can detect multiple submissions and duplicate submissions effectively, while the identification rate can be further improved by adding text data features.
With academic misconduct becoming a growing problem, it is far from sufficient to detect academic misconduct by analyzing article contents merely. More problems of academic misconduct are caused by authors and related stakeholders in their behaviors. Just as He et al. [27] uses abnormal trading behavior to predict the results, we integrate behavioral features to assist detection. This paper builds a neural network model to update automatically the weights of behavioral features, and to classify scholars based on the probability of their behavioral misconduct. Experimental results prove that using author behaviors is an effective method of detecting problems such as multiple submissions and duplicate submission phenomena. Moreover, the organic combination of behavioral data and text data can bring a considerable improvement in the accuracy and recognition rate of the model, and indicates that the comprehensive analysis of different types of data can help to improve the model's performance.
Funding Statement: This work is supported by the National Key R&D Program of China under grant 2018YFB1003205; by the National Natural Science Foundation of China under grants U1836208 and U1836110; by the Priority Academic Program Development of Jiangsu Higher Education Institutions (PAPD) fund; and by the Collaborative Innovation Center of Atmospheric Environment and Equipment Technology (CICAEET) fund, China.
Conflicts of Interest: The authors declare no conflicts of interest regarding the present study.
1. D. B. Audretsch, B. Bozeman, K. L. Combs, M. Feldman, A. N. Link et al., “The economics of science and technology,” Journal of Technology Transfer, vol. 27, no. 2, pp. 155–203, 2002. [Google Scholar]
2. The National Press and Publication Administration. 231nd Congress, 1st Session. (2019, Jul. 1). CY/T174-2019, Academic publishing specification—definition of academic misconduct for journals. [Online]. Available: https://www.chinesestandard.net/PDF/English.aspx/CYT174-2019. [Google Scholar]
3. M. L. Grieneisen and M. H. Zhang, “A comprehensive survey of retracted articles from the scholarly literature,” PLOS One, vol. 7, no. 10, pp. 1–15, 2012. [Google Scholar]
4. A. B. Abdulkareem, N. S. Sani, S. Sahran, Z. A. A. Alyessari, A. Adam et al., “Predicting COVID-19 based on environmental factors with machine learning,” Intelligent Automation & Soft Computing, vol. 28, no. 2, pp. 305–320, 2021. [Google Scholar]
5. M. B. Antor, A. H. M. S. Jamil, M. Mamtaz, M. M. Khan, S. S. Alshamrani et al., “Development of a web-based telemedicine system for COVID-19 patients,” Intelligent Automation & Soft Computing, vol. 30, no. 3, pp. 899–915, 2021. [Google Scholar]
6. R. L. Wu, Z. Q. Deng and S. Q. Wu, “Analysis of the reasons for retraction of open access journals from a multi-dimensional perspective—based on data from retraction watch database,” Chinese Journal of Scientific and Technical Periodicals, vol. 31, no. 3, pp. 346–355, 2020. [Google Scholar]
7. K. Vani and D. Gupta, “Detection of idea plagiarism using syntax–semantic concept extractions with genetic algorithm,” Expert Systems with Applications, vol. 73, pp. 11–26, 2017. [Google Scholar]
8. M. Potthast, M. Hagen, T. Gollub, M. Tippmann, J. Kiesel et al., “Overview of the 5th international competition on plagiarism detection,” CLEF Conf. on Multilingual and Multimodal Information Access Evaluation, Valencia, Spain, pp. 301–331, 2013. [Google Scholar]
9. S. M. Z. Eissen and B. Stein, “Intrinsic plagiarism detection,” European Conf. on Information Retrieval, Berlin, Heidelberg, pp. 565–569, 2006. [Google Scholar]
10. M. Potthast, F. Rangel, M. Tschuggnall, E. Stamatatos, P. Rosso et al., “Overview of PAN’17,” in Int. Conf. of the Cross-Language Evaluation Forum for European Languages, Dublin, Ireland, pp. 275–290, 2017. [Google Scholar]
11. C. Grozea, C. Gehl and M. N. Popescu, “ENCOPLOT: pairwise sequence matching in linear time applied to plagiarism detection,” in 3rd PAN Workshop. Uncovering Plagiarism, Authorship and Social Software Misuse, Bucharest, Romania, pp. 1–10, 2009. [Google Scholar]
12. M. Tschuggnall and G. Specht, “Detecting plagiarism in text documents through grammar-analysis of authors,” Datenbanksysteme für Business, Technologie und Web, Bonn, Germany, pp. 241–259, 2013. [Google Scholar]
13. M. Elhadi and A. Al-Tobi, “Use of text syntactical structures in detection of document duplicates,” in 2008 Third Int. Conf. on Digital Information Management, London, UK, pp. 520–525, 2008. [Google Scholar]
14. M. AlSallal, R. Iqbal, S. Amin, A. James and V. Palade, “An integrated machine learning approach for extrinsic plagiarism detection,” in 2016 9th Int. Conf. on Developments in eSystems Engineering, Liverpool, UK, pp. 203–208, 2016. [Google Scholar]
15. P. Resnik, “Semantic similarity in a taxonomy: An information-based measure and its application to problems of ambiguity in natural language,” Journal of Artificial Intelligence Research, vol. 11, no. 2, pp. 95–130, 1999. [Google Scholar]
16. M. Franco-Salvador, P. Rosso and M. Montes-y-Gómez, “A systematic study of knowledge graph analysis for cross-language plagiarism detection,” Information Processing & Management, vol. 52, no. 4, pp. 550–570, 2016. [Google Scholar]
17. T. Foltýnek, N. Meuschke and B. Gipp, “Academic plagiarism detection: A systematic literature review,” ACM Computing Surveys, vol. 52, no. 6, pp. 1–42, 2019. [Google Scholar]
18. B. Gipp and N. Meuschke, “Citation pattern matching algorithms for citation-based plagiarism detection: greedy citation tiling, citation chunking and longest common citation sequence,” in Proc. of the 11th ACM Symposium on Document Engineering, California, USA, pp. 249–258, 2011. [Google Scholar]
19. N. Meuschke, M. Schubotz, F. Hamborg, T. Skopal and B. Gipp, “Analyzing mathematical content to detect academic plagiarism,” in Proc. of the 2017 ACM on Conf. on Information and Knowledge Management, New York, USA, pp. 2211–2214, 2017. [Google Scholar]
20. D. E. Acuna, P. S. Brookes and K. P. Kording, “Bioscience-scale automated detection of figure element reuse,” BioRxiv, 2018. [Google Scholar]
21. Y. Wang, B. X. Liu, H. J. Wu, S. Zhao, Z. P. Cai et al., “An opinion spam detection method based on multi-filters convolutional neural network,” Computers Materials & Continua, vol. 65, no. 1, pp. 355–367, 2020. [Google Scholar]
22. X. J. Wang, Q. Q. Zheng, K. F. Zheng, Y. Sui and J. Y. Zhang, “Semi-gSGCN: Social robot detection research with graph neural network,” Computers, Materials & Continua, vol. 65, no. 1, pp. 617–638, 2020. [Google Scholar]
23. N. V. Chawla, K. W. Bowyer, L. O. Hall and W. P. Kegelmeyer, “SMOTE: Synthetic minority over-sampling technique,” Journal of Artificial Intelligence Research, vol. 16, no. 9, pp. 321–357, 2002. [Google Scholar]
24. K. M. He, X. Y. Zhang, S. Q. Ren and J. Sun, “Delving deep into rectifiers: surpassing human-level performance on imageNet classification,” in Proc. of the IEEE Int. Conf. on Computer Vision, Washington, USA, pp. 1026–1034, 2015. [Google Scholar]
25. D. P. Kingma and J. L. Ba, “Adam: a method for stochastic optimization,” in Proc. ICLR, San Diego, CA, 2015. [Google Scholar]
26. J. Fan, S. Upadhye and A. Worster, “Understanding receiver operating characteristic (ROC) curves,” Canadian Journal of Emergency Medicine, vol. 8, no. 1, pp. 19–20, 2006. [Google Scholar]
27. S. He, J. B. Zheng, J. L. Lin, T. Tang, J. T. Zhao et al., “Classification-based fraud detection for payment marketing and promotion,” Computer Systems Science and Engineering, vol. 35, no. 3, pp. 141–149, 2020. [Google Scholar]
 | This work is licensed under a Creative Commons Attribution 4.0 International License, which permits unrestricted use, distribution, and reproduction in any medium, provided the original work is properly cited. |