DOI:10.32604/cmc.2022.023278
| Computers, Materials & Continua DOI:10.32604/cmc.2022.023278 | |
| Article |
Automatic Speaker Recognition Using Mel-Frequency Cepstral Coefficients Through Machine Learning
1Department of Computer Engineering, Istanbul Technical University, Istanbul, 34485, Turkey
2Department of Information Systems Engineering, Mugla Sitki Kocman University, Mugla, 48000, Turkey
3Artificial Intelligence Lab, Department of Computer Engineering, Gachon University, Seongnam, 13557, Korea
4Department of Computer Science, College of Computing and Informatics, University of Sharjah, Sharjah, 27272, UAE
*Corresponding Author: Taegkeun Whangbo. Email: tkwhangbo@gachon.ac.kr
Received: 01 September 2021; Accepted: 01 November 2021
Abstract: Automatic speaker recognition (ASR) systems are the field of Human-machine interaction and scientists have been using feature extraction and feature matching methods to analyze and synthesize these signals. One of the most commonly used methods for feature extraction is Mel Frequency Cepstral Coefficients (MFCCs). Recent researches show that MFCCs are successful in processing the voice signal with high accuracies. MFCCs represents a sequence of voice signal-specific features. This experimental analysis is proposed to distinguish Turkish speakers by extracting the MFCCs from the speech recordings. Since the human perception of sound is not linear, after the filterbank step in the MFCC method, we converted the obtained log filterbanks into decibel (dB) features-based spectrograms without applying the Discrete Cosine Transform (DCT). A new dataset was created with converted spectrogram into a 2-D array. Several learning algorithms were implemented with a 10-fold cross-validation method to detect the speaker. The highest accuracy of 90.2% was achieved using Multi-layer Perceptron (MLP) with tanh activation function. The most important output of this study is the inclusion of human voice as a new feature set.
Keywords: Automatic speaker recognition; human voice recognition; spatial pattern recognition; MFCCs; spectrogram; machine learning; artificial intelligence
The voice signal contains infinite information and voice instances can be used for extracting information about speech words, expression, style of speech, accent, emotion, speaker identity, gender, age, health state of the speaker etc. Advances in biometrics and computer science have provided identifying some of the characteristics of individuals. ASR systems are widely used in the field of security and forensic science, for instance, to create voice signature and to identify suspects. The main motivation behind ASR is to convert the acoustic voice signal into a computer-readable format and to identify the speakers depending upon their vocal characteristics [1].
Analysing and synthesizing the voice signal is a complex process. To simplify, two factors have been developed; feature extraction and feature matching. The traditional ASR systems were built on Gaussian mixture models (GMMs) and Hidden Markov models (HMMs) to perform the feature matching process. Herein, HMMs are used to deal with the temporal variability of speech and GMMs used to determine how well each of the HMMs fit into a frame or brief window of coefficients representing acoustic input [2]. As an example of the feature extraction methods; Linear Prediction Coefficients (LPCs) and Linear Prediction Cepstral Coefficients (LPCCs) were used to extract feature vectors from acoustic signal data, especially with HMMs. Davis and Mermelstein introduced the MFCC features in the 1980's [3]. These features have been widely used and have been regarded as the state-of-art since that date.
MFCCs are coefficients that represent the audio based on human perception [4]. They are derived from the Fourier Transform of the audio clip. The difference is that in MFCC method the frequency bands are positioned logarithmically. As the perception of the frequency content of the human speech signal by the human does not follow a linear scale, applying logarithmically positioning in MFCCs, makes it more closely to human perception [5].
In literature, MFCCs are used in various fields; speaker and speech recognition [6,7], emotion detection [8,9] and pre-detection and diagnosis of diseases like Parkinson [10].
Korkmaz et al. [11] proposed a novel MFCC extraction system, which is faster and more energy-efficient method than conventional MFCC realization. They used low-pass filter instead of highpass pre-emphasizing filter. Since pre-emphasizing is also required for enhancing the energy of the signal in high frequencies they implemented a bandpass filter that performs highpass filter. They stated that the most time-consuming part in conventional method is FFT with the cost of 72,67% and they discarded this phase.
Lalitha et al. [12] changed the conventional MFCC structure and offered a new model to voice activity detection. In contrast to triangular filterbanks employed during the MFCC process, they proposed new smoother and DCT involved method.
Sangeetha et al. [13] investigated an alternative approach to conventional DCT method. They stated that traditional DCT is not as efficient as the proposed method in terms of de-correlation of filterbank features. They offered a new distributed DCT method for MFCC extraction, which reduces the correlation and feature count.
Upadhya et al. [14] tried a new method to recognize hand-written numbers using MFCC features and HMM. They used MNIST and Fashion MNIST dataset and converted 2D image arrays to 1D sound array. Then, they extracted MFCCs from this 1D array. They input the HMM model with 39 MFCC feature vectors and an accuracy value of 86.4% is obtained.
Since the MFCC feature extraction process already have a phase where image patterns called spectrograms are produced, we applied spatial pattern recognition techniques on these mel spectrograms in this study. After applying pre-processing and MFCC processing steps to the speech signals, we obtained mel-scale power spectra, convert them into spectral energy decibels (dB) features and saved each spectrum pixel as a power spectrogram image. Each spectrogram has a characteristic pattern and each pixel of a spectrogram represents our features for the classification model. In signal processing phase, we produced these spectrograms applying MFCC steps and create our dataset instances. Each instance includes a 1D array of pixel values of the spectrogram and a label indicating the speaker. In classification section, we trained machine learning models using the training dataset and chose the model giving the best performance in terms of accuracy. Detailed information about methodology is given in Section 2.
In this study, we investigated the usage of mel-scale spectrograms as an input to a deep neural network to recognize Turkish speakers. A new voice dataset is created and used to test the real-time performance of the ASR system. The participants are informed about the details of the experiment before the data collection process to minimize the artifacts and noise of voice signal. We also applied the spectral subtraction [15] to obtain clean voice signal. The ASR system proposed in this article is intended for people who use voice-controlled systems in daily life. In such systems, security comes first, the person giving the command is important. That's why we focused on improving our speaker recognition performance rather than speech recognition.
The first step in designing an ASR system is to determine the appropriate data set. Although there are many English voice dataset available on the Internet, there are limited Turkish voice dataset. However, each instance in the dataset had to be labeled carefully with the corresponding individual. Whenever we needed a precise command from a particular person, we would have to search for it. This was difficult and time consuming to implement in the real-time system. We collected our own voice dataset from undergraduate and graduate students. In this way, we have full control over the dataset for the system we will develop. More details on the data collection process are given in 2.1. Finally, the real-time performance of the ASR system in voice-controlled systems such as voice command phone unlocking is investigated. The system will unlock a phone only if the command is given by the owner.
The signal processing is one of the most sensitive parts of ASR systems. Although we recorded voice data in a quiet laboratory environment, noises may occur due to both external factors and the sound recording device. In the first step of signal processing, the noise removal and speech enhancement technique called spectral subtraction is applied to each voice signal in Matlab.
Speeches are trimmed to a length of 5 s to extract features of the same size. Lyons’ Python Speech Features library [16] is used to extract speech features.This library supports the following voice features; MFCCs, Filterbank Energies, Log Filterbank Energies and Spectral Subband Centroids. Log Filterbank Energies were used to get power spectrogram and pixel features. To detect the speaker, we applied several machine learning algorithms on Orange 3. It is basically a python-based visual data mining programming unit. These processes are illustrated in Fig. 1. The detailed information about the dataset and the speaker recognition processes is given in the Sections 2.1 and 2.2.

Figure 1: Flowchart of signal processing and feature extraction
2.1 Turkish Speakers’ Voice Dataset
The voice dataset is collected from 15 people (7 men and 8 women) in a noiseless laboratory. In the data collection phase, all participants read 40 specific sentences that involve the characteristics of a Turkish speech selected by the Free Software Foundation [16]. Each participant read these sentences that were recorded using a smart phone. The sample rate of 48000 Hz and the number of bits per second encoded in the record file of 1411 kbps were set for each record. Each recording lasted 5 s and speakers read a single sentence in each record. These sentences are available in the Google Docs [17]. Data acquisition process is represented in Fig. 2. Sections 2.2 and 2.3 describe our dataset in depth.
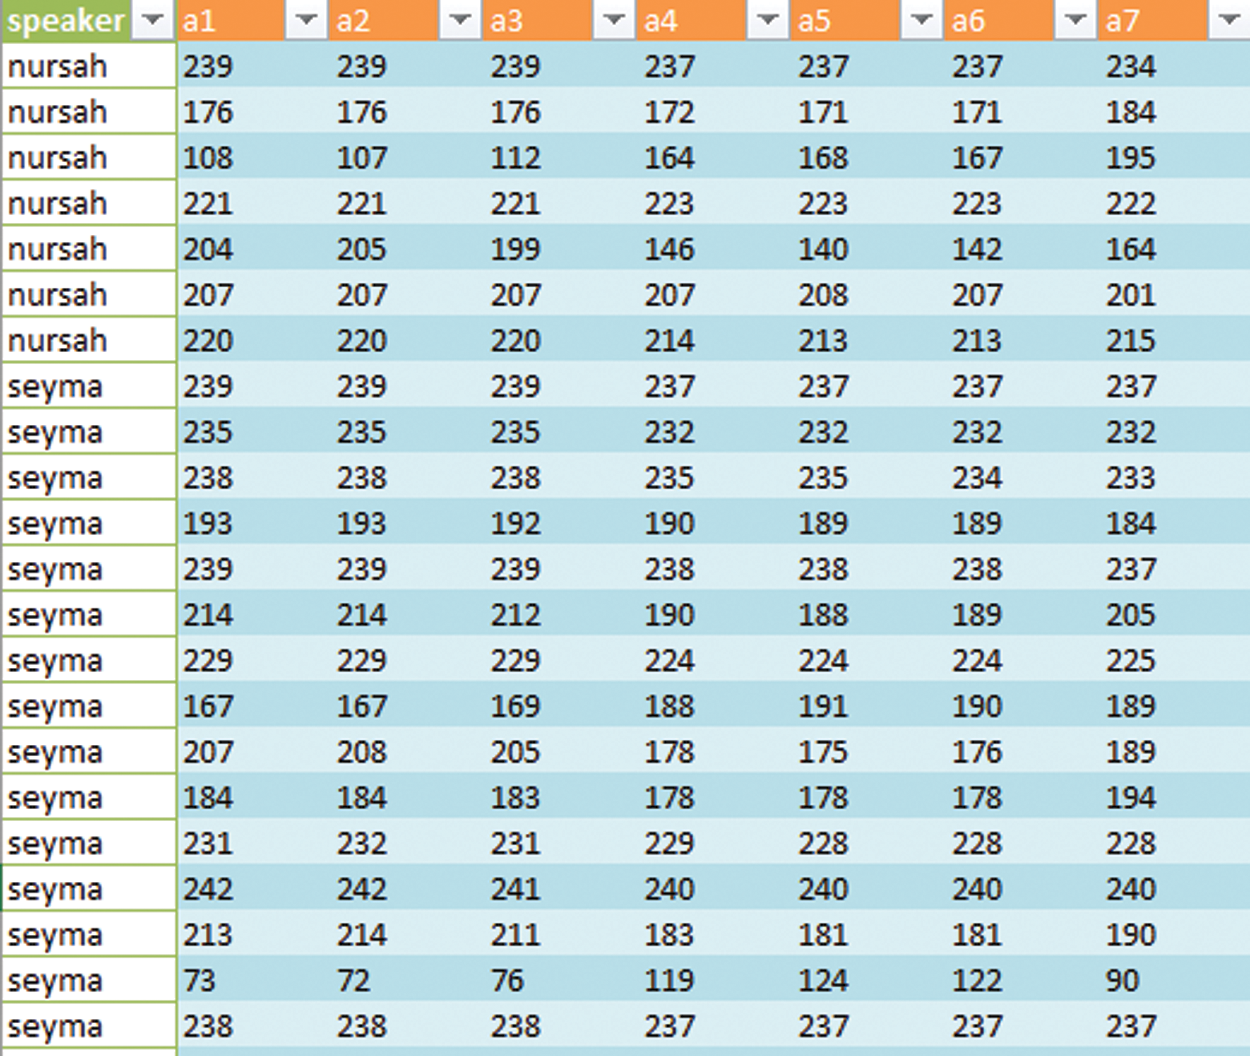
Figure 2: Part of the Turkish speakers dataset
Fig. 2 shows part of the Turkish speakers dataset. The creation processes of this dataset are described in detail in Sections 2.2 and 2.3.
2.2 Implementatation Steps of MFCC
MFCC is based on a concept called cepstrum or spectrum. Cepstrum also known as a quefrency [18]. Oppenheim and Schafer [19] defined the Cepstrum transform as composite of the following transactions; Fourier transform, followed by Complex Logarithm and implementation of Inverse Fourier transform. Davis and Mermelstein developed this theory and applied a non-linear filterbank in frequency domain. The implementation steps of their algorithm are given in Fig. 3.
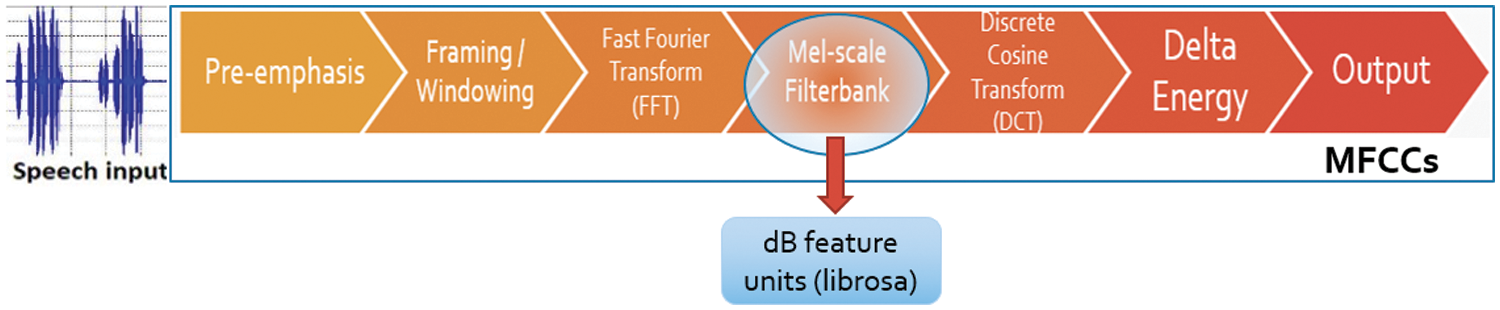
Figure 3: Obtaining the mel-filterbank features from the MFCCs process
A normal MFCC extraction includes DCT phase. During the MFCC process highly correlated features are extracted. This high correlation may be problematic for conventional machine learning algorithms. DCT decorrelates the highly correlated MFCC features. On the other hand, with the development of deep neural networks which are less sensitive and capable to handle correlated data this will not a big problem anymore [20]. In our ASR design, we discarded DCT phase and applied spatial pattern recognition on mel-scale spectrograms.
The Mel-scale relates the perceived frequency of a pure tone to its actual measured frequency. The actual frequency was converted to the mel-scale frequency by the Eq. (1).
At the first step, the pre-emphasis process is applied to the speech signal to amplify the high frequencies by Eq. (2). Pre-emphasising is crucial for (1) balancing the frequency spectrum since high frequencies usually have smaller magnitudes compared to lower frequencies, (2) avoiding numerical problems during the Fourier transform operation and (3) improving the Signal-to-Noise Ratio (SNR) [20].
where
Finally, the number of triangular filters set 26 as default and log filterbank energy features computed. This step is the difference of MFCC from FFT because filterbanks are non-linear whereas Fourier transform is linear-based. Normally, in the MFCC method, DCT is applied after the implementation of filterbanks. DCT is a linear transformation and it discards some important information in the speech signal that is non-linear [20]. Therefore, we didn't prefer to use DCT, the origin of our features in the dataset are filterbank energy features as shown in Fig. 4.
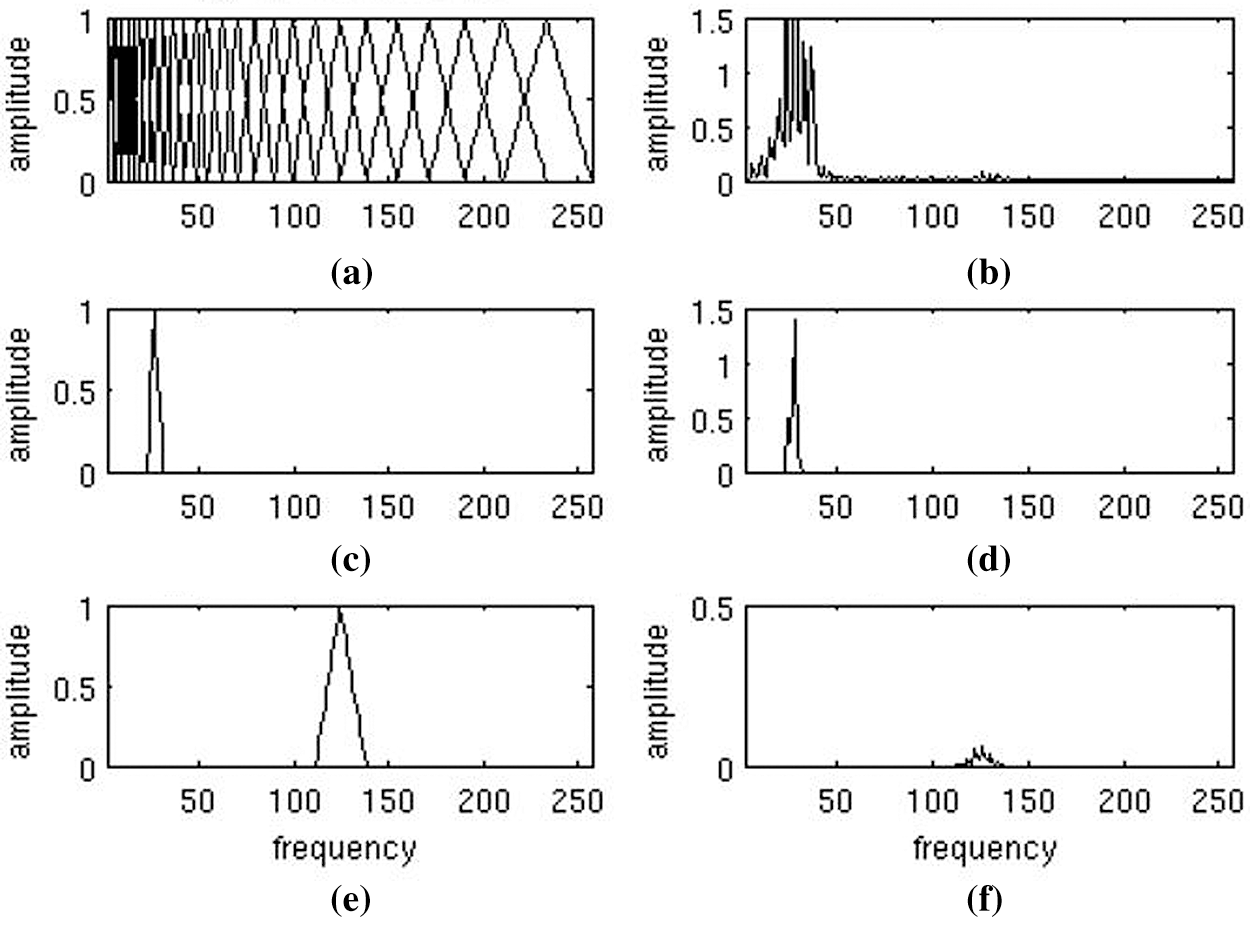
Figure 4: Plots of Mel-Scale filterbank and windowed power spectrum [23] (a) the full filterbank, (b) example power spectrum of an audio frame, (c) filter 8 from filterbank, (d) windowed power spectrum using filter 8, (e) filter 20 from filterbank, (f) windowed power spectrum using filter 20
At the second step, framing and windowing processes were applied. After the speech signals pre-emphasised and divided into frames, well known windowing method Hamming [21,22] was applied. Then, Discrete Fourier Transform (DFT) was calculated for each windowed spectrum as given in Eq. (3), while the periodogram estimated power spectrum was calculated for the speech frame as given in Eq. (4).
where
2.3 Creating Spectrogram Feature
After the extraction of logarithmically positioned mel-scale filterbanks, “librosa” [24] a Python library for audio and music signal analysis, was used to convert power spectrums (amplitude squared) to decibels (dB). Herein, librosa's power_to_db method was applied and the units were saved as mel-scale spectrograms with the size of 800 × 600 pixels representing MFCC features. Each spectrogram contained a five-second characteristic speech signal information for each individual. These mel-spectrograms were subjected to certain image processing operations before the classification stage. Each image instance in the dataset contained 480000 features, which were multiplied by 800 × 600 pixels. To cope with training time and complexity of the model, each image was size reduced to 80 × 60 pixels as seen in the Figs. 5a and 5b.
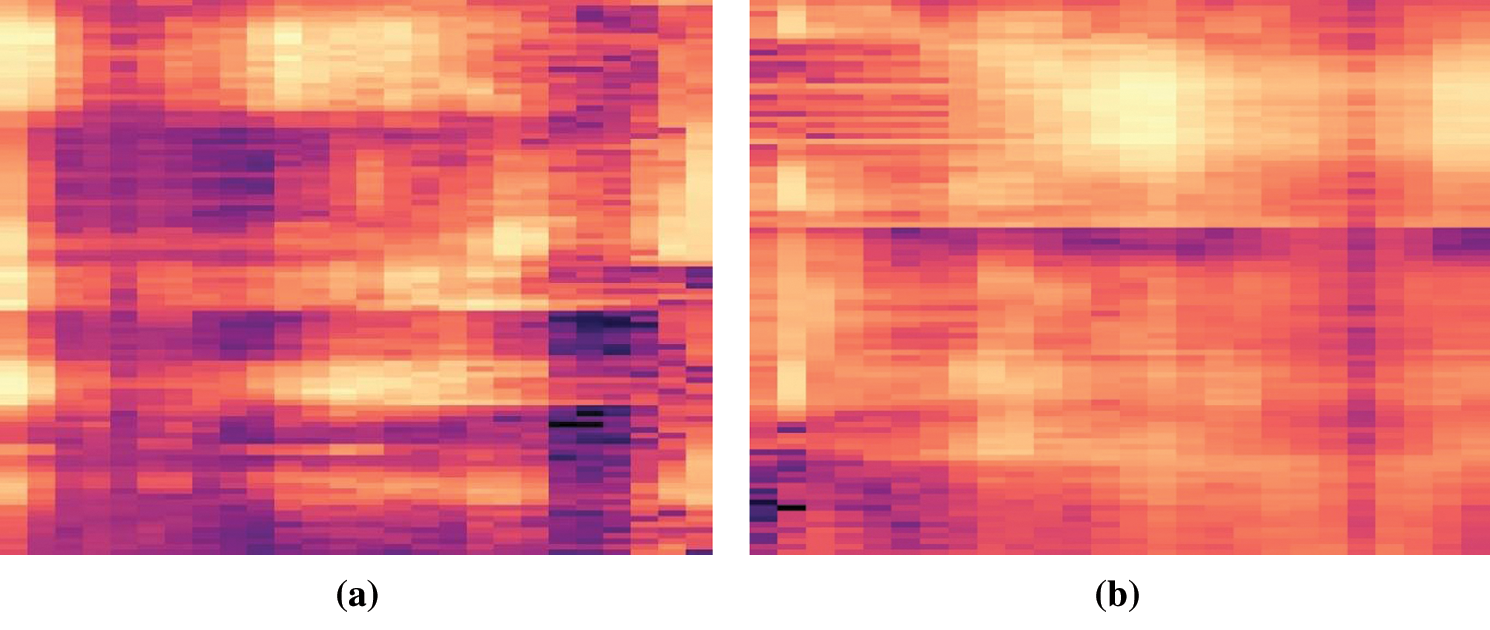
Figure 5: (a) speaker-1's voice mel-spectrogram, (b) speaker-2’ voice mel-spectrogram
Resized spectrograms converted to grayscale images. Every grayscale image contains 80 × 60 features of a single sentence recorded for an individual. At the end of this stage, the Turkish speaker dataset obtained is obtained as shown in Fig. 6 with 530 instances belonging to 15 people. Each instance consists of 4800 features and a speaker class.
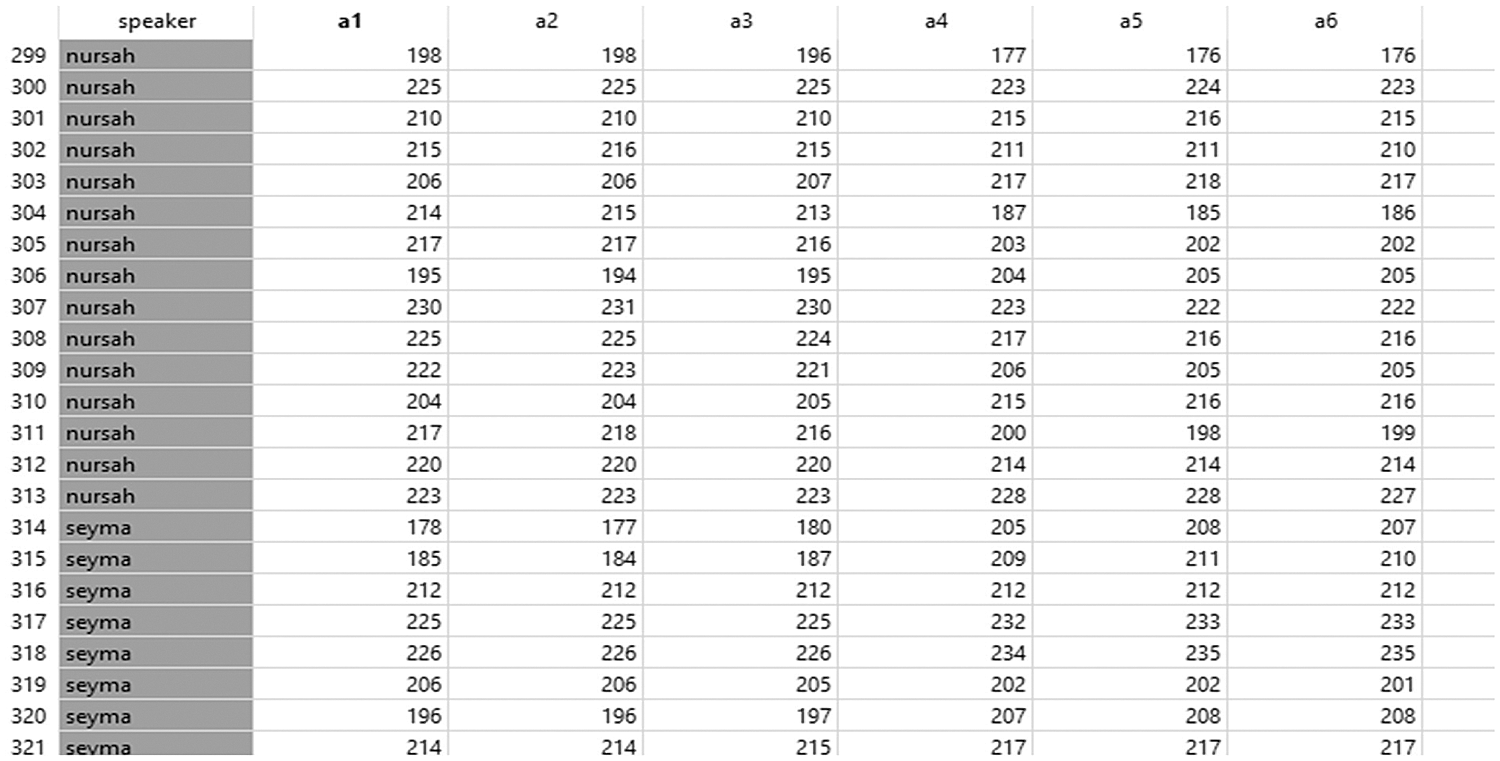
Figure 6: A part of the Turkish speakers dataset
Orange3 [25] machine learning tool used to evaluate the accuracy of the model. In this study, ML algorithms were attempted to be trained with the dataset. Since the human voice is nonlinear in nature, linear models are not suitable for ASR systems. The nonlinear ML algorithms such as deep neural network (DNNs) are more dominant pattern recognition techniques [26]. In this study we prioritized three nonlinear algorithms in terms of ASR performance. These are SMO [27], Random Forest (RF) [28], and a 3-layer NN called Multilayer perceptron (MLP) [29] algorithms.
SMO is an SVM based classification algorithm that implements John Platt's sequential minimal optimization algorithm for training a support vector classifier. RF introduced by Breiman to construct random trees in classification. The DNN classifier used in our model consists of 3-hidden layers and 64 neurons in each layer. The extracted 4800-pixel features are inputs and 15 speakers are outputs as seen in Fig. 7. Finally, the 10-fold cross validation method was used for evaluation of each algorithm.
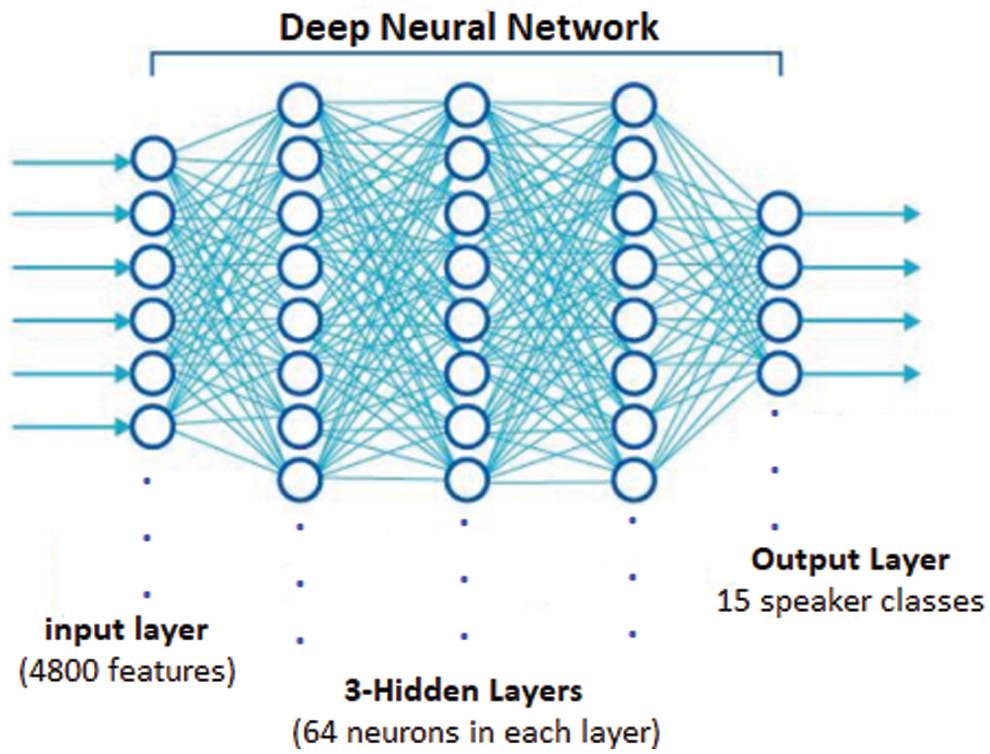
Figure 7: Structure of MLP classifier used in model
This study held on NVidia GeForce GTX 860M laptop and Python platform. Data features were extracted from the collected Turkish speakers’ voice instances using MFCCs method and Lyons’ Python Speech Features library and resulted in a new dataset. This library supports the following voice features; MFCCs, Filterbank Energies, Log Filterbank Energies and Spectral Subband Centroids. Log Filterbank Energies were used to get power spectrogram and pixel features. To detect the speaker, we applied several machine learning algorithms on Orange 3. It is basically a python-based visual data mining programming unit.
In this study, we tried a novel approach and used more features than MFFCs. If the complexity of a dataset increases the DNNs as shown in Fig. 8 are a good choice to train it. So, one of the most satisfying and promising result of this study was getting the highest evaluation score with DNN model. Before choosing the optimum model, several classifier methods used and the evaluation results in Tab. 1 was obtained.
The best model achieved for our dataset was with tanh activation functions. When look at the confusion matrix, we can see that the misclassification is more in women voices. This situation may show that women's voices in the dataset are more similar in terms of dB and mel-scale energy.
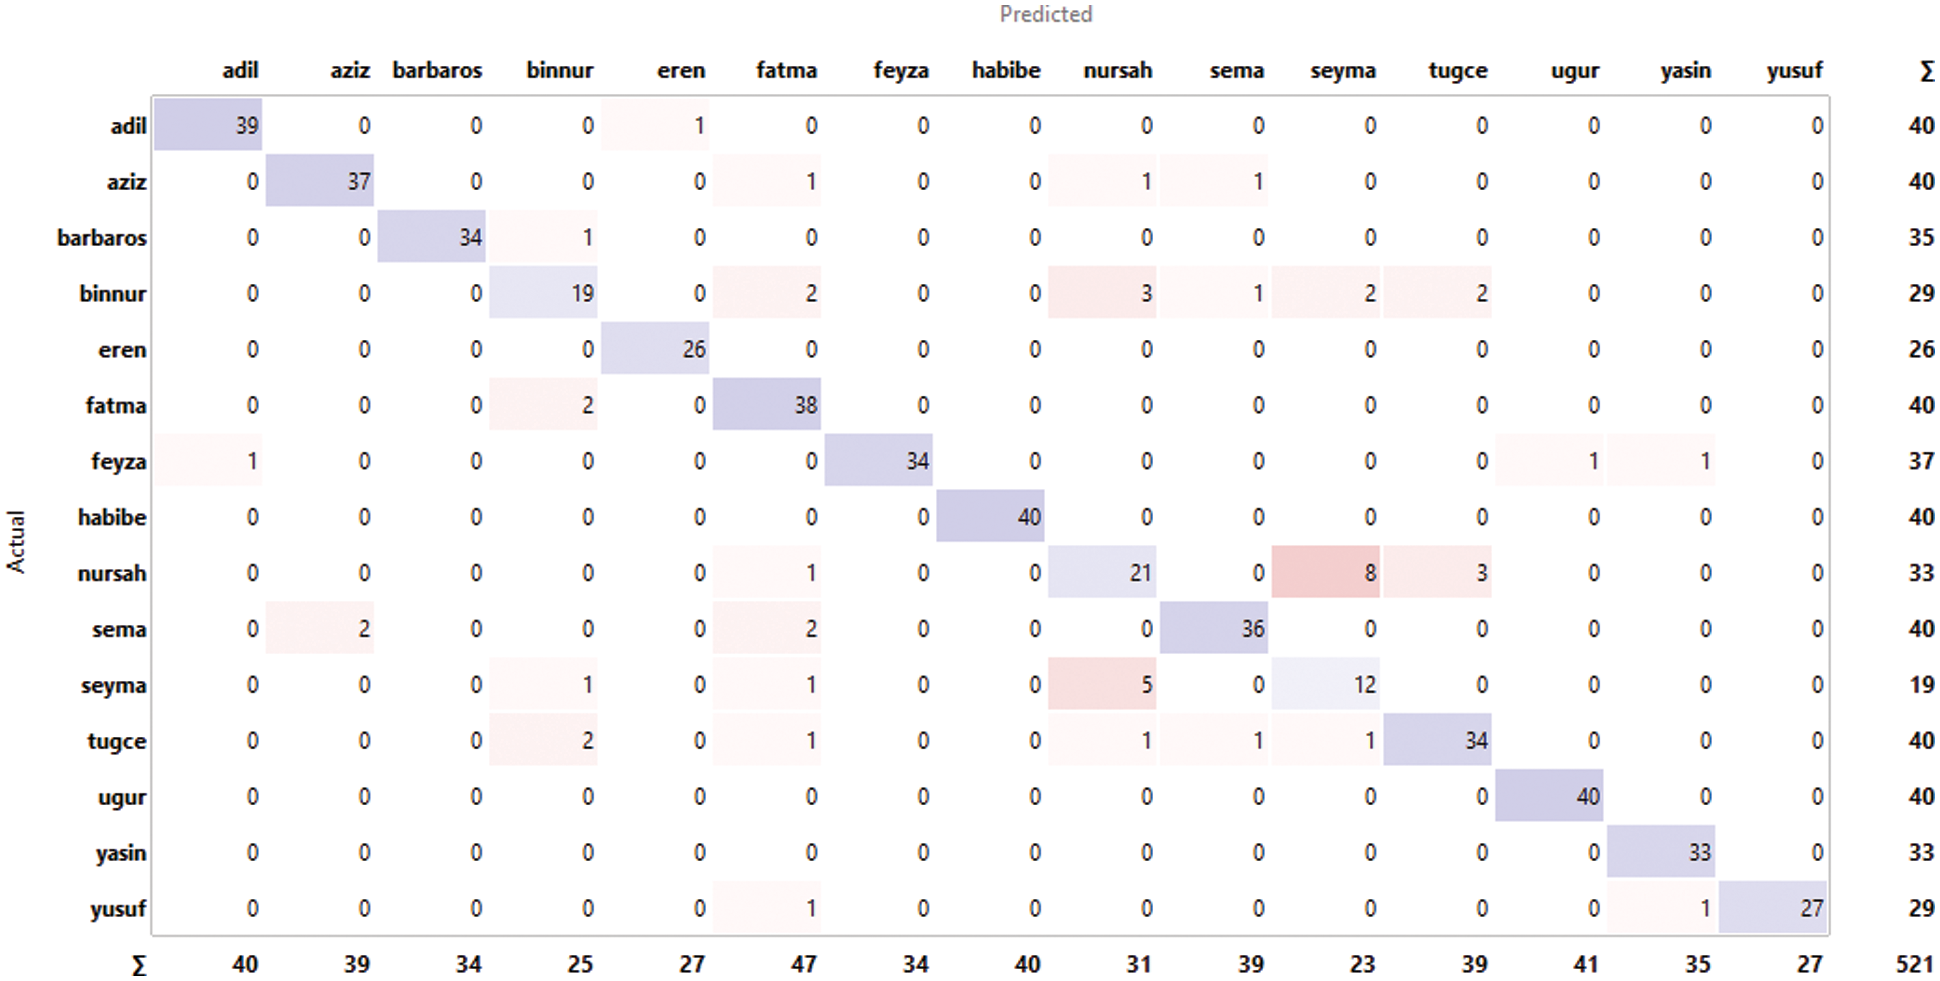
Figure 8: Confusion matrix of DNN classifier (64 × 64 neurons)

This was a preliminary study for the Turkish speaker recognition system. We introduced a new approach to speaker recognition using MFCCs. Mel spectrogram pixels are used instead of traditional MFCCs as our feature set. Although the feature size is larger and correlation is higher than MFCCs, our proposed model operates over DNN, which can handle complex and correlated dataset. And the near future, we are planning to develop a more robust model for use in real-time speeches. Since we are working with spectrograms, which having voice information, CNN model may be applicable in the future works. The Turkish speakers dataset produced in this study is a novel dataset. During the pandemic, we were unable to collect new data and conduct experiments on them. However, we aim to improve our dataset in the near future. The most important output of this study is the picture of human voice investigated as a new feature set. Therefore, we believe that the mel spectrograms may be used as voice fingerprints in the near future.
Acknowledgement: We thank our families and colleagues who provided us with moral support.
Funding Statement: This work was supported by the GRRC program of Gyeonggi province. [GRRC-Gachon2020(B04), Development of AI-based Healthcare Devices].
Conflicts of Interest: The authors declare that they have no conflicts of interest to report regarding the present study.
1. R. Bharti and P. Bansal, “Real time speaker recognition system using MFCC and vector quantization technique,” International Journal of Computer Applications, vol. 117, no. 1, pp. 25–31, 2015. [Google Scholar]
2. H. Geoffrey, L. Deng, D. Yu, G. Dahl, A. Mohamed et al., “Deep neural networks for acoustic modeling in speech recognition: The shared views of four research groups,” IEEE Signal Processing Magazine, vol. 29, no. 6, pp. 82–97, 2012. [Google Scholar]
3. S. Davis and P. Mermelstein, “Comparison of parametric representations for monosyllabic word recognition in continuously spoken sentences,” IEEE Transactions on Acoustics Speech and Signal Processing, vol. 28, no. 4, pp. 357–366, 1980. [Google Scholar]
4. A. Srinivasan, “Speaker identification and verification using vector quantization and mel frequency cepstral coefficients,” Engineering and Technology, vol. 4, no. 1, pp. 33–40, 2012. [Google Scholar]
5. V. Tiwari, “MFCC and its applications in speaker recognition,” International Journal on Emerging Technologies, vol. 1, no. 1, pp. 19–22, 2010. [Google Scholar]
6. J. C. Liu, F. Y. Leu, G. L. Lin and H. Susanto, “An MFCC-based text-independent speaker identification system for access control,” Concurrency and Computation: Practice and Experience, vol. 30, no. 2, pp. 1–16, 2018. [Google Scholar]
7. Z. Qawaqneh, A. A. Mallouh and B. D. Barkana, “Deep neural network framework and transformed MFCCs for speaker's age and gender classification,” Knowledge-Based Systems, vol. 115, pp. 5–14, 2017. [Google Scholar]
8. A. Maurya, D. Kumar and R. K. Agarwal, “Speaker recognition for hindi speech signal using MFCC-GMM approach,” Procedia Computer Science, vol. 125, pp. 880–887, 2018. [Google Scholar]
9. E. C. Djamal, N. Nurhamidah and R. Ilyas, “Spoken word recognition using MFCC and learning vector quantization,” Proceeding of the Electrical Engineering Computer Science and Informatics, vol. 4, pp. 250–255, 2017. [Google Scholar]
10. H. K. Palo, M. Chandra and M. N. Mohanty, “Recognition of human speech emotion using variants of mel-frequency cepstral coefficients,” in Advances in Systems, Control and Automation, Singapore: Springer, pp. 491–498, 2018. [Google Scholar]
11. O. Korkmaz and A. Atasoy, “Emotion recognition from speech signal using mel-frequency cepstral coefficients,” in 9th Int. Conf. on Electrical and Electronics Engineering (ELECO), Bursa, Turkey, pp. 1254–1257, 26–28 Nov. 2015. [Google Scholar]
12. S. Lalitha, D. Geyasruti, R. Narayanan and M. Shravani, “Emotion detection using MFCC and cepstrum features,” Procedia Computer Science, vol. 70, pp. 29–35, 2015. [Google Scholar]
13. J. Sangeetha and T. Jayasankar, “Emotion speech recognition based on adaptive fractional deep belief network and reinforcement learning,” Cognitive Informatics and Soft Computing, vol. 768, pp. 165–174, 2019. [Google Scholar]
14. S. Upadhya, A. Cheeran and T. Nirmal, “Multitaper MFCC and PLP voice features for early detection of Parkinson disease,” Biomedical Signal Processing and Control, vol. 46, pp. 293–301, 2018. [Google Scholar]
15. J. Lyons, “Python speech features,” 2018. [Online]. Available: https://github.com/jameslyons/python_speech_features. [Google Scholar]
16. L. Pawlaczyk, “Turkish speech corpus,” 2017. Available: http://www.voxforge.org/home/downloads. [Google Scholar]
17. Ö. Y. Vakfı, “40 turkish sentences selected by the free software foundation,” 2013. [Online]. Available: https://docs.google.com/document/d/1Aiott5CIm1o6KTAcjSVmufJFmKac4ZTiP9aYkDTN3eI/edit?usp=sharing. [Google Scholar]
18. N. Dave, “Feature extraction methods LPC, PLP and MFCC in speech recognition,” International Journal for Advance Research in Engineering and Technology, vol. 1, no. 6, pp. 1–4, 2013. [Google Scholar]
19. B. Syiem, F. Rynjah and L. J. Singh, “Homomorphic analysis of vowels in khasi dialect,” in Advances in Communication, Devices and Networking, Singapore: Springer, pp. 459–464, 2018. [Google Scholar]
20. R. Gupta, T. Chaspari, J. Kim, N. Kumar, D. Bone et al., “Pathological speech processing: State-of-the-art, current challenges and future directions, in IEEE Int. Conf. on Acoustics, Speech and Signal Processing (ICASSP), Shanghai, China, pp. 6470–6474, 20–25 March, 2016. [Google Scholar]
21. S. S. Sikarwar, D. Sharma and P. Dubey, “Design of fir filter through windowing method,” International Journal of Science Technology & Engineering, vol. 2, no. 11, pp. 392–395, 2016. [Google Scholar]
22. O. Ciaurri, T. A. Gillespie, L. Roncal, J. L. Torrea and J. L. Varona, “Harmonic analysis associated with a discrete laplacian,” Journal d'Analyse Mathématique, vol. 132, no. 1, pp. 109–131, 2017. [Google Scholar]
23. Ponraj, N. and M. Mercy, “Extraction of speech signal based on power normalized cepstral coefficient and mel frequency cepstral coefficient: A comparison,” in Int. Conf. on Electrical, Electronics and Optimization Techniques (ICEEOT), Chennai, India, pp. 1843–1846, 2016. [Google Scholar]
24. M. Brian, M. Matt, B. Stefan, T. Carl, L. Vincent et al., “Librosa/librosa: 0.6.0 (Version 0.6.0). zenodo,” 2018. [Online]. Avaialble: http://doi.org/10.5281/zenodo.1342708. [Google Scholar]
25. F. Borondics, F. Vitali and G. Shaulsky, “Orange3 data mining tool,” 2021. [Online]. Available: https://orange.biolab.si/. [Google Scholar]
26. N. Dave, “Feature extraction methods LPC, PLP and MFCC in speech recognition,” International Journal for Advance Research in Engineering and Technology, vol. 1, no. 6, pp. 1–4, 2013. [Google Scholar]
27. B. T. Pham, D. T. Bui, I. Prakash, L. H. Nguyenand M. B. Dholakia, “A comparative study of sequential minimal optimization-based support vector machines, vote feature intervals and logistic regression in landslide susceptibility assessment using GIS,” Environmental Earth Sciences, vol. 76, no. 10, pp. 371–374, 2017. [Google Scholar]
28. N. Zimmerman, A. A. Presto, S. P. Kumar, J. Gu, A. Hauryliuk et al., “A machine learning calibration model using random forests to improve sensor performance for lower-cost air quality monitoring,” Atmospheric Measurement Techniques, vol. 11, no. 1, pp. 291–313, 2018. [Google Scholar]
29. S. Savalia and V. Emamian, “Cardiac arrhythmia classification by multi-layer perceptron and convolution neural networks,” Bioengineering, vol. 5, no. 2, pp. 35–46, 2018. [Google Scholar]
 | This work is licensed under a Creative Commons Attribution 4.0 International License, which permits unrestricted use, distribution, and reproduction in any medium, provided the original work is properly cited. |