DOI:10.32604/cmc.2022.023211
| Computers, Materials & Continua DOI:10.32604/cmc.2022.023211 | |
| Article |
Twisted Pair Cable Fault Diagnosis via Random Forest Machine Learning
1Faculty of Electrical and Electronic Engineering, Universiti Tun Hussein Onn Malaysia, Batu Pahat, Johor
2TM Research & Development, Cyberjaya, Malaysia
*Corresponding Author: F.C. Seman. Email: fauziahs@uthm.edu.my
Received: 31 August 2021; Accepted: 16 November 2021
Abstract: Applying the fault diagnosis techniques to twisted pair copper cable is beneficial to improve the stability and reliability of internet access in Digital Subscriber Line (DSL) Access Network System. The network performance depends on the occurrence of cable fault along the copper cable. Currently, most of the telecommunication providers monitor the network performance degradation hence troubleshoot the present of the fault by using commercial test gear on-site, which may be resolved using data analytics and machine learning algorithm. This paper presents a fault diagnosis method for twisted pair cable fault detection based on knowledge-based and data-driven machine learning methods. The DSL Access Network is emulated in the laboratory to accommodate VDSL2 Technology with various types of cable fault along the cable distance between 100 m to 1200 m. Firstly, the line operation parameters and loop line testing parameters are collected and used to analyze. Secondly, the feature transformation, a knowledge-based method, is utilized to pre-process the fault data. Then, the random forests algorithms (RFs), a data-driven method, are adopted to train the fault diagnosis classifier and regression algorithm with the processed fault data. Finally, the proposed fault diagnosis method is used to detect and locate the cable fault in the DSL Access Network System. The results show that the cable fault detection has an accuracy of more than 97%, with less minimum absolute error in cable fault localization of less than 11%. The proposed algorithm may assist the telecommunication service provider to initiate automated cable faults identification and troubleshooting in the DSL Access Network System.
Keywords: Twisted pairs; random forest machine learning; cable fault; DSL
Worldwide fixed access technologies depend on fiber-optic and copper-wires technologies to deliver high-speed internet access to the end customers. Fiber-optic lines offer much higher data rates than copper wires that is becoming more common for bringing broadband Internet access to homes. However, with the latest DSL Technologies, internet access can offer up to 100Mbps within a specific distance. In Malaysia, the network dependencies on the fixed access technologies to Fiber to The Home (FTTH) and DSL is about 40% and 60%, respectively. The fiberisation national plan has increased to 70%, and that allows high-speed internet access using copper wires within less than 1.5 km distance to the fiber-optic backhaul, especially in the suburban area. The offered data speed using copper wires is also subjected to the cable conditions along the access network, and cable fault due to the impedance mismatch becomes the most concern. Therefore, the copper cable fault diagnosis, network monitoring, and qualification on the DSL access network systems are necessary to increase and maintain the network performance.
The popular copper line fault detection is based on Time Domain Reflectometry (TDR). The commercial test gear is normally attached to the copper line for line fault detection. TDR is a well-known method to measure the characteristics of the electrical lines, impedance of discontinuities as a function of time or distance, then reflection signal can be translated to determine the faults caused by a splice, cable transition, and mismatched cable connections [1]. This method is reliable to detect the fault type and localization; however, test gears are needed with manual intervention to the field site. In [2], a TDR simulator is proposed to assist loop diagnostics on copper twisted pairs based on the transmission line ABCD parameter modelling, which also needs on-site simulation and verification during DSL network maintenance and troubleshooting.
The loop diagnostics based on the scattering parameters at microwave frequencies allows the backscattering model for twisted pairs is established in [3], where local deterioration of transmission parameters, faults can be precisely localized and instantly addressed by comparing with a reference measurement. The copper cables transmission line characteristics based on the resistance, inductance, conductance, and capacitance per unit length (RLGC) circuit [4] are exploited to investigate the impact of cable bleeding of twisted pair towards the achievable bit rate. In [1], the copper line quality assessment process is proposed to assist the technical operation team and network access planner before deployment of the high-speed broadband services to the subscribers at High Speed Broadband (HSBB), Suburban Broadband (SUBB) or Rural Broadband (RBB) areas.
Recently, the technologically advanced techniques exploiting fault diagnosis approach based on machine learning. Feature extraction and clustering analysis become the framework of fault detection, classification, and localization, which are mapped based on the electrical signals along the cables [5]. In the case where the data clustering is capable of distinguishing ideal and faulty conditions, there is no need to implement an additional fault detection method. The data clustering can be performed based on unsupervised or supervised machine learning, where the algorithm interprets the input of data and discovering the group of data from the featured data. Automated analysis techniques [5,6] are demonstrated to detect, locate, and diagnose the fault using Support Vector Machine [7], Neural Network [8], and Random Forest [9].
In [10], an intelligent fault diagnosis machine learning method using random forests algorithms for a three-phase power-electronics energy conversion system based on knowledge-based and data-driven methods is developed. The slopes of two current trajectories of three-phase AC currents are adopted to train the fault diagnosis classifier based on a data-driven method (the random forest algorithm), which has the adaptive ability to different loads. In [9], a new Convolutional Neural Network (CNN) using the Random Forest (RF) classifier is proposed for hydrogen sensor fault diagnosis. The data-driven is established where the input 1-D time-domain data of fault signals are converted into 2-D gray matrix images, and later the features extraction by using CNN are processed into the random forest classifier. Analytical-driven based on the time-frequency domain reflectometry signals is proposed [11] to detect the presence and the location of a fault and further differentiates the faulty line within the multi-core control and Instrumentation (C&I) cables. Neural networks and the hierarchical clustering algorithm are used, and the algorithm is verified via experiments with four possible fault scenarios using automotive wires and C&I cables for nuclear power plants.
In the sequence to the fault localization, the conventional methods can be categorised into impedance focused methods and travelling wave based methods. Depending on the source of data, cable fault location methods may be further divided into single-ended technique and double-ended technique [5]. In [12], the performance of different regression methods, which are linear regression and regression trees, are developed on a hybrid power system. Different faults with random distances on the transmission line were simulated and a fault database was created by recording the current and voltage signals of these faults. The same applications are deployed in intelligent fault location [13] based on the integration of Artificial Neural Network (ANN) and fuzzy expert system called Adaptive Network-Based Fuzzy Inference System (ANFIS). The fault location error is very minimum, which are ANFIS network (0.0012), followed by Gaussian process regression (0.0684) and linear regression (0.4092).
From the literature studies that have been discussed earlier, the fault diagnosis tools on many applications have been established by using machine learning algorithms. However, the copper cable faults detection still relies on the manual detection by using on-site commercial test gear and to date, there is no established fault diagnosis that focuses on the DSL Access Network that has been discussed. The motivation of the work also considers that most of the telecommunication providers still troubleshoot the present of the cable fault by using commercial test gear on-site, which may be resolved using data analytics and machine learning algorithm and catered by the proposed diagnostic tools presented in here. In this paper, data-driven methods assisted with knowledge-driven methods are adopted to interpret the network parameters, which are gathered based on a single line testing in twisted pair cable for fault diagnosis. The DSL access network system is collected and used to analyze for initial observation. Later, based on the knowledge-based method, the featured data are extracted, which consists of line operation parameters (LOP) and loop line testing parameters (LLT). The processing data are trained into the random forest algorithms to determine the copper cable fault type and localization. The accuracy of the algorithm is analyzed, and the decision criteria based on the LOP and LLT are evaluated.
2 General Background on VDSL 2 Technologies
A typical VDSL2 network infrastructure consists of central office (CO), Multi-Service Access Network (MSAN), cabinet, distribution point (DP), and customer premises [14], as illustrated in Fig. 1. In the VDSL2 copper access networks, fiber cables become the backbone infrastructure that connects the CO and MSAN. The copper cables are laid between MSAN and the customer premises through the DP. The VDSL2 network cards and Plain Old Telephone Service Line (POTS) cards are integrated at MSAN, and this is the important key factor that allows both telephone and internet services to be offered using the same copper cables infrastructure [15]. This network topology is usually established at the suburban site where the capital expenditure of the telco needs to reflect the customer's populations in that particular area.
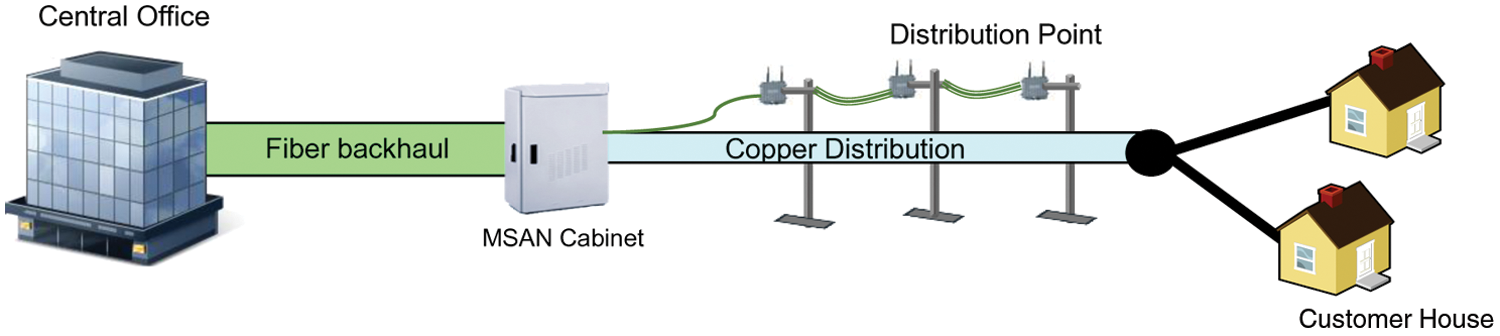
Figure 1: Experimental platform of DSL Access Network System
Very-High-Speed Digital Subscriber Line 2 (VDSL2) is a family of DSL Technologies that allow fast internet connection via legacy copper lines. VDSL 2 co-exist from VDSL and falls under International Telecommunication Union (ITU-T) G.993.2 [16]. There are several types of parameter profiles in VSDL2 technologies. In this paper, the VDSL2 Profile 17a was exploited, using modulation method of Discrete Multi-Tone (DMT), where data is carried in the 4095 tone spacing of 4.3125 kHz within a spectrum bandwidth of 17.664 MHz. The modulation technique allows a separation between the upstream and downstream data signals. This VDSL2 network configuration can support up to 100 Mbps data rates for distance up to 1.5 km [17]. However, the possible offered data rates is also affected by the nature of the copper cables itself where the attenuation degrades rapidly with distances and the presence of external electromagnetic interferences which leads to crosstalk. The most common cable faults caused by the imbalance impedance normally occur at the cable jointing and improper termination line at the customer premises. In the field site, these cable faults can be identified through manual inspection by using commercial test gears [18].
The cables faults that may occur in the copper loop will modify LLT parameters which consist of primary elements such are resistance and capacitance, and secondary parameters such as current and voltage [19,20]. In any case, where the cable faults are not severe, the internet service is still accessible by the subscriber, perhaps at lower data speed. In this case, the VDSL2 network conditions can be assessed from valid LOP parameters, which are the speed rate, attenuation, and signal to noise ratio (SNR) [21]. Note that the LOP and LLT will be used as the parameter attributes for the copper fault detection and localization. To date, there are not many papers emphasize the usage of machine learning for cable fault classification in the VDSL2 copper access network.
3 DSL Experimental Platform and Data Acquisition
The experimental platform DSL access network system shown in Fig. 2 consists of a traffic generator, MSAN, copper cable binder, and modems. The experimental platform is set up to imitate the actual deployment for the DSL access network system in the field site. Note that the cable binder contains ten unshielded twisted pairs (UTP Cat-3) which are connected to the 10 modems to represent the network termination at the customer premises. The cable faults are realized along the cable at the tag block or cable jointing. The raw data are gathered from MSAN using the command prompt Telnet script. These raw data are in text file (.txt format) and later processed into comma separated values file (.csv format) for data preparation.
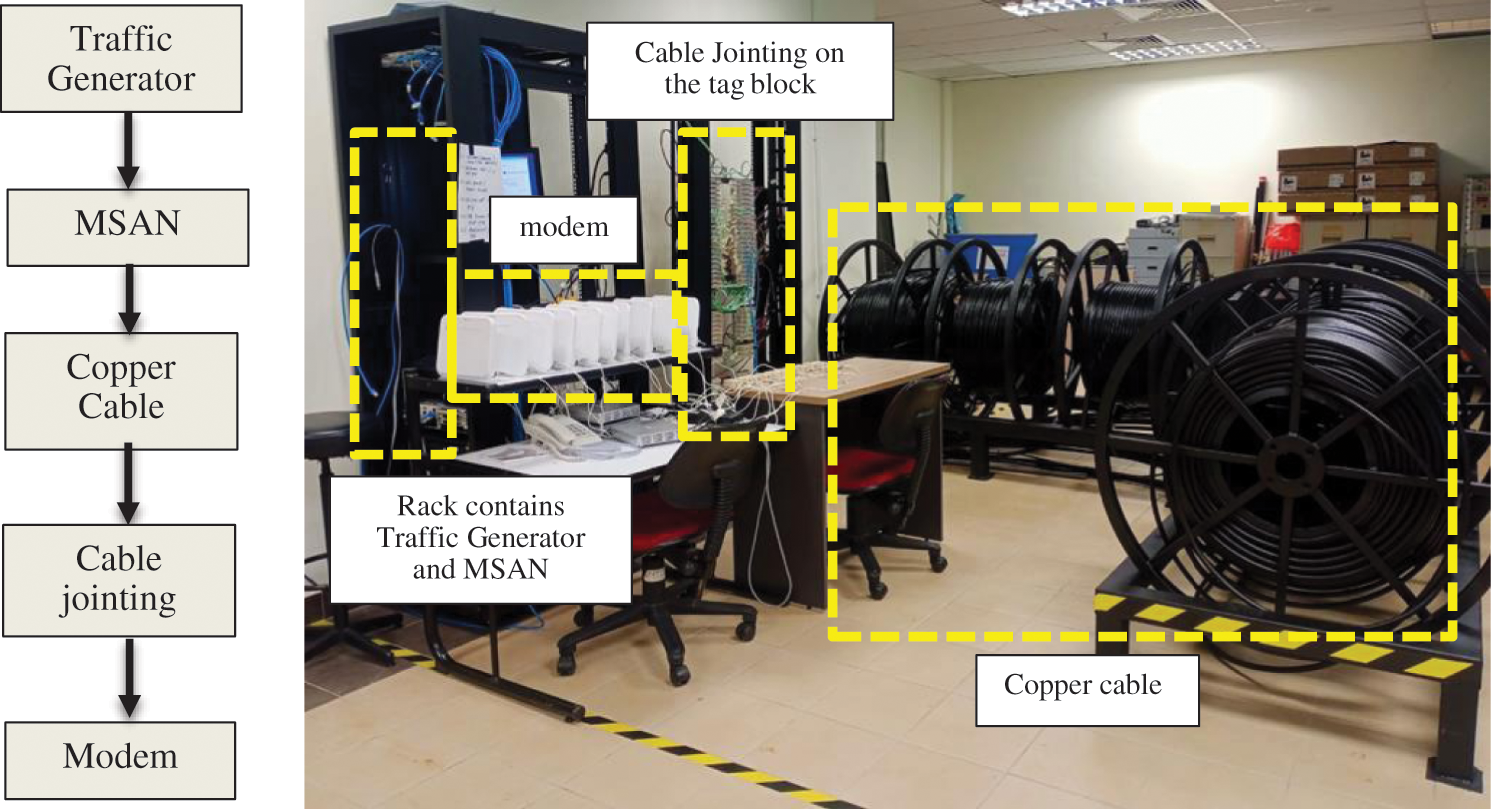
Figure 2: Experimental platform of DSL Access Network System
3.1 Twisted Pair RC Lumped Elements
The twisted pair can be modelled as the RLGC transmission line model. However, the transmission line model can be simplified as RC lumped components, where other available components are neglected in the electrical schematic due to insignificant changes when different types of cable faults are emulated. This is carried out when the initial data observation was conducted. The twisted pair consists of Tip (A) and Ring (A), and the resistive and capacitance components (RC) [22] as illustrated in Fig. 3. Each A and B is connected to the Ground (G), which are represented by component Resistances, RA-B, RA-G, and RB-G; and Capacitances, CA-B, CA-G, and CB-G. Each A and B component has the same component of RC for ideal cable condition but may change when the cable fault occurs along the line [23]. In MSAN, these components are categorized under LLT parameters. In the typical case where the internet data is accessible by the modem, the network performances are also provided by MSAN under LOP parameters.
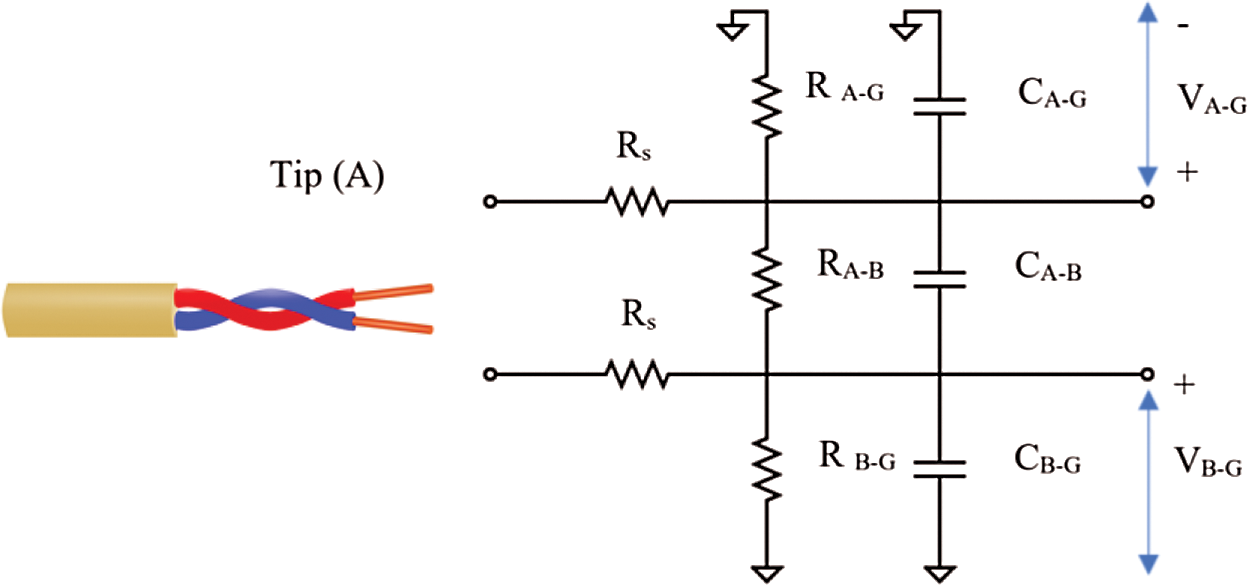
Figure 3: Twisted pair RC, Tip (A), Ring (B), and Ground (G) component based on RC lumped component elements
Cable fault imitation in the DSL Access Network can be imitated by understanding the scenario of the physical connection. In normal cases, the networks are in ideal condition without any cable fault occurrence where the access to the internet is at the optimum condition. Tab. 1 describes the scenario of the five copper cable faults that occur in the typical DSL Access Network. The cable faults are emulated at the cable jointing, which are conducted on the tag block. The standard practice in the telecommunication industry is to use commercial test gears to troubleshoot the present of the cable fault and its localization. For on-site installation and repair, the EXFO test gear is commonly used by the telco engineer to observe the DSL network performance, therefore here, the same test gear was used to verify the cable fault emulations conducted in the laboratory. This DSL copper cable test gear features the traditional copper measurements, which involve voltage, resistance, capacitance, and time domain reflectometry and also correlated with featured parameters given by MSAN. This testing is very important to make sure that the impairment emulations have the same characteristics as the actual cable fault existing in the field site.
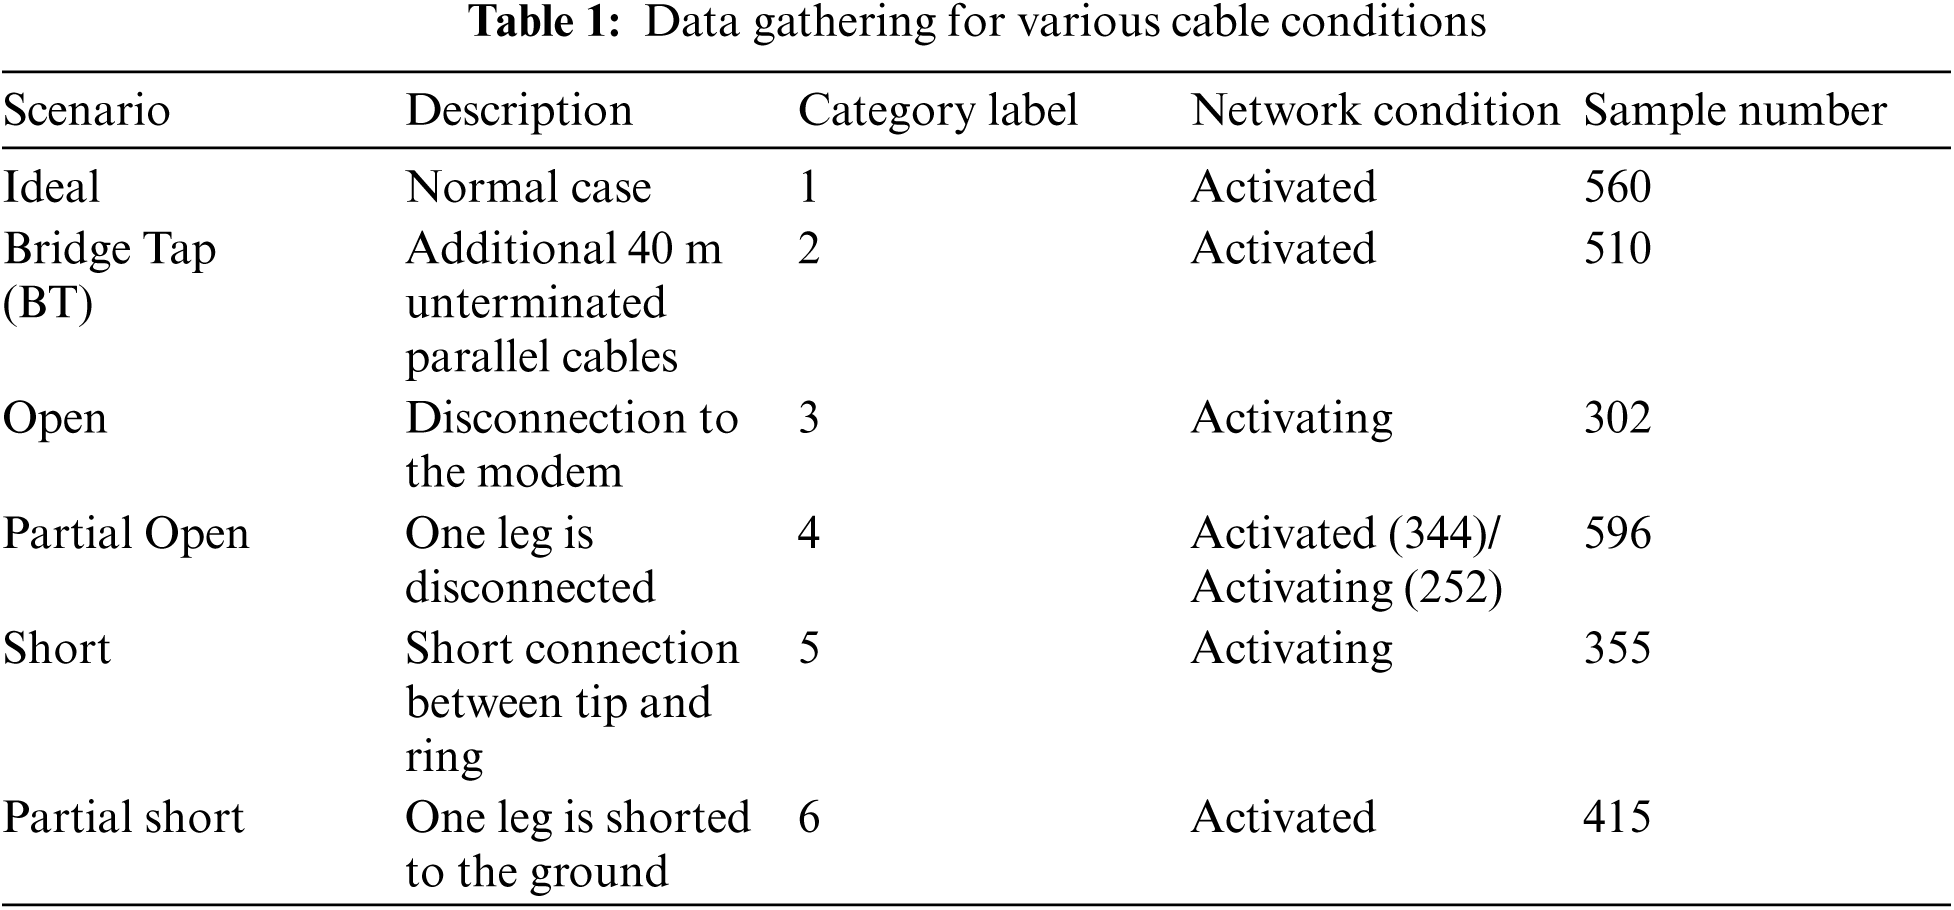
During the fault emulation, the group of data are labelled based on the scenario. Each of the cable faults would either degrades the internet speed, but the line condition is still in the ‘Activated’ mode or disrupts the network, causing the line condition in an ‘Activating’ mode. However, Partial open fault has triggered the network condition in both activated and activating mode, and this depends on how severe the fault is, especially in a longer cable length. In Activated mode, both LOP and LLT can be used as the dataset for the machine learning algorithm; however, in the activating mode, the internet access is disrupted, and only LLT is valid.
4 Realization of Fault Diagnosis Using Machine Learning
The overall flow chart of the fault diagnosis using machine learning algorithm is illustrated in Fig. 4. The algorithm consists of importing a dataset which is based on the featured parameters, data pre-processing, training the build algorithm, testing on the developed algorithm, and analysis of fault detection accuracy.
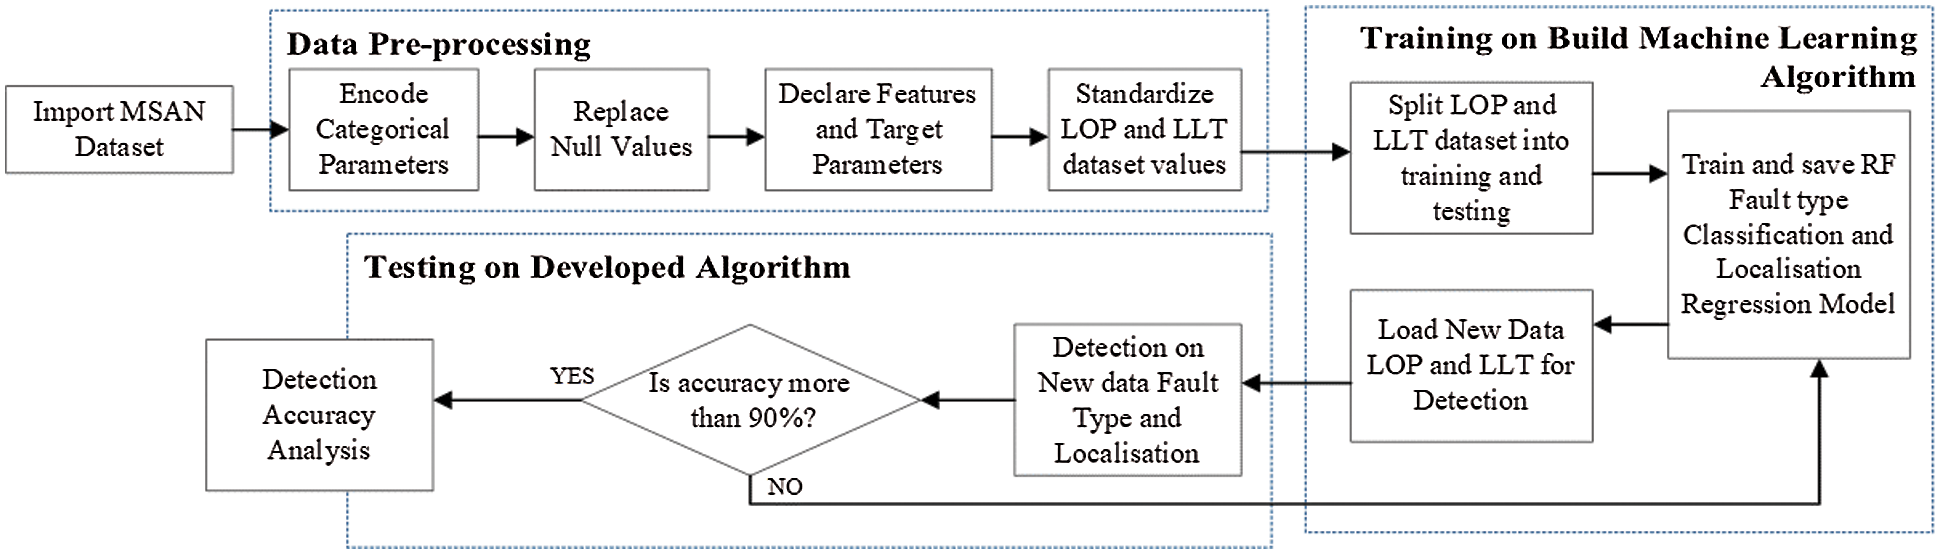
Figure 4: Flow chart of RF algorithm
4.1 Selection of Parameters and Pre-Processing
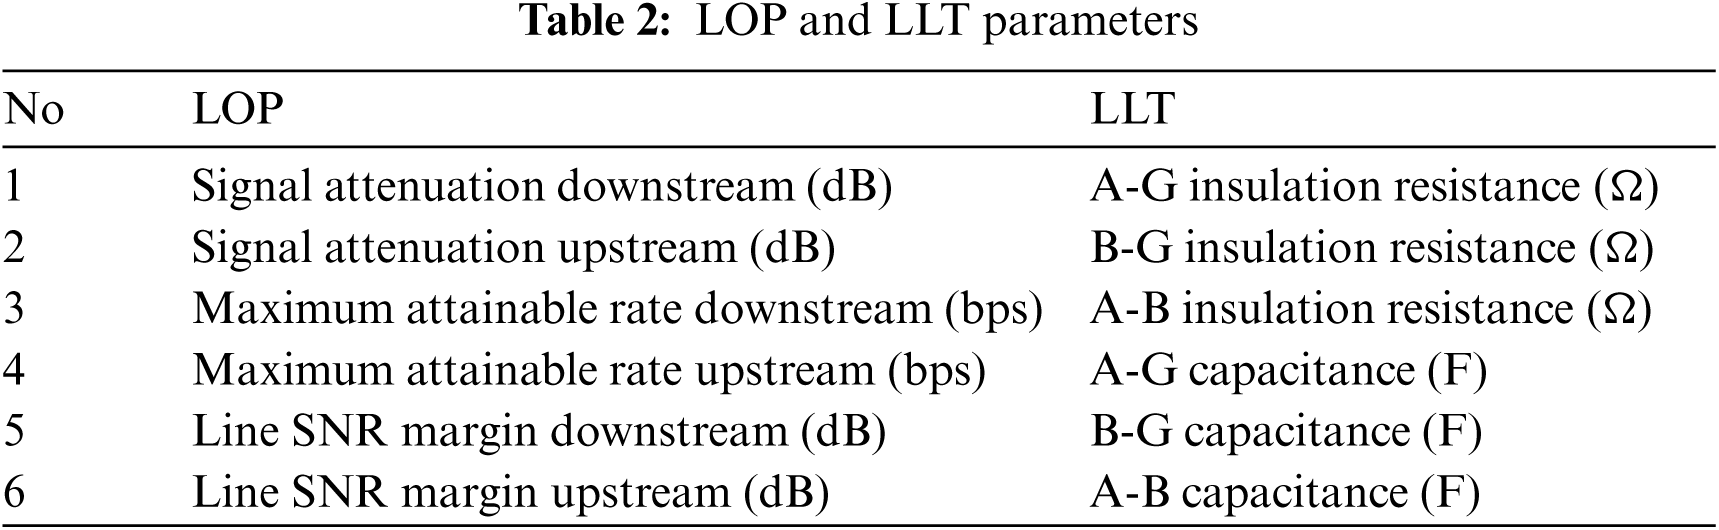
There are many primary parameters which is categorized as LLT parameters and LOP parameters, that are captured in MSAN during network operation. However, only the most significant parameters are selected for the cable fault detection by using feature important selection. Due to abbreviate the details of the important feature selection will not be discussed here. Out of all LLT and LOP parameters, only six LOP and LLT parameters are selected for cable fault detection and localization as tabulated in Tab. 2.
These parameters go through the data-preprocessing stage, which transforms the data into a suitable format for machine learning algorithms. The collected data are prepared, the categorical parameters and any invalid or missing data that may affect the accuracy are handled. The targeted parameters, which are the labelled fault type and localization, are determined. Depending on the presence of cable fault in the network, the line can be either in the activated or activating as explained in Section 3.2. For activating case, the LOP captured by MSAN is only historical data and is no longer valid to represent the current line condition. In some other cases as well, such as when cable fault is present such as short and partial short, the values of capacitance either A-G or B-G are not available. The same trend is applicable to the values of resistance A-G or B-G for open and partial open conditions. These parameters are replaced with a specific value beyond the actual values. The values of the parameters are also standardized within the range of features of the input data set.
4.2 Machine Learning Algorithm
Initially, there are several supervised machine learning classification algorithms that were explored using WEKA, which are Artificial Neural Network, Naïve Bays, Random Forest (RF), and k-Nearest Neighbor and Decision tree. WEKA is an open source software that was developed for data mining tasks using Java languages [24]. It contains tools for data preparation, classification, regression, clustering, association rules mining, and visualization which are very useful for initial machine learning exploration in many applications. At first, MSAN data were exported into WEKA software and the outcome showed that RF algorithm provided the highest accuracy which is about 80%. Therefore, RF algorithm is finalized for further development due to its better accuracy in classifying fault based on the electrical characteristics of the MSAN dataset. There are two algorithms developed for fault diagnosis. Firstly, the RF classifier is used to detect the fault type, secondly is the RF regression method, which is used to localize the location of the fault.
The RF algorithm is an ensemble learning method based on a decision tree. The split train test method of 70:30 is utilized. In a dataset, a training set is implemented to build up the algorithm, while a testing data set is to validate the model built. Out of 2738 datasets, each tree randomly selects 70% of training samples as a sub-training set. There are six features to be selected for an optimal feature from each split. Therefore, each tree can obtain training results according to different sub-training sets. Each input sample is determined separately, and the final classification is determined according to the voting results. Then the deployed RF model is reliable to classify in large datasets. In the case of fault localization, the averaging of the results of each decision tree is made. The accuracy of the model to detect impairment and localization are determined, and for the case, if the accuracy is less than 90%, the algorithm will be re-trained. The RF model is shown in Fig. 5.
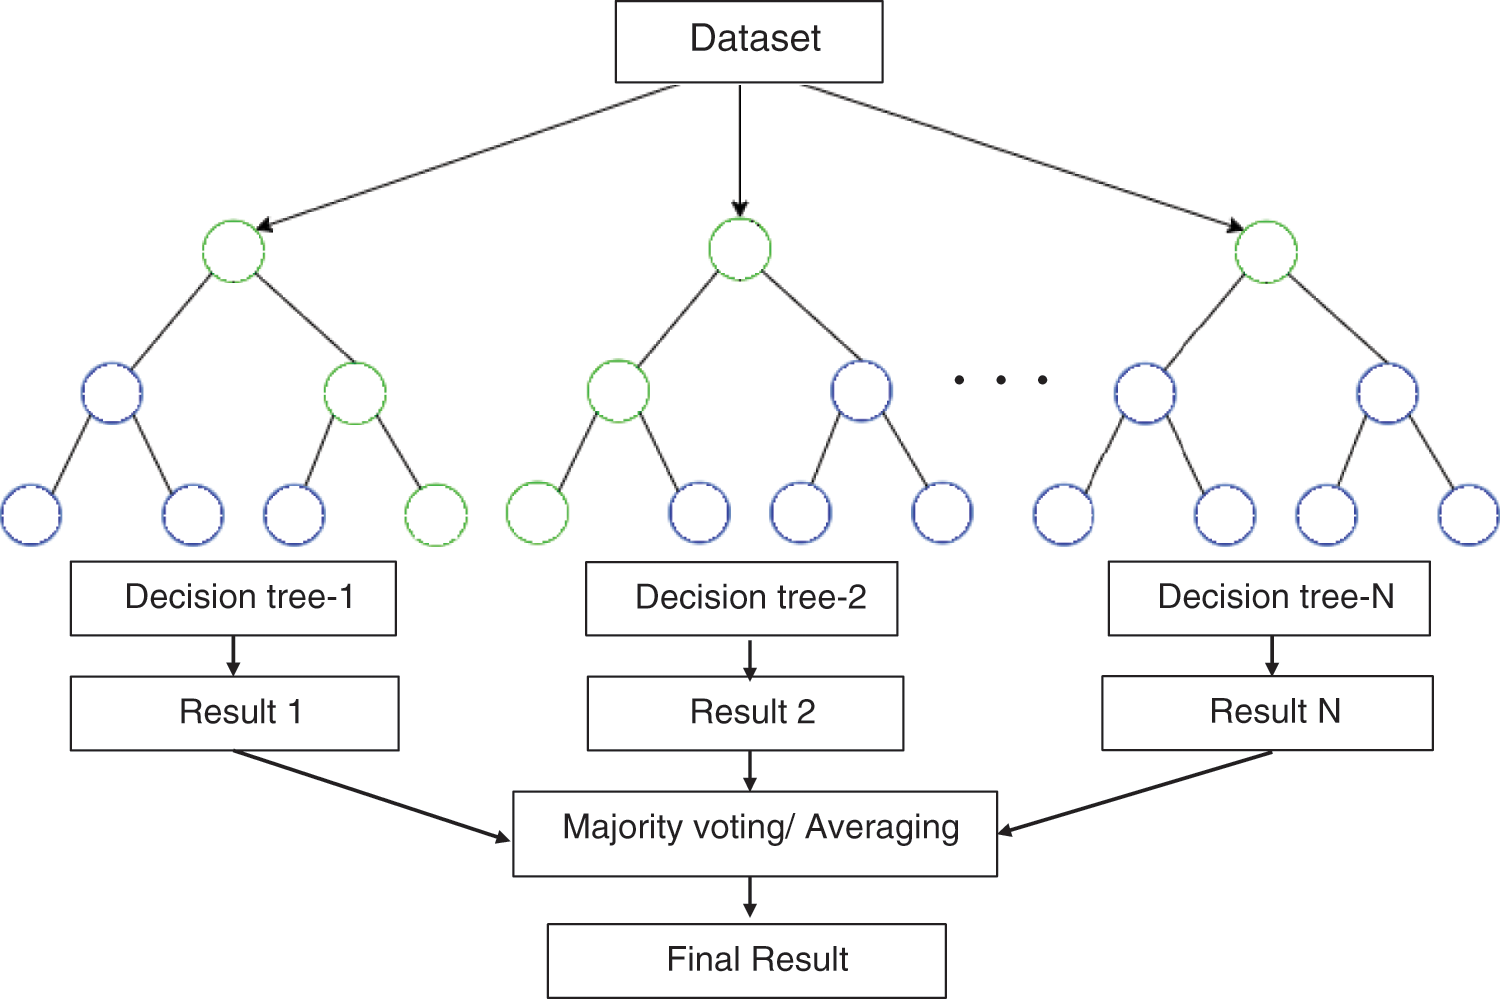
Figure 5: Flow chart of RF algorithm
The proposed cable fault diagnosis is conducted based on the knowledge-driven and data-driven. The knowledge-driven of the LLT and LOP parameters trending is carried out by observing the collected data. Then the accuracy fault detection and localization algorithm is carried out based on the data-driven.
Even though the fault detection location and localization algorithm are developed based on machine learning, the understanding of the data behavior is very important as it reflects the electrical characteristics of the lines. Fig. 6 shows samples of the features selection over the distance. These parameters are shown as it obviously illustrating the changes of LLT and LOP when the faults are emulated. Figs. 6a and 6b shows the maximum attainable inversely proportional with cable distance while the signal attenuation increases proportionally with cable distance. Both parameters show a linear correlation with distance despite outliers in the few cases, especially when the cable distance is less than 300 m. The maximum attainable rate of the line reaches more than 100 Mbps at 100 m distance and reduces to 30Mbps at 1000 m. This linear correlation can be represented by y = −47.21 x + 87300. In average, the attainable rate for BT condition is slightly 10% to 20% lower than the ideal condition. While for signal attenuation, the average signal attenuation is 5 dB at 100 m and gradually increases to 20 dB at 1000 m. The correlation also can be represented by y = 0.0143x + 5.6942. Note that both attainable rate and signal attenuation for ideal and BT cases are overlapping and need to depend on other features to differentiate. Fig. 6c illustrates the RA-G for Ideal case, BT case, Partial Short and Short case, and the parameter is not available for Partial Open and Open case. This is due to short and Partial Short conditions introduce an extremely low impedance at the cable jointing hence reflects the overall RA-G. This significant data trend is expected and used by the machine learning during dataset training. The similar trend is observed for CA-B where the data is not available for cable fault short and partial short as shown in Fig. 6d. Open and partial open conditions also produce an average 20% lower CA-B from Ideal and BT conditions. Fig. 6e is highlighted to show the trend of the CA-G. Note that the linear correlation, which is represented by y = 0.0595x – 6.777 for all cable conditions may be used to determine the fault localization in the regression techniques. Note that there are six LOP and LLT parameters are involved in the development of machine learning however, only five parameter selections are shown here due to distinct noticeable data pattern that can be observed to represent each fault type.
5.2 Performance of Cable Fault Detection Algorithm
Random forest algorithm is implemented for cable fault classification. The classification models are conducted using the Sklearn pickle model to load the trained dataset and later detect the new testing data. Tab. 3 shows the confusion matrix of the cable fault detection with Random Forest Classifier. The confusion matrix illustrates the classification results of all cable conditions in detail, including both classification and misclassification fault types. The top row of the confusion matrix represents the actual label of classification, whereas the first column represents the detected label, and the diagonal value of the confusion matrix up to the seventh column represents the matching or mismatching sample number between the actual and the detected condition.
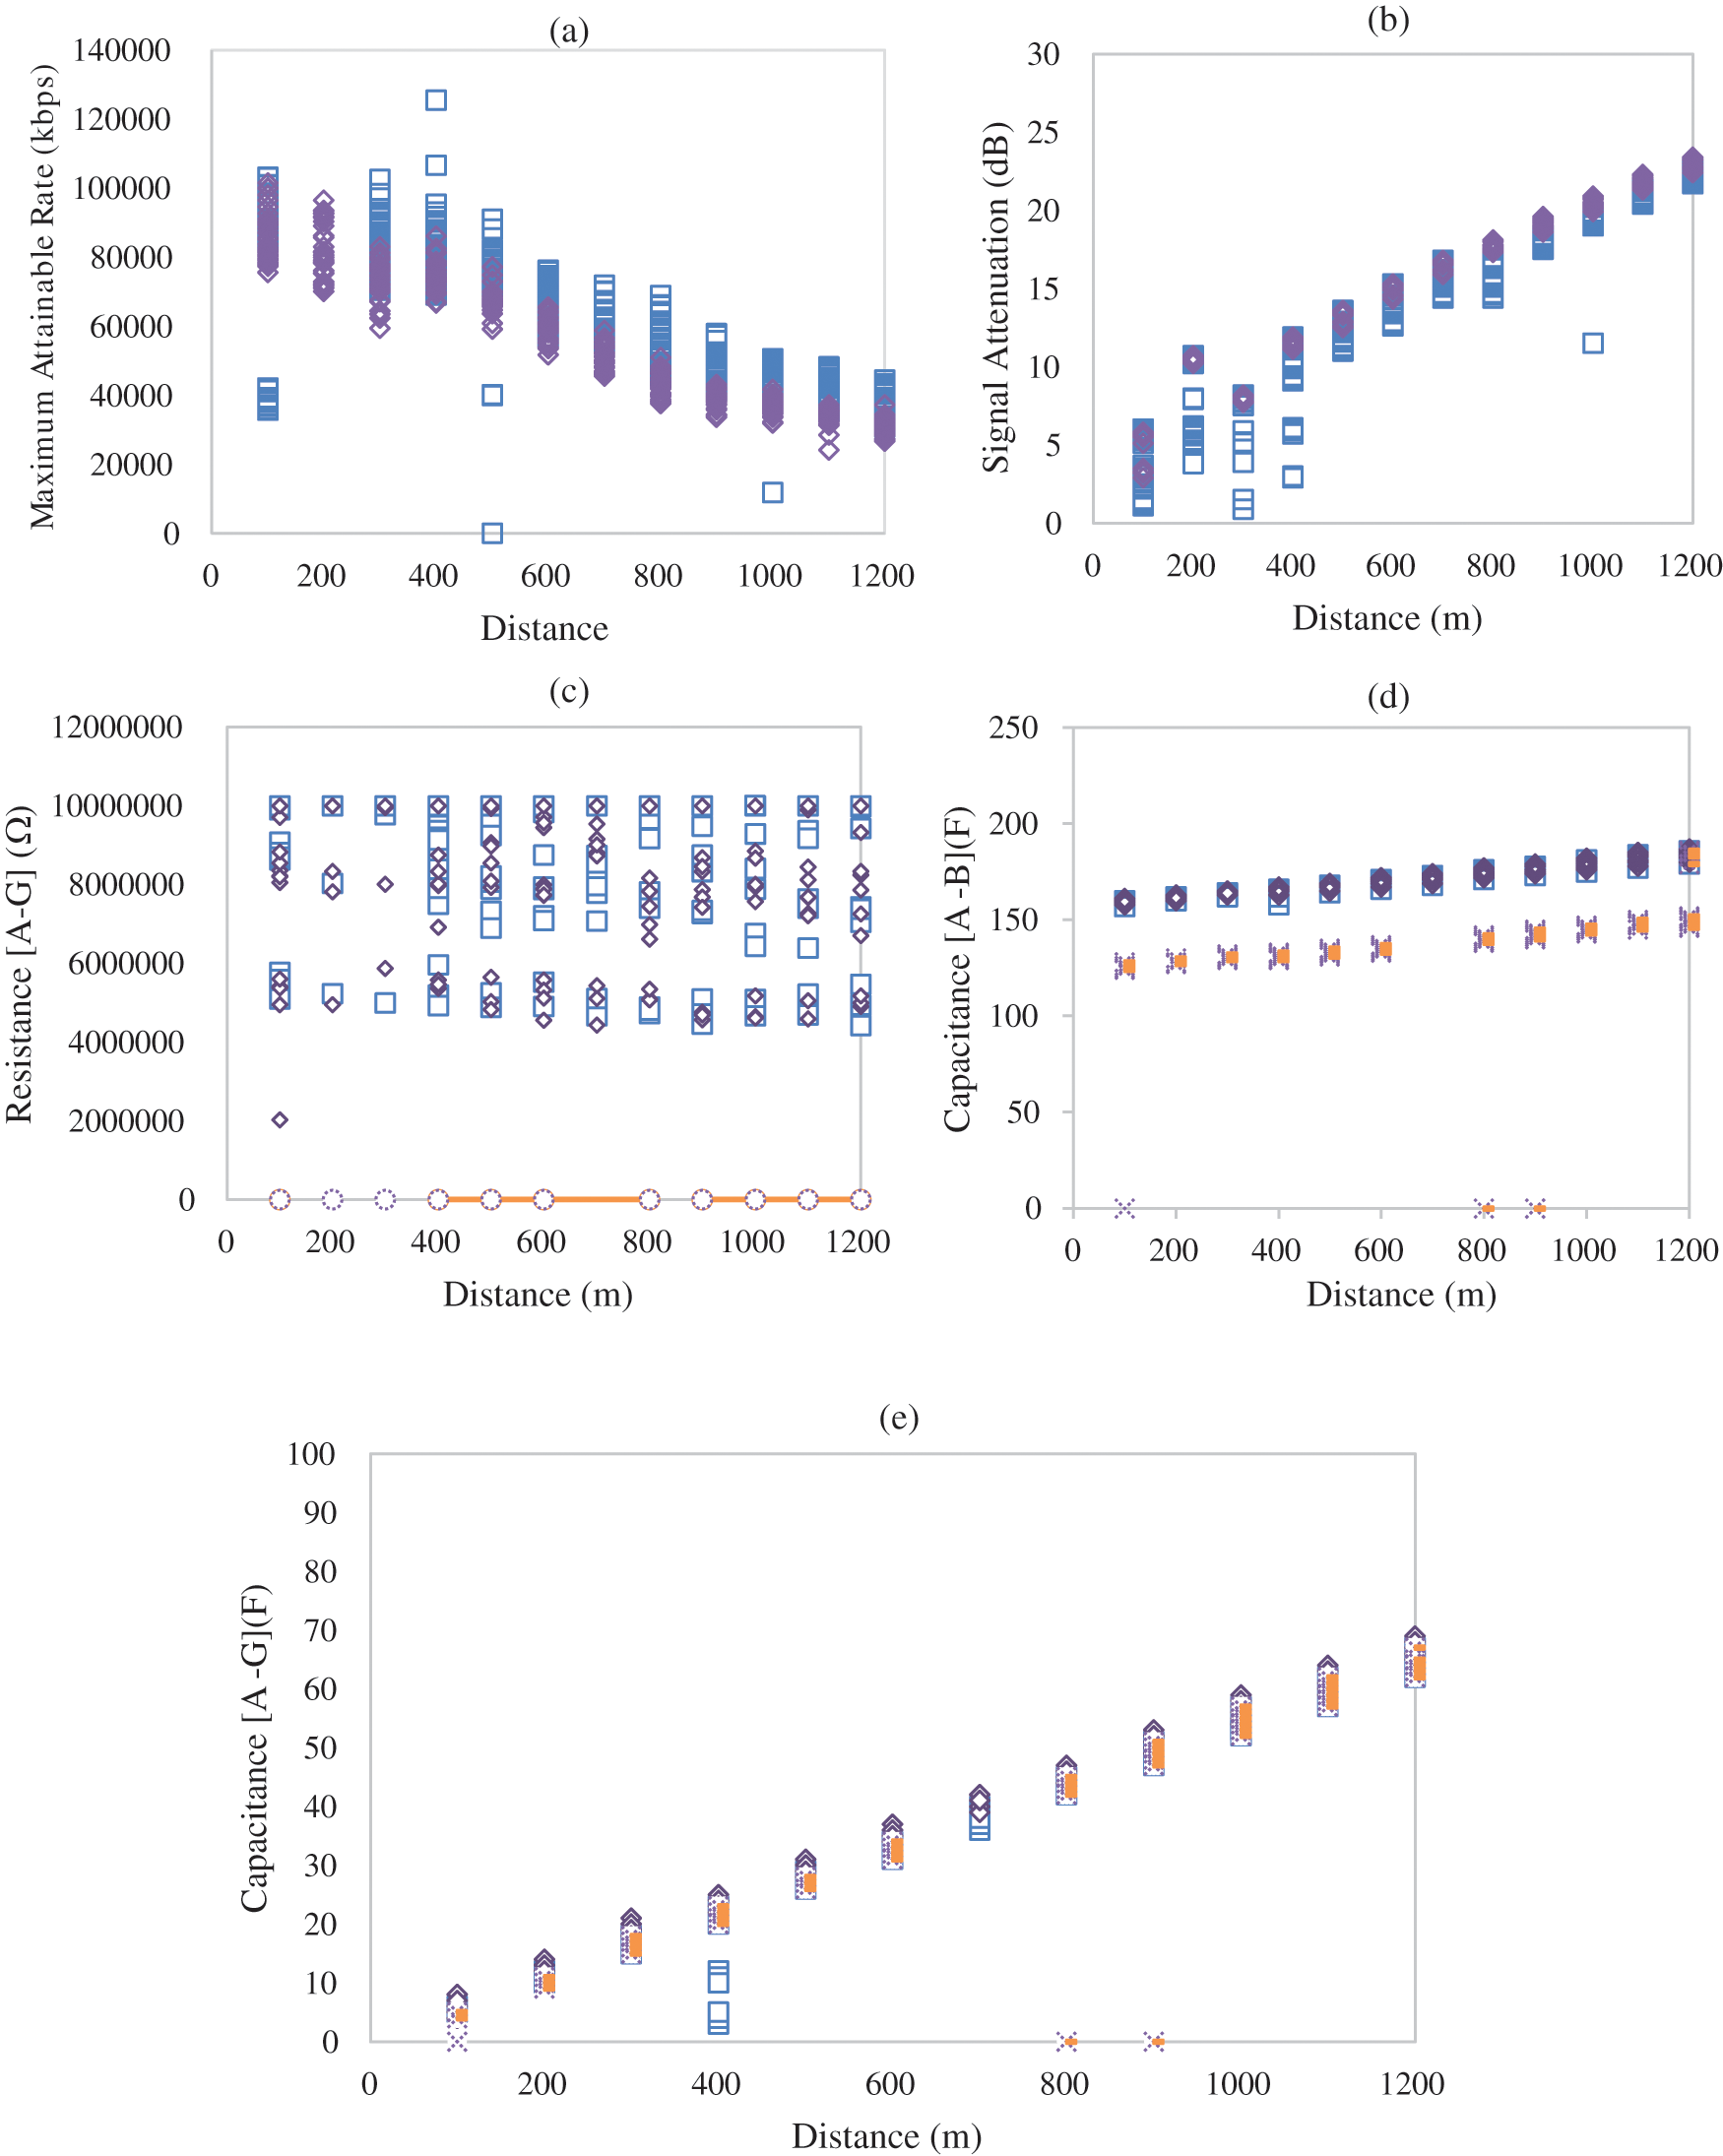
Figure 6: Selection of LLT and LOP parameters trend with cable faults; Ideal,  Bridge Tap
  , Short
  , Partial Short
  , Open
  and Partial Open
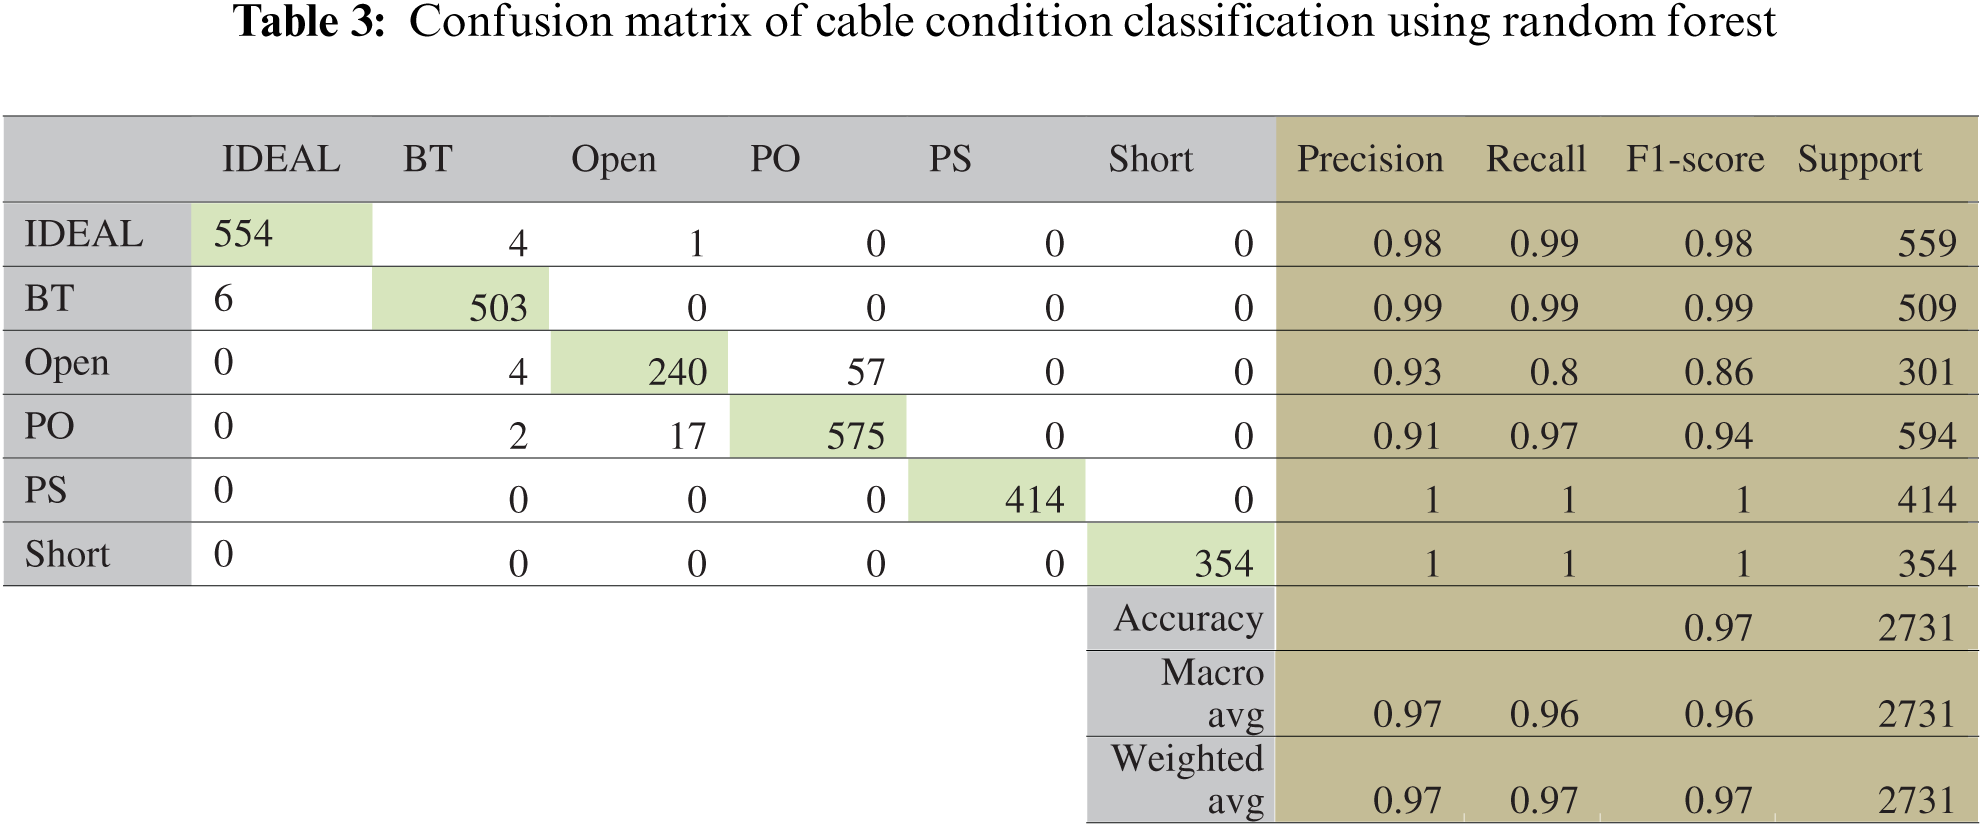
Tab. 3 shows the classification performance of the VDSL dataset that is done using the train-test split method function in python programming. The VDSL dataset samples are also split into 67% of the training dataset and 33% of the testing dataset. The classification of VDSL fault type gives out 97% using 2738 testing samples of VDSL data which each fault location sample are separated into distances up to 1200 m. The classifications of short and partial short fault types seem to result in higher accuracies; this is due to their quite distinct differences in parameter values such as RA-G as shown in Fig. 6c compared to bridge tap and ideal VDSL condition. The lowest precision is 91% and 93%, which occurs for open conditions and partial open. Despite this, the average accuracy of the proposed method, which is 97%, indicates that the proposed method is capable of cable fault diagnosis.
5.3 Performance of Cable Fault Localization Algorithm
The localization of the cable fault that may occur in the DSL Access Network is conducted in a separate machine learning algorithm which is the Random Forest regression algorithm. The regression model is conducted using the Sklearn pickle model to load the trained dataset and later detect the new testing data, which is similar to the detection algorithm. Note that for ideal condition, the length of the distance represents the actual of cable distance between MSAN and cable termination before the modem. While for other fault conditions it will represent the fault location distance from the MSAN. The accuracy of the localization is assessed from the scale-dependent metrics, which are Minimum Absolute Error (MAE), Minimum Absoluter Percentage Error (MAPE), and Root Mean Square Error (RMSE). MAE is a metric used to measure the average magnitude of the absolute errors between the predicted fault location and actual location. While for MAPE, the absolute errors are normalized to the actual location to give a percentage error. RMSE measures the average magnitude of error between the predicted fault location and actual location. Thus, RMSE is the average distance measured vertically from the actual value to the corresponding predicted value on the fit line. In comparison with MAE, the RMSE has a relatively high weight for large errors because the errors are squared before averaging, as shown in Tab. 4.
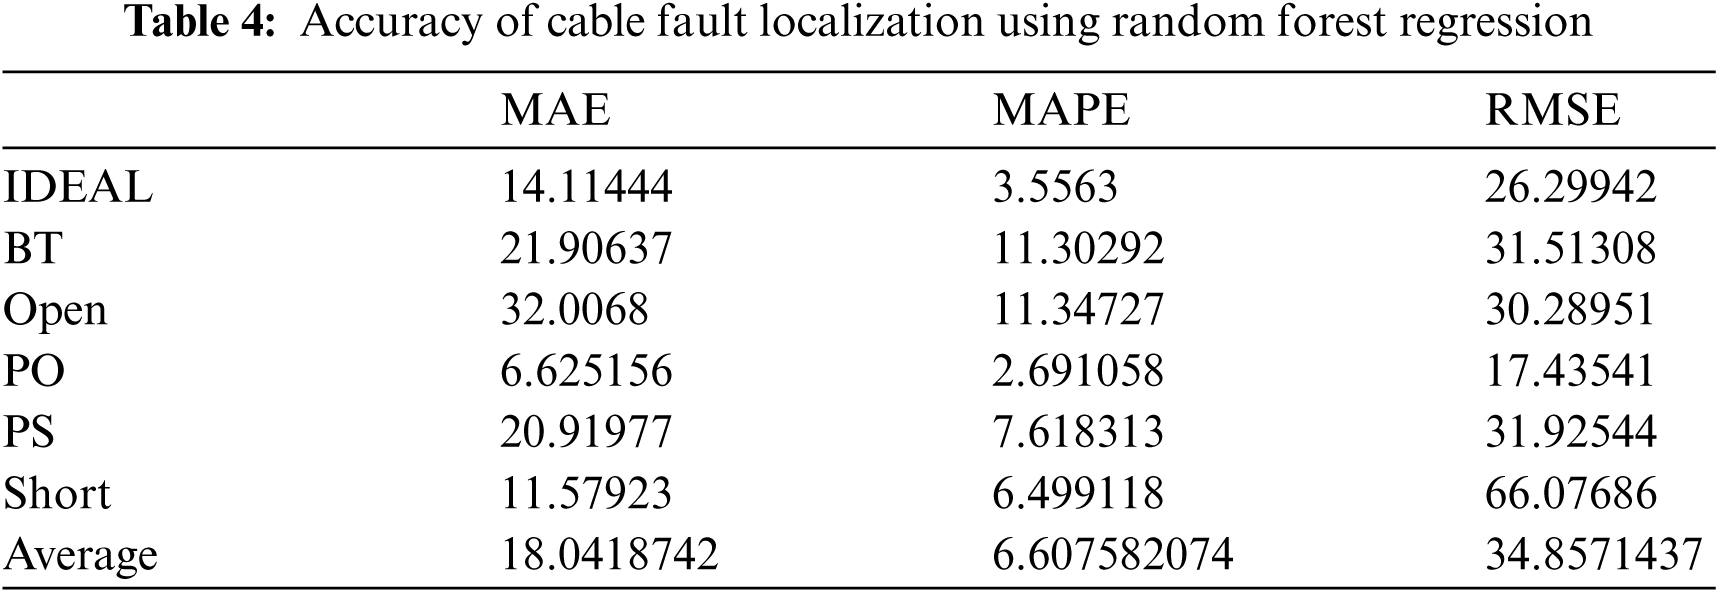
Tab. 4 also shows the average deviation of location based on MAPE for all cable faults is less than 6.6%. However, for Bridge Tap and Open faults, the accuracy of the cable fault localization is about 11%. The accuracies are measured based on the magnitude of error but do not indicate the direction of error.
5.4 Comparison with Other Diagnostic Tool on DSL Access Network
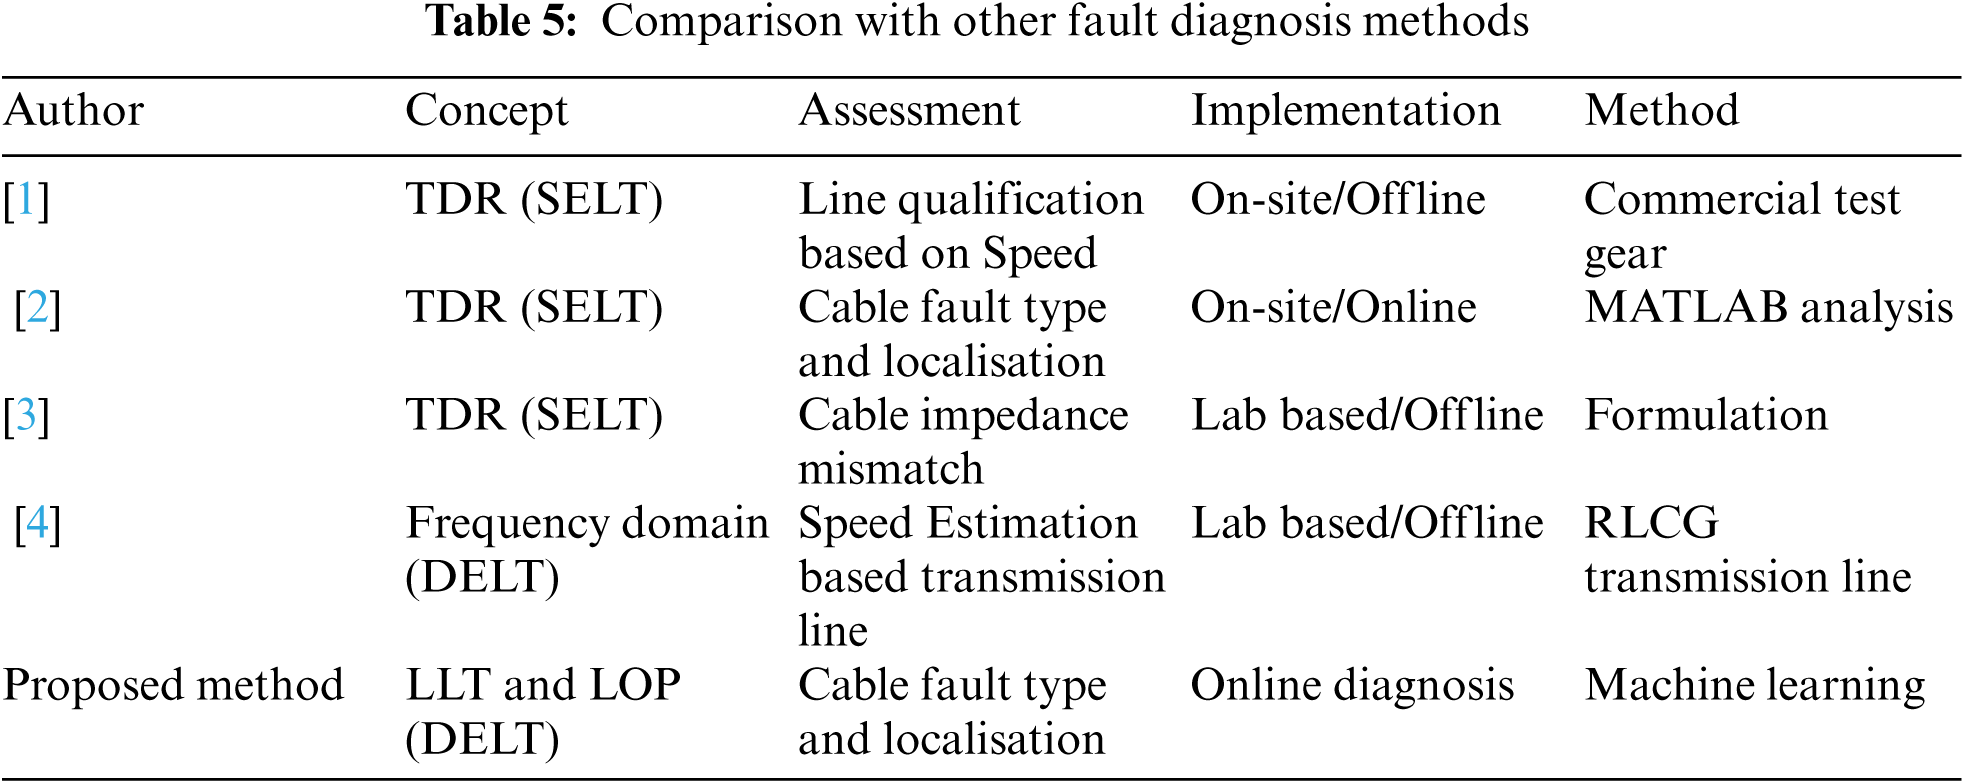
The coppers wires are vulnerable, prone to signal leakage and interference issues, the offered data speed using coppers wires is also subjected to the cable conditions along the access network and cable fault becomes the most concern. Therefore, the copper cable fault diagnosis, network monitoring, and qualification on the DSL access network systems are necessary. To evaluate the abilities of the proposed fault diagnosis method, the proposed method was compared with other diagnosis methods on DSL Access Network as shown in Tab. 5. The diagnostic tools that are based on TDR which also called Single Ended Loop Testing (SELT) provides high accuracy in the fault location identification, however it is a destructive testing where a disconnection to the existing network is required during the assessment. The frequency domain concept generally incurs Double Ended Loop Testing (DELT) where the cable tapping is needed on the starting point and the ending point of the network. Obviously, this is not practical for on-site testing. All above stated concepts also require prior domain knowledge during the assessment. The most significant difference between the previous methods and the proposed method are the utlisation on the machine learning method that (1) it can diagnose both offline and online fault cables; (2) it is nonintrusive and nondestructive method; and (3) it needs no prior domain knowledge.
In this paper, the copper cable faults classification and localization with Random Forest were carried out using Python programming. The results showed that the proposed machine learning algorithm able to provide accuracies up to 97% in the fault classification and average 6% difference in fault localization. Based on the existing literature, the accuracy is considered excellent for fault diagnosis. The proposed solution allows the telecommunication service's provider to troubleshoot the present of the cable fault online instead of relying on the commercial test gear on-site. In the future, the cable fault diagnosis may be extended by considering the possibilities of having multiple faults in the same cable.
Acknowledgement: The authors wish to acknowledge the funding received from Ministry of Science, Technology and Innovation Malaysia, and Research Management Centre (RMC) of Universiti Tun Hussein Onn Malaysia (UTHM), the research collaborator of the grant which is Telekom Malaysia Research and Development (R&D) Sdn Bhd. Communication of this research is made possible through monetary assistance by Universiti Tun Hussein Onn Malaysia and the UTHM Publisher’s Office via Publication Fund E15216.
Funding Statement: The authors received the funding from Smart Challenge Fund (SR0218I100) and GPPS Grant VOT H404, from Ministry of Science, Technology and Innovation Malaysia, and Research Management Centre (RMC) of Universiti Tun Hussein Onn Malaysia (UTHM)
Conflicts of Interest: The authors declare that they have no conflicts of interest to report regarding the present study.
1. N. Hashim, N. M. Yusoff, A. Amrin, A. Asrokin and A. N. Z. Abidin, “Copper line Pre-qualification assessment for high-speed broadband in Malaysia,” Journal of Advanced Research in Applied Mechanics, vol. 3, no. 1, pp. 20–26, 2020. [Google Scholar]
2. T. C. Chuah, Y. H. Ng, N. Hashim, A. N. Z. Abidin and A. Asrokin, “Virtual signal-integrity verification tool for copper twisted-pairs using TDR,” IET Science, Measurement & Technology, vol. 13, no. 2, pp. 231–237, 2019. [Google Scholar]
3. A. Fertner, P. O. Borjesson, M. Berg, D. Cederholm and P. Odling, “Backscattering in twisted-pair nonhomogeneous transmission lines,” IEEE Transactions on Microwave Theory and Techniques, vol. 66, no. 6, pp. 2674–2682, June 2018. [Google Scholar]
4. C. K. A. C. K. Alam, F. Che Seman, A. Asrokin and N. Nohan, “Impact of cable bleeding into RLCG of twisted pair copper cable and achievable Bit rate,” in Proc. 7th Int. Conf. on Computer and Communication Engineering (ICCCE), Malaysia, pp. 1–6, 2018. [Google Scholar]
5. K. Chen, C. Huang and J. He, “Fault detection, classification and location for transmission lines and distribution systems: A review on the methods,” High Voltage, vol. 1, pp. 25–33, 2016. [Google Scholar]
6. A. Raza, A. Benrabah, T. Alquthami and M. Akmal, “A review of fault diagnosing methods in power transmission systems,” Applied Sciences, 2020, vol. 10, no. 4, pp. 1312, 2020. [Google Scholar]
7. K. Luo and Y. Jiao, “Automatic fault detection of sensors in leather cutting control system under GWO-SVM algorithm,” PLOS ONE, vol. 16, no. 3, pp. 1–24, 2020. [Google Scholar]
8. H. Kim, H. Jeong, H. Lee and S. W. Kim, “Online and offline diagnosis of motor power cables based on 1D CNN and periodic burst signal injection,” Sensors, vol. 21, no. 5936, pp. 2–18, 2021. [Google Scholar]
9. Y. Sun, H. Zhang, T. Zhao, Z. Zou, B. Shen et al., “A new convolutional neural network with random forest method for hydrogen sensor fault diagnosis,” IEEE Access, vol. 8, pp. 85421–85430, 2020. [Google Scholar]
10. W. C. Wang, L. Kou, Q. D. Yuan, J. N. Zhou, C. Liu et al., “An intelligent fault diagnosis method for open-circuit faults in power-electronics energy conversion system,” IEEE Access, vol. 8, pp. 221039–221050, 2020. [Google Scholar]
11. C. K. Lee and S. Chang, “Fault detection in multi-core C&I cable via machine learning based time-frequency domain reflectometry,” Applied Sciences, vol. 10, no. 158, pp. 221039–221050, 2019. [Google Scholar]
12. S. Ekici, F. Unal and U. Ozleyen, “Comparison of different regression models to estimate fault location on hybrid power systems,” IET Generation. Transmission Distribution, vol. 13 pp. 4756–4765, 2019. [Google Scholar]
13. M. R. Mustari, M. N. Hashim, M. K. Osman, A. R. Ahmad, F. Ahmad et al., “Fault location estimation on transmission lines using neuro-fuzzy system,” Procedia Computer Science, Vol. 163, pp. 591–602, 2019. [Google Scholar]
14. F. Mazzenga and R. Giuliano, “Analytical framework for preliminary planning of very high-speed digital subscriber line access networks,” Information, vol. 8, no. 3, pp. 86, 2017. [Google Scholar]
15. B. Handley, “Multi-service access nodes(MSANsGateways to next-generation network (NGN)”, Fujitsu Scientific & Technical Journal, vol. 42, no. 4, pp. 432–438, 2006. [Google Scholar]
16. N. Norhan, A. C. M. Nuroddin and A. Asrokin, “VDSL2 capacity performance evaluation: Simulation vs measurement,” in 2017 IEEE Conf. on Systems, Process and Control (ICSPC), vol. 2017, pp. 140–145, 2017. [Google Scholar]
17. Anonymous, G.992.1 : Asymmetric digital subscriber line (ADSL) transceivers, International Telecommunication Union (ITU1999. [Online]. Available: https://www.itu.int/rec/T-REC-G.992.1-199907-I/en. [Google Scholar]
18. K. J. Kerpez and R. Kinney, “Integrated DSL test, analysis, and operations,” IEEE Transactions on Instrumentation and Measurement, vol. 57, no. 4, pp. 770–780, April 2008. [Google Scholar]
19. W. Cao, G. Ke, L. Zhang and F. Huang, “A novel testing method of twisted-pair primary parameter,” in Second Int. Conf. on Instrumentation, Measurement, Computer, Communication and Control, Harbin, China, pp. 104–107, 2012. [Google Scholar]
20. A. Begović, N. Škaljo and N. Behlilović, “On using various local loop types in recent VDSL applications,” in 2017 Int. Symp. ELMAR, pp. 189–192, 2017. [Google Scholar]
21. C. C. Yang, C. Chen, D. Lu, X. Wu and R. Savoor, “Method and system of performance monitoring to detect VDSL service degradation,” in 2010 Int. Conf. on Cyber-Enabled Distributed Computing and Knowledge Discovery, Huangshan, China, pp. 468–475, 2010. [Google Scholar]
22. G. Bousaleh, F. Hassoun and A. Jammal, “New method for analyzing the quality of a telephone network,” in 2010 15th IEEE Mediterranean Electrotechnical Conf., Valletta, Malta, pp. 647–653, 2010. [Google Scholar]
23. E. Rousselot, Guide to the Last Mile A Benchmark for VDSL Testing, Pennsylvania: Megger Group Limited, 2020. [Online]. Available at: https://cdn.thomasnet.com/ccp/00145012/54340.pdf. [Google Scholar]
24. Ian H. Witten, M. A. Hall and C. J Pal. “Data Mining: Practical Machine Learning Tools and Techniques,” in Morgan Kaufmann, Saint Louis: Elsevier Science, Fourth Edition, 2016. [Google Scholar]
 | This work is licensed under a Creative Commons Attribution 4.0 International License, which permits unrestricted use, distribution, and reproduction in any medium, provided the original work is properly cited. |