DOI:10.32604/cmc.2022.022322
| Computers, Materials & Continua DOI:10.32604/cmc.2022.022322 | |
| Article |
Automated Deep Learning Empowered Breast Cancer Diagnosis Using Biomedical Mammogram Images
1Electronics and Telecommunications Engineering Program, Universidad Autónoma del Caribe, Barranquilla, 08001, Colombia
2Department of Mathematics, Faculty of Science, New Valley University, El-Kharga, 72511, Egypt
3Mechatronics Engineering Program, Universidad Autónoma del Caribe, Barranquilla, 08001, Colombia
4Department of Computational Science and Electronic, Universidad de la Costa, CUC, Barranquilla, 08001, Colombia
*Corresponding Author: José Escorcia-Gutierrez. Email: jose.escorcia23@gmail.com
Received: 04 August 2021; Accepted: 06 September 2021
Abstract: Biomedical image processing is a hot research topic which helps to majorly assist the disease diagnostic process. At the same time, breast cancer becomes the deadliest disease among women and can be detected by the use of different imaging techniques. Digital mammograms can be used for the earlier identification and diagnostic of breast cancer to minimize the death rate. But the proper identification of breast cancer has mainly relied on the mammography findings and results to increased false positives. For resolving the issues of false positives of breast cancer diagnosis, this paper presents an automated deep learning based breast cancer diagnosis (ADL-BCD) model using digital mammograms. The goal of the ADL-BCD technique is to properly detect the existence of breast lesions using digital mammograms. The proposed model involves Gaussian filter based pre-processing and Tsallis entropy based image segmentation. In addition, Deep Convolutional Neural Network based Residual Network (ResNet 34) is applied for feature extraction purposes. Specifically, a hyper parameter tuning process using chimp optimization algorithm (COA) is applied to tune the parameters involved in ResNet 34 model. The wavelet neural network (WNN) is used for the classification of digital mammograms for the detection of breast cancer. The ADL-BCD method is evaluated using a benchmark dataset and the results are analyzed under several performance measures. The simulation outcome indicated that the ADL-BCD model outperforms the state of art methods in terms of different measures.
Keywords: Breast cancer; digital mammograms; deep learning; wavelet neural network; Resnet 34; disease diagnosis
Cancer is a disease which arises if anomalous cell grows in an uncontrolled way which disregards the average rules of cell partition that might create uncontrolled proliferation and growth of the anomalous cell. This could be fatal when the proliferation is permitted to spread and continue in this manner will result in metastases development [1]. Breast cancer form in a similar manner and generally start in the glands which create breast milk or in the duct which carries milk to the nipple. Cell in the breast starts to develop in an uncontrollable way and forms a lump which could be detected/felt by the mammograms. Breast cancer is a common cancer amongst women and another reason of cancer interrelated mortalities widespread amongst them [2]. The deaths rate amongst females is about 40% among 1989 and 2016, and since 2007, the mortality rate in young females are gradually reducing in elder females because of earlier recognition via screening, better treatment, and increased awareness [3]. Mammography, i.e., executed at reasonable X-ray photon energy, is generally utilized for screening breast cancers. When the screening mammograms displayed abnormalities in the breast tissue, diagnostic mammograms are commonly suggested for additional investigating of the suspected regions. The initial symptom of breast cancer is generally a lump in the underarm/breast which doesn’t go after the period. Commonly, this lump could be identified by screening mammography well in advance the person could note them when this lump is tiny to do any noticeable variations to the person. Various researches have displayed that utilizing mammography as an earlier recognition approach for breast cancer.
Computer aided detection and diagnosis (CAD) systems are now being utilized for offering essential support in making decision procedures of radiotherapists. This system might considerably decrease the number of efforts required to the calculation of cancer in medical practice when minimizing the amount of false positives which result in discomforting and unnecessary biopsies. CAD system about mammography might tackle 2 distinct processes: diagnosis of detected lesions (CADx) and detection of suspected lesion in a mammogram (CADe), viz., classifications as malignant/benign [4]. In recent years, Deep learning (DL) is considered an advanced technique since it has shown performances beyond the advanced in several machine learning tasks includes object classification and detection. Different from traditional ML techniques that need a handcrafted feature extraction phase, i.e., stimulating since it is based on areas of interest, DL approaches adaptively learns the suitable feature extraction procedure from the input data regarding the target output. This removes the difficult task of investigating and engineering the discriminations capability of the features when enabling the reproducibility of the methods. As the development of DL approach, several studies were published using deep frameworks [5–10]. The more frequent kind of DL framework is the convolutional neural network (CNN). The research was performed on the BCDR-FM datasets. Also, they stated efficiency development using the integration of learned and handcrafted depictions.
This paper presents an automated deep learning based breast cancer diagnosis (ADL-BCD) model using digital mammograms. The proposed model involves Gaussian filter based pre-processing and Tsallis entropy based image segmentation. In addition, Deep Convolutional Neural Network based Residual Network (ResNet 34) is applied for feature extraction purposes. Specifically, a hyper parameter tuning process using chimp optimization algorithm (COA) is applied to tune the parameters involved in ResNet 34 model. The wavelet neural network (WNN) is used for the classification of digital mammograms for the detection of breast cancer. The ADL-BCD method is evaluated using a benchmark dataset and the results are analyzed under several performance measures.
Zhang et al. [11] created a multiview feature fusion network method for classifying mammograms from 2 perceptions, and also they presented a multiscale attention DenseNet as the support network for FE method. The method includes 2 independent branches, i.e., utilized for extracting the features of 2 mammograms from distinct perceptions. This study mostly focuses on the creation of multiscale attention and convolutional modules. Altaf [12] designed a hybrid method depending on PCNN and DCNN. Because of the requirement for huge datasets to tune and train CNNs, that aren’t accessible for medicinal images, TL method was utilized in this study. TL method could be efficient method while functioning with smaller sized dataset.
Yala et al. [13] develop a mammogram based DL breast cancer risk method i.e., highly precise compared to determining breast cancer risk methods. With RF data from patient’s questionnaires and electronic medical record reviews, 3 methods are established for assessing breast cancer risk within five years: an RF-LR method utilized conventional RFs, a DL method (image DL) which utilized mammograms, and a hybrid DL method which utilized conventional mammograms and RFs. Comparison is made for a determined breast cancer risk method which includes breast density.
Shen et al. [14] developed a Dl method which could precisely detect breast cancer on screening mammograms via an “end-to-end” training method which effectively leverages training dataset by comprehensive medical annotation or the cancer status (label) of the entire image. In this method, cancer annotation is needed in the early training phase, and following stage requires image level labels, removing the accessible cancer annotation. This CNN approach is to classify the screening mammogram achieved outstanding efficiency than prior approaches.
Kumar et al. [15] deliver a classification scheme i.e., utilized for classifying breast image as a malignant/benign and when malignant could additionally categorize that kind of malignancy i.e., invasive/non-invasive cancer. This method could suggest treatments for predicting malignant class with details such as probability of curing, degree of seriousness, time taken by selected treatment as treatment of a breast lesion based on stage and type of malignancy. In order to attain high/medical utilization accuracy by positioning developments of image analysis and soft computing such as DL and DNN for decreasing breast lesion deaths as concrete efforts utilizing mammogram by identifying breast lesion in an earlier phase.
Kaur et al. [16] consist of a novel method, employed on the Mini MIAS dataset of 322 images, including a pre-processing technique and in-built FL utilizing K-means clustering for SURF election. The novel layer is included at the classification levels that perform a ratio of 30% testing to 70% training of the DNN and MSVM. The result shows that the accuracy rate of the presented automatic DL approach with K-means clustering using MSVM is enhanced than a DT method. Aboutalib et al. [17] intended to examine the revolutionary DL approaches for distinguishing recalled however benign mammograms from malignancy and negative exam. DL-CNN methods were introduced for classifying mammograms to negative (breast cancer free), re-called benign categories, and malignant (breast cancer). The proposed method shows that automated DL-CNN approaches could detect nuanced mammograms features for distinguishing recalled benign image from negative and malignant cases that might results in a computerized medical toolkit for helping reduced false recalls.
Masni et al. [18] proposed a new CAD scheme depending on the regional DL approaches, an ROI based CNN i.e., named YOLO. The presented method has 4 major phases: FE using DCN, preprocessing of mammogram, mass classification utilizing FCNN, and mass recognition with confidence. In Al-Antari et al. [19], an incorporated CAD scheme of DL classification and detection is presented aimed to enhance the diagnostic efficacy of breast lesions. DL-YOLO detectors are first evaluated adopted and for detecting breast cancer from the whole mammograms. Next, 3 DL classifications, i.e., ResNet-50, InceptionResNet-V2, and regular feedforward CNN, are evaluated and modified for breast cancer classification.
This study has introduced a new ADL-BCD technique to detect the occurrence of breast cancer using digital mammograms. The overall workflow of the ADL-BCD technique is showcased in Fig. 1. It contains GF based preprocessing, Tsallis entropy based segmentation, ResNet34 based feature extraction, COA based parameter tuning, and WNN based classification. The detailed working of these processes is elaborated in the following.
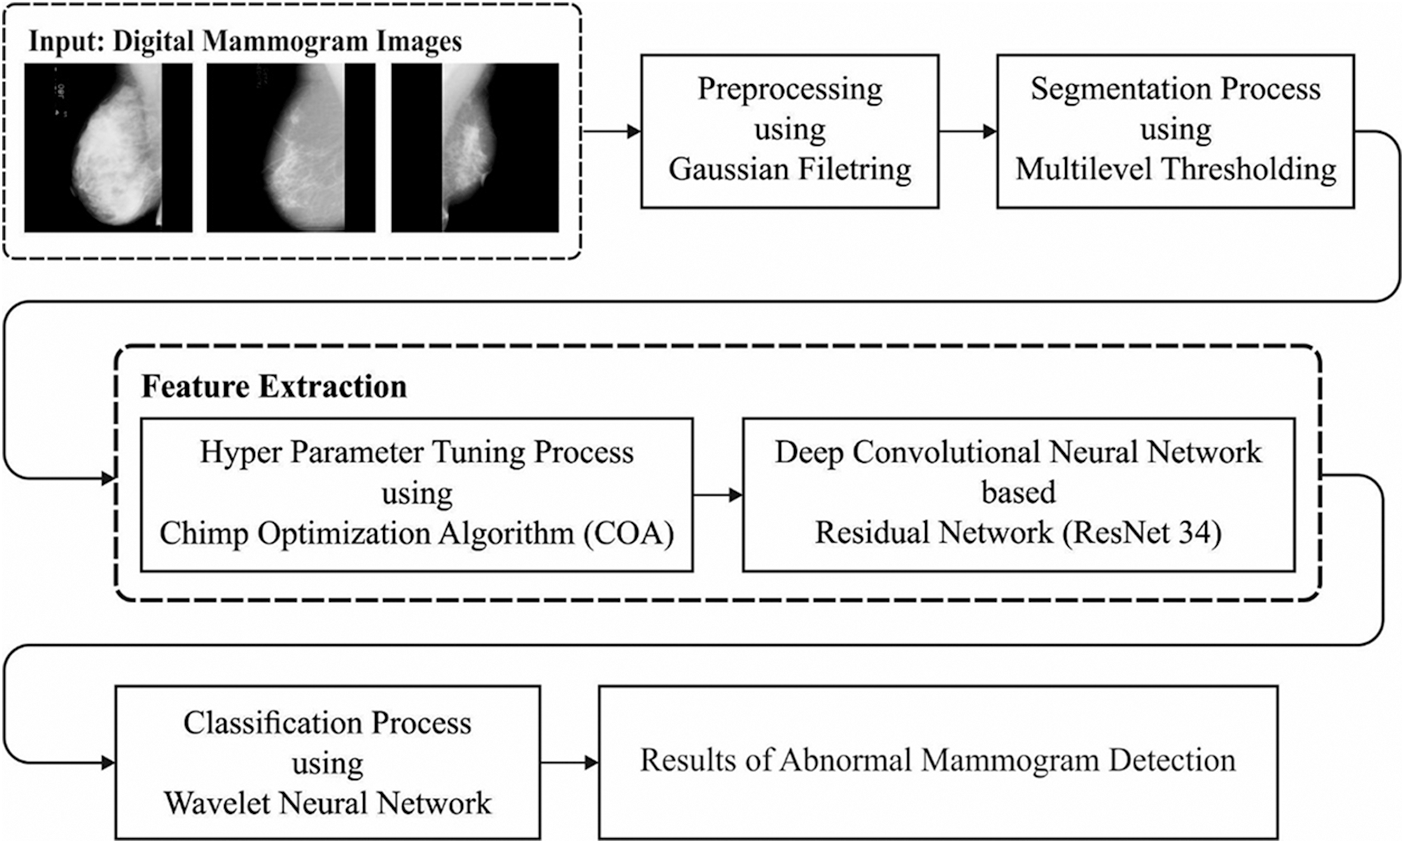
Figure 1: Overall process of ADL-BCD model
3.1 Stage 1: GF Based Preprocessing
At the initial stage, the digital mammograms are preprocessed using GF technique to remove the unwanted noise. The Breast masses i.e., existing in the digital mammogram appear bright compared to the preprocessing, and background filters utilized must be capable of retaining its natural intensity features when eliminating the redundant noise portion. The presented scheme utilizes a 7 * 7 Gaussian filters i.e., a nonuniform lowpass filter to pre-process the digital mammograms in which the images are smoothened and the noises are detached in that way removing its intensity in homogeneity and preserve its grey level variation without the segmentation algorithm which might misinterpret for finding the actual breast masses [20]. The Gaussian filters for a pixel (i, j) i.e., utilized in the presented scheme utilizes a 2D Gaussian distribution function known as point spread function that can be presented as follows
whereas
3.2 Stage 2: Tsallis Entropy Based Segmentation
Next, in the second stage, the pre-processed image is fed into the segmentation model to detect the lesion regions in the input mammograms. The entropy is associated with the chaos measure within a system. Initially, Shannon deliberated the entropy for measuring the ambiguity about the data content of the scheme [21]. Shannon specified that: if physical systems are divided as 2 statistical free subsystem
According to Shannon concept, a non-extensive entropy theory was developed by Tsallis i.e., determined by:
whereas
The Tsallis entropy could be deliberated for finding an optimum threshold of an image. Assume that
whereas
In the multilevel thresholding procedure, it is essential for determining an optimum threshold value
3.3 Stage 3: ResNet34 Based Feature Extraction
During the third stage, the ResNet 34 model is used to effectually extract the features from the segmented images. Deep network is a multilayer neural network framework with multiple hidden layers. The learning of deep networks is generally performed hierarchically, starts from the low level to high level, using several layers of the network. DL depending on CNN was extensively utilized in many regions for solving distinct engineering challenges and displayed great performances in problem solutions [22].
CNN is a familiar model which permits the network for extracting local and global features from the data, improving the decision making process. At the convolution layer the value of all positions
Afterward addition the bias term
Every neuron will process a linear output. If the outcome of neuron is feed to other neurons, it finally makes other linear output [23]. For overcoming this problem nonlinear activation functions as defined in the following. The sigmoid function can be typically represented using Eq. (11):
This technique undergoes vanishing-gradient issues and containing huge computational difficulty Another non-linear activation function has TanH that was fundamentally a scaled version of the
That is to avoid the vanishing-gradient issue and their features. One of the famous non-linear operators was Rectified Linear Unit
The Leaky-ReLU rectifier features that are change of
As stated, the “in-depth” structure created an optimization complexity at the time of network training, that is gradient reducing problems and affect the network performances. In this work, they present residual learning to beat these problems and develop a DL framework to grade the fruits. In the residual network, the stacked layer performs a residual mapping by making shortcuts connections that carry out identity mapping (x). The output is included in the output of stacked layer’ residual function F(x). In the training of deep network with backpropagation, the gradient of error is propagated and calculated to the shallow layer. In deep layer, this error tends to be small till it eventually decreases. This is named the gradient reducing problem of deep networks. The issue could be resolved by residual learning. Fig. 2 depicts the framework of ResNet-34.
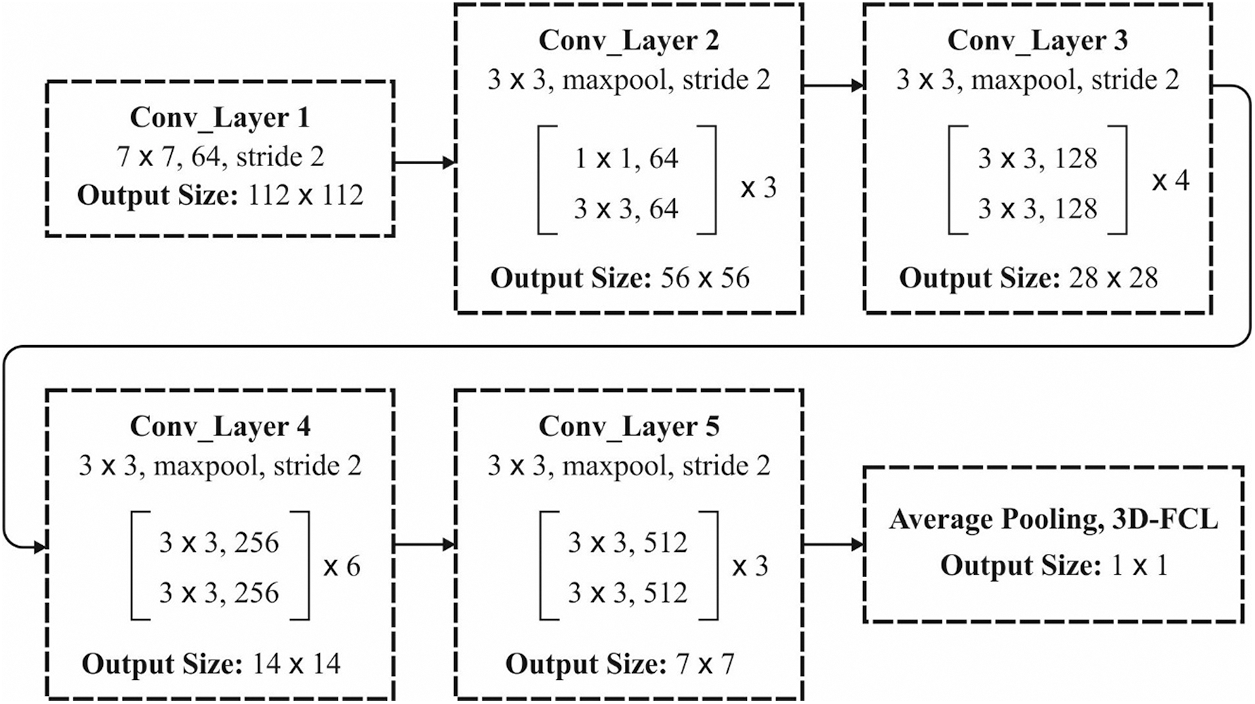
Figure 2: Structure of ResNet-34
The actual residual branch or unit l in the ResNet shows rectified linear unit (ReLU), weight, and batch normalization (BN). The output and input of a residual unit are estimated by
whereas
3.4 Stage 4: COA Based Parameter Tuning
To finely adjust the parameters involved in the ResNet34 model, the COA is applied to it. COA was simulated as individual intelligence and sexual incentive of chimps from its group hunting that was varying from the other social predator. During the chimp colony, there are 4 kinds of chimps allowed to hunt models such as driver, barrier, chaser, and attackers. From every various capability, however, this diversity is essential to successful hunt. In the male chimps hunt superior to females. If they caught and killed, meal was distributed to every hunting party member and even bystander [24]. From the attacker is supposed for needed much greater cognitive endeavor from prognosticating the succeeding movement of prey, and it can be remunerated with huge piece of meat afterward successful hunt. The procedure of place upgrading Mechanism is the search chimp place from the search space considering the place of another chimp position. Next, the last place was situated arbitrarily in the circle that was determined as attacker, barrier, chaser, and driver chimp locations. For instance, the prey locations were evaluated by 4 optimum groups and another chimp arbitrarily upgrade its places within it.
From the mathematical processes of group, driving, blocking, chasing, and attacking are resulting. In order to mathematically the drive as well as chase the prey was signified as the formulas:
where
where
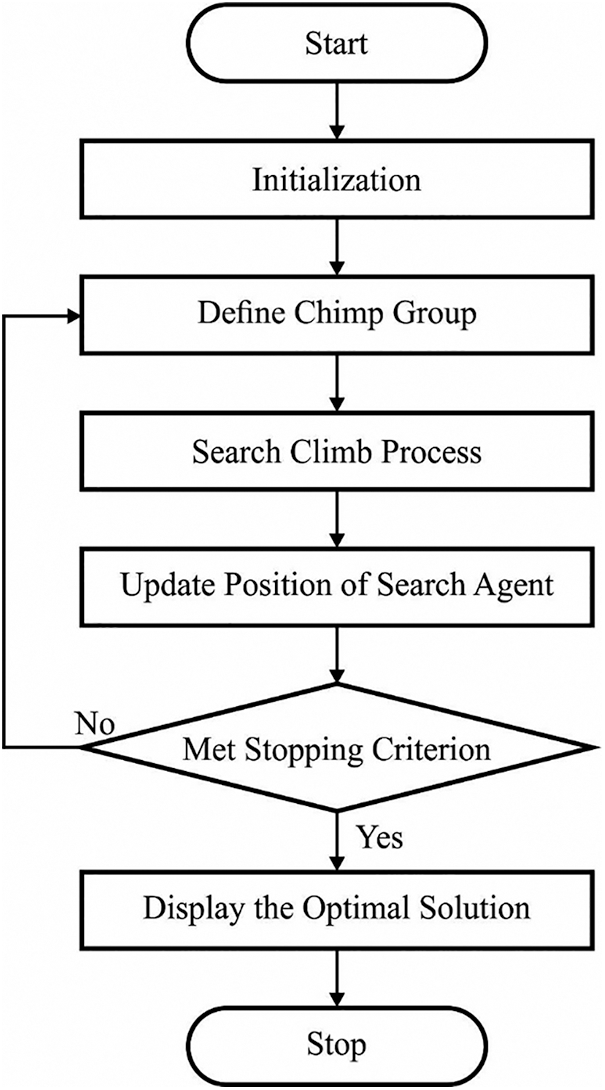
Figure 3: Flowchart of COA
To mathematically apply the performance of chimp, it can be considered as initial optimum solution accessible by attacker, driver, barrier, and chaser are optimum informed on the place of potential prey. Therefore, 4 of optimum solutions yet gained was saved and other chimps were required for updating its places based on optimum chimps places. This connection was written as subsequent formulas,
If the arbitrary values have been lying from the range of –1 and 1, the next place of chimp is from someplace among from present place and place of prey.
In the entire formulas:
The normal upgrading place process or the chaotic procedure for updating the place of chimps in optimization. The mathematical process was written as:
where is an arbitrary number from 0 and 1.
3.5 Stage 5: WNN Based Classification
At the final stage, the WNN model is utilized to categorize the inputs into presence or absence of breast cancer. The wavelets are attained by scaling and translating a different function
where
WNN is non-linear regression framework which demonstrates input-output maps by relating wavelets with suitable scaling as well as translation. The output of WNN was defined as:
where
This section investigates the performance of the ADL-BCD technique interms of different dimensions [26]. The ADL-BCD technique is assessed using the Mammographic Image Analysis Society (MIAS) dataset, containing 322 images (Normal-209, Benign-61, and Malignant-52).
The confusion matrices produced by the ADL-BCD technique take place under five distinct runs in Fig. 4. Fig. 4a shows the confusion matrix obtained by the ADL-BCD technique under training and testing set of 90:10. The figure showcased that the ADL-BCD technique has categorized 201 images into Normal, 56 images into Benign, and 46 images into Malignant. Similarly, Fig. 4c illustrates the confusion matrix attained by the ADL-BCD approach under training and testing set of 70:30. The figure outperformed that the ADL-BCD method has categorized 195 images into Normal, 52 images into Benign, and 42 images into Malignant. Likewise, Fig. 4e depicts the confusion matrix gained by the ADL-BCD manner under training and testing set of 50:50. The figure exhibited that the ADL-BCD algorithm has categorized 188 images into Normal, 50 images into Benign, and 40 images into Malignant.
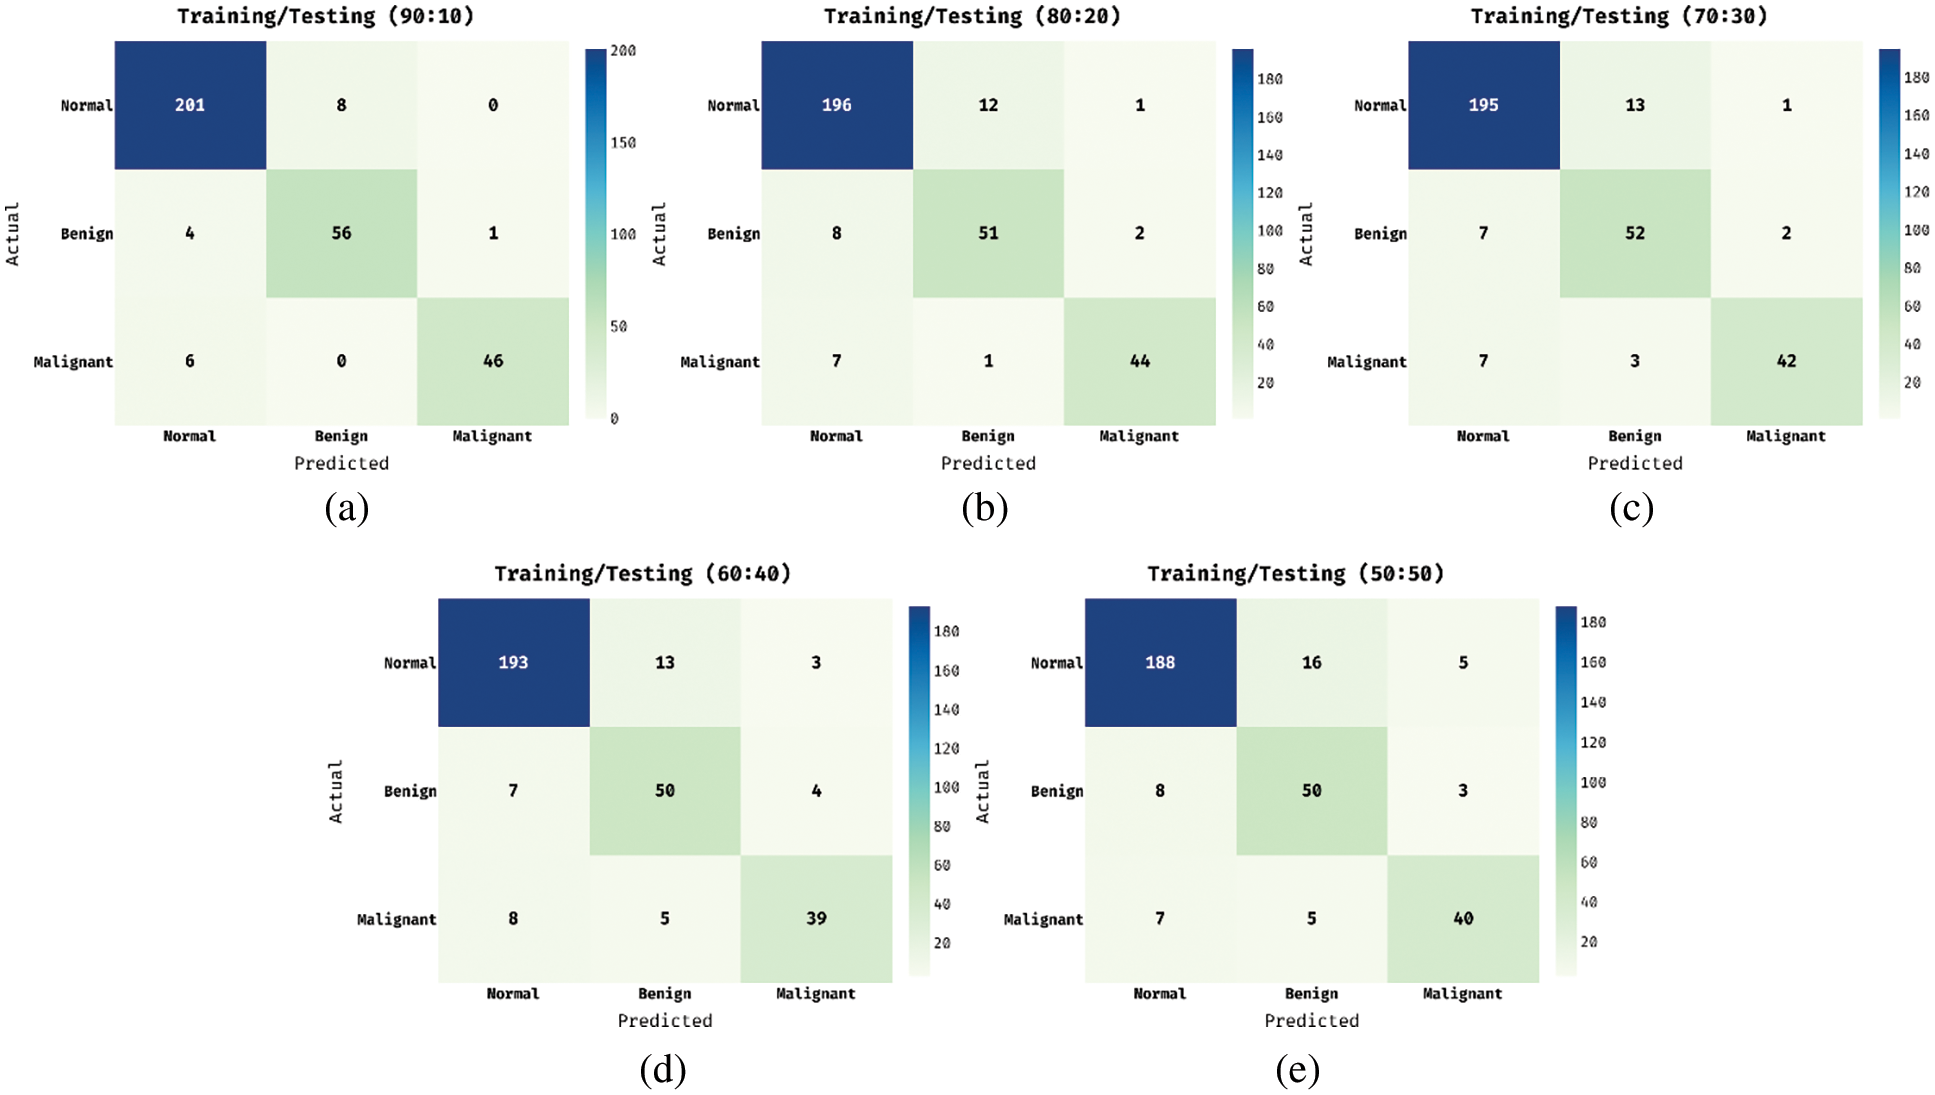
Figure 4: Confusion matrix of proposed ADL-BCD model (a) shows the confusion matrix obtained by the ADL-BCD technique under training and testing set of 90:10; (b) training and testing set of 80:20; (c) training and testing set of 70:30; (d) training and testing set of 60:40 and (d) training and (e) testing set of 50:50
Tab. 1 and Fig. 5 illustrates the classification performance of the ADL-BCD technique with varying sizes of training and testing dataset. The results demonstrated that the ADL-BCD technique has accomplished maximum performance under all the different sizes. For instance, with training/testing of 90:10, the ADL-BCD technique has accomplished an average precision of 0.9354, recall of 0.9215, specificity of 0.9590, accuracy of 0.9607, and F-score of 0.9571. Along with that, with training/testing of 80:20, the ADL-BCD approach has accomplished an average precision of 0.8873, recall of 0.8733, specificity of 0.9354, accuracy of 0.9358, and F-score of 0.8794. Besides, with training/testing of 70:30, the ADL-BCD methodology has accomplished an average precision of 0.8770, recall of 0.8644, specificity of 0.9346, accuracy of 0.9317, and F-score of 0.8684. Concurrently, with training/testing of 60:40, the ADL-BCD manner has accomplished an average precision of 0.837, recall of 0.831, specificity of 0.9241, accuracy of 0.9172, and F-score of 0.8323. Lastly, with training/testing of 50:50, the ADL-BCD algorithm has accomplished an average precision of 0.8212, recall of 0.8295, specificity of 0.9191, accuracy of 0.9089, and F-score of 0.8234.
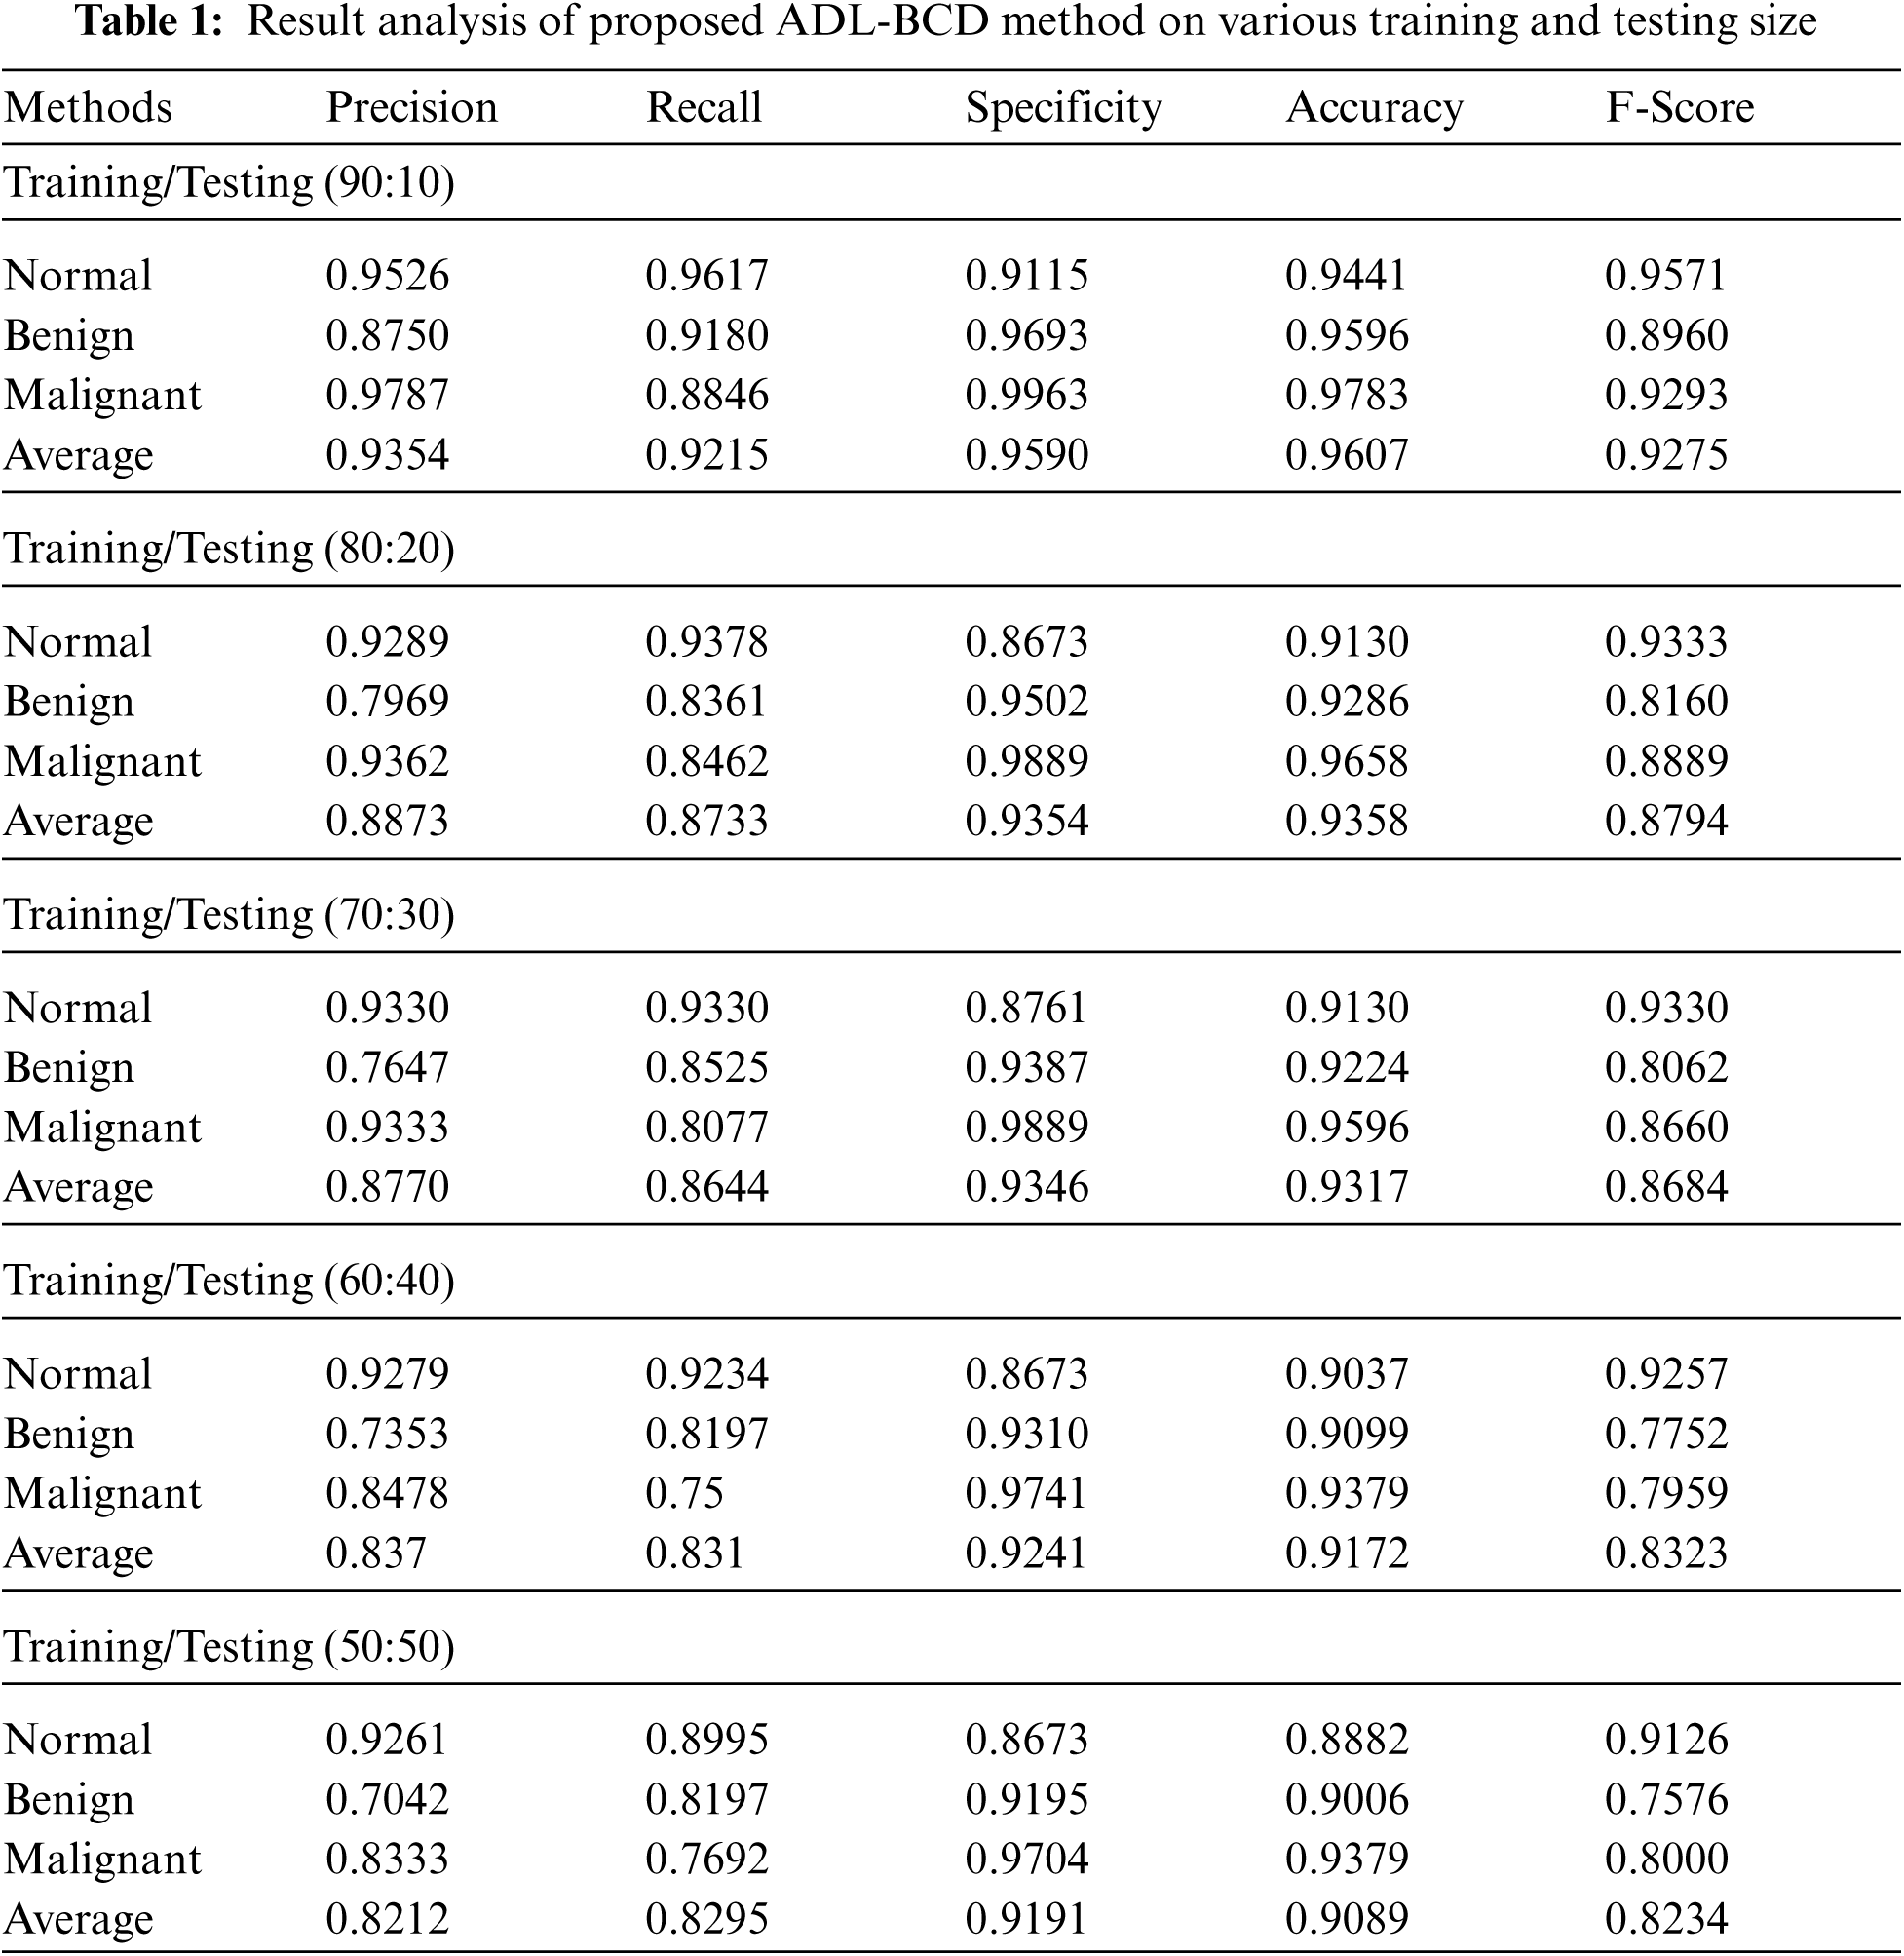
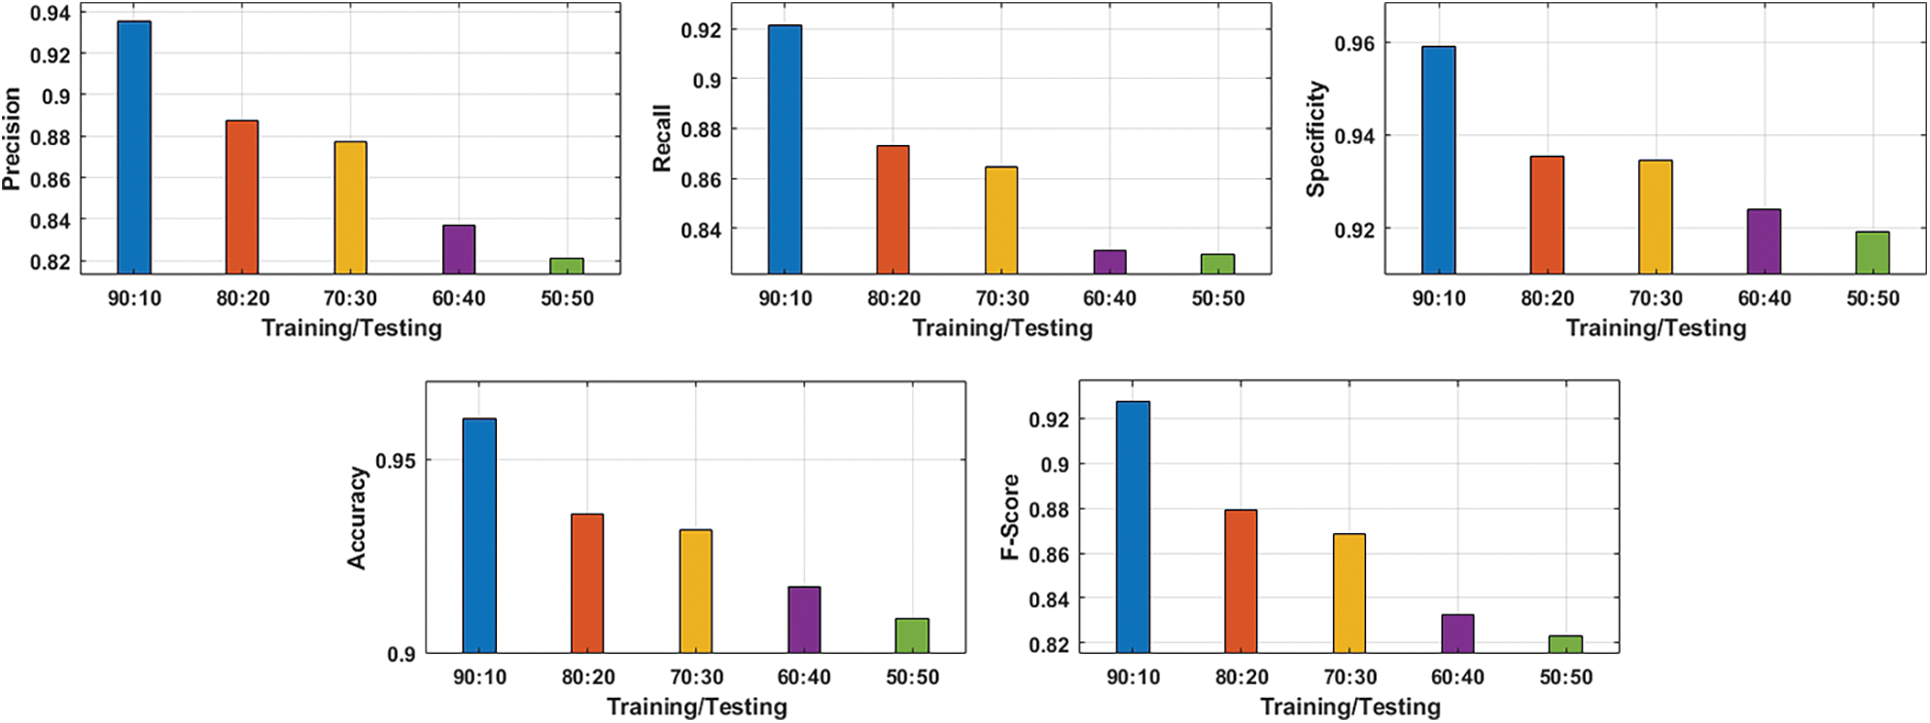
Figure 5: Average analysis of proposed ADL-BCD method on various training and testing size
A detailed comparison study of the ADL-BCD technique with distinct measures take place in Tab. 2 and Figs. 6 and 7. On examining the performance interms of precision, the comparative results depicted that the MLP model has gained ineffectual outcomes with the precision of 0.78. At the same time, the J48 + K-mean Clustering and DL techniques have attained a precision of 0.9 and 0.9 respectively. In line with this, the VGGNec, AlexNet, GoogleNet, DenseNet, and DenseNet-II techniques have obtained a moderately closer precision of 0.9176, 0.9189, 0.9224, 0.9254, and 0.9285 respectively. However, the ADL-BCD technique has resulted in a higher precision of 0.9354.
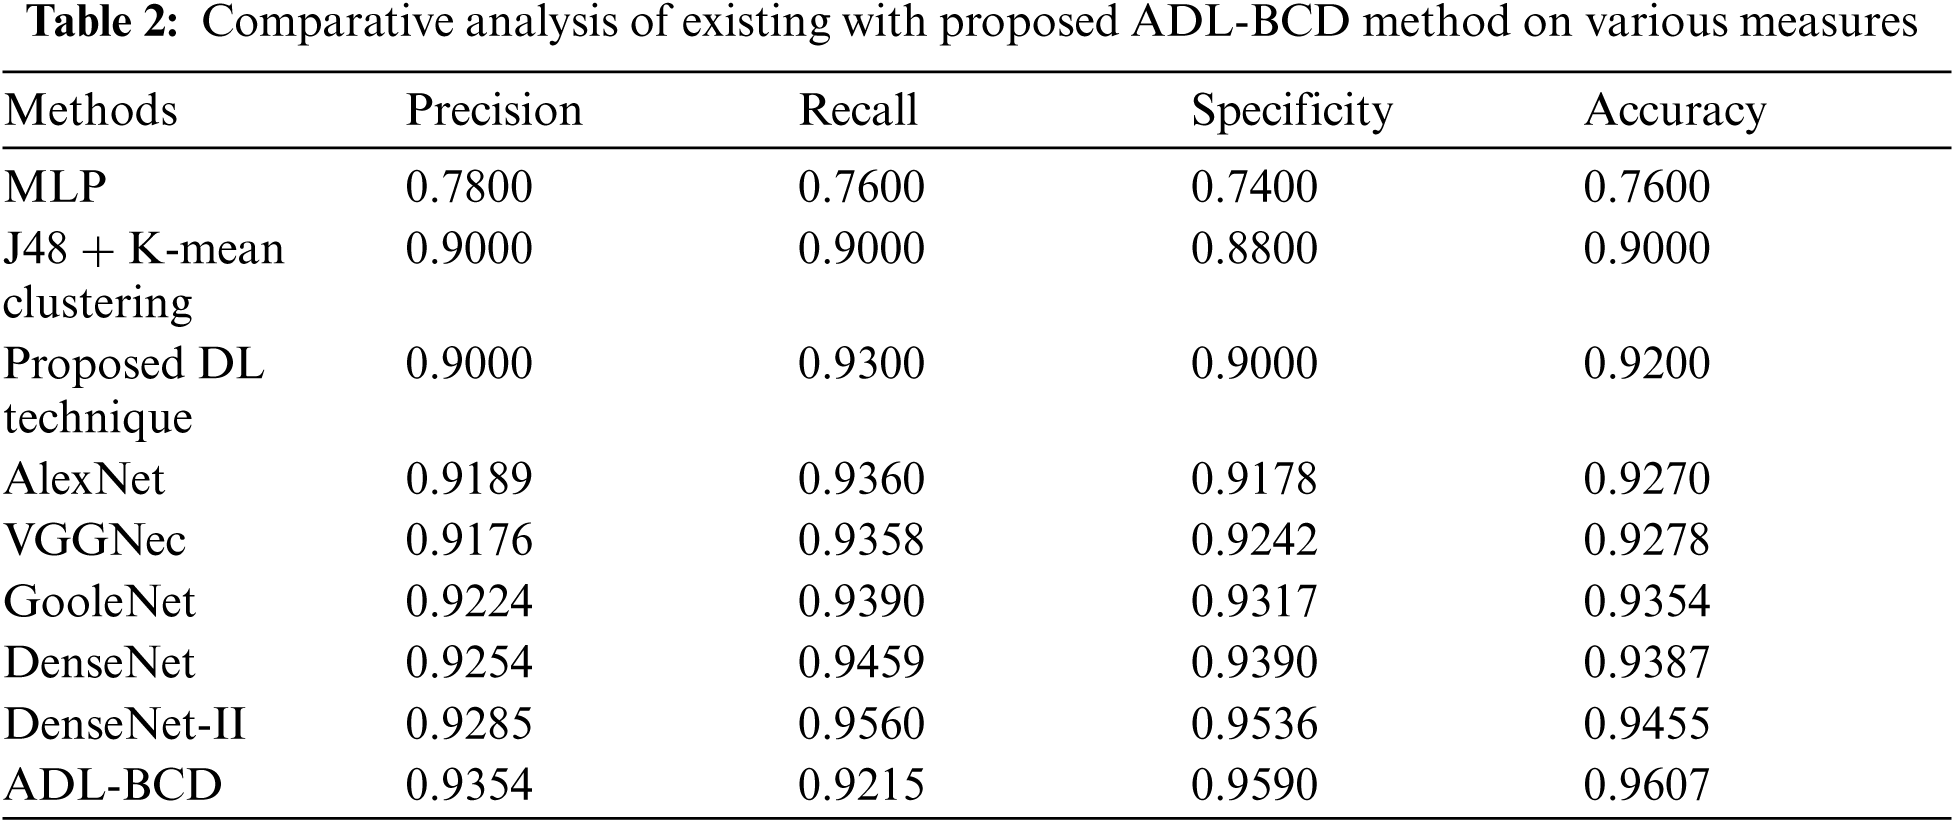
Similarly, on examining the results with respect to recall, the comparative outcomes showcased that the MLP manner has attained ineffectual result with the recall of 0.76. Simultaneously, the J48 + K-mean Clustering and DL approaches have reached a recall of 0.9 and 0.93 correspondingly. Likewise, the VGGNec, AlexNet, GoogleNet, DenseNet, and DenseNet-II methods have attained a moderately closer recall of 0.9360, 0.9358, 0.9390, 0.9459, and 0.9560 correspondingly. But, the ADL-BCD methodology has resulted in a superior recall of 0.9215.
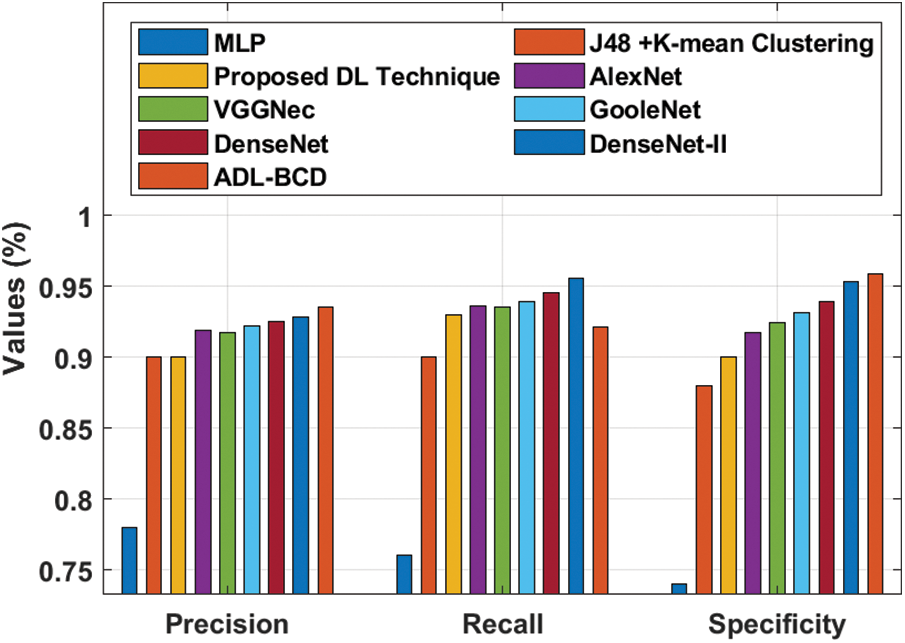
Figure 6: Result analysis of ADL-BCD model with different measures
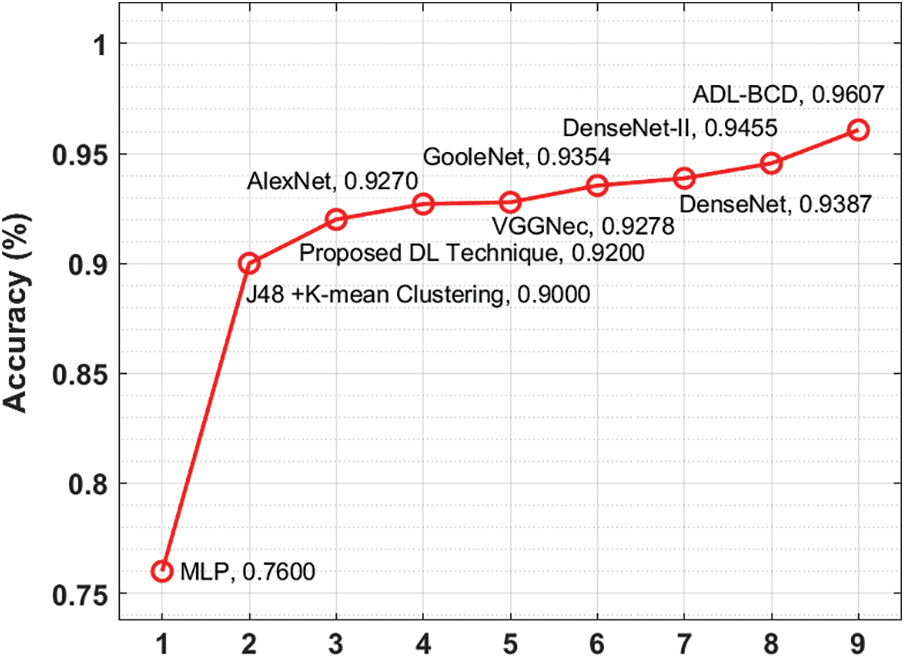
Figure 7: Comparative analysis of ADL-BCD model with existing techniques
Furthermore, on investigating the performance with respect to specificity, the comparative outcomes outperformed that the MLP manner has reached ineffectual outcome with the specificity of 0.74. Also, the J48 + K-mean Clustering and DL algorithms have gained a specificity of 0.88 and 0.9 correspondingly. Similarly, the VGGNec, AlexNet, GoogleNet, DenseNet, and DenseNet-II methods have attained a moderately closer specificity of 0.9178, 0.9242, 0.9317, 0.9390, and 0.9536 correspondingly. But, the ADL-BCD methodology has resulted in a maximum specificity of 0.9590.
On exploratory the performance interms of accuracy, the comparative outcomes showcased that the MLP model has attained ineffectual outcome with the accuracy of 0.76. Simultaneously, the J48 + K-mean Clustering and DL manners have obtained an accuracy of 0.9 and 0.92 correspondingly. Besides, the VGGNec, AlexNet, GoogleNet, DenseNet, and DenseNet-II manners have reached a moderately closer accuracy of 0.9270, 0.9278, 0.9354, 0.9387, and 0.9455 correspondingly. Eventually, the ADL-BCD methodology has resulted in a superior accuracy of 0.9607. The simulation outcome indicated that the ADL-BCD model outperforms the state of art methods in terms of different measures.
This study has introduced a new ADL-BCD technique to detect the occurrence of breast cancer using digital mammograms. The goal of the ADL-BCD technique is to properly detect the existence of breast lesions using digital mammograms. The ADL-BCD technique contains GF based pre-processing, Tsallis entropy based segmentation, ResNet34 based feature extraction, COA based parameter tuning, and WNN based classification. The usage of COA based hyperparameter optimization helps to considerably boost the diagnostic efficiency. The ADL-BCD method is evaluated using a benchmark dataset and the results are analyzed under several performance measures. The simulation outcome indicated that the ADL-BCD model outperforms the state of art methods in terms of different measures. As a part of future scope, the advanced DL based instance segmentation technique can be designed to further increase the diagnostic outcome.
Funding Statement: The authors received no specific funding for this study.
Conflicts of Interest: The authors declare that they have no conflicts of interest to report regarding the present study.
1. S. K. Lakshmanaprabu, S. N. Mohanty, K. Shankar, N. Arunkumar and G. Ramireze, “Optimal deep learning model for classification of lung cancer on CT images,” Future Generation Computer Systems, vol. 92, no. 1, pp. 374–382, 2019. [Google Scholar]
2. I. V. Pustokhina, D. A. Pustokhin, T. Vaiyapuri, D. Gupta, S. Kumar et al., “An automated deep learning based anomaly detection in pedestrian walkways for vulnerable road users safety,” Safety Science, vol. 142, pp. 105356, 2021. [Google Scholar]
3. K. Shankar, E. Perumal, P. Tiwari, M. Shorfuzzaman and D. Gupta, “Deep learning and evolutionary intelligence with fusion-based feature extraction for detection of COVID-19 from chest X-ray images,” Multimedia Systems, vol. 66, no. 2, pp. 1921, 2021. [Google Scholar]
4. I. V. Pustokhina, D. A. Pustokhin, P. K. Pareek, D. Gupta, A. Khanna et al., “Energy-efficient cluster-based unmanned aerial vehicle networks with deep learning-based scene classification model,” International Journal of Communication Systems, vol. 34, no. 8, pp. 1–16, 2021. [Google Scholar]
5. T. Vaiyapuri, S. N. Mohanty, M. Sivaram, I. V. Pustokhina, D. A. Pustokhin et al., “Automatic vehicle license plate recognition using optimal deep learning model,” Computers, Materials & Continua, vol. 67, no. 2, pp. 1881–1897, 2021. [Google Scholar]
6. R. F. Mansour, A. El Amraoui, I. Nouaouri, V. G. Díaz, D. Gupta et al., “Artificial intelligence and internet of things enabled disease diagnosis model for smart healthcare systems,” IEEE Access, vol. 9, pp. 45137–45146, 2021. [Google Scholar]
7. L. Li, L. Sun, Y. Xue, S. Li, X. Huang et al., “Fuzzy multilevel image thresholding based on improved coyote optimization algorithm,” IEEE Access, vol. 9, pp. 33595–33607, 2021. [Google Scholar]
8. R. F. Mansour, J. E. Gutierrez, M. Gamarra, V. García, D. Gupta et al., “Artificial intelligence with big data analytics-based brain intracranial hemorrhage e-diagnosis using CT images,” Neural Computing and Applications, pp. 1–13, 2021. https://doi.org/10.1007/s00521-021-06240-y. [Google Scholar]
9. R. F. Mansour, “A robust deep neural network based breast cancer detection and classification,” International Journal of Computational Intelligence and Applications, vol. 19, no. 1, pp. 2050007, 2020. [Google Scholar]
10. R. F. Mansour, “Evolutionary computing enriched ridge regression model for craniofacial reconstruction,” Multimedia Tools and Applications, vol. 79, no. 31, pp. 22065–22082, 2020. [Google Scholar]
11. C. Zhang, J. Zhao, J. Niu and D. Li, “New convolutional neural network model for screening and diagnosis of mammograms,” PLoS ONE, vol. 15, no. 8, pp. e0237674, 2020. [Google Scholar]
12. M. Altaf, “A hybrid deep learning model for breast cancer diagnosis based on transfer learning and pulse-coupled neural networks,” Mathematical Biosciences and Engineering, vol. 18, no. 5, pp. 5029–5046, 2021. [Google Scholar]
13. A. Yala, C. Lehman, T. Schuster, T. Portnoi and R. Barzilay, “A deep learning mammography-based model for improved breast cancer risk prediction,” Radiology, vol. 292, no. 1, pp. 60–66, 2019. [Google Scholar]
14. L. Shen, L. R. Margolies, J. H. Rothstein, E. Fluder, R. McBride et al., “Deep learning to improve breast cancer detection on screening mammography,” Scientific Reports, vol. 9, no. 1, pp. 12495, 2019. [Google Scholar]
15. A. Kumar, S. Mukherjee and A. K. Luhach, “Deep learning with perspective modeling for early detection of malignancy in mammograms,” Journal of Discrete Mathematical Sciences and Cryptography, vol. 22, no. 4, pp. 627–643, 2019. [Google Scholar]
16. P. Kaur, G. Singh and P. Kaur, “Intellectual detection and validation of automated mammogram breast cancer images by multi-class SVM using deep learning classification,” Informatics in Medicine Unlocked, vol. 16, no. 1, pp. 100239, 2019. [Google Scholar]
17. S. S. Aboutalib, A. A. Mohamed, W. A. Berg, M. L. Zuley, J. H. Sumkin et al., “Deep learning to distinguish recalled but benign mammography images in breast cancer screening,” Clinical Cancer Research, vol. 24, no. 23, pp. 5902–5909, 2018. [Google Scholar]
18. M. A. A. Masni, M. A. A. Antari, J. M. Park, G. Gi, T. Y. Kim et al., “Simultaneous detection and classification of breast masses in digital mammograms via a deep learning YOLO-based CAD system,” Computer Methods and Programs in Biomedicine, vol. 157, no. 1, pp. 85–94, 2018. [Google Scholar]
19. M. A. Al-antari, S. M. Han and T. S. Kim, “Evaluation of deep learning detection and classification towards computer-aided diagnosis of breast lesions in digital X-ray mammograms,” Computer Methods and Programs in Biomedicine, vol. 196, pp. 105584, 2020. [Google Scholar]
20. S. Punitha, A. Amuthan and K. S. Joseph, “Benign and malignant breast cancer segmentation using optimized region growing technique,” Future Computing and Informatics Journal, vol. 3, no. 2, pp. 348–358, 2018. [Google Scholar]
21. V. Rajinikanth, S. C. Satapathy, S. L. Fernandes and S. Nachiappan, “Entropy based segmentation of tumor from brain MR images–A study with teaching learning based optimization,” Pattern Recognition Letters, vol. 94, no. 1, pp. 87–95, 2017. [Google Scholar]
22. A. Helwan, M. K. S. Ma”aitah, R. H. Abiyev, S. Uzelaltinbulat and B. Sonyel, “Deep learning based on residual networks for automatic sorting of bananas,” Journal of Food Quality, vol. 2021, pp. 1–11, 2021. [Google Scholar]
23. A. A. Nahid, M. A. Mehrabi and Y. Kong, “Histopathological breast cancer image classification by deep neural network techniques guided by local clustering,” BioMed Research International, vol. 2018, pp. 1–20, 2018. [Google Scholar]
24. M. Khishe and M. R. Mosavi, “Classification of underwater acoustical dataset using neural network trained by chimp optimization algorithm,” Applied Acoustics, vol. 157, no. 13, pp. 107005, 2020. [Google Scholar]
25. L. L. S. Linhares, A. I. R. Fontes, A. M. Martins, F. M. U. Araújo and L. F. Q. Silveira, “Fuzzy wavelet neural network using a correntropy criterion for nonlinear system identification,” Mathematical Problems in Engineering, vol. 2015, no. 5, pp. 1–12, 2015. [Google Scholar]
26. Dataset. [Online]. Available: http://peipa.essex.ac.uk/info/mias.html. [Google Scholar]
 | This work is licensed under a Creative Commons Attribution 4.0 International License, which permits unrestricted use, distribution, and reproduction in any medium, provided the original work is properly cited. |