DOI:10.32604/cmc.2022.021850
| Computers, Materials & Continua DOI:10.32604/cmc.2022.021850 | |
| Article |
Drone-based AI/IoT Framework for Monitoring, Tracking and Fighting Pandemics
1Department of Information Technology, College of Computer and Information Sciences, Princess Nourah Bint Abdulrahman University, Riyadh, 84428, Saudi Arabia
2Department of Electronics and Communications Engineering, Zagazig University, Zagazig, Sharqia, 44519, Egypt
3Department of Telecommunication Networks and Data Transmission, the Bonch-Bruevich Saint-Petersburg State University of Telecommunications, Saint Petersburg, 193232, Russia
*Corresponding Author: Naglaa. F. Soliman. Email: nfsoliman@pnu.edu.sa
Received: 17 July 2021; Accepted: 08 November 2021
Abstract: Since World Health Organization (WHO) has declared the Coronavirus disease (COVID-19) a global pandemic, the world has changed. All life's fields and daily habits have moved to adapt to this new situation. According to WHO, the probability of such virus pandemics in the future is high, and recommends preparing for worse situations. To this end, this work provides a framework for monitoring, tracking, and fighting COVID-19 and future pandemics. The proposed framework deploys unmanned aerial vehicles (UAVs), e.g.; quadcopter and drone, integrated with artificial intelligence (AI) and Internet of Things (IoT) to monitor and fight COVID-19. It consists of two main systems; AI/IoT for COVID-19 monitoring and drone-based IoT system for sterilizing. The two systems are integrated with the IoT paradigm and the developed algorithms are implemented on distributed fog units connected to the IoT network and controlled by software-defined networking (SDN). The proposed work is built based on a thermal camera mounted in a face-shield, or on a helmet that can be used by people during pandemics. The detected images, thermal images, are processed by the developed AI algorithm that is built based on the convolutional neural network (CNN). The drone system can be called, by the IoT system connected to the helmet, once infected cases are detected. The drone is used for sterilizing the area that contains multiple infected people. The proposed framework employs a single centralized SDN controller to control the network operations. The developed system is experimentally evaluated, and the results are introduced. Results indicate that the developed framework provides a novel, efficient scheme for monitoring and fighting COVID-19 and other future pandemics.
Keywords: Internet of Things; convolutional neural network; fog computing; software-defined networking; COVID-19; drone
Evidence confirms that the coronavirus disease (COVID-19) outbreak has become a pandemic over the world since March 2020, as corroborated by the World Health Organization (WHO). All governments around the world have developed means for countering the spread of that disease [1]. The symptoms of COVID-19 are tiredness, nasal clog, fever, runny nose, and sore throat [2,3]. It is observed that old people among others who suffer from hypertension, heart issues, and diabetes are more prone to the infection [4,5]. According to WHO, the virus can be transferred from one to another through small droplets “beads” if people are less than 2 feet apart while sneezing, sniffling, or talking [2]. Such droplet that contains the virus falls to the ground and can stay active for 72 h, on any surface. The recommendations for protection are staying away from others, enforcing social distancing, wearing a mask, quarantines, and self-isolation for infected persons [2]. All governments have been facing difficulties impelling individuals to follow social distancing and wear masks, and try to achieve this by setting up essential rules that can be applied in indoor and outdoor areas. The outdoor locations, include congested places such as critical work spaces, supermarkets, entertainment, and recreational areas. Additionally, places to perform Hajj and Umrah rites face more challenges in applying COVID-19's recommendations and monitoring the virus.
Since the widespread of COVID-19 around the world, different organizations have been working on developing vaccines to protect people from being infected by the virus. Recently, after developing the newly available vaccines, the efficacy against symptoms has increased from 50% to 95% in clinical trials [6,7]. However, it is found that some of the vaccinated people were still being infected by the virus, in what is called “breakthrough” infections cases; therefore, even the best vaccines are not able to provide perfect immunity against the infections [7]. In reality, COVID-19 vaccines do not provide full protection against being infected, but substantially reduce the severity of symptoms and the chance of transmitting the virus to others [8]. Therefore, wearing the mask or any facial cover, maintaining social distancing between individuals, and repeat hand sanitizing are indispensable precautions to reduce the transmission of COVID-19.
Recent technologies, e.g., Internet of Things (IoT), unmanned aerial vehicles (UAVs), artificial intelligence (AI), software-defined networking (SDN), distributed edge computing, and Blockchain, can have major roles in monitoring and fighting COVID-19. These promising technologies can be integrated to provide efficient systems for monitoring, tracking, and fighting COVID-19 [9,10].
Drone represents an example of such solutions that are considered as innovative means in confronting the ongoing COVID pandemic. Drones can be used for sanitization, defining thermal imaging, monitoring social distance, and medication delivery. It is a promising solution, which can be used for COVID-19 data collection and analysis [11,12].
IoT is a unique platform that is considered as one of the most important technologies for next-generation communication systems. It links objects, i.e., machines, and enables data generation and sharing. The end-to-end simple structure of the IoT networks consists of four layers: service layer, platform layer, network layer, and device layer [13]. The main characteristic of the IoT is the “ubiquitous connectivity”, and it has three main stages: comprehensive perception, reliable transmission, and intelligent processing [14]. IoT has been introduced for medical healthcare application, and is referred to as the Internet of medical things (IoMT). E-health, smart health, and telemedicine are advanced medical systems that use the IoT paradigm [15]. Recently, many IoT-based systems have been developed to fight COVID-19 [16].
AI is another recent technology that is used in modern healthcare applications, besides many other applications in all life fields. It is considered as a powerful tool for medical diagnosis, and data analysis of medical records. Today, AI is the most potential technology that combats the COVID-19 outbreak by using transfer learning [17]. It can be used in different applications; disease observation, risk estimation, medical diagnosis based on image screening classification, and examining the fake news.
SDN is another novel technology that is used in modern communication systems to provide the required network flexibility, reliability, availability, and scalability. It facilitates the network management by splitting the network into two separate planes; the data plane and the control plane [18]. This represents the start of the era of software networks that moves from the functionality of the network components to the generalization. Data plane deploys distributed OpenFlow switches; while, the control plane deploys either a centralized controller or multi-controller scheme. Control plane and data plane are connected via an appropriate interface, such as OpenFlow protocol. SDN is recently used for modern communication networks to provide the required control and management level, besides other benefits introduced by SDN that can be found in [19].
In this work, we consider developing a novel framework for monitoring and fighting COVID-19; based on IoT, AI, drone, and SDN. The framework consists of two systems; COVID-19 monitoring system, i.e.; temperature monitoring, and drone sterilizing system. Both systems deploy distributed edge computing technology, as the first system deploys distributed fog nodes, while the ond system deploys a mobile edge computing, MEC, server. The framework, including both systems, is managed and controlled via an SDN network. The first system monitors COVID-19 through a thermal camera connected to a developed AI algorithm, embedded with IoT, that screens the surrounded people and detects their temperatures. The second system deploys distributed drones to sterilize different regions in the city. The main contributions of the proposed work are introduced in the following points:
1) Developing an AI algorithm for monitoring COVID-19, through thermal images detected by a thermal camera mounted on a face shield of a helmet.
2) Developing an IoT-based COVID-19 monitoring system, powered by fog computing, that implements the developed AI algorithm.
3) Developing a drone sterilizing system that deploys distributed drones to sterilize infected regions.
4) Developing an efficient sterilizing algorithm, for managing the sterilizing process.
5) Integrating the developed AI/IoT-based COVID-19 monitoring system with the drone sterilizing system, so that drones receive the sterilizing requests from the AI/IoT-based COVID-19 monitoring system.
6) Designing and developing an SDN network with a single centralized SDN controller to manage and control the network.
7) Integrating the developed SDN network with the AI/IoT-based COVID-19 monitoring system and drone sterilizing system.
Paper organization: The rest of this article is organized as following: Section 2 introduces the related works to the proposed framework. These recent relative works are compared with the developed work to clearly introduce the novelty of the proposed framework. Section 3 introduces the proposed framework including the AI/IoT-based COVID-19 monitoring system, the drone sterilizing system, and the SDN network. All system parts and comprised algorithms are introduced. Section 4 is introduced for performance evaluation of the developed framework. The evaluation process is introduced, and results are clearly discussed. Section 5 presents the conclusions and the future directions.
2 Background and Related Works
IoT is a global infrastructure worldwide that provides an efficient way of learning and interacting, using Internet-connected devices. The recent developed healthcare systems and solutions are used to identify the patient's information at different healthcare stages, using the IoT. Such systems have been modified to monitor and face COVID-19.
Several approaches have been introduced to investigate the effect of using IoT for monitoring, tracking, and fighting COVID-19 [20,21]. Other approaches have been developed to face COVID-19 using AI techniques over IoT networks. Other researches consider drones for monitoring and fighting COVID-19; either drone system only or drone integrated with other technologies, e.g., IoT.
Tab. 1 summarizes the main features of the current existing related works and solutions, and compares these works with the proposed work. In Tab. 1, the main applications of the related works and existing solutions are categorized into five groups. The first group of applications is the COVID-19 monitoring applications, MO, which includes all systems that consider detecting COVID-19 via estimating body temperature, monitoring social distance, and mask detection. The second group of applications, MI, considers systems developed to monitor infected people during quarantine; while, the third group, FI, is introduced for existing works that consider fighting COVID-19 such as sterilizing systems. The fourth group of applications, AS, is the assisting applications that consider providing services to citizens during pandemic. The fifth group, AN, is the analysis applications that consider analyzing exiting solutions and data associated with COVID-19.

The novelty of the developed framework comes from deploying heterogeneous technologies, AI, IoT, drone, and SDN. To the best of our knowledge, this work is the first to integrate these technologies to monitor, and fight COVID-19. Moreover, the introduction of fog nodes with the IoT to implement AI algorithm, and the introduction of SDN for multi-system networks are novel solutions.
The proposed system deploys a thermal camera, embedded with an IoT system, to monitor, track, and fight COVID-19 and other expected pandemics in the future. The camera module is integrated with an IoT system that deploys the common layer system of IoT, besides an edge computing unit, i.e., a fog node. The detected images are passed to the IoT system, with the fog node, that processes the detected images via a developed AI algorithm. Moreover, a drone-based sanitization system is developed and integrated with the IoT-based COVID-19 monitoring system to sterilize regions with detected infected people. Both systems are connected to an SDN network that controls and manages the network operation, in a way that achieves high energy efficiency, flexibility, latency performance, availability, and reliability. The developed system can be integrated with wearable devices and wireless body area networks, WBANs, to provide an efficient remote healthcare system. The novelty of the proposed system comes from integrating the IoT network with drone system, and the SDN network to provide an efficient framework for monitoring and fighting COVID-19. All system components, sub-systems, and developed algorithms are clearly introduced in this section. The end-to-end system structure of the proposed framework is introduced in Fig. 1.
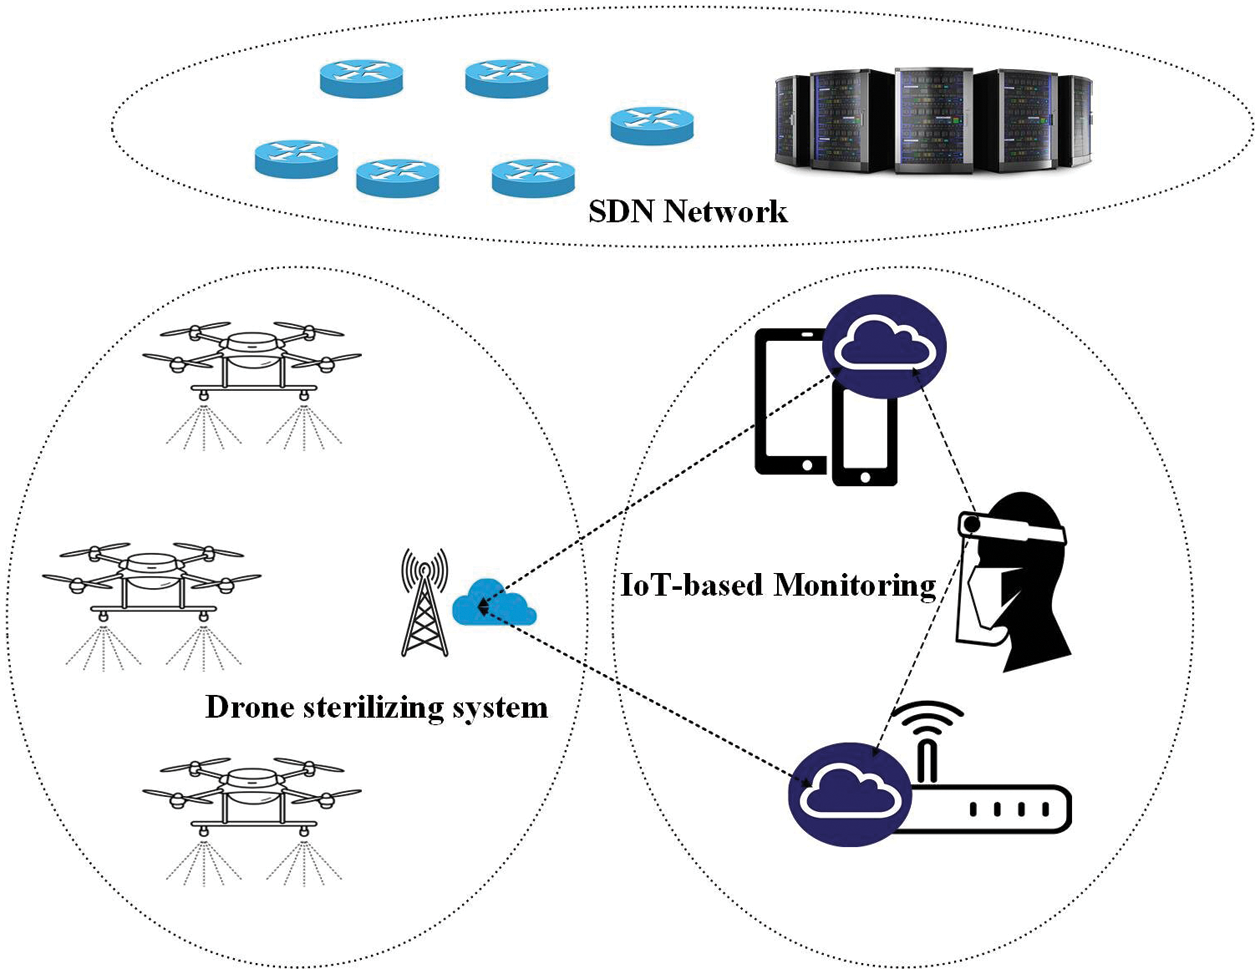
Figure 1: End-to-end system structure of the proposed framework, including AI/IoT and drone sterilizing system
The developed framework consists of three systems; IoT-based COVID-19 monitoring system, drone sterilizing system, and SDN network. The first system represents a remote temperature measurement system that makes use of a thermal camera to detect the temperature of people in the surrounding environment. The second system is the drone-sterilizing system that uses a drone to sterilize a certain region if more than two infected people are detected by the first system. Both systems are controlled and managed via a developed SDN network. The main components, the developed system structure, and the developed algorithms for each system are clearly presented in the rest of this section. Furthermore, the integration between these systems is introduced.
3.1 AI/IoT COVID-19 Monitoring System
To monitor COVID-19, one way is to measure body temperature that acts as a primary indicator. Our proposed system deploys a thermal imaging camera to monitor the temperature of the people in the surrounding field, and thus can avoid probably infected people. The thermal camera, or infrared camera, is mounted on a face-shield or helmet that is used by the end-user; this is for better monitoring the surrounded field. Fig. 2 introduces the structure of the AI/IoT COVID-19 monitoring system, which is a remote temperature measurement system based on AI/IoT. The first part is the Adafruit MLX90640 thermal camera module that contains a 24 × 32 IR thermal sensors array [32]. The Adafruit thermal camera module is connected to the IoT gateway via Inter-Integrated Circuit (I2C) interface. The considered IoT gateway is connected to a fog node to provide the edge computing capabilities to the developed system. Adafruit thermal camera moves the readings to the fog node via the gateway. Each passed detected image is represented by an array of separate infrared temperature readings that forms the thermal detected image. This array is of 768 individual cells size. The frame rate of the considered Adafruit thermal camera is 16 Hz, with two measures per frame. The measuring accuracy of the Adafruit thermal camera is 2°C above or below the recorded value. The camera can achieve a 55-degree field of view [32].
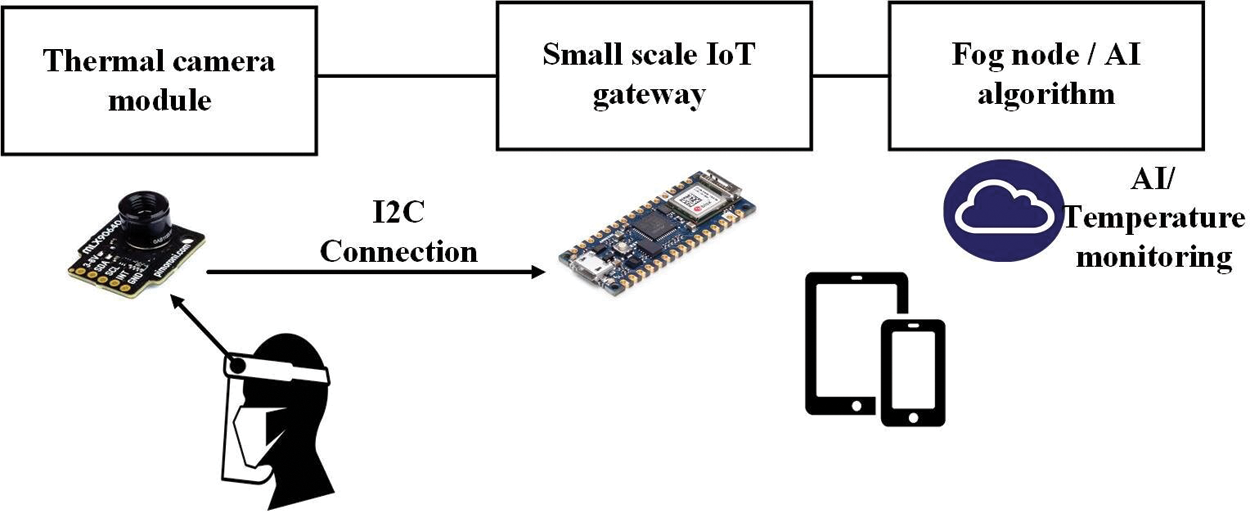
Figure 2: General structure of the AI/IoT COVID-19 monitoring system
3.1.1 Methodology of the AI/IoT COVID-19 Monitoring System
Fig. 3 introduces the flowchart of the proposed AI/IoT COVID-19 monitoring system. The procedure of the proposed COVID-19 monitoring system contains the following steps.
1) Detecting real-time thermal images using the previously introduced Adafruit thermal camera.
2) Processing the images using the developed deep learning algorithm to detect people in the captured images.
3) Selecting the region of interest (ROI), i.e., bounded box, for each detected people.
4) Selecting specific points (SP) in the frame, for temperature evaluation of each detected person using the minimum eigenvalue.
5) Determining the mean temperature of each SP point that represents the temperature of the corresponding person.
6) If the recorded temperature is higher than a threshold level, i.e., 38°C, the corresponding person is recorded as a probably infected person, and a message is sent to the application server to notify the user that one person of the surrounding is probably infected.
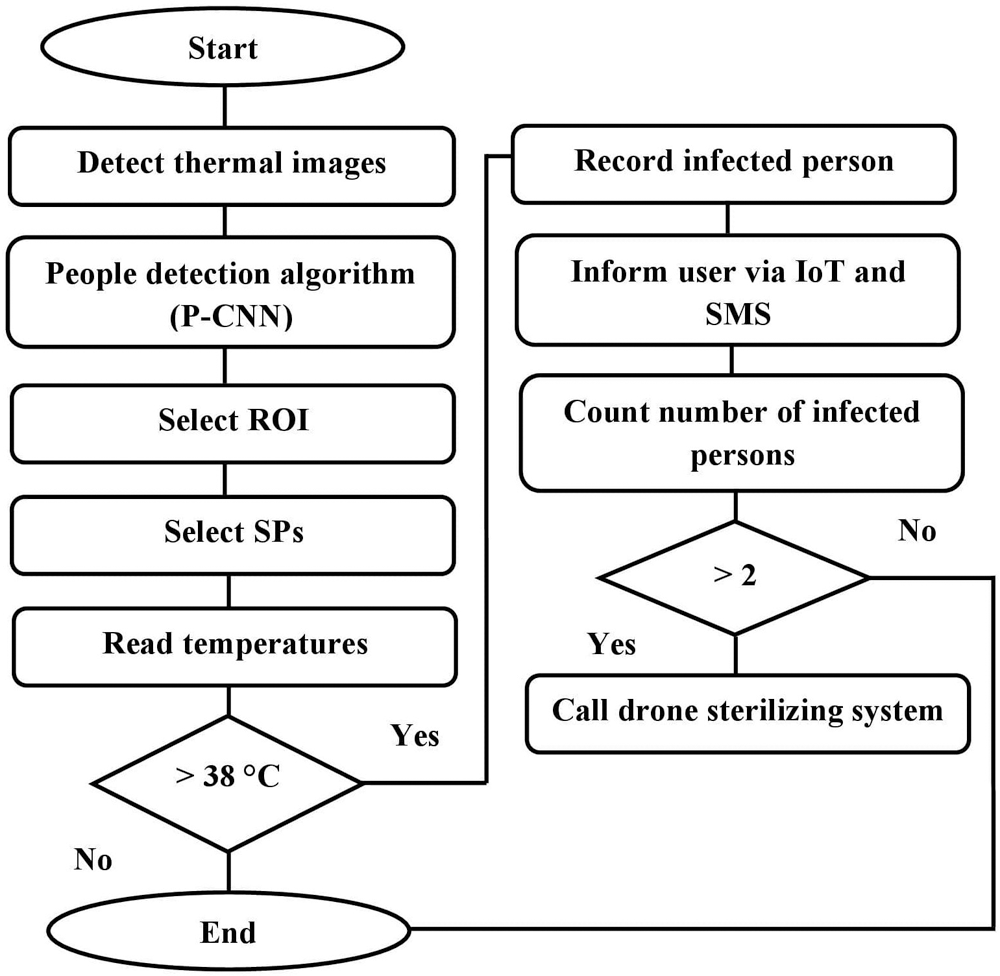
Figure 3: Procedure of the proposed COVID-19 monitoring system
3.1.2 People Detection Deep Learning Algorithm
The proposed deep learning algorithm is a modified version of the common object detection deep learning algorithm of YOLOv2. The proposed people detection algorithm is a lightweight convolutional neural network (CNN) algorithm that deploys input layer, middle layers, and sub-layers of YOLOv2 [30,33]. The considered middle layers include the batch normalization, convolutional, and pooling layers. The developed deep learning represents a modified mini-YOLOv2 that can be executed by embedded processors, e.g., IoT nodes.
Before introducing the designed CNN for people detection, a background subtraction, i.e., foreground mask, process is applied at first. This preprocessing step is important to avoid indiscernible patterns, due to the wide temperature range. Frame pre-processing improves the frame data in terms of its features. The considered background subtraction is the background average process introduced in [34]. The image background is initialized, once the first frame is introduced. Then, an exponential filter is used to modify the background pixels. The background model is initialized and updated according to Eq. (1).
where, B is the background model with I and j indexes at the nth step, and α is the learning rate. Thus, the background model is modified according to the upcoming frames. For an exponential filter with a time constant δ, the learning rate can be calculated as in Eq. (2).
where, T is the sampling interval.
The developed deep learning model is introduced for presence detection. The developed people detection CNN is referred to as P-CNN and consists of an input layer, middle layers, and YOLOv2 output layers. The proposed P-CNN is a modified version of YOLOv2. Tab. 2 presents the structure of the developed middle layers, with the filter size, and the output shape and size of each layer.
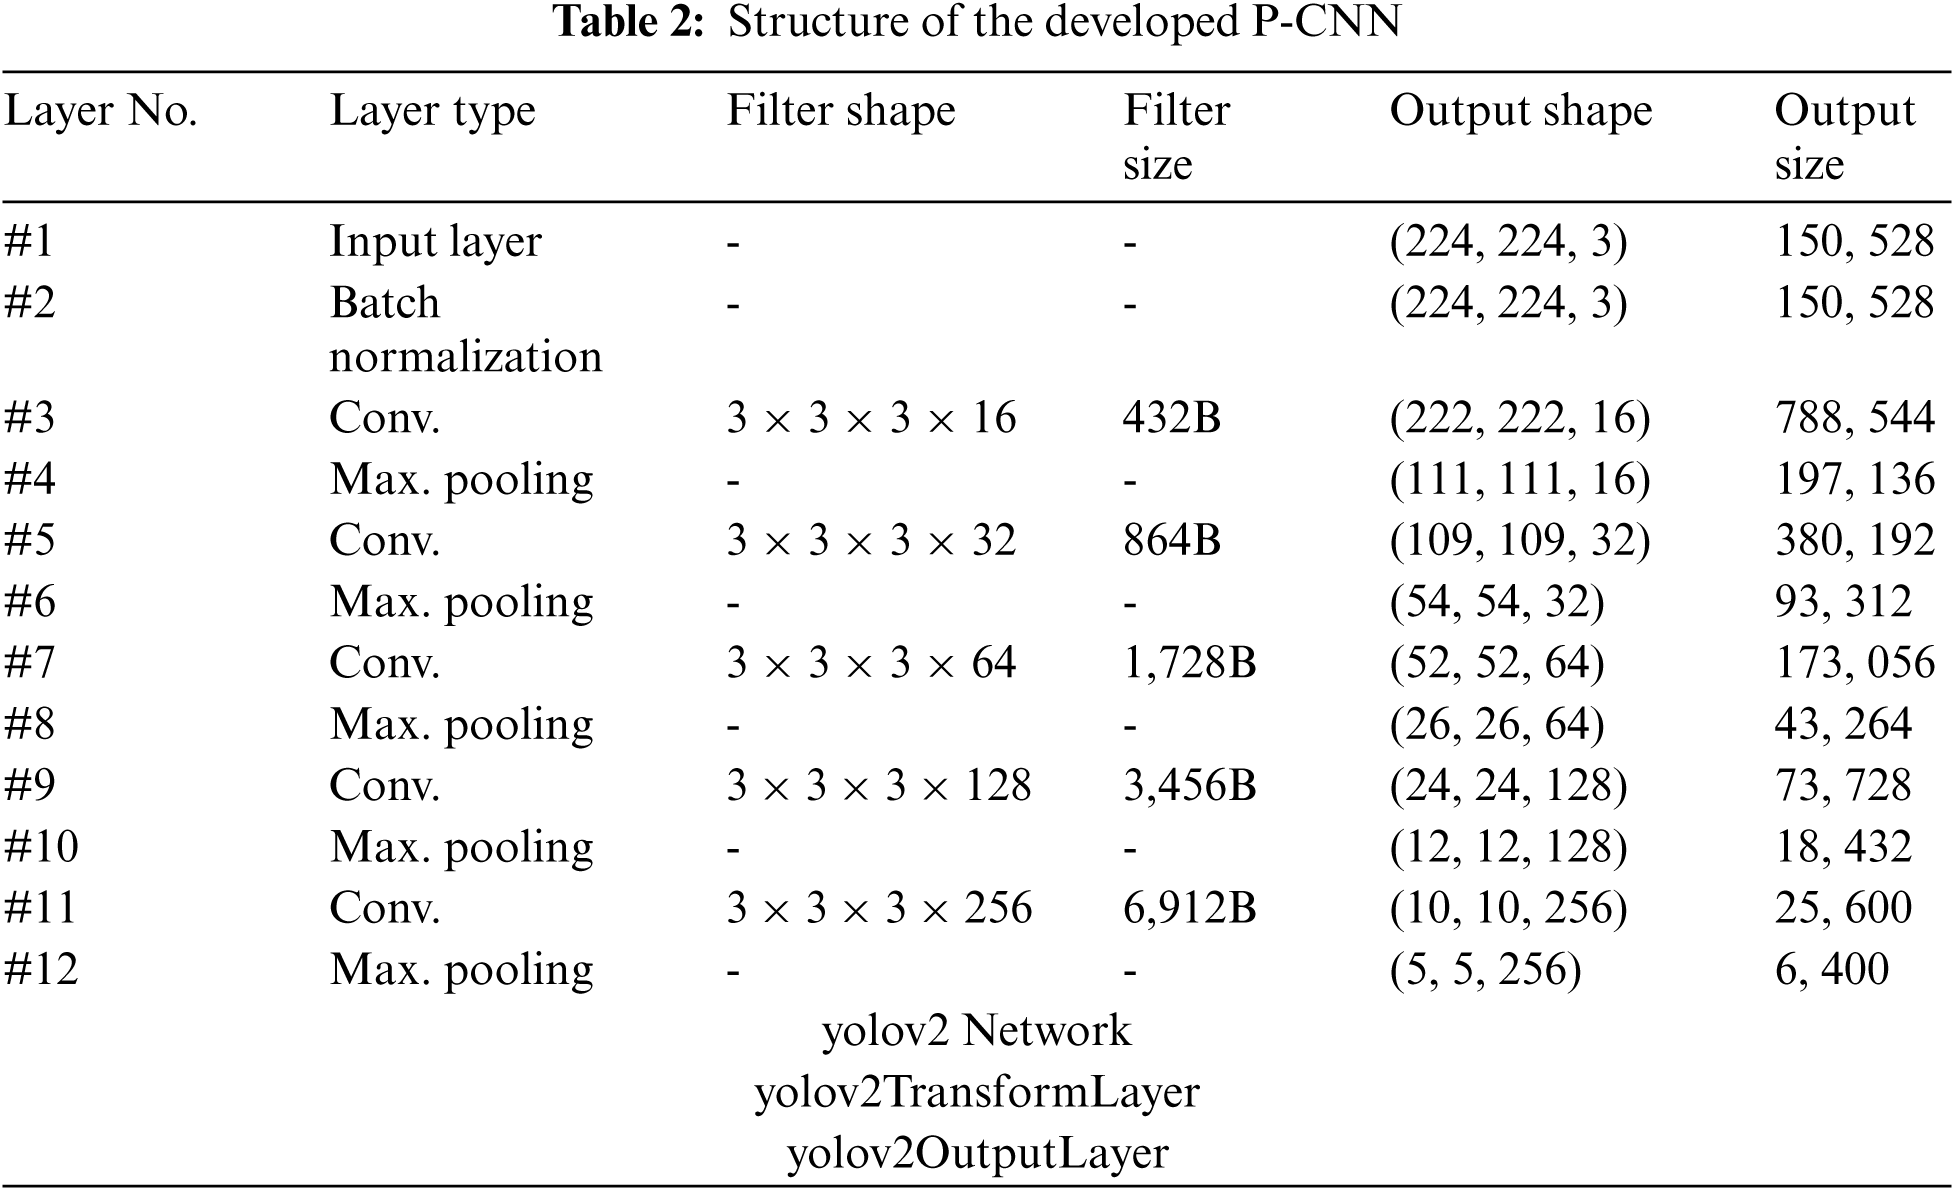
CNN extracts the features from the input image by performing digital filtering. Thus, to control the performance of the CNN, filter parameters should be adapted. This includes the kernel size, i.e.; filter size, and the stride size. All layers are selected to have the same kernel size, i.e., filter size, of 3 × 3 and thus, a stride size of 1. The input image is assumed to be of size 24 × 24.
The output of the proposed P-CNN, i.e., bounded box for each detected people, represents the region of interest. Each bounded box represents a detected person, and it is required to estimate his temperature to monitor COVID-19, and alarm the user that uses the proposed system, in case of abnormal measures. For temperature evaluation of each detected people in the surrounding, we select a specific point in each box per frame using the minimum eigenvalue algorithm. Then, the proposed algorithm determines the mean temperature of each SP point that represents the temperature of the corresponding person. Thus, the temperatures of all surrounding people are detected and monitored. The proposed algorithm checks whether the recorded temperature is higher than a threshold level, i.e.; 38°C, or not. If a recorded temperature is higher than the threshold level, this indicates that the surrounding person with such body temperature is probably infected, and the proposed system sends an alarm via the IoT system and the cellular network, i.e.; SMS, to the user to take care of the surrounding. If the algorithm records more than two probably infected people in the surrounding, i.e.; more than two detected temperatures associated with the facial detection exceed the threshold level, the fog unit calls a drone for sterilizing the region. The algorithm responsible for calling the drone and managing its operation, based on SDN network management, is introduced in the next section.
3.2 Drone-based Sterilizing System
Each city is assumed to have a group of UAVs, i.e., drones, that are used for sterilizing public areas. These drones are distributed over the city in certain locations. In our proposed scheme, we assume that each drone is associated with a medical health center, and once it receives a sterilizing request, it flies to the mentioned area for sterilizing. Each drone is assumed to cover an area of 5 km in dense urban regions and 10 Km in rural regions. Thus, based on the area of the city, we can estimate the required number of drones that are used for sterilizing, and their optimum locations.
Fig. 4 presents the end-to-end system structure of the proposed drone sterilizing system. The system consists of distributed drones that are placed in pre-defined locations, with an alcohol-tank connected to each drone for the sterilizing process. The considered drone has a similar structure as the Thermal Corona Combat Drone (TCCD) developed in [11]. Drones are connected to a ground control unit located at the center of the city. The ground control unit consists of a ground base station connected to an edge server, i.e., a mobile edge computing (MEC) server, and controlled by an SDN network. Thus, the drone-based sanitization system can be viewed as three layers; the distributed drones, the ground base station with a MEC server, and the SDN network.
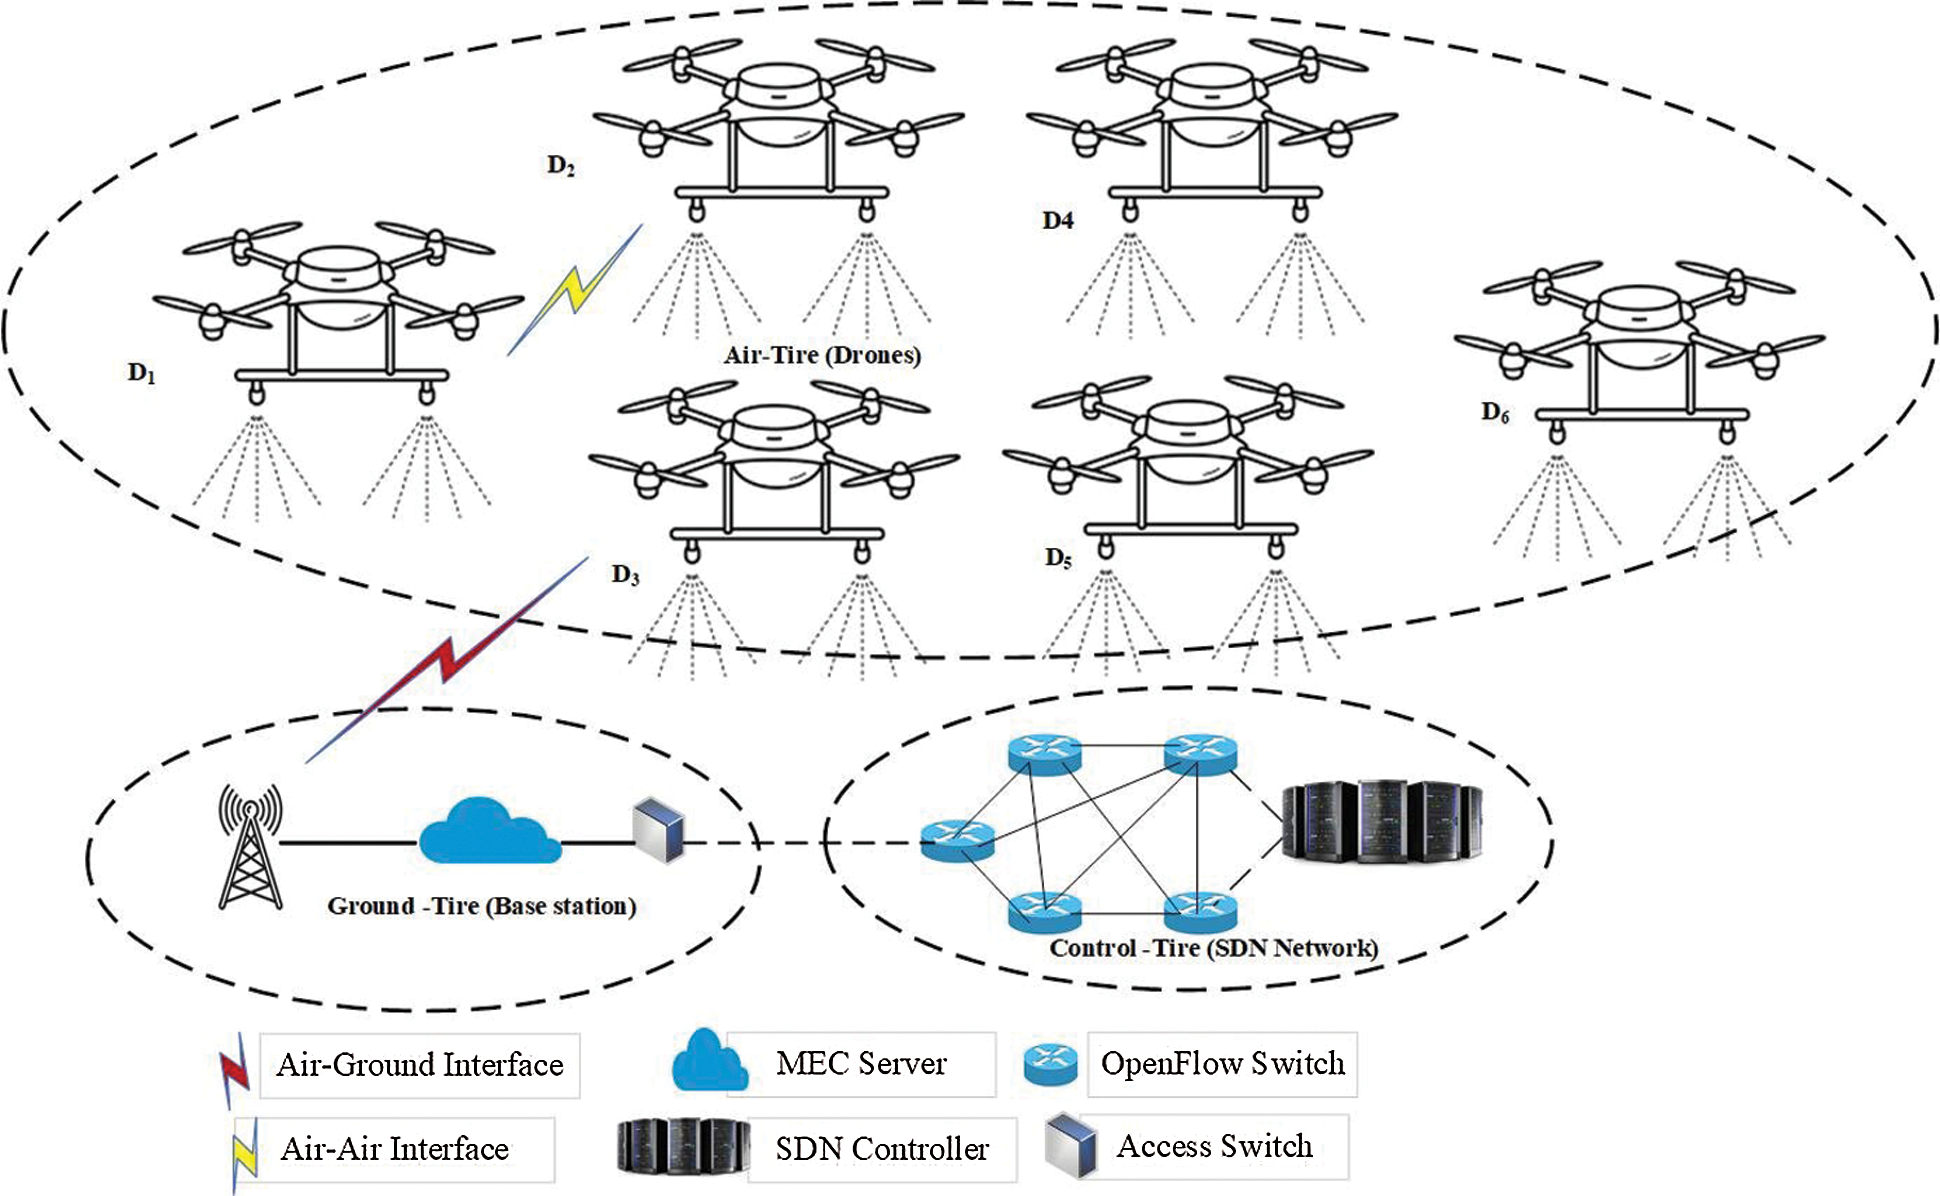
Figure 4: End-to-end system structure of the drone sterilizing system
Drones communicate with the ground base station via a cellular spectrum interface, e.g.; 5G or LTE-A. The city is divided into k heterogeneous regions of different areas, based on the expected density of citizens per region. The city is served by a set of sanitization drones D, where D is defined as in Eq. (3).
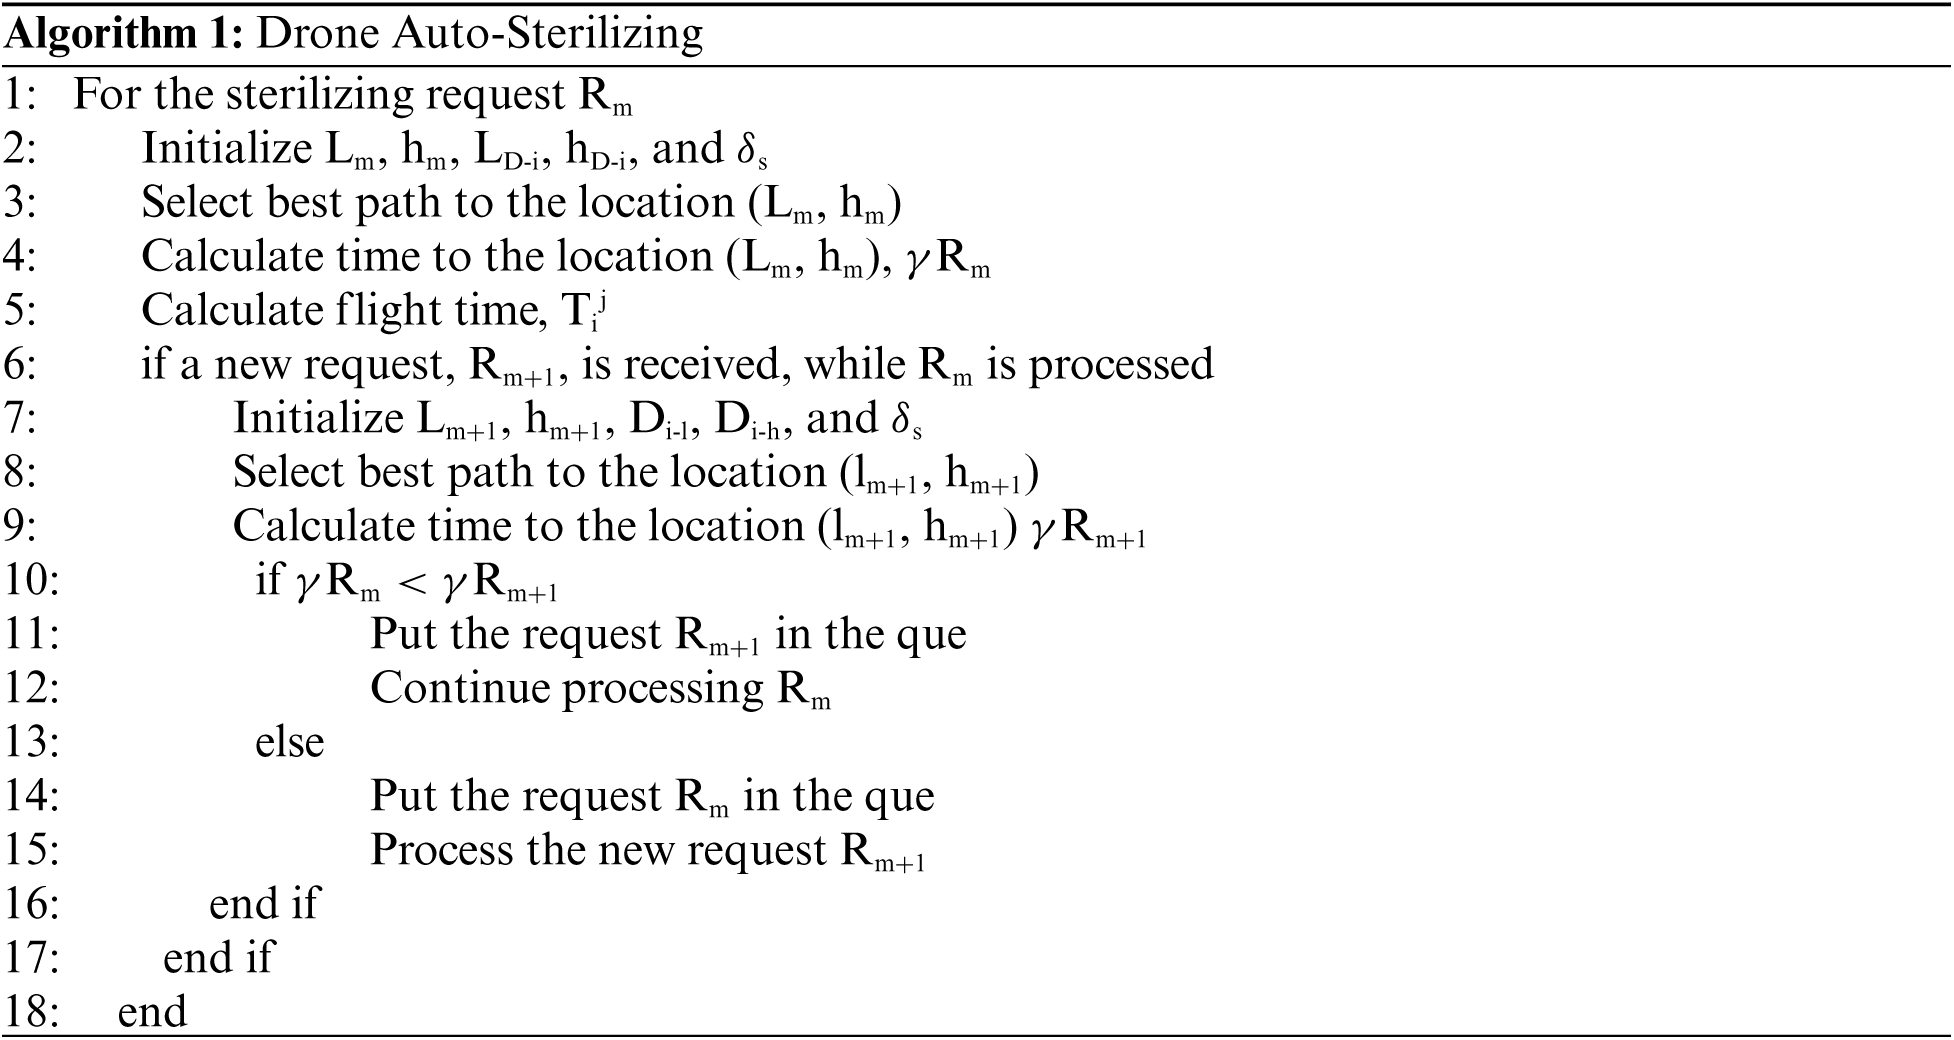
Each region is served by a drone, Di, that is located at a location of coordinates LD-i, hD-i; while, the ground control unit is located at the center of the city at the coordinates of LBS and hBS. Once a sanitization request is sent to the control unit, it sends the drone, in the corresponding area, the GPS coordinates, L and h, of the location that should be sterilized. Algorithm 1 introduces the mechanism of the drone-based sanitization process.
The base station is connected to a MEC server to provide the computing capabilities and to implement the proposed algorithm. All fog nodes are connected to the MEC server via IoT gateways. MEC server is connected to the application server, and it offloads the collected data under the control and management of the SDN network. It implements the previously developed offloading scheme developed for MEC-based UAV systems, introduced in [35]. Moreover, we implement our previously developed latency and energy-efficient routing protocol developed for UAVs networks, introduced in [36]. The algorithm is implemented by both the ground base station and the drone to manage data transfer between the ground base station and the drone, and between the drones in different regions.
SDN network represents a critical part that affects the overall performance of the proposed system, in terms of latency, reliability, availability, and flexibility. A centralized SDN scheme with a single centralized SDN controller is deployed for the proposed system. Fig. 5 introduces the structure of the SDN network deployed for the proposed system. The network can be viewed as three main planes; Control plane, data plane, and edge server plane.
All fog nodes are connected to the SDN core network to facilitate the control and management of the network. This is to provide the required network flexibility, availability, reliability, energy efficiency, and latency efficiency. The centralized SDN controller is used to achieve the following functions; topology management, data plane addressing, traffic routing, and fog server control. The topology control includes topology setting up, discovery, monitoring, and topology modification. This process is based on the deployed SDN controller type. Any of the SDN controllers introduced in [37] can be deployed for our proposed system.
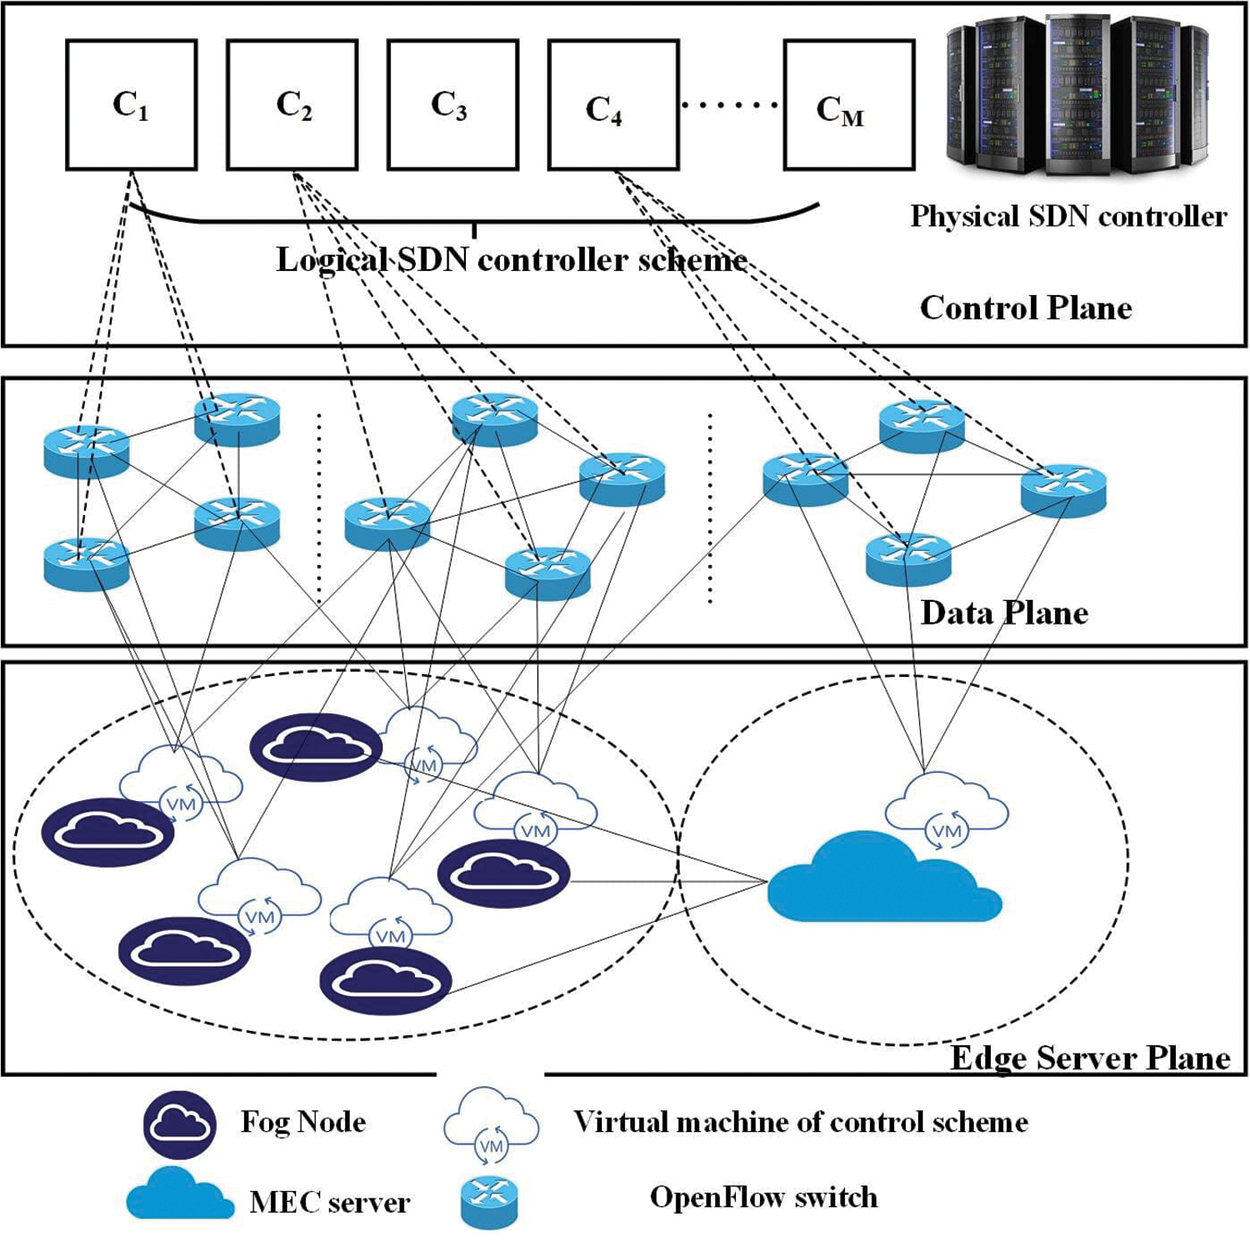
Figure 5: Structure of SDN network
The data plane addressing includes addressing OpenFlow switches via the appropriate OpenFlow interface deployed for the SDN network. SDN controller modifies the data plane network based on the network traffic by introducing new switches or putting exiting ones in sleep mode. For achieving higher network performance, our previously developed clustering scheme, introduced in [38], is implemented for the SDN controller. This clustering algorithm turns the centralized SDN scheme into a logical distributed scheme, which achieves better performance in terms of system availability, reliability, flexibility, and latency. This clustering scheme achieves load balancing.
SDN controller manages the traffic routing through the data plane using the defined messages introduced in [37]. A virtual version, i.e., virtual machine version (VM), of SDN controller is implemented on each fog node to provide the control scheme at the micro-data centers.
The Link Layer Discovery Protocol (LLDP) is the used discovery protocol that is deployed to save energy, by balancing load among fog nodes. LLDP lets all devices broadcast their identifications and resources and thus, enables the interaction between different layer systems. Deploying LLDP for topology detection in our developed SDN-based fog system achieves many benefits in terms of energy and security. Moreover, LLDP is deployed to reconstruct and reorganize OpenFlow messages.
Introducing LLDP to OpenFlow SDN network provides high flexibility of the flow table exchanged between SDN controller and OpenFlow switches [39]. Fig. 6 presents the format of the LLDP frame, which is a one-way protocol. The first two fields represent the header of the frame, and contain the addresses of the advertising node and the receiving devices. LLDP allows devices to broadcast a periodic advertisement to discover surrounding devices. The second main field of the LLDP frame is introduced for the Ethertype, with a default value of 0 × 88cc, which is responsible for identifying OpenFlow's discovery packets. The third main field is the payload data unit, PDU, which consists of Type Length Value, TLV, units that are either mandatory TLVs, or optional TLVs.
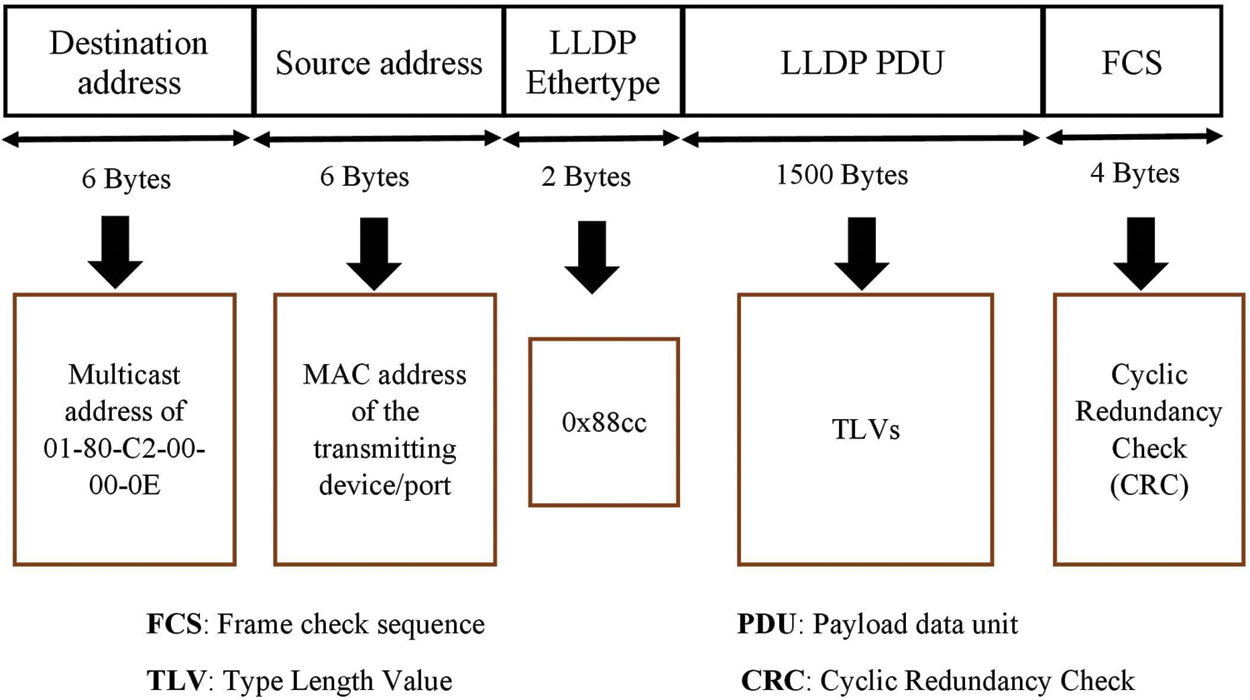
Figure 6: Format of the LLDP frame
Fig. 7 introduces the structure of LLDP PDU, with the main fields and types. PDU of LLDP starts with the three necessary TLVs, i.e.; mandatory TLVs, which are Chassis ID, Port ID, and Time to Live; while, it ends with an end mandatory TLV that defines the end of PDU. Besides mandatory TLVs, a set of optional TLVs (OTLVs) is deployed for optional functions such as discovering the quality of service, QoS, parameters. The OpenFlow switch that sends the LLDP frame is identified in the Chassis ID field TLV; while, the transmitting port of the OpenFlow switch is identified in the Port ID TLV. The validation time of the LLDP frame is defined in seconds in the field of time to live LTV.
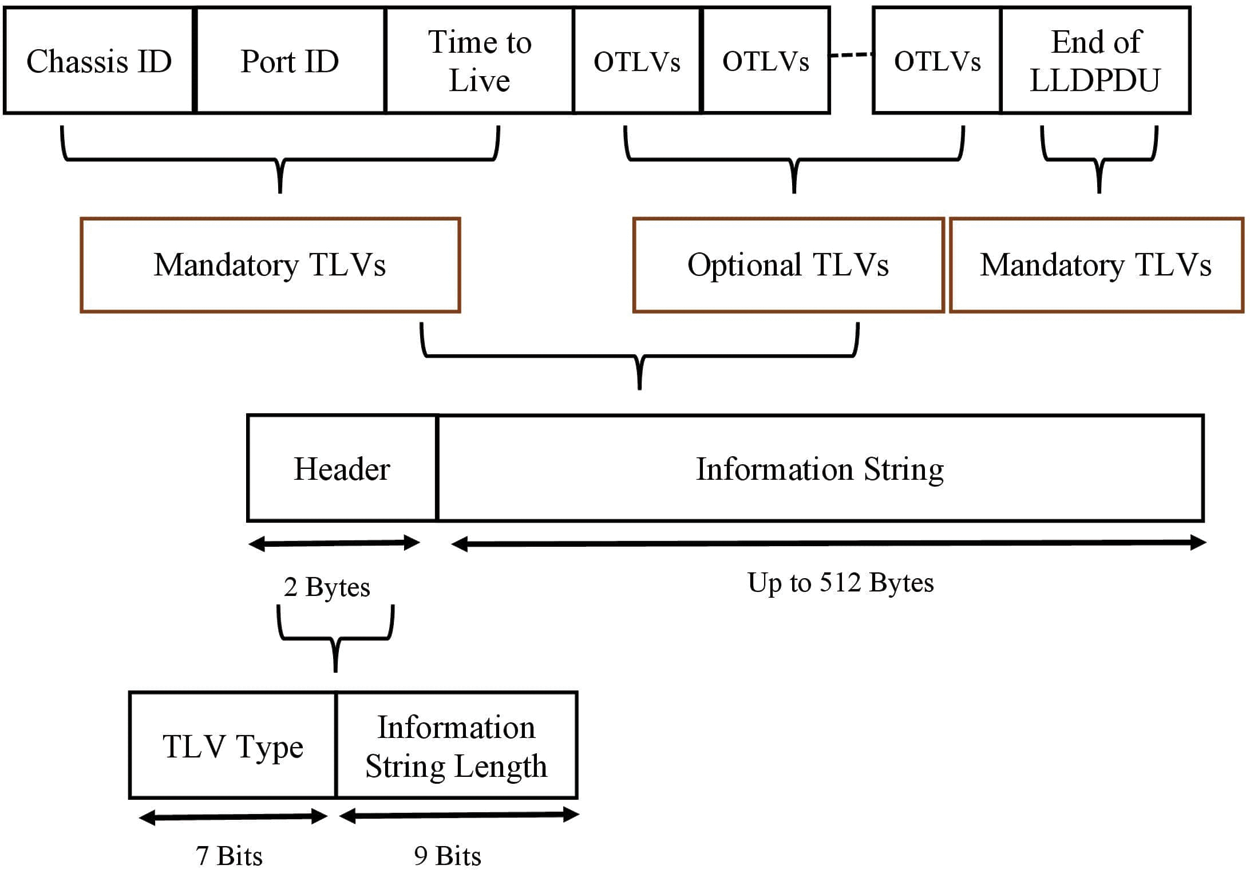
Figure 7: Structure of the LLDP PDU
Deploying LLDP for discovery, in OpenFlow SDN networks, is completely different from traditional networks. In SDN networks, the SDN controller asks the distributed OpenFlow switches to send LLDP packets for discovering the network topology in the same procedure introduced in Fig. 8. This is after performing the initial handshaking by exchanging the controller-to-OpenFlow switch message, FEATURE REQUEST MESSAGE, and the switch-to-controller message of type FEATURE REPLY MESSAGE.
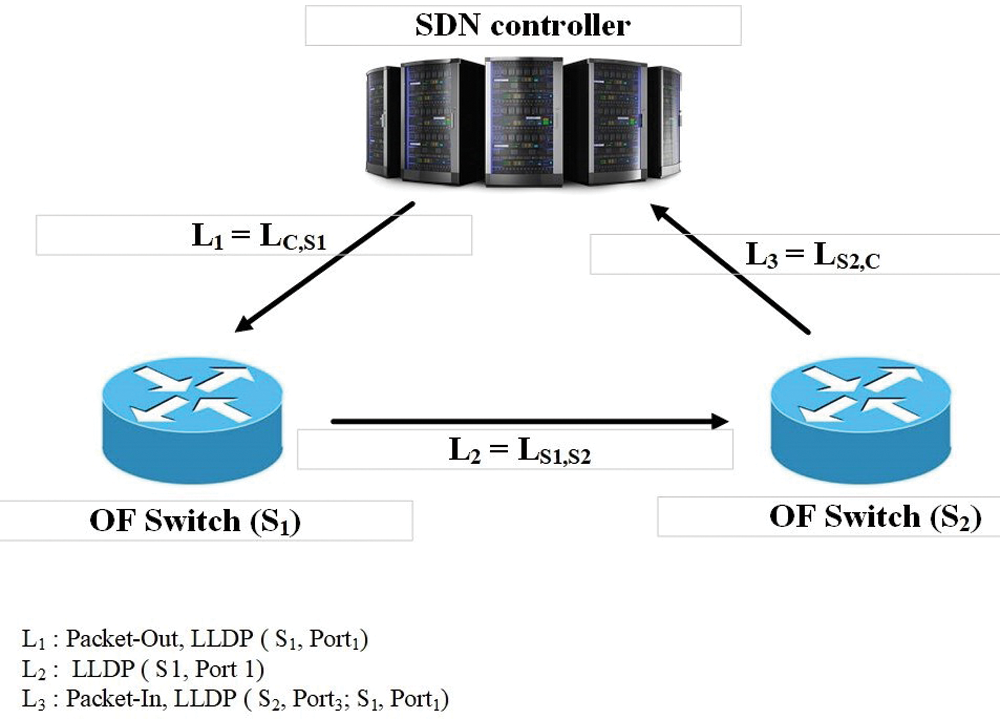
Figure 8: SDN network discovery
To define the controller overhead, we first calculate the amount of input and output LLDP packets, PIN, and POUT. The number of LLDP packets entering the SDN controller is calculated as double the sum of the inter-switch links, LSi,C, as introduced in Eq. (4). While, the number of LLDP packets out of the SDN controller is equal to the number of the active switches, M.
This section provides the performance evaluation of the proposed framework with the included systems. The section is divided into three sub-sections introduced for the performance evaluation of each of the developed system. The first sub-section is introduced for performance evaluation of the developed AI algorithm for temperature monitoring of the surrounded people. The second sub-section provides the performance evaluation of the drone sterilizing system; while, the third sub-section is introduced for performance evaluation of the overall SDN-based framework. Results are at a confidence interval of 95%.
4.1 AI/IoT Temperature Monitoring System
The developed AI-based temperature monitoring, with the developed P-CNN, is evaluated using MATLAB environment with the ground truth labeler application provided by MathWorks team [40].
The developed P-CNN was trained using three different thermal images datasets. The three datasets consist of thermal images, and consider person detection training. The first dataset, dataset I, consists of 1250 captured thermal images of persons in heterogeneous situations and locations. The dataset is collected from the Internet. The first dataset, Dataset I, contains thermal images of people in different places, and different body orientations. Moreover, persons in different images are of different mobilities. The second dataset, dataset II, is also collected from the Internet besides the thermal images in our local lab. Dataset II consists of 1850 thermal images, with heterogeneous specifications and features. The third dataset, dataset III, is of 2000 images, and mostly collected from the online FLIR company's datasets, available in [41].
Images in each dataset are divided into 90% for the training process, and 10% located for testing. For the training process, the 10-fold cross-validation is used, thus 90% of the training set is randomly selected for training, while 10% of the training set is used for validation.
The developed P-CNN is evaluated using the three introduced datasets, and the considered performance metric is the accuracy. Accuracy of P-CNN is calculated, as in Eq. (6), as the percentage of the sum of the true positive, T+, and the true negative, T−, to the total population.
Fig. 9 provides the results of the accuracy and the loss for dataset I, where the accuracy increases gradually and steadily at 96.8% after the tenth epoch. The accuracy and the loss results of the second dataset, dataset II, are presented in Fig. 10. The accuracy increases gradually and steadily at 96.7%. Fig. 11 presents results for dataset III, with an accuracy of 96.6%.
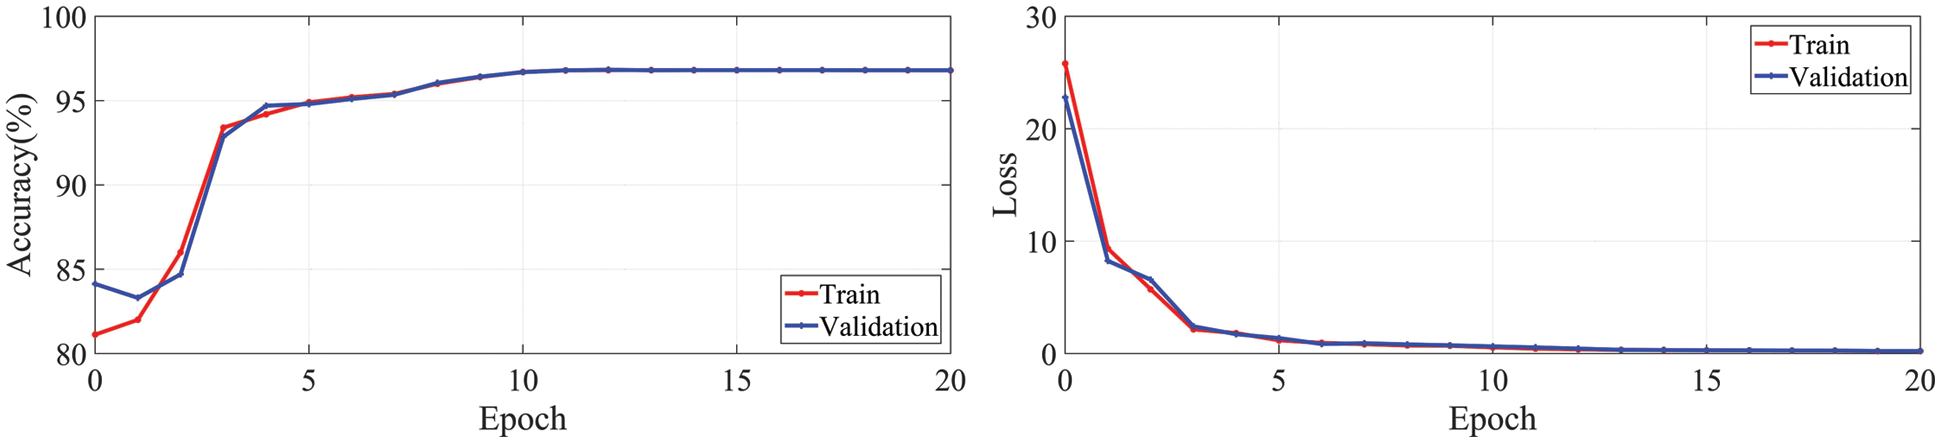
Figure 9: Accuracy and loss of the 1st dataset
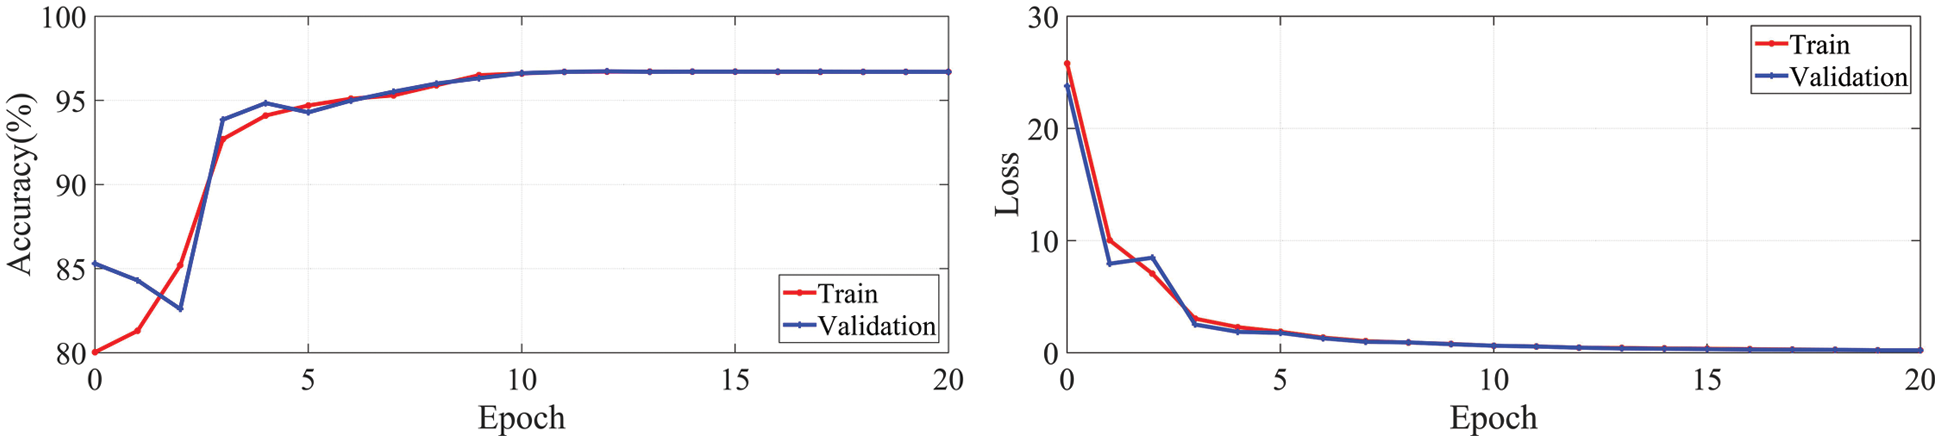
Figure 10: Accuracy and loss of the 2nd dataset
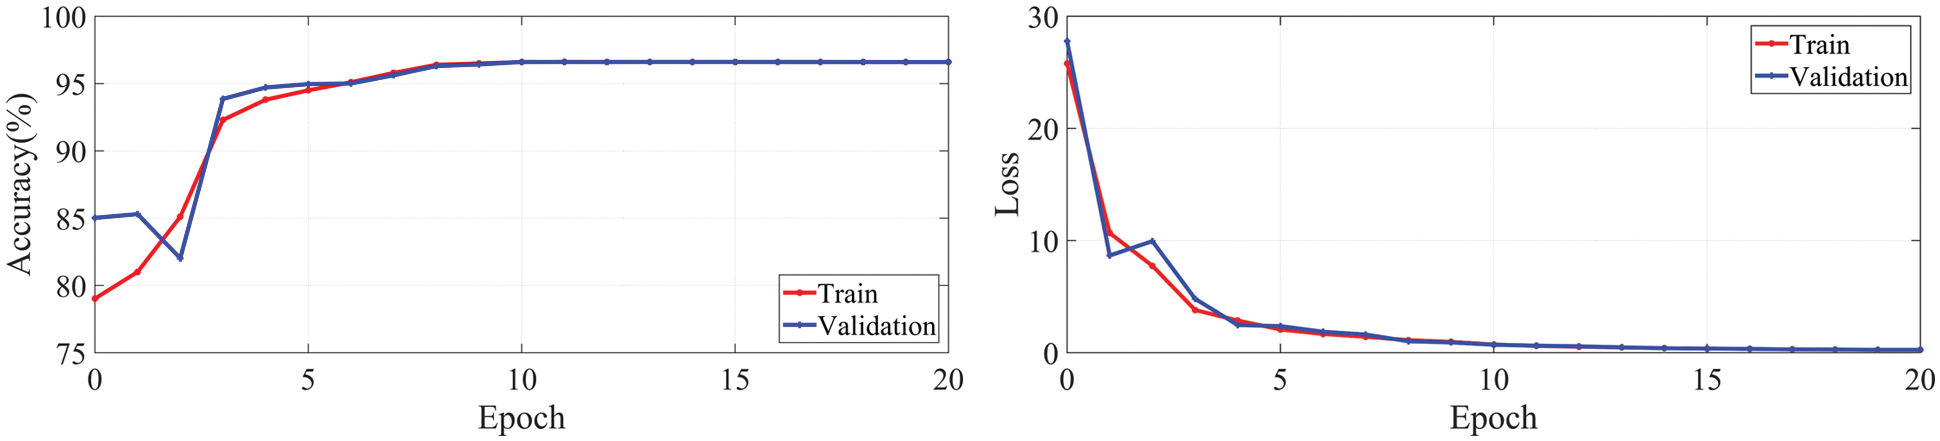
Figure 11: Accuracy and loss of the 3rd dataset
The drone-based sterilizing system is evaluated using OMNeT++ environment. The considered topology consists of ten heterogeneous regions, in terms of area and urban density, considered from the city of Riyadh. A drone is considered for handling each region, and is located at the center of each region. Tab. 3 provides the considered simulation parameters, in the simulation process, that are selected in a way that meets the real expectations.
Sterilizing requests are assumed to arrive at a random Poisson process at a Poisson rate of λ. The system is simulated for four hours and the performance is recorded during the simulation period. We consider the energy, latency, utilization, and reliability as the performance metrics of the proposed system. Four simulation cases are considered to study the effect of drone mobility on the performance of the proposed system. In each simulation case, the drones are assumed to have a mobility of a maximum value indicated in Tab. 3. The system is simulated for four times, each of them represents a simulation case, with different drone velocities in each case.
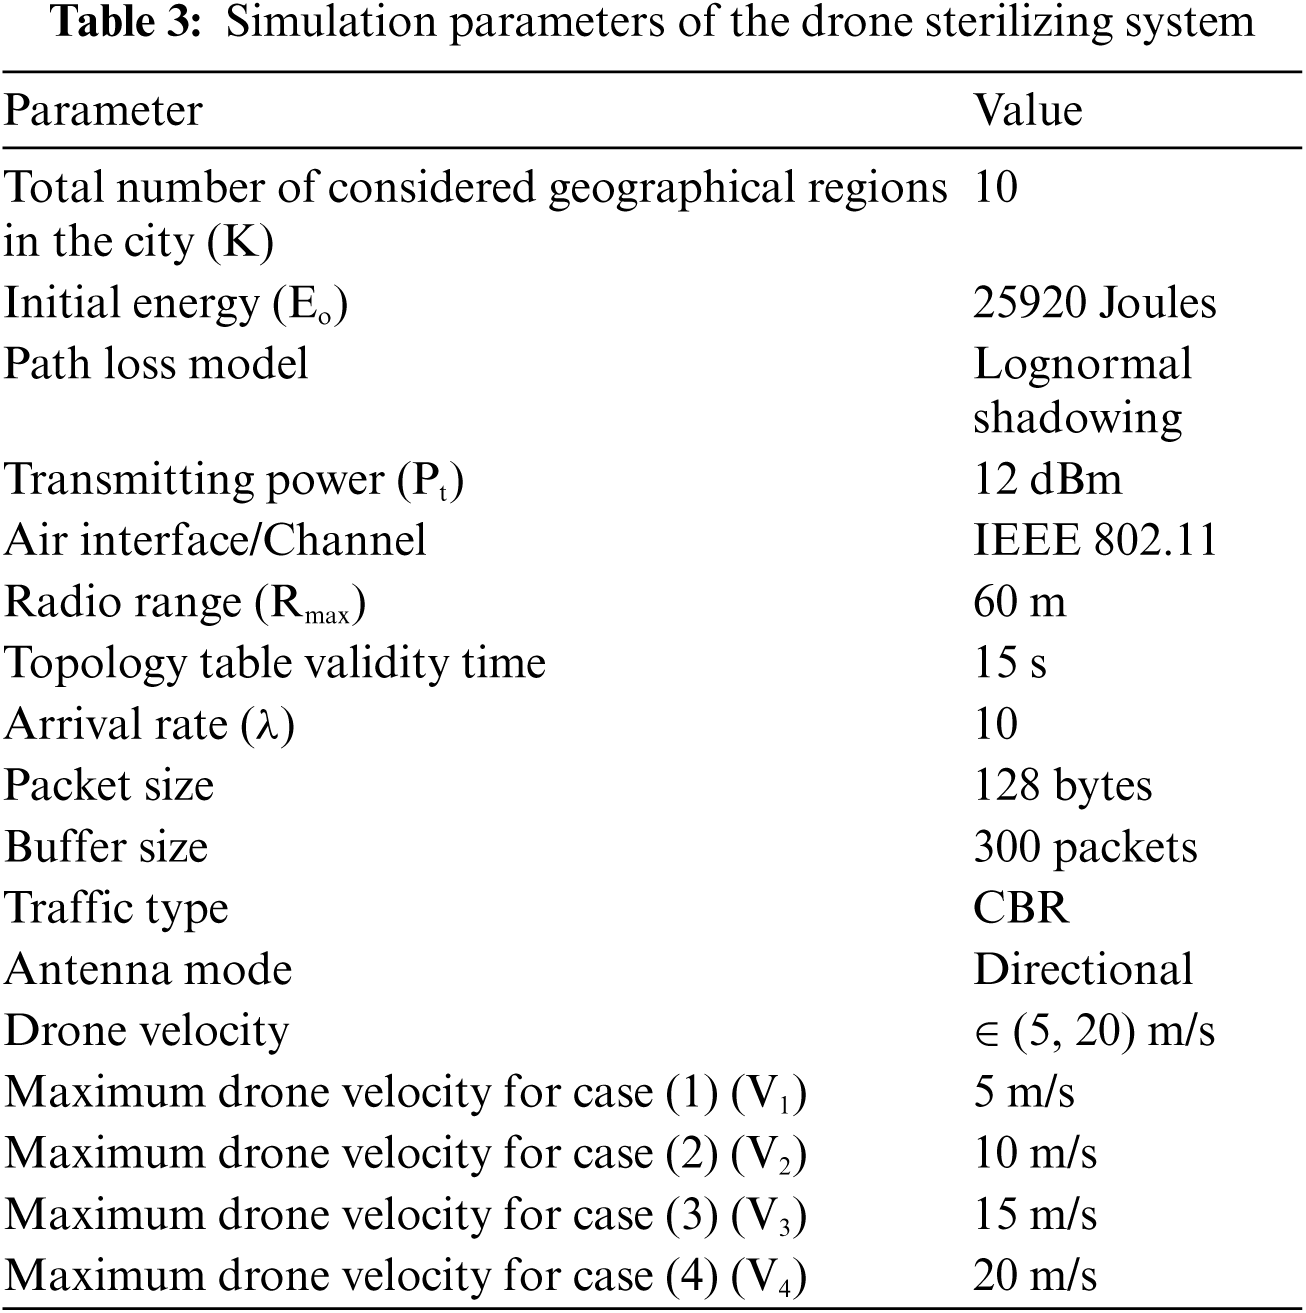
Fig. 12 introduces the percentage of the residual energy of each drone in the system after the four hours of the simulation process. These results are obtained, when the drone mobility is V2, 10 m/s. The mean value of the residual energy of all system drones after running the system for one hour is 90.6%, which indicates an energy consumption of 9.4% of the full battery, during the first hour of the simulation process; while, the residual energy decreases to 57.4 after the fourth hour.
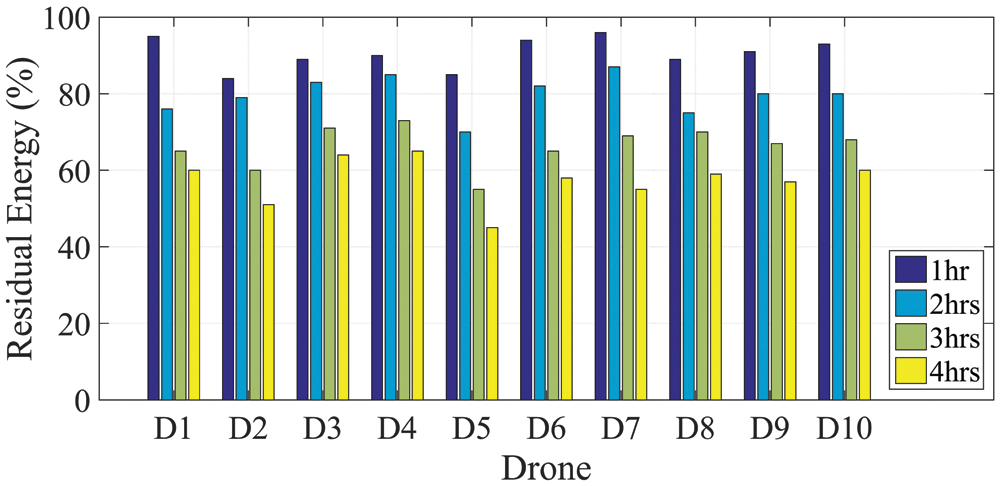
Figure 12: Percentage of the residual energy of each drone at V2
Fig. 13 presents the percentage of the residual energy of each drone, in each case, after a simulation time of two hours. As presented in the figure, the energy consumption increases with the increase of drone mobility, at different rates for each drone. The mean value of the percentage of the residual energy of system drones, when flying with a maximum velocity of 5 m/s, is 85.7%; while, the mean value of this percentage decreases to 63.5% when flying with a maximum velocity of 20 m/s.
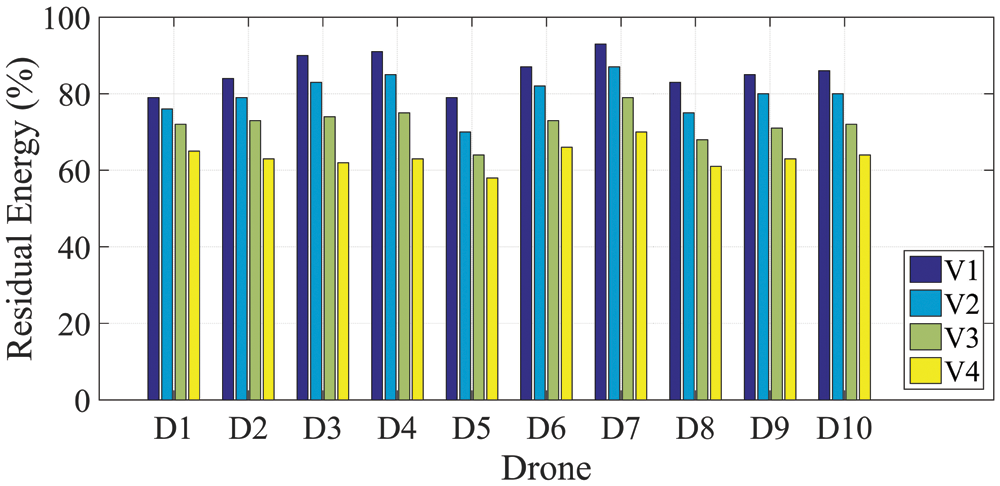
Figure 13: Percentage of the residual energy of each drone at different mobilities, after two hours
Fig. 14 introduces the average flying time, of each drone in the system, after each hour of the four simulation hours. These results are obtained, when the drone mobility is V2, 10 m/s. The average flying times of the system drones are different since the requests passed to drones are not the same. Some drones receive sterilizing requests more than others. Another main reason for the wide difference in flying time of different drones is the difference of locations of the sterilizing requests. For requests with locations near to the center of the geographical region, i.e.; static location of the drone, the flying time is small compared to far locations. Thus, the heterogeneity of sterilizing requests, in terms of rate and location, from region to region results in the difference in the average flying time of system drones.
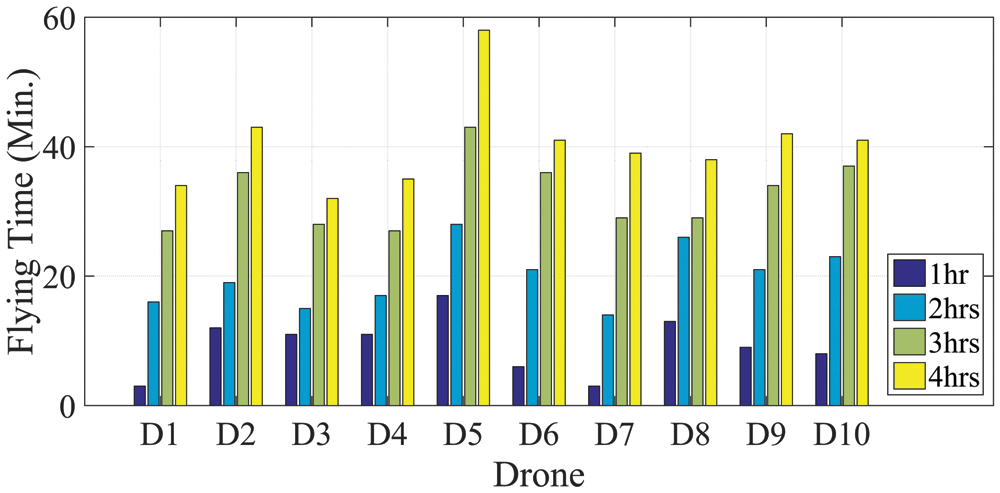
Figure 14: Average flying time of each drone at V2
Fig. 15 provides the average flying time, of each drone in the system, for the four considered mobility cases, for a simulation time of two hours. Results indicate that the average flying time decreases, as the mobility increases, with an average of 73.4% for case 4 compared to case 1.
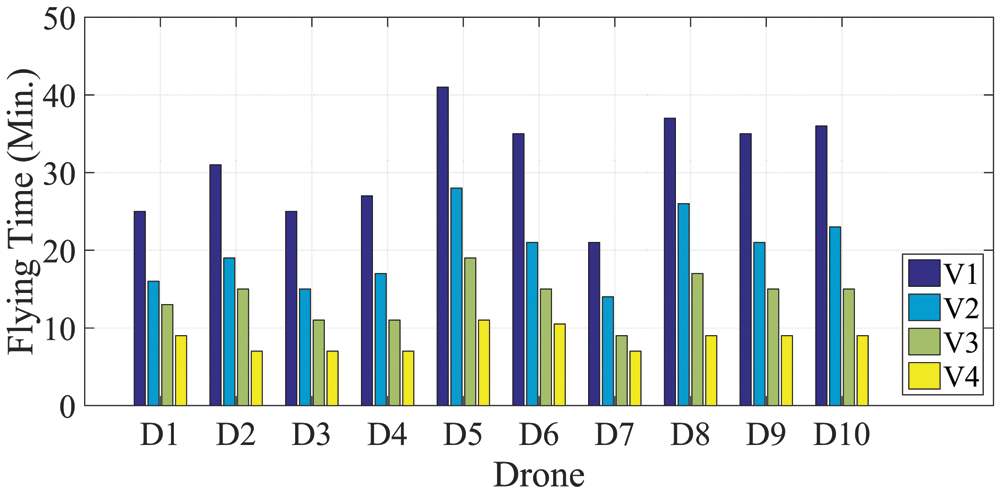
Figure 15: Average flying time of each drone at different mobilities, after two hours
Fig. 16 provides the packet delivery ratio, PDR, of each drone in the developed system over the simulation time, for the considered four cases. PDR is defined as the percentage of successfully received packets to the overall transmitted packets. It is a measure of the reliability of the developed drone sterilizing system. We introduce these measures to evaluate the overall reliability of the system and to study the effect of drone mobility on reliability. As presented in Fig. 16, the PDR of all system drones decreases with the increase of drone mobility, i.e., moving from V1 to V4. The mean value of percentage decrease in PDR, when drones travel with 20 m/s compared to 5 m/s, is 1.8%.
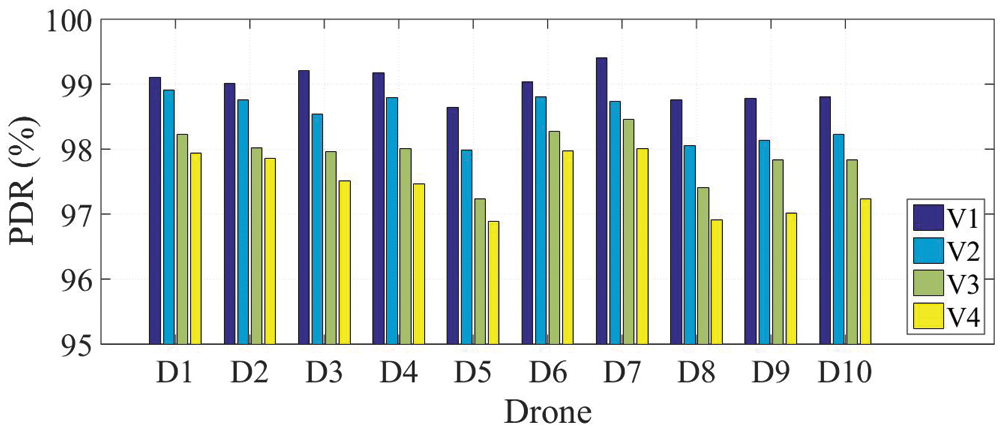
Figure 16: Packet delivery ratio, PDR, of each drone at different mobilities
Fig. 17 introduces the percentage of the time utilization of each drone when flying with the four different mobilities. The utilization decreases as the drone velocity increases; while, this comes on the drone's energy. The percentage of the handled sterilizing requests by each drone is indicated in Fig. 18, which indicates the percentage of the total number of handled sanitization requests compared to the total requests. The percentage of the total successfully handled requests differs from drone to other, due to the priority issue of the offloaded requests as per the developed algorithm, i.e.; Algorithm 1. The average value of the successfully handled sterilizing requests of all system drones is 95.4% of the total offloaded sterilizing requests.
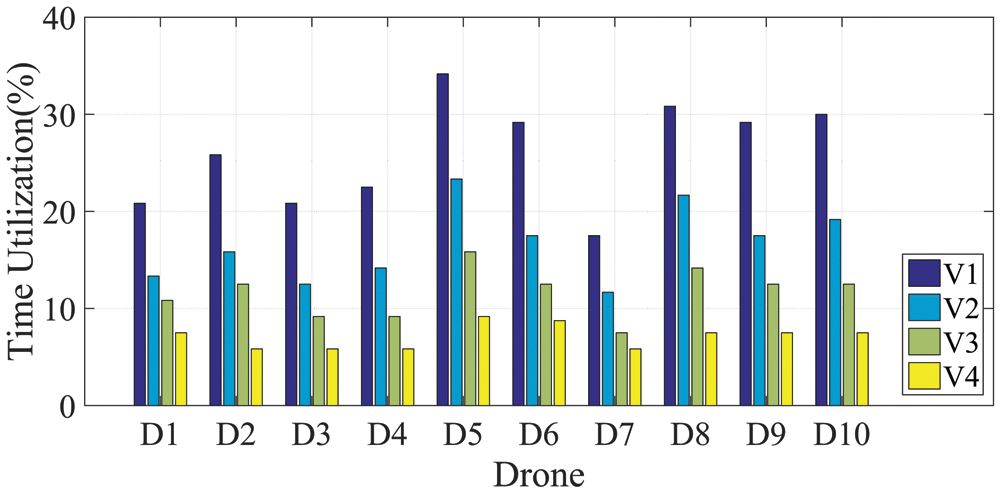
Figure 17: Percentage of time utilization of each drone at different mobilities
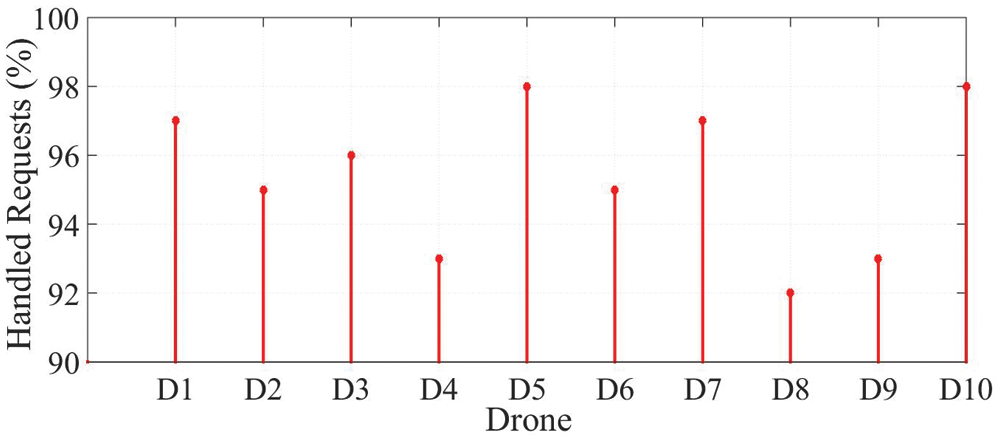
Figure 18: Percentage of the handled sterilizing requests of each drone
The developed SDN network with the connected systems, i.e., the MEC server for drone sterilizing system, and the distributed Fog nodes of the temperature monitoring system, is simulated using Mininet emulator environment. A network with a distributed twenty fog nodes, and a MEC server is assumed for the simulation process. Fig. 19 illustrates the considered topology for the simulation process.
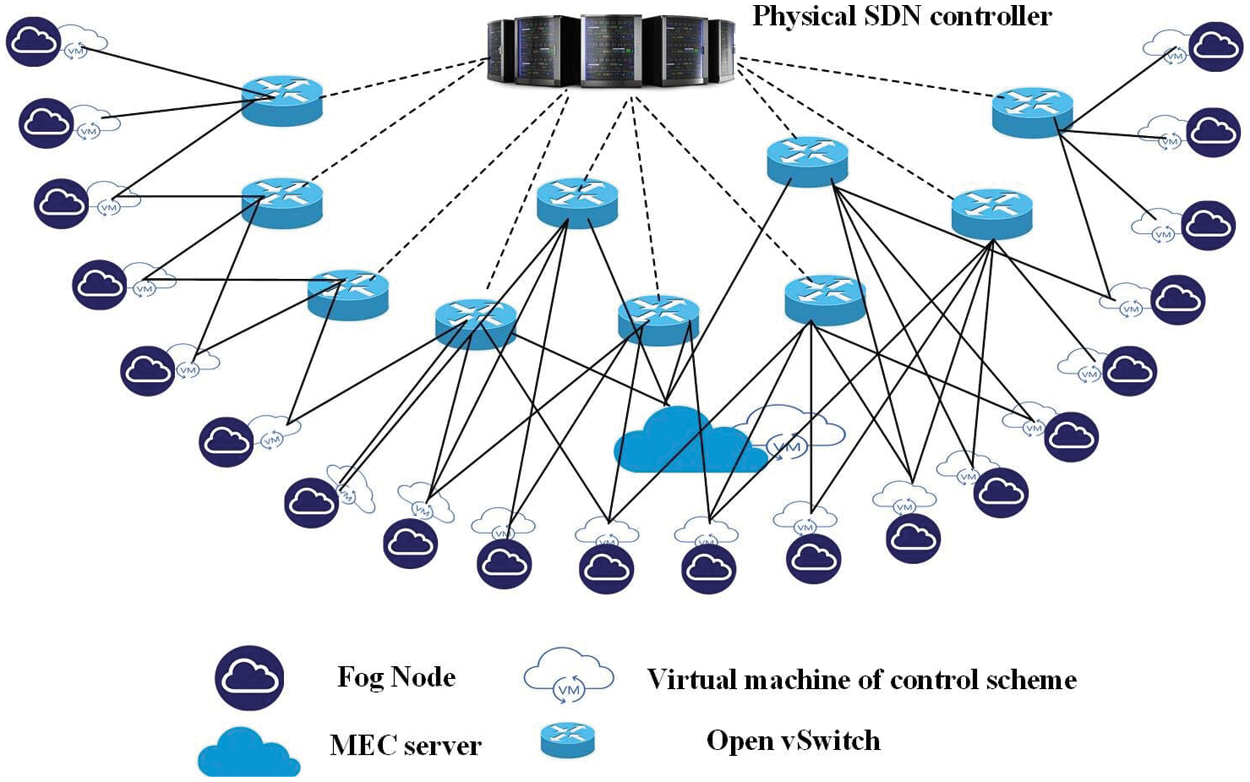
Figure 19: Topology of simulated SDN network
The SDN network deploys a single centralized SDN controller with distributed Open vSwitches, with the specifications indicated in Tab. 4. The emulation process is carried out over a device with a Core i7 Intel processor of 1.8 GHz, and a memory of 16 GB DDR4. The system is simulated two times; one with the presented topology, i.e., with SDN network, and the other time is without the SDN network. This is to evaluate the effectiveness of introducing the SDN to the developed framework.
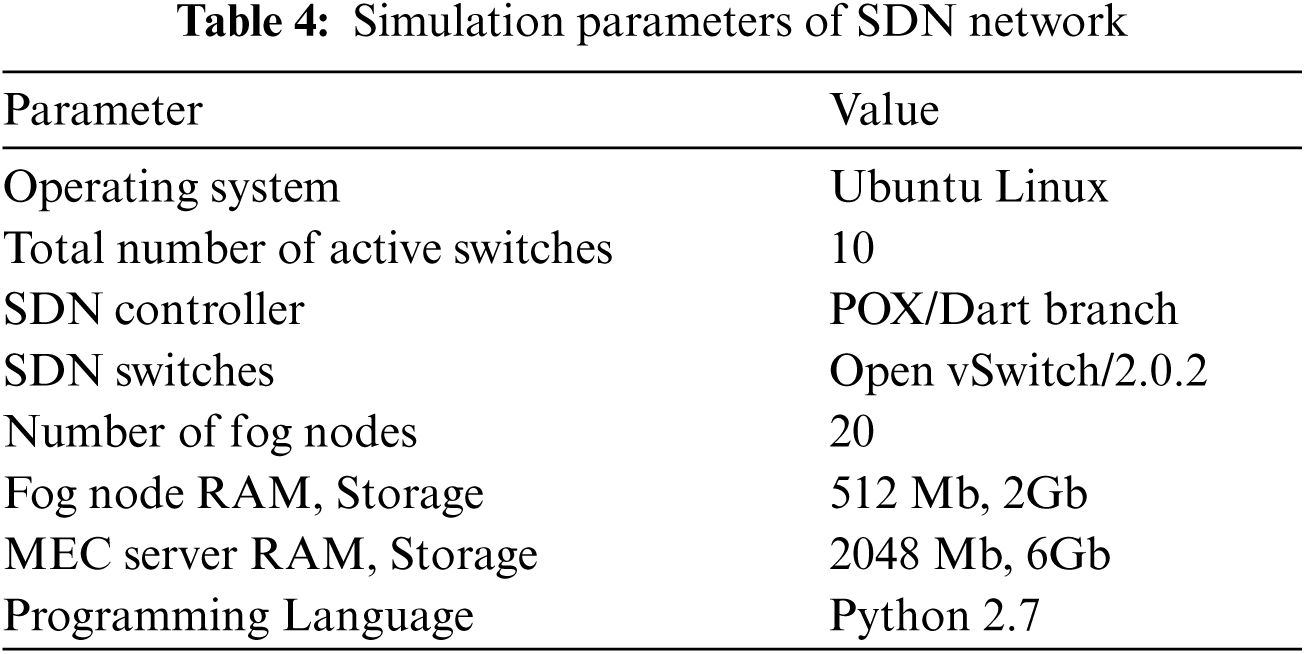
Fig. 20 presents the percentage of average available energy of all edge computing units, MEC server and fog nodes, with the simulation time, for the system with SDN network and without SDN network. The introduction of the SDN network increases the overall energy efficiency of the system as the average available energy falls to zero after 3.6 h of simulation for the network without SDN; however, more than 20% of start energy is available after this time when using SDN network. Thus, the introduction of the SDN network to the developed framework achieves an improved energy performance with an average of 27%.
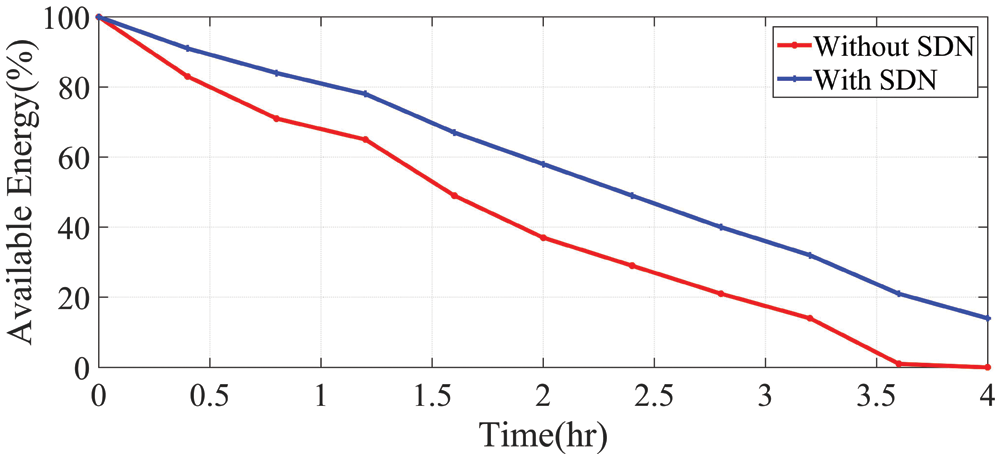
Figure 20: Percentage of average available energy of all edge computing units with the simulation time
Moreover, the introduction of the SDN network enables better utilization of the edge computing resources. Fig. 21 provides the percentage of the resource utilization of each fog node, during the simulation time, for both simulation scenarios; with the SDN network and without the SDN network. Results indicate that the introduction of SDN network increases the resources utilization of fog nodes; with a performance improvement of 17%.
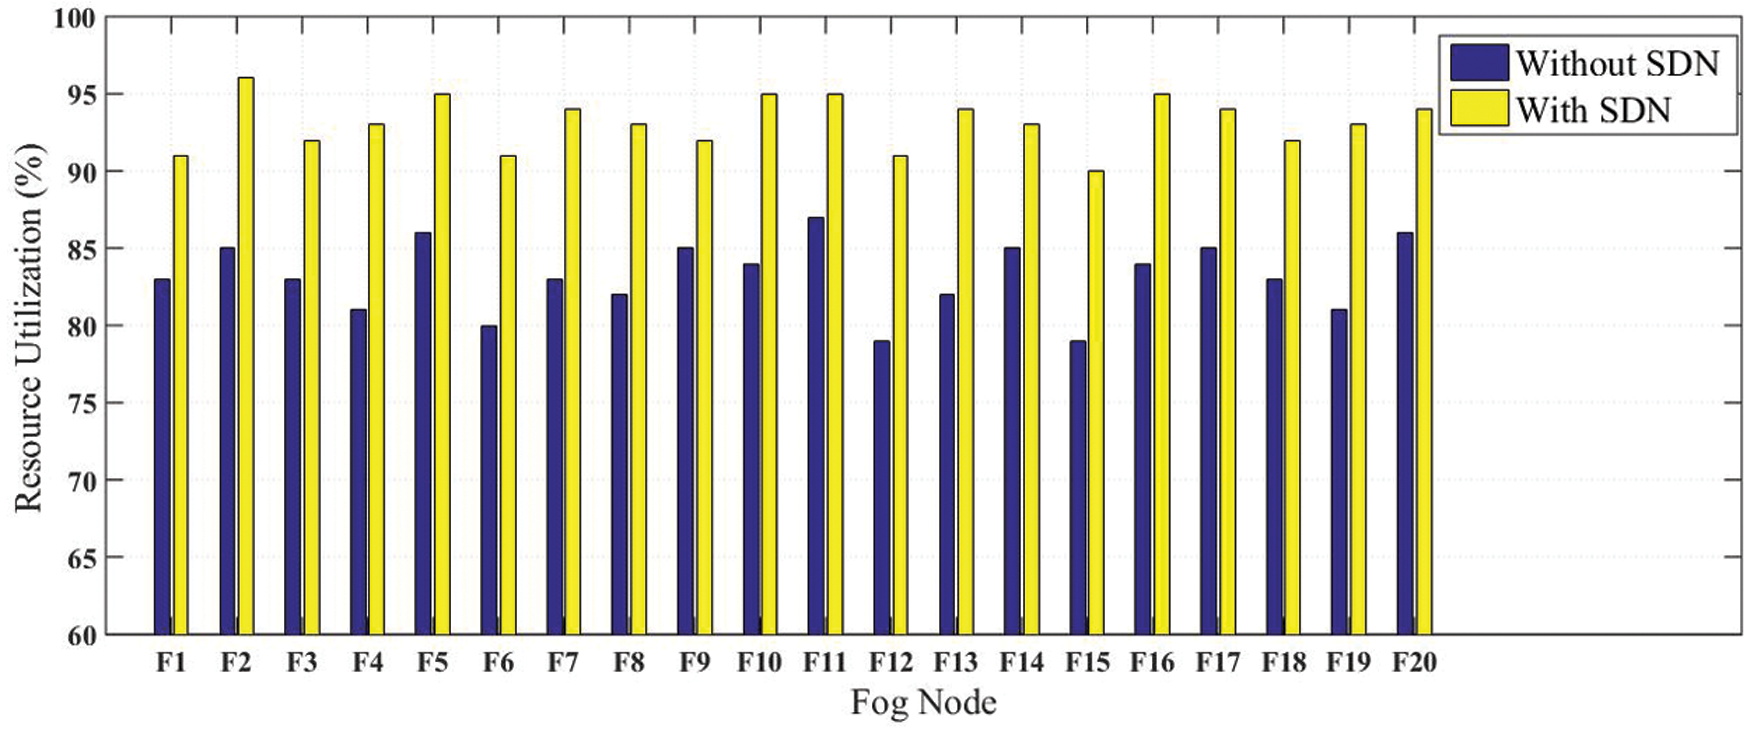
Figure 21: Percentage of the resource utilization of each fog node, during the simulation time; with and without the SDN
AI, IoT, drones, and SDN can be used as novel technologies to monitor and fight COVID-19, and future expected pandemics. The article provides a general AI/IoT-based framework to monitor and fight COVID-19. The developed AI/IoT COVID-19 monitoring system deploys a thermal camera to detect thermal images of the surrounding and forward them to a developed P-CNN to detect the number of people in the captured image, and determine their temperature. The developed P-CNN is a lightweight algorithm that is implemented by an IoT node connected to a fog unit. If more than two infected people are defined, the IoT system sends a request to a drone-based system for sanitization. The system is controlled and managed via a developed SDN network, with a single centralized control scheme. The system achieves higher energy efficiency in terms of energy and reliability, due to the introduction of the SDN network. Moreover, the system handles the sterilizing tasks with an efficiency of more than 95%. Thus, the developed framework provides an efficient solution for remotely monitoring and fighting COVID-19.
Funding Statement: The authors extend their appreciation to the Deputyship for Research & Innovation, Ministry of Education in Saudi Arabia for funding this research work through the project number (PNU-DRI-Targeted-20-033).
Conflicts of Interest: The authors declare that they have no conflicts of interest to report regarding the present study.
1. The World health report: Situation report 65, “Coronavirus disease (COVID-19),” [Online] https://www.who.int/emergencies/diseases/novel-coronavirus-2019/situation-reports, last access on 01-07-2021. [Google Scholar]
2. World Health Organization, “Coronavirus disease (COVID-19),” [Online]. Available: https://www.who.int/emergencies/diseases/novel-coronavirus-2019, last access on 01-07-2021. [Google Scholar]
3. D. H. Coelho, Z. A. Kons, R. M. Costanzo and E. R. Reiter, “Subjective changes in smell and taste during the COVID-19 pandemic: A national survey—preliminary results,” Otolaryngology–Head and Neck Surgery, vol. 163, no. 2, pp. 302–306, 2020. [Google Scholar]
4. T. P. Velavan and C. G. Meyer, “The COVID-19 epidemic,” Tropical Medicine & International Health, vol. 25, no. 3, pp. 278, 2020. [Google Scholar]
5. L. Li, Q. Zhang, X. Wang, J. Zhang, T. Wang et al., “Characterizing the propagation of situational information in social media during covid-19 epidemic: A case study on weibo,” IEEE Transactions on Computational Social Systems, vol. 7, no. 2, pp. 556–562, 2020. [Google Scholar]
6. A. Kumar, W. E. Dowling, R. G. Román, A. Chaudhari, C. Gurry et al., “Status report on COVID-19 vaccines development,” Current Infectious Disease Reports, vol. 23, no. 6, pp. 1–12, 2021. [Google Scholar]
7. A. L. Goss, R. D. Samudralwar, R. R. Das and A. Nath, “ANA investigates: Neurological complications of COVID-19 vaccines,” Annals of Neurology, vol. 89, no. 5, pp. 856, 2021. [Google Scholar]
8. M. W. Tenforde, “Effectiveness of pfizer-bioNTech and moderna vaccines against COVID-19 among hospitalized adults aged≥ 65 years—United States, January–March 2021. MMWR,” Morbidity and Mortality Weekly Report, vol. 70, 2021. https://www.cdc.gov/mmwr/volumes/70/wr/mm7018e1.htm. [Google Scholar]
9. V. Chamola, V. Hassija, V. Gupta and M. Guizani, “A comprehensive review of the COVID-19 pandemic and the role of IoT, drones, AI, blockchain, and 5G in managing its impact,” IEEE Access, vol. 8, pp. 90225–90265, 2020. [Google Scholar]
10. Y. Siriwardhana, G. Gür, M. Ylianttila and M. Liyanage, “The role of 5G for digital healthcare against COVID-19 pandemic: Opportunities and challenges,” ICT Express, vol. 7, no. 2, pp. 244–252, 2020. [Google Scholar]
11. A. Kumar, K. Sharma, H. Singh, S. G. Naugriya, S. S. Gill et al., “A drone-based networked system and methods for combating coronavirus disease (COVID-19) pandemic,” Future Generation Computer Systems, vol. 115, pp. 1–19, 2021. [Google Scholar]
12. M. Kunovjanek and C. Wankmüller, “Containing the COVID-19 pandemic with drones-feasibility of a drone enabled back-up transport system,” Transport Policy, vol. 106, pp. 141–152, 2021. [Google Scholar]
13. O. Salman, I. Elhajj, A. Chehab and A. Kayssi, “Iot survey: An SDN and fog computing perspective,” Computer Networks, vol. 143, pp. 221–246, 2018. [Google Scholar]
14. A. Muthanna, A. Khakimov, A. A. Ateya, A. Paramonov and A. Koucheryavy, “Enabling M2M communication through MEC and SDN,” in Proc. Int. Conf. on Distributed Computer and Communication Networks, Cham, Sprnger, pp. 95–105, September, 2018. [Google Scholar]
15. F. Girardi, G. De Gennaro, L. Colizzi and N. Convertini, “Improving the healthcare effectiveness: The possible role of EHR, IoMT and blockchain,” Electronics, vol. 9, pp. 884, 2020. [Google Scholar]
16. L. Bai, D. Yang, X. Wang, L. Tong, X. Zhu et al., “Chinese experts’ consensus on the internet of things-aided diagnosis and treatment of coronavirus disease 2019 (COVID-19),” Clinical eHealth, vol. 3, pp. 7–15, 2020. [Google Scholar]
17. R. Vaishya, M. Javaid, I. H. Khan and A. Haleem, “Artificial intelligence (AI) applications for COVID-19 pandemic,” Diabetes & Metabolic Syndrome: Clinical Research & Reviews, vol. 14, no. 4, pp. 337–339, 2020. [Google Scholar]
18. A. Shirmarz and A. Ghaffari, “Performance issues and solutions in SDN-based data center: A survey,” the Journal of Supercomputing, vol. 76, no. 10, pp. 7545–7593, 2020. [Google Scholar]
19. V. Thirupathi, C. H. Sandeep, N. Kumar and P. Kumar, “A comprehensive review on sdn architecture, applications and major benifits of SDN,” International Journal of Advanced Science and Technology, vol. 28, no. 20, pp. 607–614, 2019. [Google Scholar]
20. Y. Dong and Y. D. Yao, “Iot platform for COVID-19 prevention and control: A survey,” IEEE Access, vol. 9, pp. 49929–49941, 2021. [Google Scholar]
21. M. Yousif, C. Hewage and L. Nawaf, “Iot technologies during and beyond COVID-19: A comprehensive review,” Future Internet, vol. 13, no. 5, pp. 105, 2021. [Google Scholar]
22. M. Otoom, N. Otoum, M. A. Alzubaidi, Y. Etoom and R. Banihani, “An IoT-based framework for early identification and monitoring of COVID-19 cases,” Biomedical Signal Processing and Control, vol. 62, pp. 102149, 2020. [Google Scholar]
23. W. Hariri, “Efficient masked face recognition method during the covid-19 pandemic,” arXiv preprint arXiv: 2105.03026, 2021. [Google Scholar]
24. R. P. Singh, M. Javaid, A. Haleem, R. Vaishya and S. Ali, “Internet of medical things (IoMT) for orthopaedic in COVID-19 pandemic: Roles, challenges, and applications,” Journal of Clinical Orthopaedics and Trauma, vol. 11, no. 4, pp. 713–717, 2020. [Google Scholar]
25. P. P. Ray, D. Dash and N. Kumar, “Sensors for internet of medical things: State-of-the-art, security and privacy issues, challenges and future directions,” Computer Communications, vol. 160, pp. 111–131, 2020. [Google Scholar]
26. S. Karmore, R. Bodhe, F. Al-Turjman, R. L. Kumar and S. Pillai, “Iot based humanoid software for identification and diagnosis of covid-19 suspects,” IEEE Sensors Journal, pp. 1–1, 2020. https://doi.org/10.1109/JSEN.2020.3030905. [Google Scholar]
27. M. N. Mohammed, H. Syamsudin, S. Al-Zubaidi, R. R. AKS and E. Yusuf, “Novel COVID-19 detection and diagnosis system using IOT based smart helmet,” International Journal of Psychosocial Rehabilitation, vol. 24, no. 7, pp. 2296–2303, 2020. [Google Scholar]
28. Y. Siriwardhana, C. De Alwis, G. Gür, M. Ylianttila and M. Liyanage, “The fight against the COVID-19 pandemic with 5G technologies,” IEEE Engineering Management Review, vol. 48, no. 3, pp. 72–84, 2020. [Google Scholar]
29. A. J. Sathyamoorthy, U. Patel, Y. A. Savle, M. Paul and D. Manocha, “COVID-Robot: Monitoring social distancing constraints in crowded scenarios,” arXiv preprint arXiv: 2008.06585, 2020. [Google Scholar]
30. S. Saponara, A. Elhanashi and A. Gagliardi, “Implementing a real-time, AI-based, people detection and social distancing measuring system for covid-19,” Journal of Real-Time Image Processing, vol. 21, pp. 1–11, 2021. https://doi.org/10.1007/s11554-021-01070-6. [Google Scholar]
31. O. M. Elzeki, M. Abd Elfattah, H. Salem, A. E. Hassanien and M. Shams, “A novel perceptual two layer image fusion using deep learning for imbalanced COVID-19 dataset,” PeerJ Comput. Sci, vol. 7, pp. e364, 2021. [Google Scholar]
32. Adafruit MLX90640 IR Thermal Camera technical specifications, [Online]. Available: https://www.adafruit.com/product/4407#technical-details, last access on 15-06-2021. [Google Scholar]
33. Z. Liu, Z. Chen, Z. Li and W. Hu, “An efficient pedestrian detection method based on YOLOv2,” Mathematical Problems in Engineering, vol. 2018, pages 10,Article ID 3518959, 2018. https://doi.org/10.1155/2018/3518959. [Google Scholar]
34. T. Bouwmans, S. Javed, M. Sultana and S. K. Jung, “Deep neural network concepts for background subtraction: A systematic review and comparative evaluation,” Neural Networks, vol. 117, pp. 8–66, 2019. [Google Scholar]
35. A. A. Ateya, A. Muthanna, R. Kirichek, M. Hammoudeh and A. Koucheryavy, “Energy-and latency-aware hybrid offloading algorithm for UAVs,” IEEE Access, vol. 7, pp. 37587–37600, 2019. [Google Scholar]
36. A. A. Ateya, A. Muthanna, I. Gudkova, Y. Gaidamaka and A. D. Algarni, “Latency and energy-efficient multi-hop routing protocol for unmanned aerial vehicle networks,” International Journal of Distributed Sensor Networks, vol. 15, no. 8, pp. 1550147719866392, 2019. [Google Scholar]
37. A. A. Ateya, A. Muthanna, I. Gudkova, A. Abuarqoub, A. Vybornova et al., “Development of intelligent core network for tactile internet and future smart systems,” Journal of Sensor and Actuator Networks, vol. 7, no. 1, pp. 1, 2018. [Google Scholar]
38. A. Muthanna, A. A. Ateya, M. Makolkina, A. Vybornova, E. Markova et al., “SDN Multi-controller networks with load balanced,” in Proc. 2nd Int. Conf. on Future Networks and Distributed Systems, Amman, Jordan, pp. 1–6, 2018. [Google Scholar]
39. L. Yang, Z. P. Cai and H. Xu, “LLMP: Exploiting LLDP for latency measurement in software-defined data center networks,” Journal of Computer Science and Technology, vol. 33, no. 2, pp. 277–285, 2018. [Google Scholar]
40. MathWorks's Ground Truth Labeler application, [Online]. Available: https://www.mathworks.com/help/driving/ug/get-started-with-the-ground-truth-labeler.html, last access on 15-06-2021. [Google Scholar]
41. FLIR Thermal Dataset for Algorithm Training, [Online]. Available: https://www.flir.com/oem/adas/adas-dataset-form/, last access on 15-06-2021. [Google Scholar]
 | This work is licensed under a Creative Commons Attribution 4.0 International License, which permits unrestricted use, distribution, and reproduction in any medium, provided the original work is properly cited. |