DOI:10.32604/cmc.2022.020940
| Computers, Materials & Continua DOI:10.32604/cmc.2022.020940 | |
| Article |
Machine Learning-Based Predictions on the Self-Heating Characteristics of Nanocomposites with Hybrid Fillers
1Department of Civil and Environmental Engineering, Korea Advanced Institute of Science and Technology (KAIST), Daejeon, 34141, Korea
2School of Civil Engineering, Chungbuk National University, Cheongju, 28644, Korea
*Corresponding Author: Beomjoo Yang. Email: byang@cbnu.ac.kr
Received: 15 June 2021; Accepted: 23 September 2021
Abstract: A machine learning-based prediction of the self-heating characteristics and the negative temperature coefficient (NTC) effect detection of nanocomposites incorporating carbon nanotube (CNT) and carbon fiber (CF) is proposed. The CNT content was fixed at 4.0 wt.%, and CFs having three different lengths (0.1, 3 and 6 mm) at dosage of 1.0 wt.% were added to fabricate the specimens. The self-heating properties of the specimens were evaluated via self-heating tests. Based on the experiment results, two types of artificial neural network (ANN) models were constructed to predict the surface temperature and electrical resistance, and to detect a severe NTC effect. The present predictions were compared with experimental values to verify the applicability of the proposed ANN models. The ANN model for data prediction was able to predict the surface temperature and electrical resistance closely, with corresponding R-squared value of 0.91 and 0.97, respectively. The ANN model for data detection could detect the severe NTC effect occurred in the nanocomposites under the self-heating condition, as evidenced by the accuracy and sensitivity values exceeding 0.7 in all criteria.
Keywords: Machine learning; nanocomposites; carbon fillers; self-heating; negative temperature coefficient
Conductive filler-incorporated polymeric composites (CPCs) are widely used as engineering materials owing to their good formability and useful mechanical properties as well as their improved electrical conductivity [1–3]. These types of CPCs with a high electrical conductivity level can generate heat by the principle of Joule heating, a mechanism that acts when current flows through the composites, with the electron's kinetic energy converted to thermal energy [4]. Therefore, the CPCs have the high potential to be utilized as heating elements in wearable heating textiles, vehicle heating systems, and deicing materials [5–7].
Carbon fiber (CF) has been widely used as a conventional microscale conductive filler for the fabrication of CPCs because it can improve the mechanical strength and elastic modulus of these types of composites [8]. However, the improvement in the electrical conductivity of CF-incorporated composites is limited, and the incorporation of a large amount of CF in a polymer matrix can cause significant deterioration of the composites [9]. Therefore, considerable work has focused on nanocomposites that incorporate CF with carbon nanotube (CNT) [9–12]. CNT is one of the nanoscale conductive fillers consisting of CPCs. Owing to their high aspect ratio and outstanding electrical conductivity, electrical pathways can be readily formed in a polymer matrix with only small amounts of CNTs [13,14].
Dydek et al. [15] investigated the electrical characteristics of nanocomposites incorporating CF, further enhanced by the additional incorporating of CNT. The fabricated composites showed increased electrical conductivity by 20 times compared to those of composites with only CF [15]. They reported that CNT can serve as a bridge between CFs, creating an electrically conductive network [15]. The effect of CNT on the self-heating of CF-incorporated nanocomposites was investigated by Joo et al. [16]. In their study, they reported that the presence of 1.0 wt.% CNT in the composites acts as an electrical conductor between CFs, leading to an increase in the electrical conductivity [16].
The major issue when applying CPCs as a self-heating element is the negative temperature coefficient (NTC) effect, referring to a decrease in their resistance levels with an increase in the temperature [6,13,17]. This NTC effect can cause the conductive fillers to overheat due to the reduction of electrical resistance, which leads to a thermal shock in the composites [11,18]. Accordingly, it is essential in heating applications of such composites for the self-heating characteristics to be predictable and for the severe NTC effect to be detected in advance.
However, predicting the self-heating characteristics of nanocomposites incorporating multiscale conductive fillers remains a challenging task due to the vastly different scales and inherent properties of electrically conductive fillers [9,19]. Recently, various researchers have proposed machine learning techniques to predict the effective properties of multiscale conductive fillers-incorporated nanocomposites [20–24]. Machine learning can be well suited for the modeling of complex composite materials, especially when the relationship between the model parameters and their behavior must be understood [23]. Daghigh et al. [21] used machine learning to predict the thermal behavior of multiscale fillers-incorporated composites. They found how the incorporation of different scales of fillers can affect the effective thermal behavior of such composites by using machine learning [21].
Against this backdrop, the present study proposes a machine learning-based approach to the prediction of the self-heating characteristics and to the detection of the NTC effect in nanocomposites incorporating CNT and CF. The self-heating properties of film types of polydimethylsiloxane (PDMS) composites incorporating CNT and CF were evaluated via self-heating tests. In addition, two types of machine learning models were proposed here to predict the surface temperature and electrical resistance, and to detect the NTC effect in the nanocomposites under the self-heating condition. Based on the experimental dataset, artificial neural network (ANN) models were built considering the length of the CF, the heating time and the initial resistance of the specimens. Finally, the present predictions were compared with experimental values to verify the applicability of the proposed models.
PDMS and its curing agent (Sylgard 184 Silicone Elastomer Kit, Dow Corning) were used to compose a matrix. The multi-walled CNT (Hyosung Inc.) having length and diameter of approximately 10 μm and 12–40 nm, respectively, was utilized as a conductive filler [25,26]. In addition, polyacrylonitrile (PAN)-type CF (Ace C & Tech. Co., Ltd.) with a diameter of 7.2 μm and three different lengths (0.1, 3 and 6 mm) were incorporated into the composites referring to a previous study [27]. Additionally, polysodium4-styrenesulfonate (PSS) was chosen as a dispersant to improve the dispersion of the CNT particles into the polymeric composites [28].
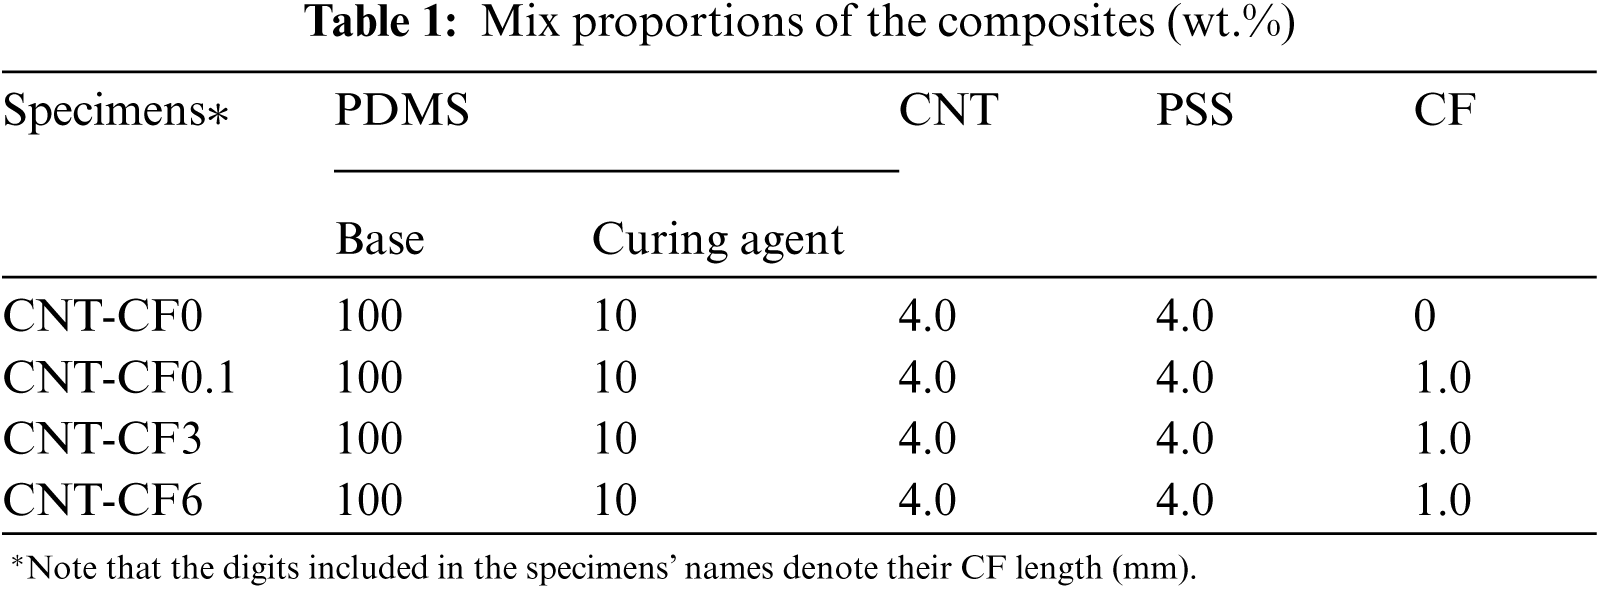
Four different mix proportions were used to fabricate the specimens considering the lengths of the utilized CF, as summarized in Tab. 1. The CNT content and CNT-to-PSS ratio (1:1) were referenced from a previous study [28], whose test outcomes fairly guaranteed the formation of favorable electrical conductivity values. Note that the specimen ID was designated as its length of CF used, i.e., CNT-CF3 indicates the specimens having 3 mm-CF.
The schematic description of the fabrication procedure is illustrated in Fig. 1. CNT and PSS were poured into the 100 mL of isopropyl-alcohol (IPA) solvent, and they were hand-mixed for 1 min. The mixture was sonicated using a bath type ultrasonicator (40 kHz; 200 W) for 1 h at 25°C [29,30]. PDMS base and CF were poured into a CNT-dispersed solution. The solution was heated to 120°C while the samples were mixed by means of mechanical stirring at 150 rpm using a magnetic stirrer to evaporate the solvent completely. After evaporating the solvent, a PDMS curing agent was added to the mixture, and this was then hand-mixed for 3 min. The mixture was subsequently poured into a mold and cured for 2 h at 100°C, and the CNT-CF-composites of 1 mm thick were cut into pieces 10 × 20 mm2 in size for the self-heating tests.
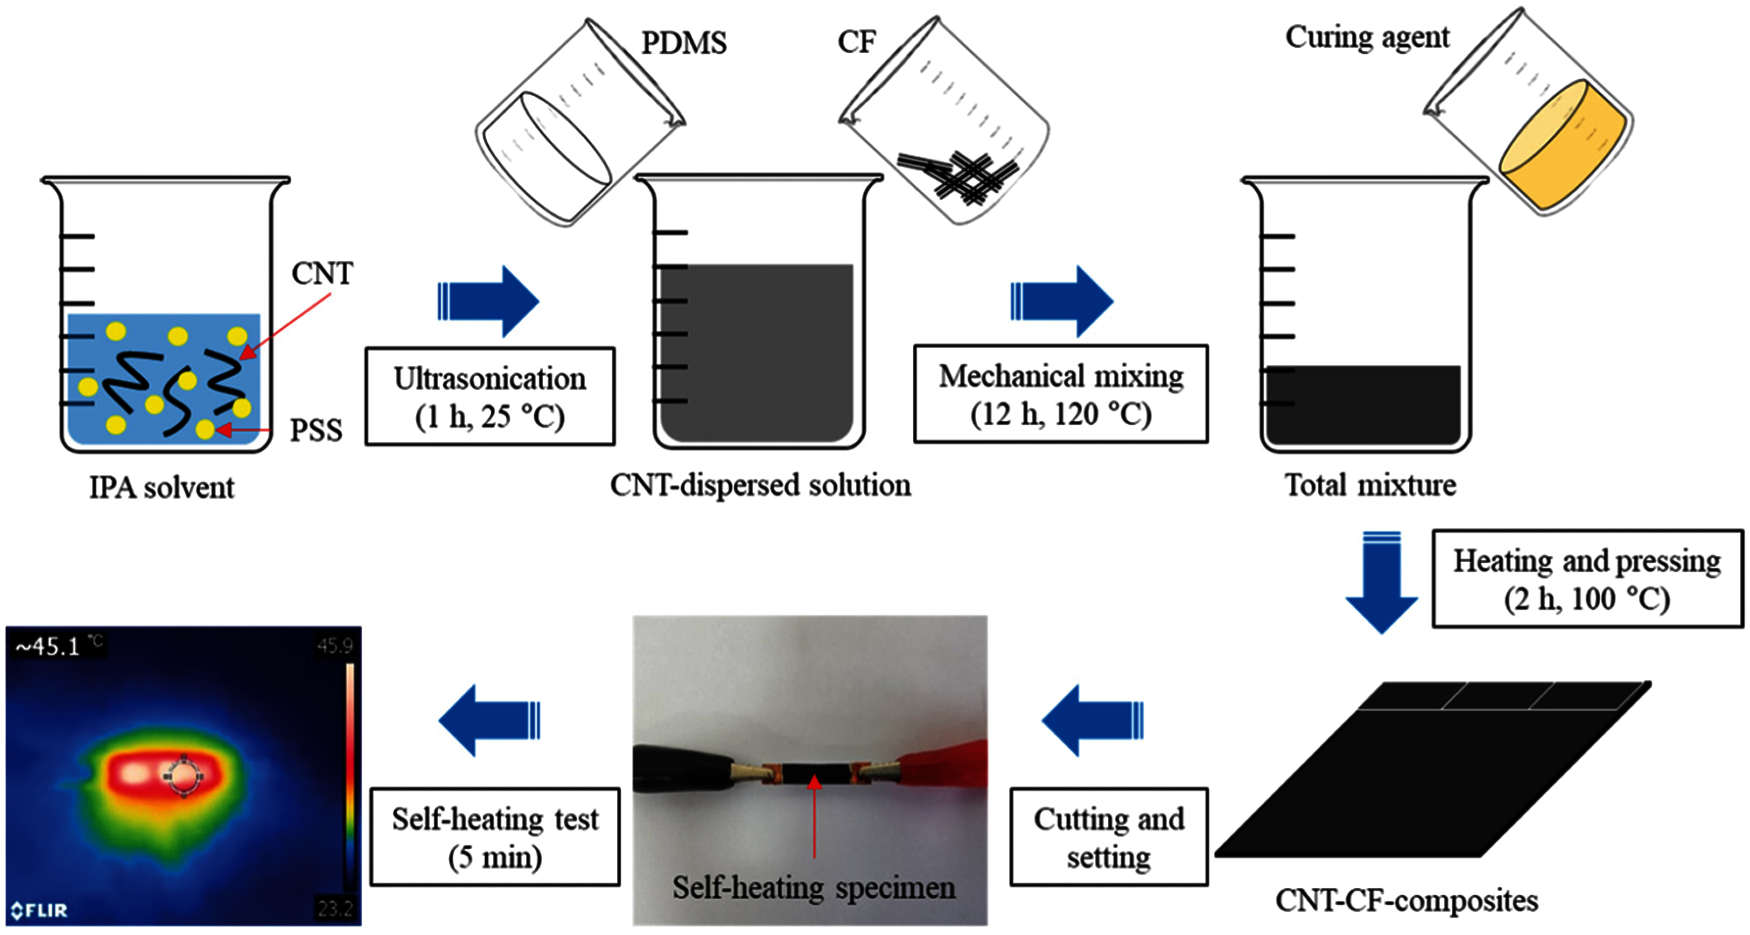
Figure 1: Schematic description of the fabrication procedure and photographs of the specimen for the self-heating test
Self-heating tests were conducted to evaluate the heat generation and to observe the NTC effect in the nanocomposites, as shown in the photographs in Fig. 1. Five different input voltages (6, 9, 12, 16 and 20 V) were applied to the specimens using a DC power supply (PL-3005S) for 5 min. During the self-heating tests, the surface temperature and current flowing through the specimens were recorded via a K-type thermocouple and a data logger (Agilent Technologies 34972A), respectively. After the test, the recorded current was converted to the electrical resistance (R) according to the Ohm's law as described in previous studies [31,32]. The normalized resistance (R/R0) is obtained by dividing R by the initial resistance (R0), which is measured immediately after the voltage is applied [6].
An ANN model consists of advanced regression and pattern recognition algorithms of a machine learning technique that allows the extraction of complex relationships among nonlinear variables [23,33,34]. The ANN can achieve better performance than conventional models for engineering problems where there is a difficult or incomplete understanding of the problem, yet experimental measurements exist [23]. Therefore, the ANN can be used to find any complex relationships between the input and output values of experimental data. This section summarizes the entire process of the present ANN models.
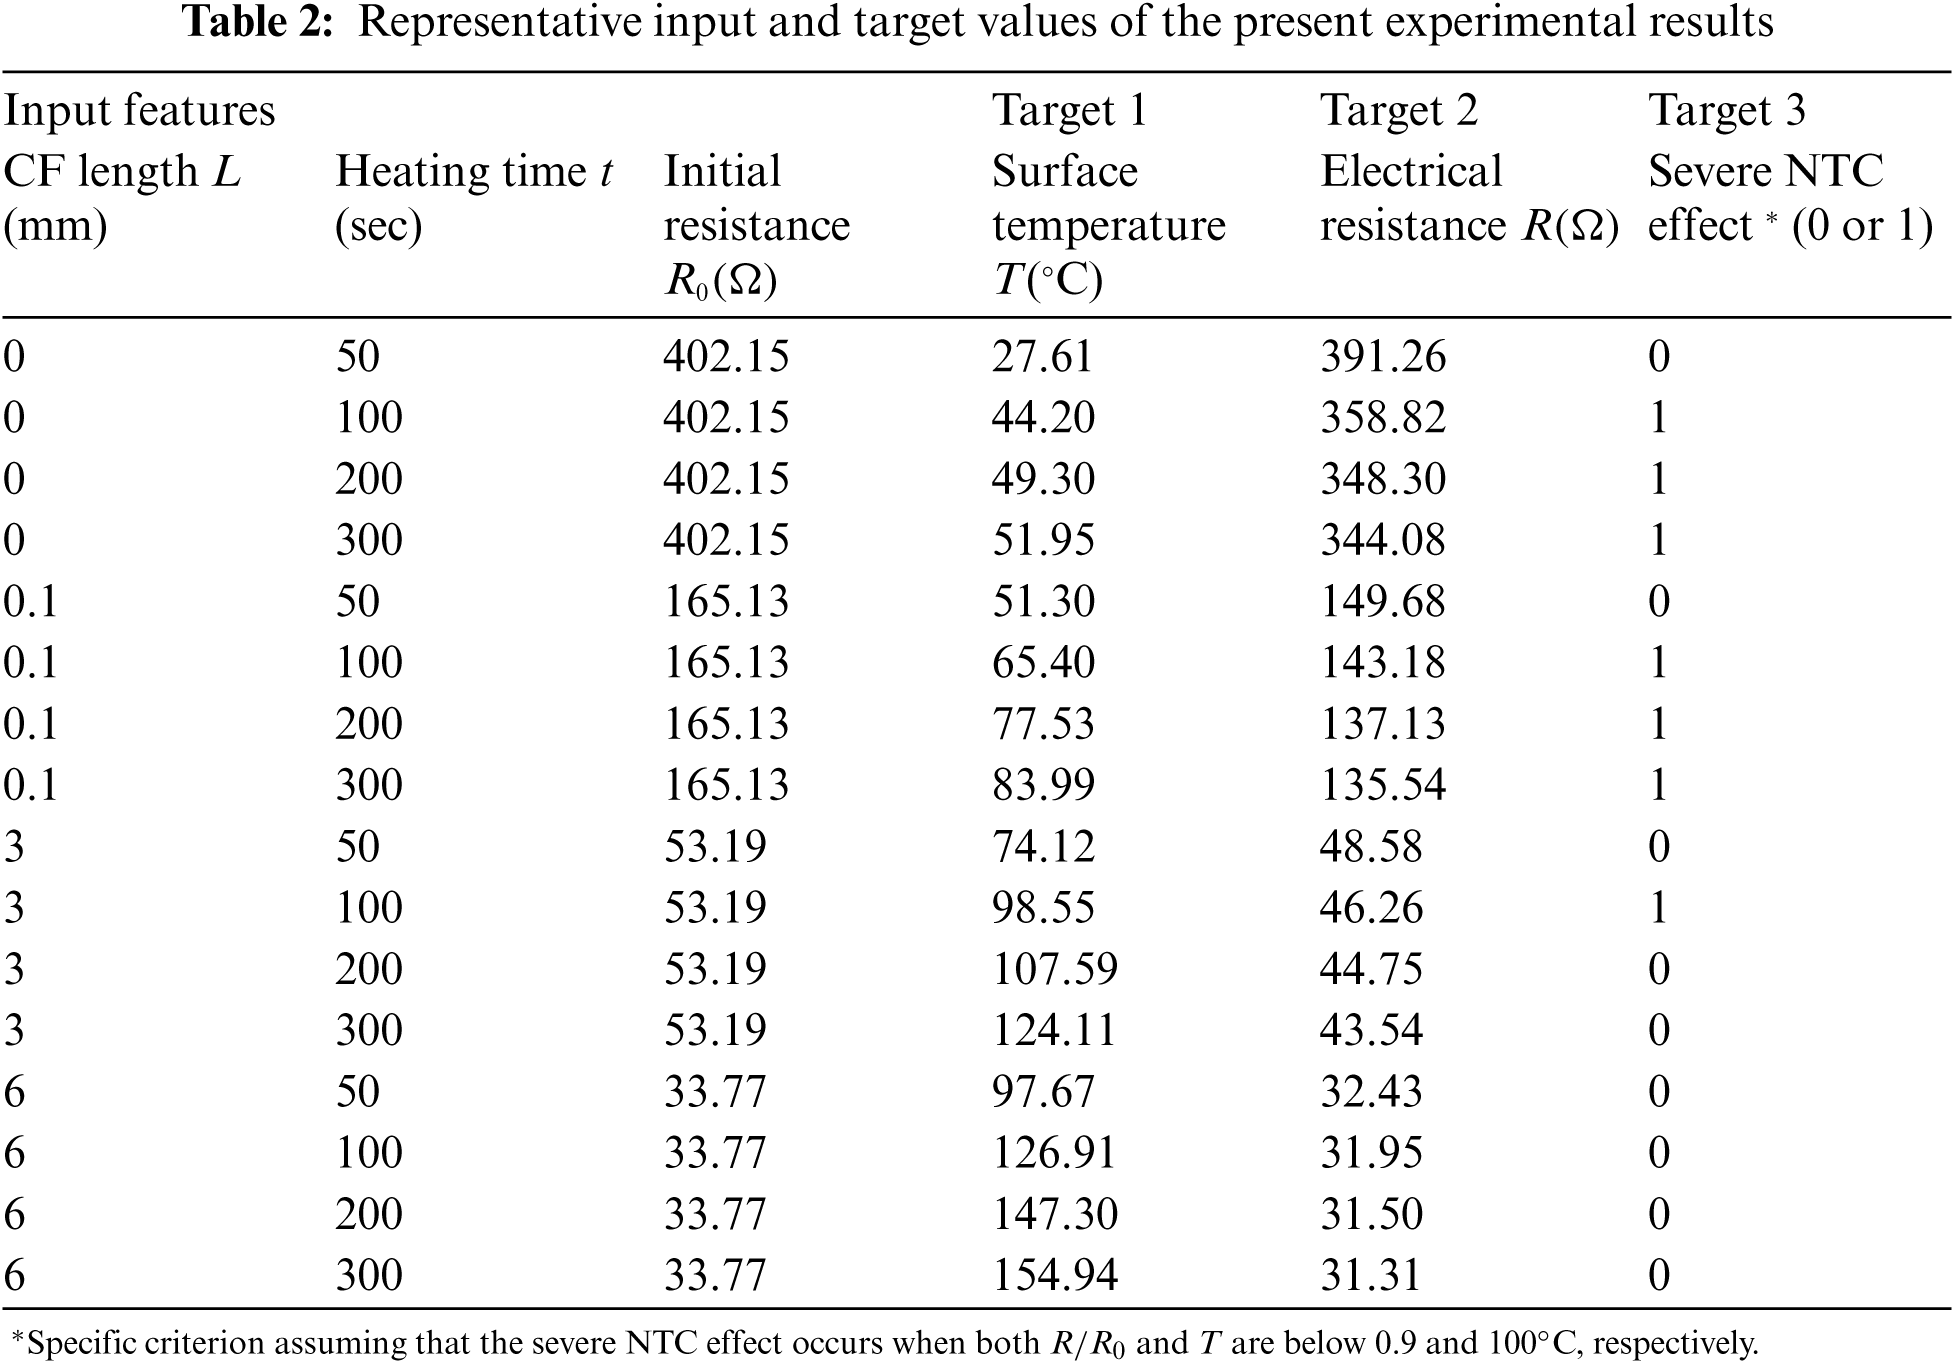
Fig. 2 shows a flow chart for predicting the self-heating temperature and electrical resistance and for detecting the NTC effect in nanocomposites incorporating CNT and CF. To train the ANNs, raw datasets, which are composed of the length of the CF L, the heating time t and the initial resistance R0, were taken from the self-heating tests. It should be noted that the present model could not consider the effect of geometry of the specimen on the self-heating characteristics. In the target datasets, the experimental results of the surface temperature T and electrical resistance R were listed for predicting the surface temperature and electrical resistance of the composites. Value of 0 or 1, with 1 meaning that a severe NTC effect occurs, was utilized for detecting the NTC effect in the composites. The representative input and target values of the present experimental results are listed in Tab. 2.
A total of 720 raw datasets were randomly split into 432 for training set, 144 for validation set, and 144 for testing set, maintaining a 6:2:2 ratio, as shown in Fig. 2. All datasets were normalized using the mean and the standard deviation of the training sets. The normalized training sets were fed into the ANN model for training and the trained ANN model was then validated through the validation sets. In the training layer, the loss value of the loss function was computed, and the weight value was adjusted by an optimizer, reducing the loss value. The details of the loss function and optimizer will be described in Section 3.2. When the number of epoch reaches a pre-defined maximum value, machine learning is complete. In this case, 144 testing sets are taken and scanned by the trained ANN model to generate a report of predicted values of the present model (i.e., the R-squared value and accuracy).
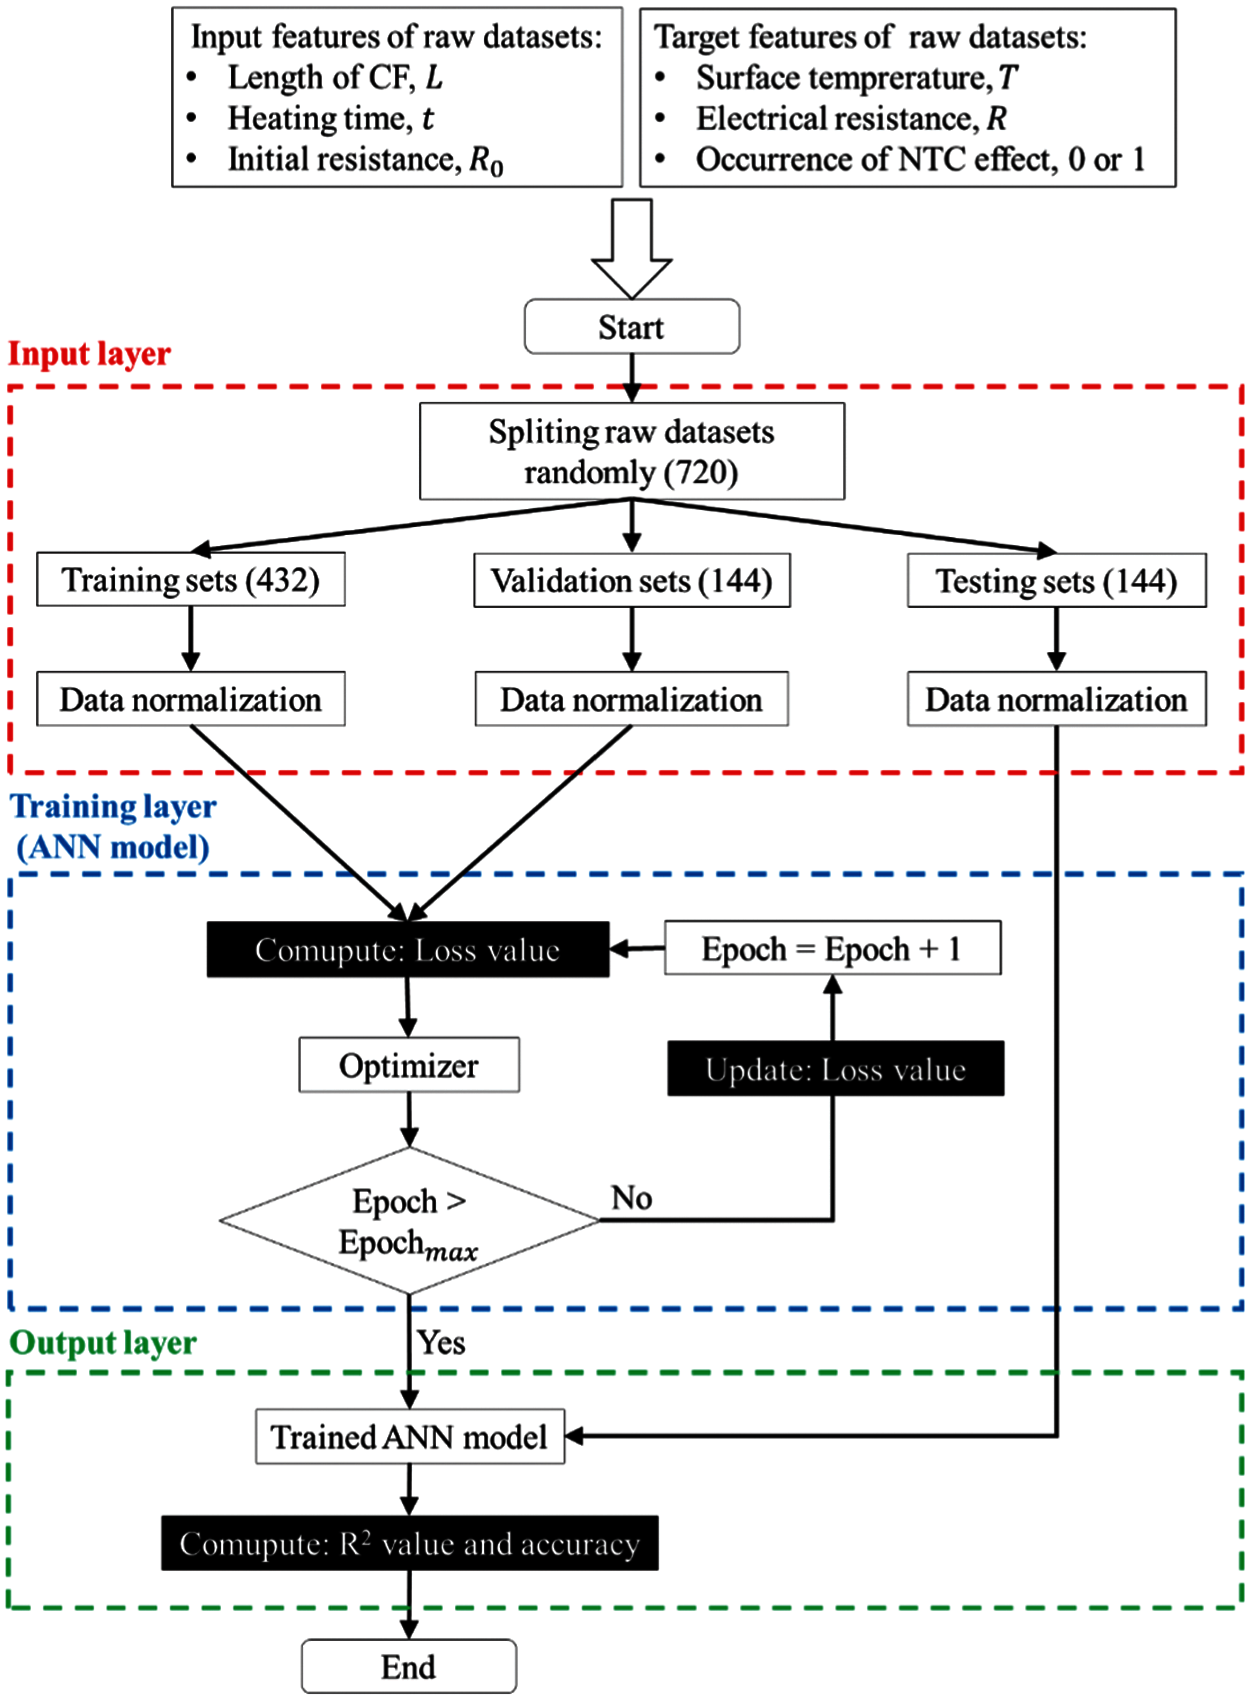
Figure 2: Flow chart for predicting the surface temperature and electrical resistance and for detecting the NTC effect in nanocomposites incorporating CNT and CF
The artificial neuron, the basic unit of a neural network, consists of the weight, bias, and activation function, as follows in Eq. (1) [33,35–37]:
where zi is the output matrix, xi is the input matrix, wji is the weight matrix, bi is the bias vector created by the layer and the f is the activation function [36,37]. An ANN model consists of several interconnected artificial neurons, and each artificial neuron is fully connected through connection weights receiving an input signal from a linked weight [36]. Fig. 3 presents the ANN architecture for predicting the surface temperature and electrical resistance, and for detecting a severe NTC effect of composites. The first layer was the input layer of a 3 × 720 matrix, where these dimensions indicate the number of input features (L, t, and R0) and the total number of datasets, respectively. The 3 × 720 matrix was fed into the rectified linear unit (ReLU) layer, which is a nonlinear activation function [38]. The ANN architecture consists of two densely connected hidden layers with 64 neurons and an output layer with one neuron which returns a single output value for the data prediction of T and R. Meanwhile, for detecting a severe NTC effect of composites, the sigmoid layer was designed as a classifier at the last layer of the ANN architecture.
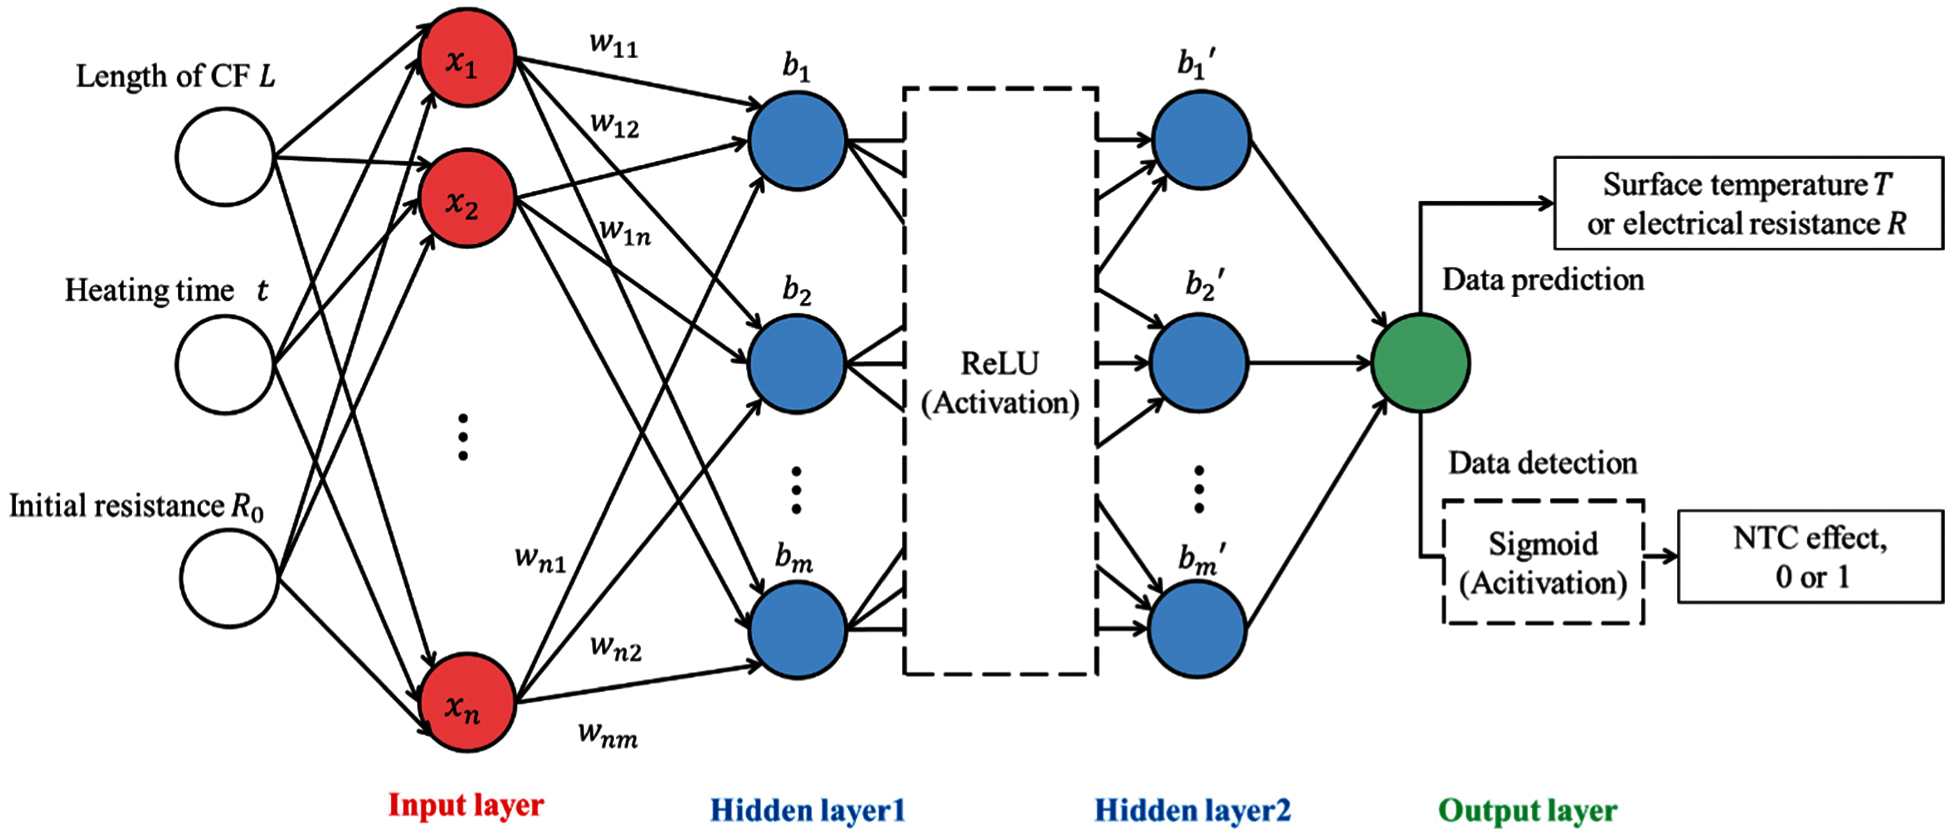
Figure 3: ANN architecture for the prediction of the surface temperature and electrical resistances and for detection of the NTC effect in nanocomposites incorporating CNT and CF
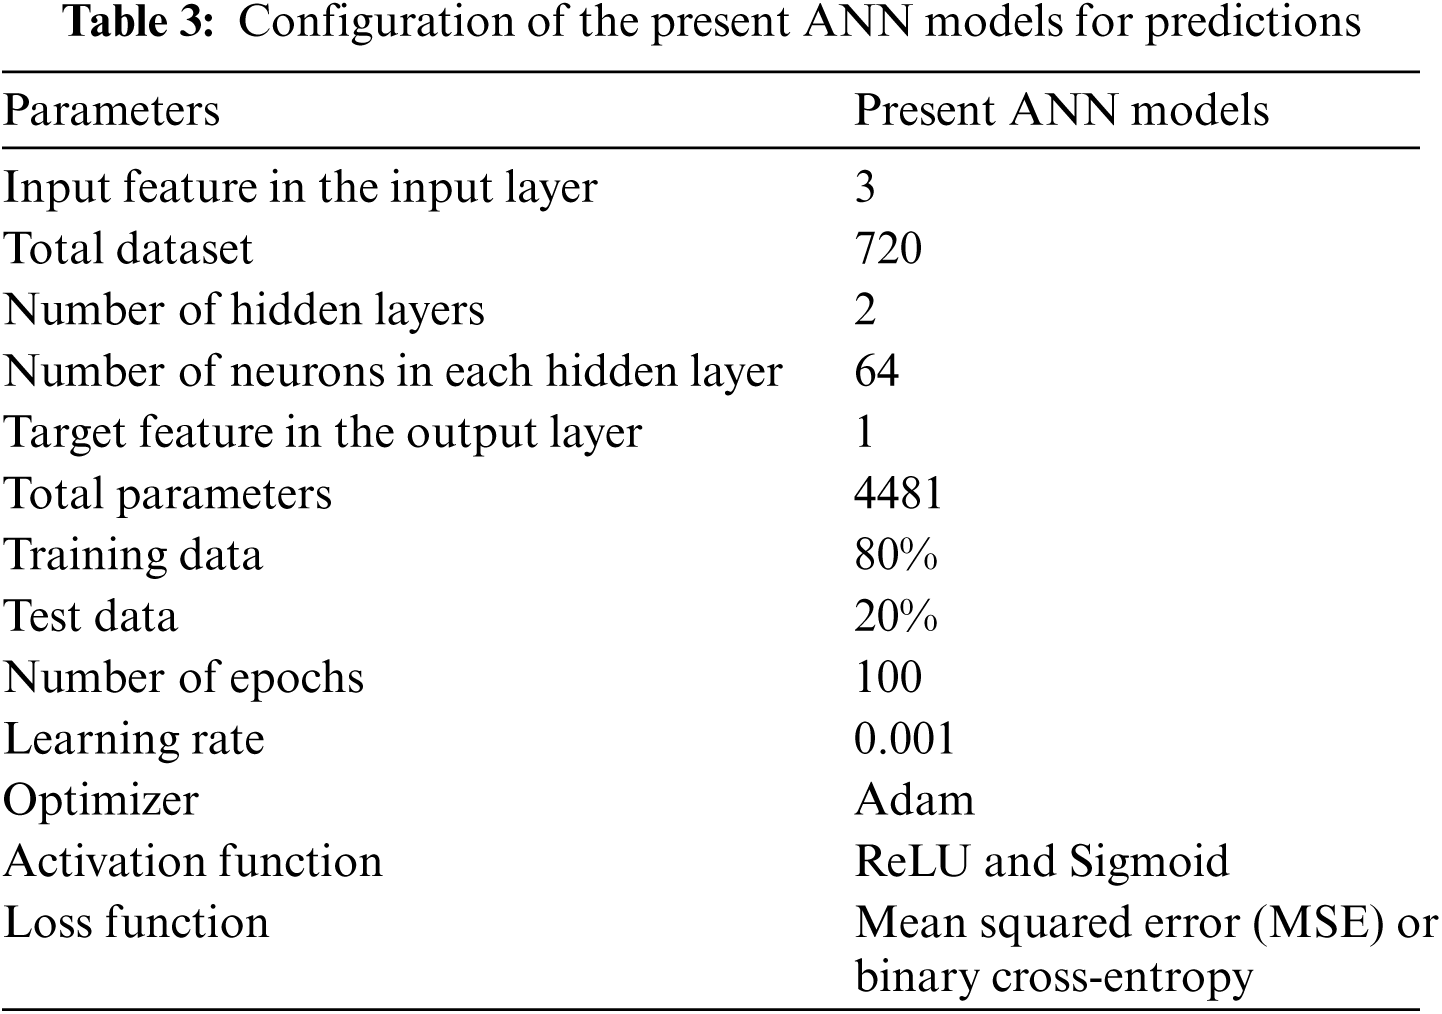
The information from the input layer was transmitted to the output layer in one direction. Then, the learning process was conducted to minimize the deviation between the actual values and the output values. To narrow the deviation during the learning process, an algorithm that updates the weight values of a receptive field is necessary to obtain the expected results [37–39]. In the present study, the stochastic gradient descent (SGD) algorithm was adopted for backpropagation. We used the SGD-algorithm-based Adam optimizer in Keras of Python [36] with a learning rate of 0.001. The weight values of the ANN model were adjusted by reducing the loss function of the mean square error and the binary cross-entropy, respectively. The configuration of the present ANN models for the predictions is tabulated in Tab. 3. Note that the value of parameters in the present ANN model was assumed by referring to the values reported in the previous works [20,23,36].
The terminal surface temperatures of the specimens with different applied input voltages are shown in Fig. 4. As 6 V of input voltage was applied to the specimen, the CNT-CF0 and CNT-CF0.1 specimens scarcely showed an increase in the terminal surface temperature. The terminal temperature of the CNT-CF0 and CNT-CF0.1 specimens increased linearly with an increase in the input voltage, reaching approximately 100 and 130°C at 20 V, respectively. The CNT-CF3 and CNT-CF6 specimens showed a noticeable increase in the terminal surface temperature at 6 V. The terminal surface temperature of the CNT-CF3 and CNT-CF6 specimens increased drastically, exceeding 100°C at 12 V. It should be noted that both the CNT-CF3 and CNT-CF6 specimens melted at the input voltage above 16 V. These observations reveal that high input voltage is required for noticeable heat generation of the CNT-CF0 and CNT-CF0.1 specimens. In relation to this, the self-heating tests of the composites over the applied time were conducted under an input voltage of 12 V to investigate the self-heating properties of all specimens.
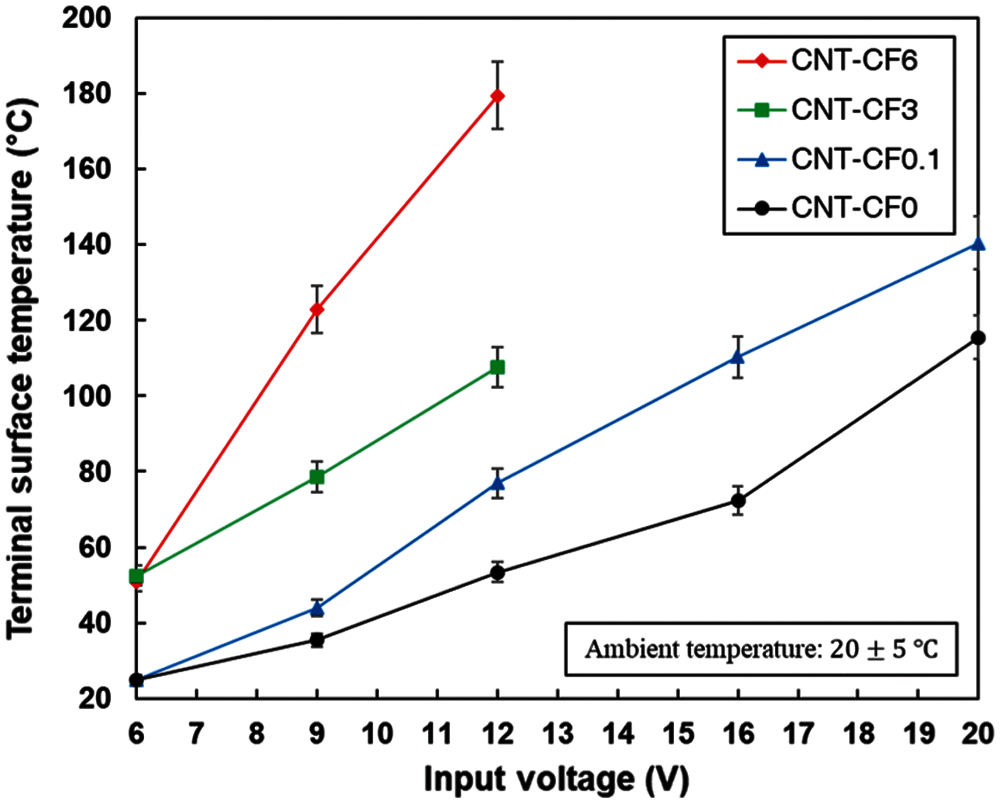
Figure 4: Terminal surface temperatures of the specimens with different applied input voltages
The surface temperatures of the specimen for a heating time of 300 s are shown in Fig. 5a. The surface temperatures of all specimens increased rapidly to 100 s and then increased slightly afterward. This trend was more noticeable with an increase of the CF length. The terminal surface temperatures of the CNT-CF0, CNT-CF0.1, CNT-CF3 and CNT-CF6 specimens at 300 s were 52.2, 83.7, 141.9 and 155.2°C, respectively. These results indicate that the incorporation of longer CF causes the generation of more heat at an identical input voltage. The electrical resistance levels of the specimens for 300 s heating time are shown in Fig. 5b. The initial electrical resistance outcomes of the CNT-CF0, CNT-CF0.1, CNT-CF3 and CNT-CF6 specimens were 402.1, 165.1, 53.2 and 33.1
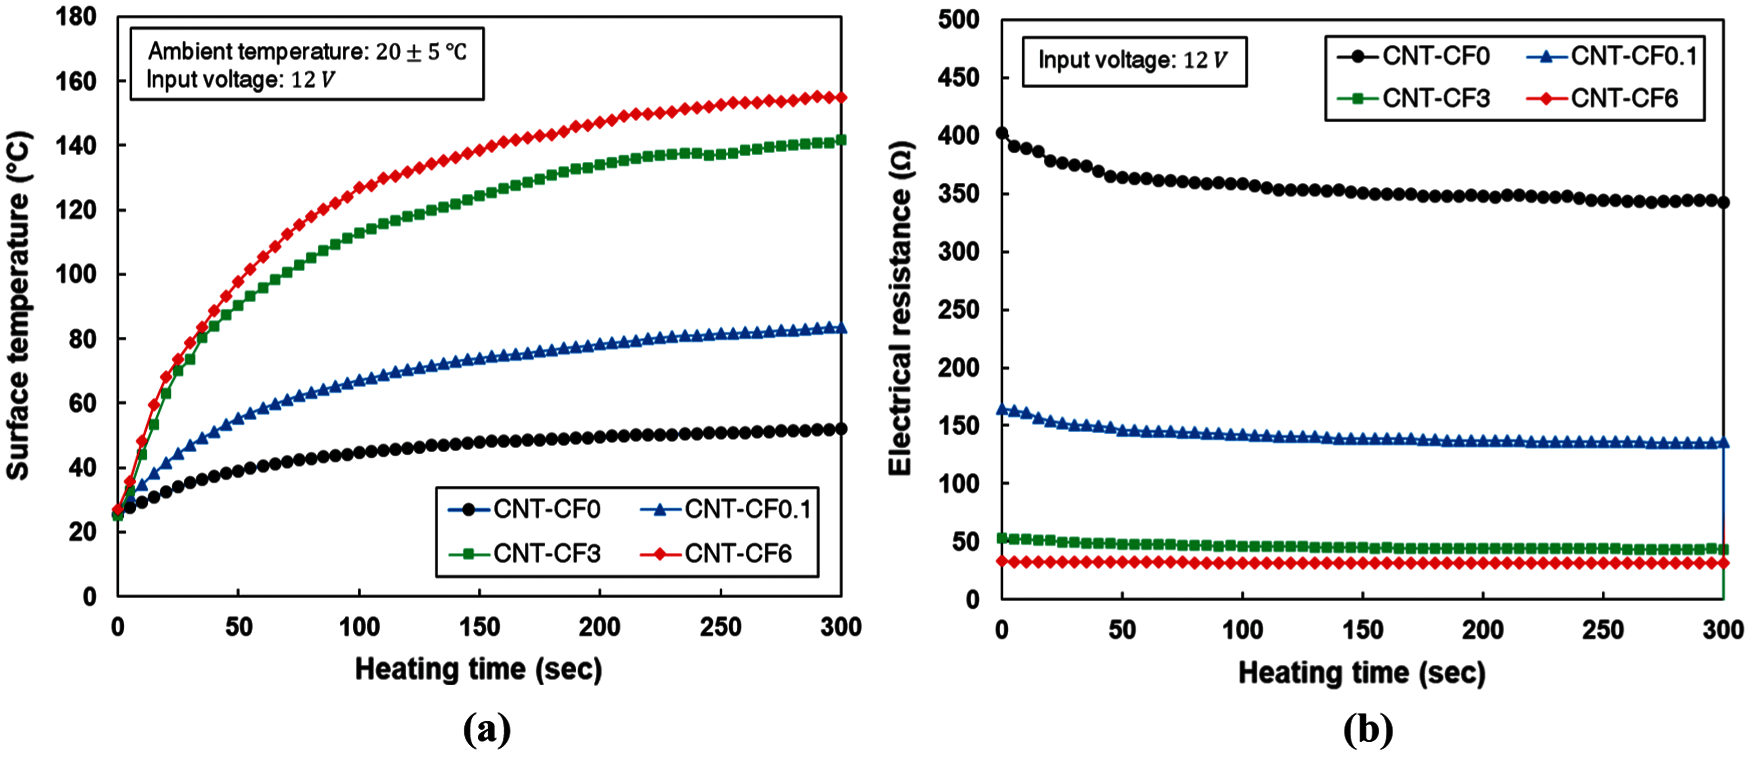
Figure 5: (a) Surface temperatures and (b) electrical resistance levels of the specimens at a heating time of 300 s
The normalized electrical resistance levels of the specimens over the surface temperature are shown in Fig. 6. The normalized electrical resistance decreased with an increase in the surface temperature for all specimens. These phenomena are closely associated with the NTC effect, i.e., a decrease in the electrical resistance of CPCs with an increase in the temperature [11,13,18,40]. Xiang et al. [18] reported that the rearrangement of the CNT at an increased temperature exceeding the melting point of the matrix causes the NTC effect, generating more electrical contact points in the composites. Accordingly, the abrupt increase in the temperature of the specimen is very likely to form more connection of CNTs in the PDMS, thus initiating the NTC effect. The NTC effects of the CNT-CF0 and CNT-CF0.1 specimens were more noticeable than those of the CNT-CF3 and CNT-CF6 specimens, decreasing to less than 0.85 of the value of the normalized electrical resistance at less than 100°C. These results are in agreement with an earlier study [11], which suggests that longer CF can lead to improved stability under self-heating condition, preventing the NTC effect.
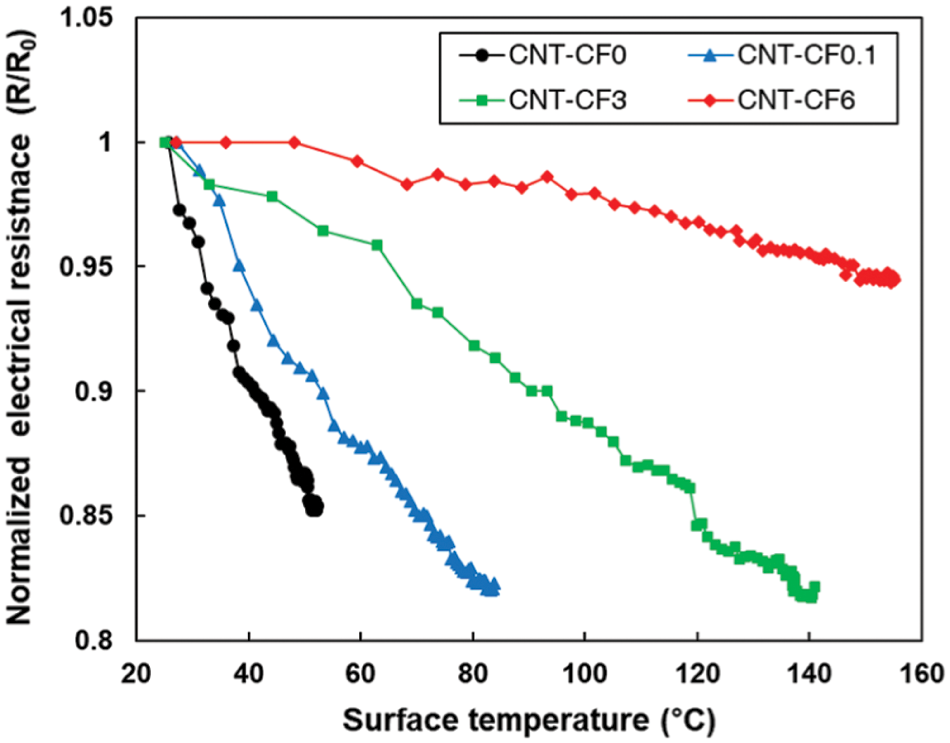
Figure 6: Normalized electrical resistance levels of the specimens over the surface temperature
4.2 Prediction Results and Analysis of Surface Temperature and Electrical Resistance
The surface temperature and electrical resistance were predicted, as shown in Fig. 7. After 100 epochs of the learning process, the training of the ANN model was completed, after which the validation sets were used to examine the trained ANN model. Figs. 7a and 7b show the loss value against the epoch for predicting the surface temperature and electrical resistance. The losses for both the training and validation sets demonstrate a similar trend over the epoch, which drastically decreases within 20 epochs. Figs. 7c and 7d show the prediction results of the ANN model of the surface temperature and electrical resistance using the testing sets [36]. The R-squared values of the surface temperature and electrical resistance were 0.91 and 0.97, respectively. In addition, the mean absolute error (MAE) was calculated to further validate the ANN model in the testing sets. The MAE values of the surface temperature and electrical resistance were 8.1 and 16.0, respectively. The high R-squared value, which is close to one, and the low MAE value means a significant correlation between the input and output values in the ANN model. Therefore, these results prove that the proposed ANN model is suitable to predict the surface temperature and electrical resistance in nanocomposites incorporating CNT and CF.
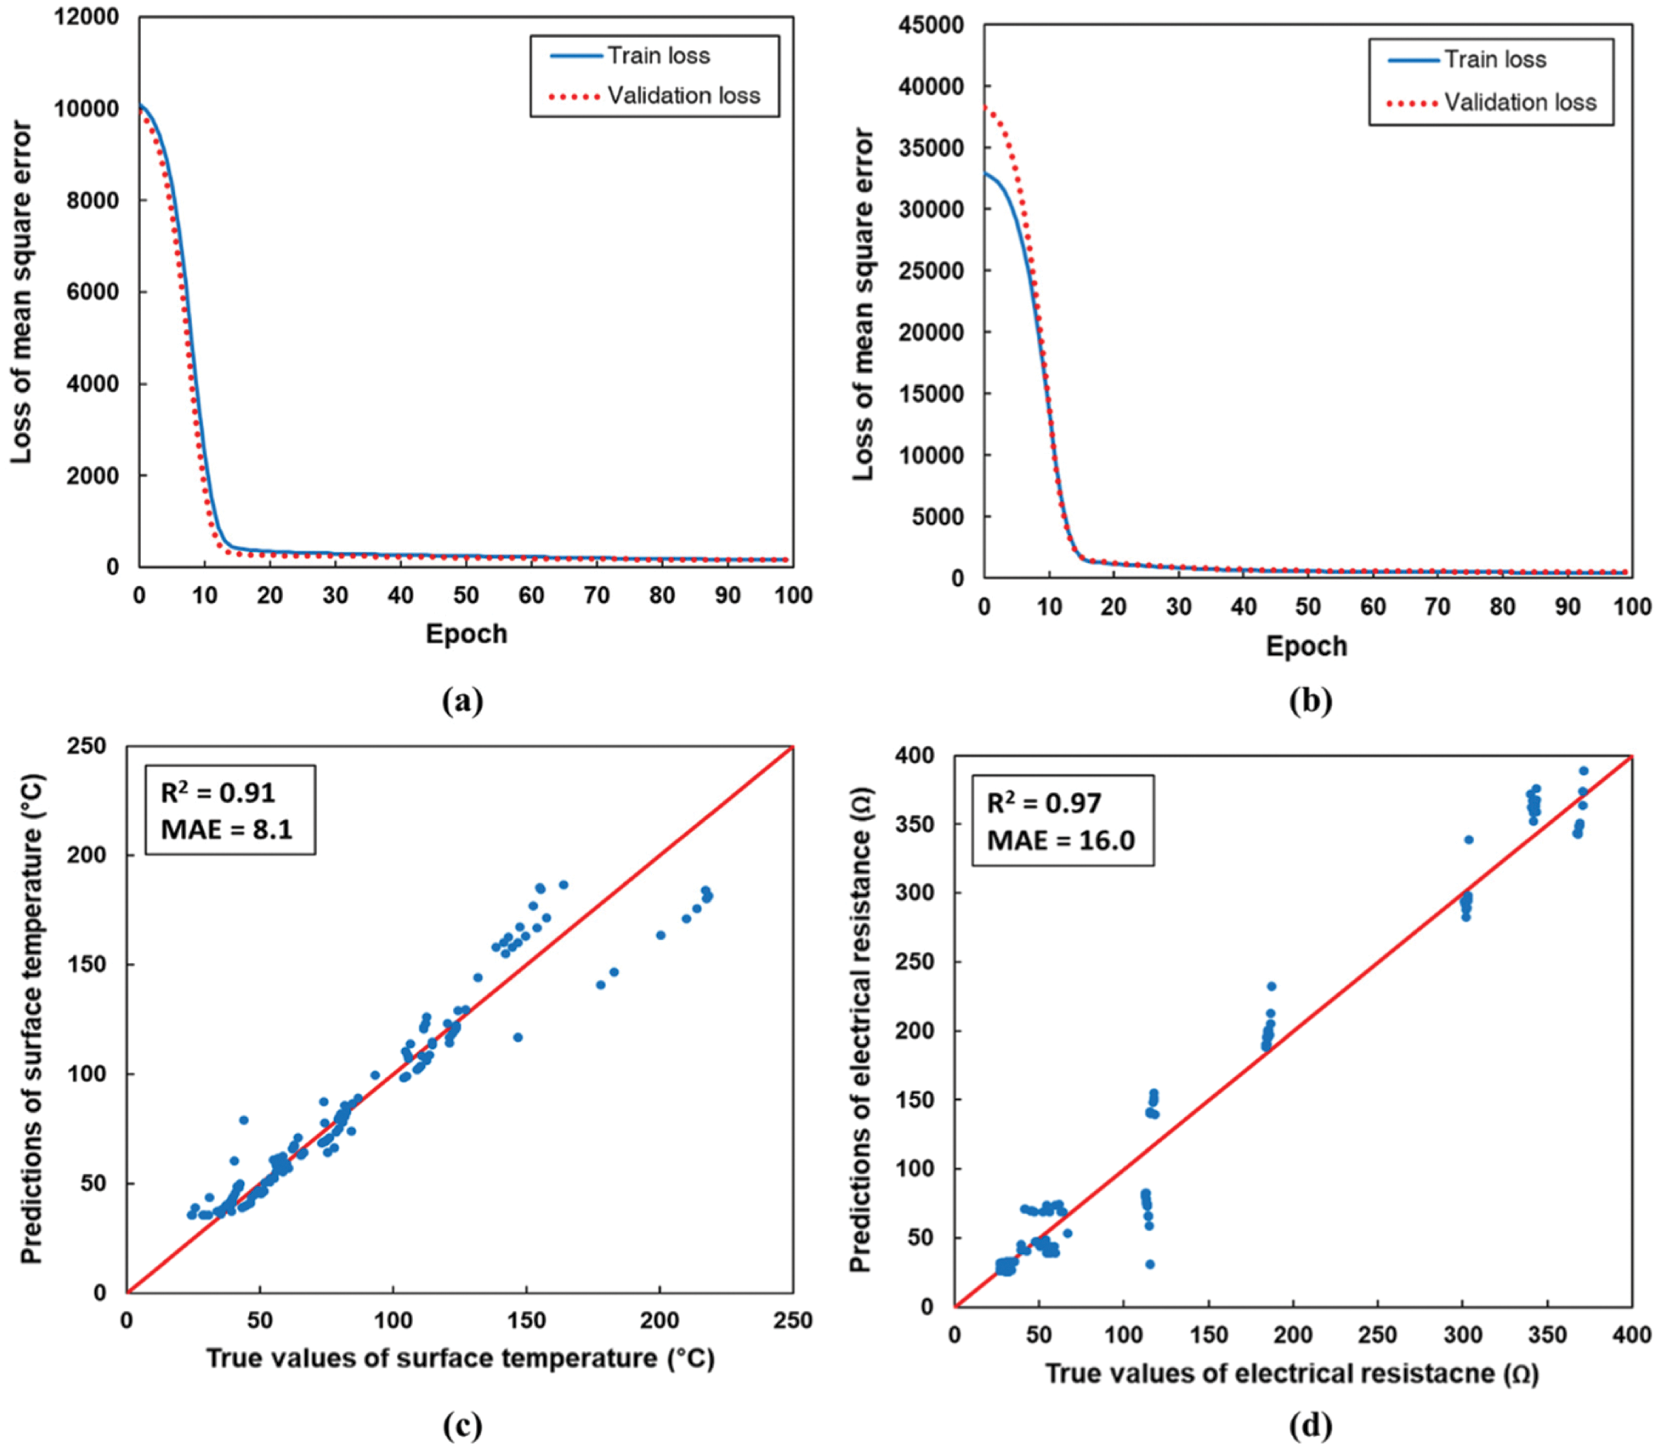
Figure 7: Loss value against the epoch for predicting (a) the surface temperature and (b) electrical resistance and the prediction results of the ANN model of (c) the surface temperature and (d) electrical resistance using the testing sets
Fig. 8 shows the histogram of the relative prediction error on surface temperature and electrical resistance using the testing sets. The relative prediction error was obtained by dividing the difference between the true value and the prediction value by the prediction value, which was shown in Figs. 7c and 7d. In the histogram of the surface temperature, a frequency within the error of 10% was approximate 70%, and a frequency of 93.1% achieved an error of less than 20%. Meanwhile, in the histogram of the electrical resistance, a frequency within the error of 10% was approximate 60%, and a frequency of 72.9% achieved an error of less than 20%, which is higher than the error of the surface temperature. It is mainly due to the characteristics of raw datasets of the electrical resistance, showing unstable peaks in specific heating time. These results suggest that the ANN model for predicting the surface temperature is more accurate than the model for predicting the electrical resistance.
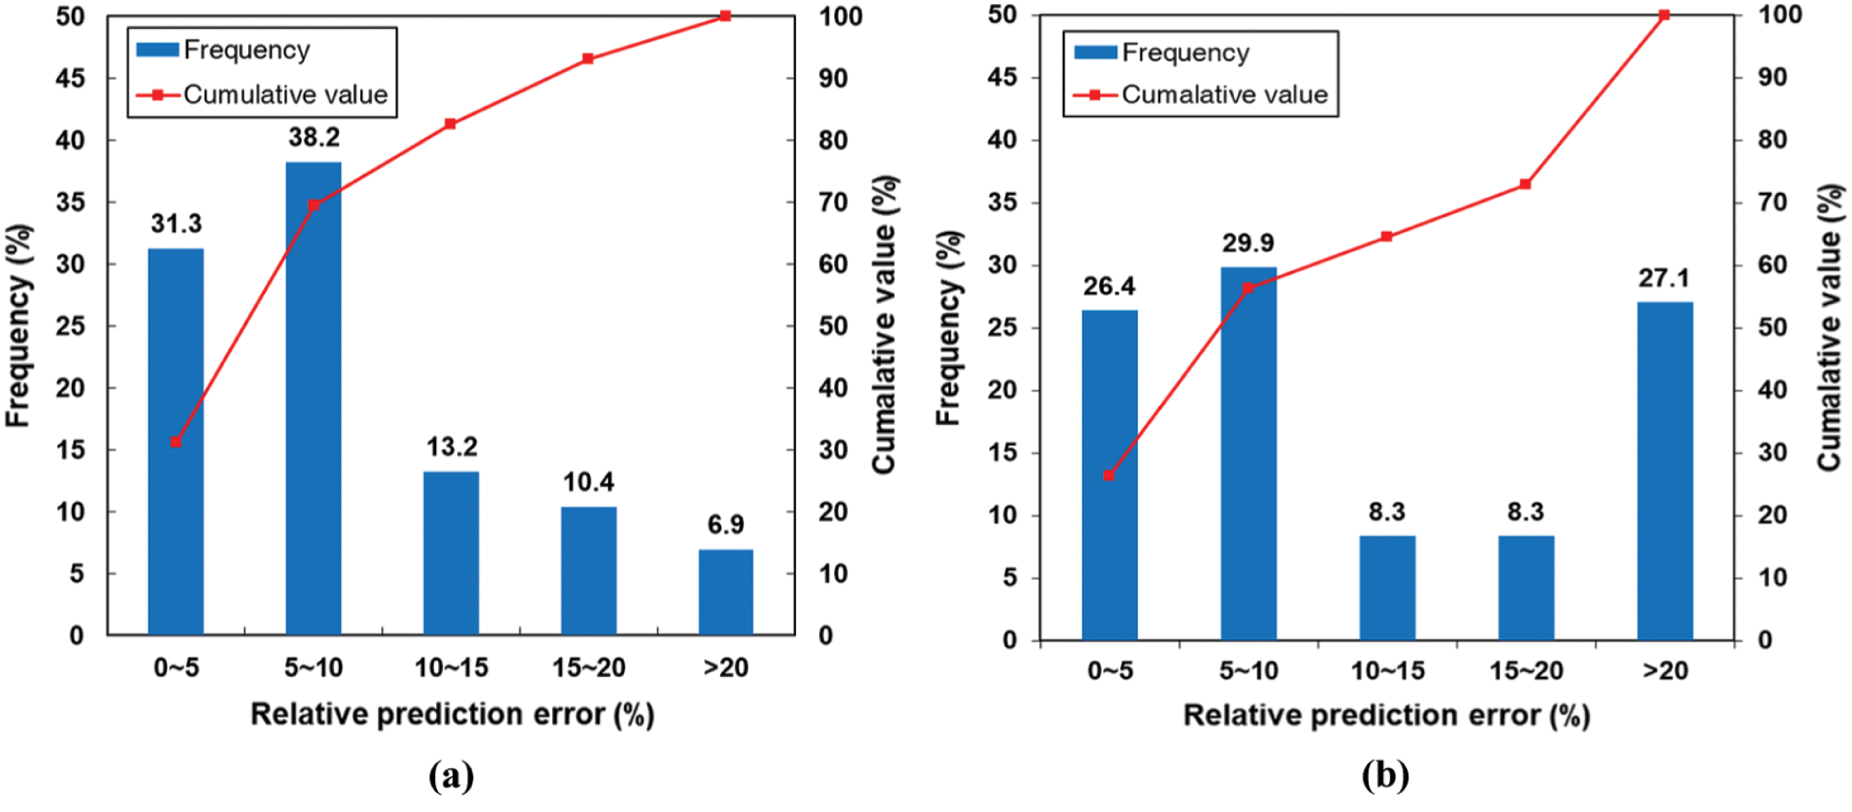
Figure 8: Histogram of the relative prediction error on (a) surface temperature and (b) electrical resistance using the testing sets
4.3 Detection Results and Analysis of Detecting a Severe NTC Effect
Fig. 9 shows the prediction results for detecting a severe NTC effect. Fig. 9a shows the criterion of the severe NTC effect. Based on the experimental results in Fig. 6, we assumed that if both R/R0 and T values decrease to less than 0.90 and 100°C, respectively, the severe NTC effect occurs. The training and validation losses of the binary cross-entropy decreased significantly within 10 epochs, converging to 0.17 at 100 epochs, as shown in Fig. 9b.
Fig. 9c shows a confusion matrix of the ANN model for data detection using the testing sets. A confusion matrix is a table used to describe the performance of a classification model of datasets for which the true values are known [41–44]. We selected 144 testing sets randomly and created a confusion matrix. There are two possible predicted classes: “NTC (Yes)” and “NTC (No).” “NTC (Yes)” in the predicted class means that the specimen showed a severe NTC effect in the prediction result, while “NTC (No)” in the predicted class means that the specimen did not show a severe NTC effect. Accordingly, the number of true positives (TP) and true negatives (TN) implies that we detected the occurrence of the NTC effect correctly. As shown in Fig. 9c, there were fewer cases of misdetection than 20 cases which is the total of false positive (FP) and false negative (FN). These results indicate that the present ANN model can feasibly detect the severe NTC effect within the assumed criterion.
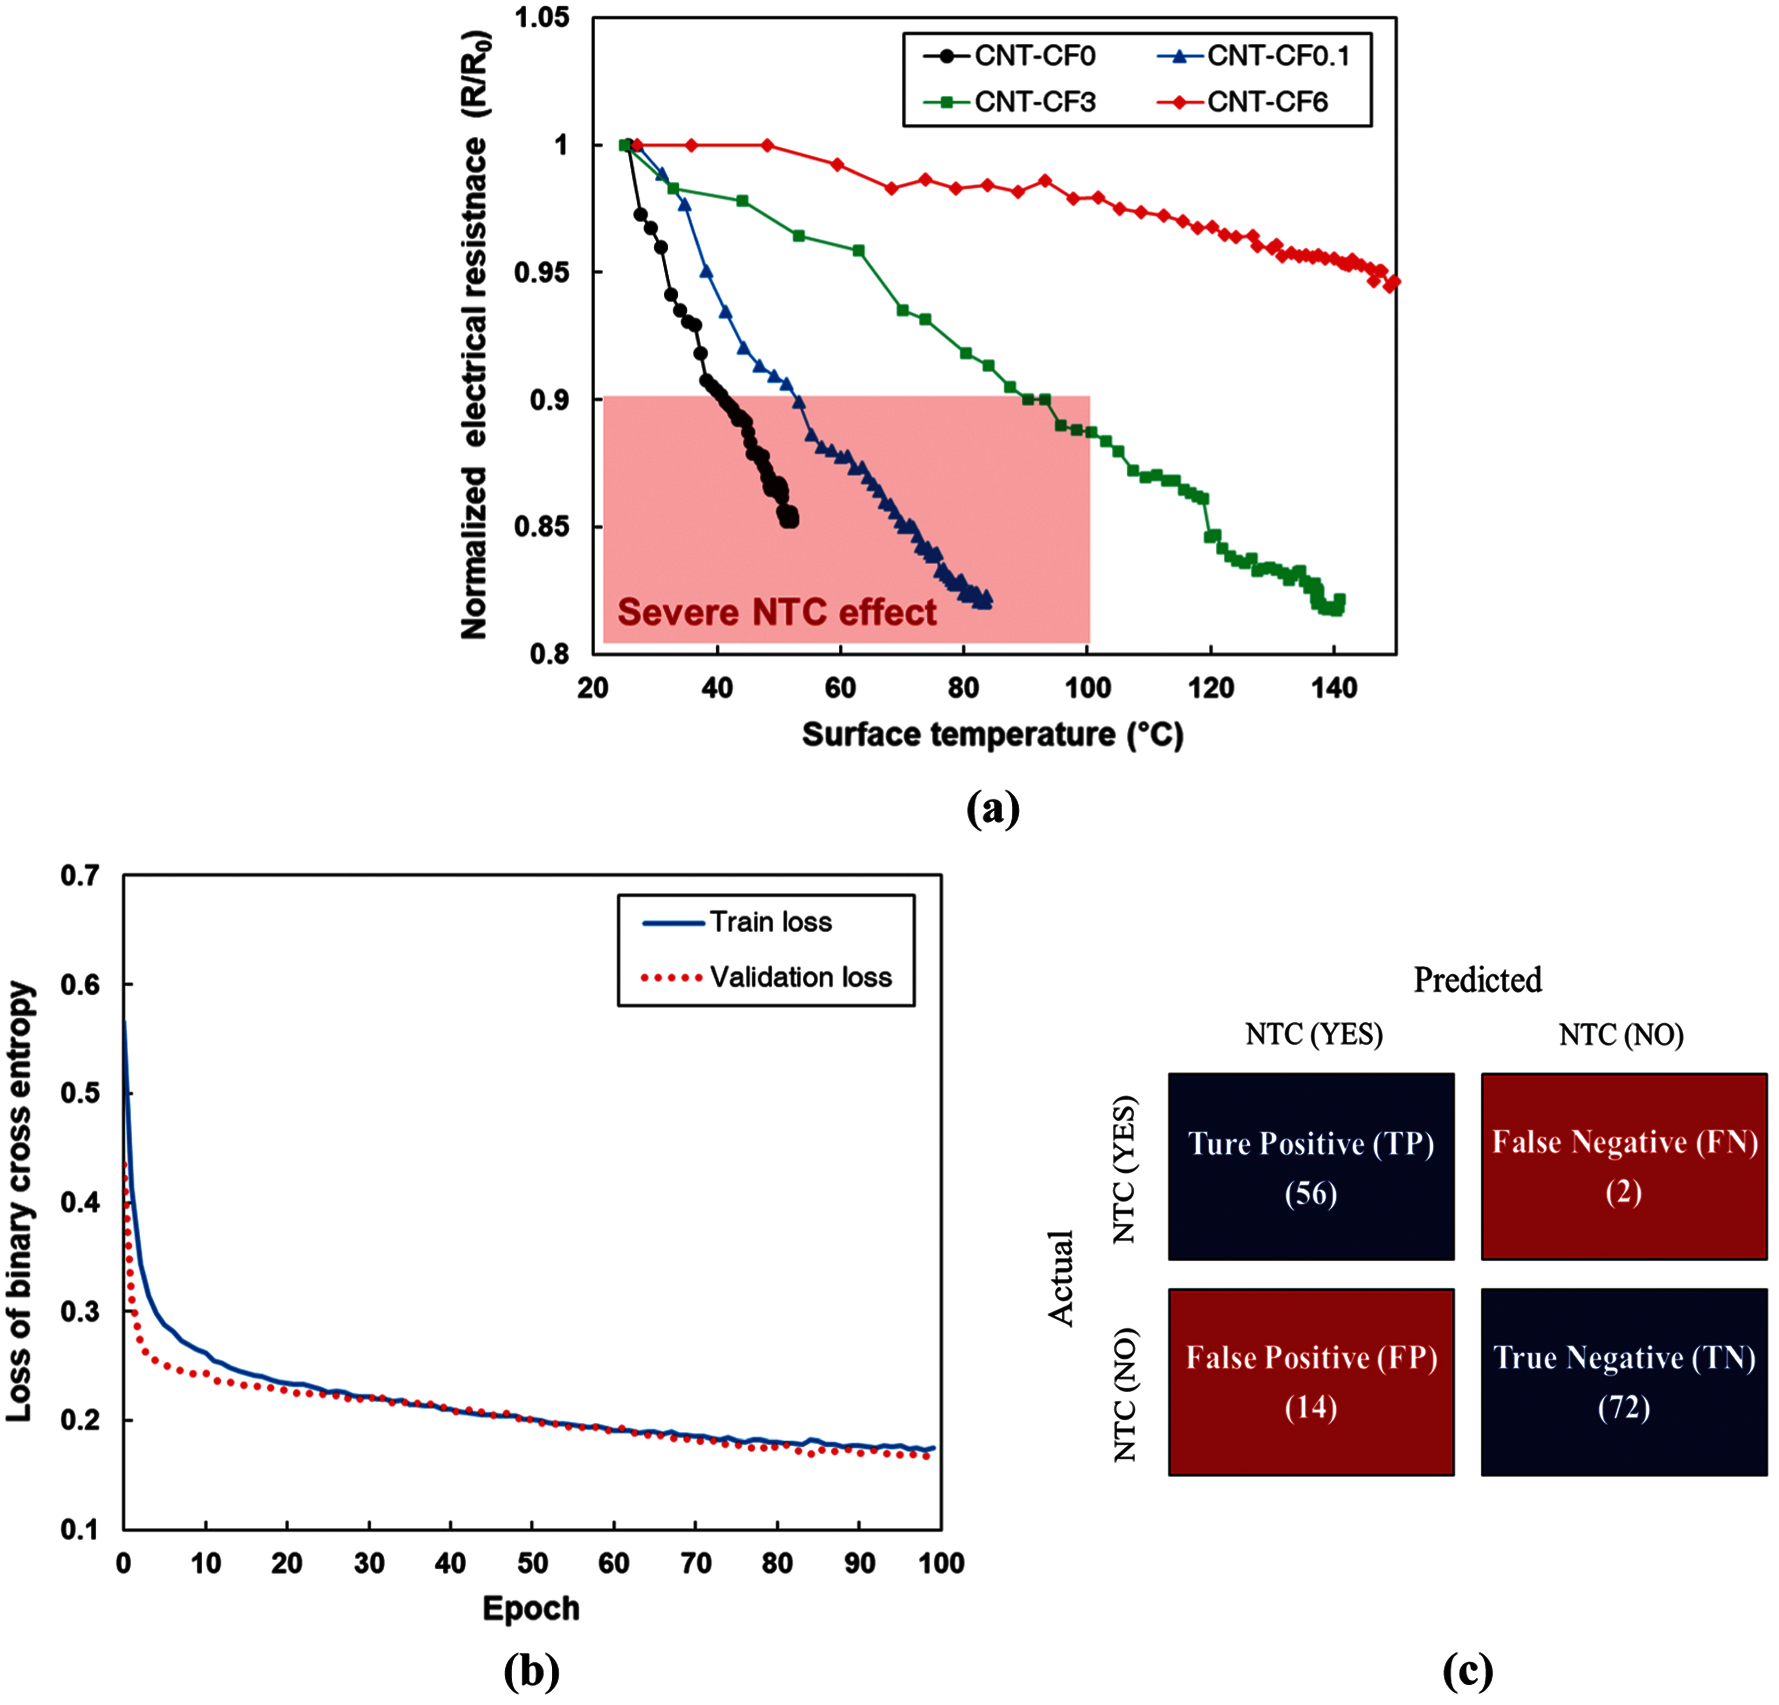
Figure 9: (a) Criterion of the severe NTC effect, (b) the loss value against the epochs for detecting the severe NTC effect and (c) a confusion matrix of the ANN model for data detection using the testing sets
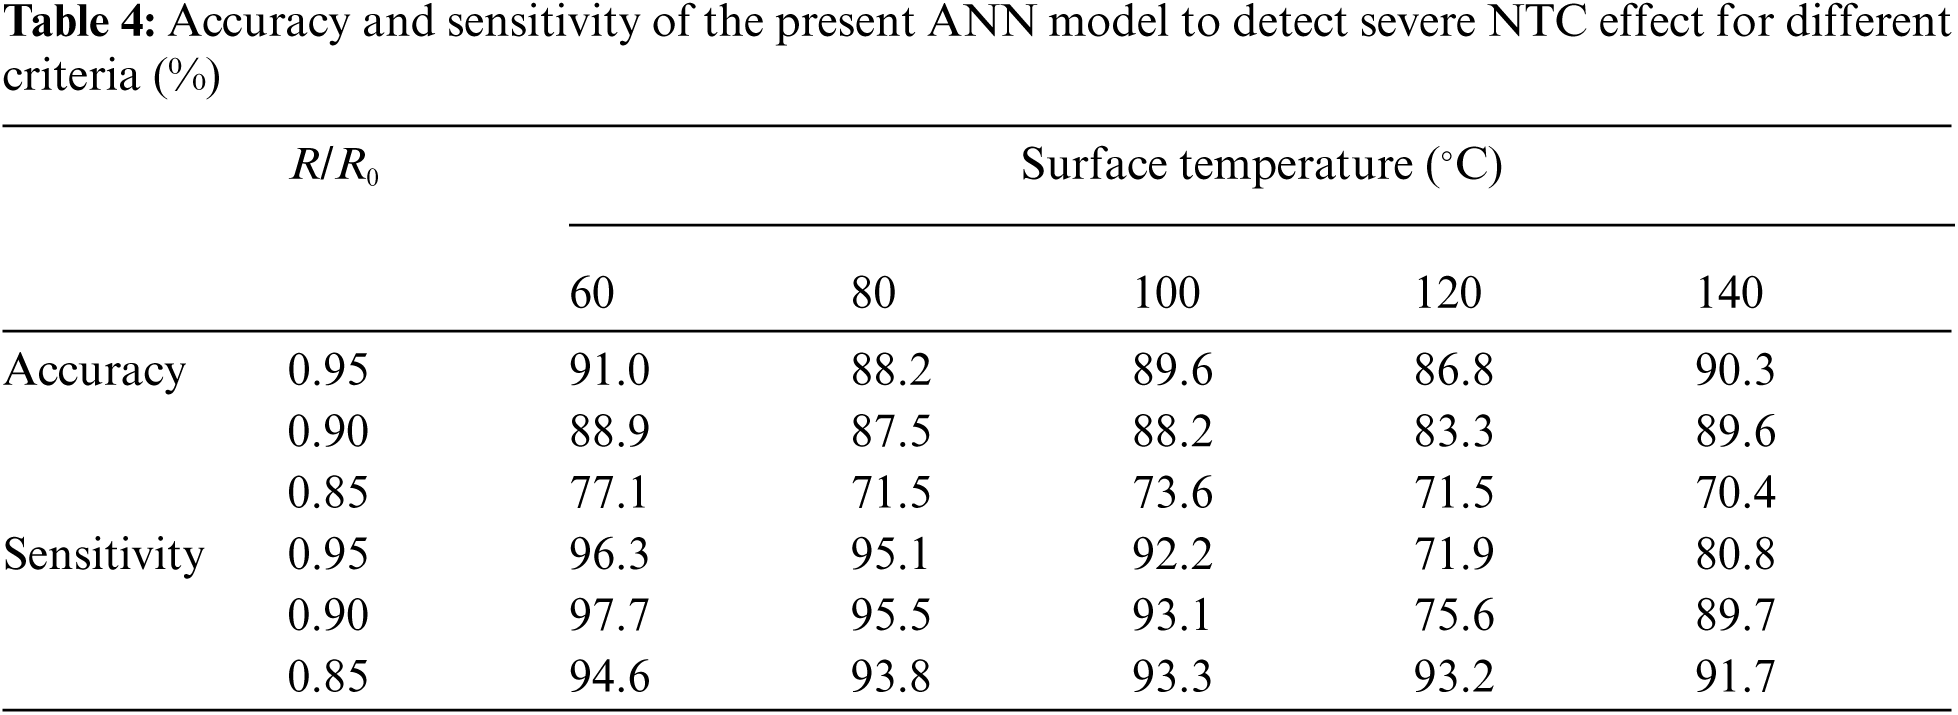
The accuracy and sensitivity of the present ANN model to detect severe NTC effect for different criteria are summarized in Tab. 4. As the measuring criteria [41,45–47], the accuracy ((TP + TN)/(TP + FN + FP + TN)) and sensitivity (TP/(TP + FN)) were calculated for evaluating the present ANN model. This table illustrates that the present ANN model exhibited high accuracy and sensitivity exceeding 70% for all criteria. It can be seen that the accuracy rates slightly decreased as the R/R0 value increases. This decrease in the accuracy could result from those raw datasets were not enough for the detection within assumed criteria. Nevertheless, the present ANN model showed high detection performance under the self-heating condition, showing the potential of the proposed ANN model for detection of the severe NTC effect in nanocomposites incorporating CNT and CF.
The present study proposed a machine learning approach to the prediction of the self-heating characteristics and the detection of the NTC effect of nanocomposites incorporating CNT and CF. Self-heating tests of nanocomposites incorporating CNT and CF were conducted, and the self-heating properties of the composites were discussed in parallel with changes in the electrical resistance with the increase of the surface temperature. Based on the experimental results, three input features were considered, and ANN models were constructed to predict the surface temperature and electrical resistance, and to detect the NTC effect. The key findings of the study are summarized below.
• The fabricated specimens showed a reduction in electrical resistance levels for self-heating, indicating the occurrence of the NTC effect. The incorporation of longer CF was found to lead to improved heat capabilities, which prevented the NTC effect.
• The predicted surface temperature and electrical resistance were in good agreement with the experimental results. The trained ANN model for predicting the surface temperature and electrical resistance of the composites recorded a corresponding R-squared value of 0.91 and 0.97, respectively, in the testing sets.
• The proposed ANN model for data detection can detect the NTC effect in composites with all criteria with R-squared value exceeding 0.7. The proposed model can be expected to be able to evaluate the heating stability of nanocomposites incorporating CNT and CF.
The present study used a machine learning approach to investigate the self-heating properties of nanocomposites under a monotonic self-heating condition. However, experimental and theoretical verifications under a cyclic heating condition are also essential to examine the stability of repetitive self-heating of these types of composites. Accordingly, our future work will investigate the cyclic self-heating effects on the composites using a recurrent neural network model. Moreover, it should be noted that relevant experimental schemes capable of considering other physical properties of materials (i.e., the material's microstructure, the geometry of the specimen, and coefficient of thermal expansion) in the present model are needed for more accurate and realistic predictions.
Funding Statement: This research was supported by Chungbuk National University Korea National University Development Project (2021).
Conflicts of Interest: The authors declare that they have no conflicts of interest to report regarding the present study.
1. M. H. Al-Saleh and U. Sundararaj, “A review of vapor grown carbon nanofiber/polymer conductive composites,” Carbon, vol. 47, no. 1, pp. 2–22, 2009. [Google Scholar]
2. B. C. Tee, C. Wang, R. Allen and Z. Bao, “An electrically and mechanically self-healing composite with pressure-and flexion-sensitive properties for electronic skin applications,” Nature Nanotechnology, vol. 7, no. 12, pp. 825–832, 2012. [Google Scholar]
3. G. Giannopoulos, S. Georgantzinos, D. Katsareas and N. Anifantis, “Numerical prediction of young's and shear moduli of carbon nanotube composites incorporating nanoscale and interfacial effects,” Computer Modeling in Engineering and Sciences, vol. 56, no. 3, pp. 231–248, 2010. [Google Scholar]
4. A. V. Dudchenko, C. Chen, A. Cardenas, J. Rolf and D. Jassby, “Frequency-dependent stability of CNT joule heaters in ionizable media and desalination processes,” Nature Nanotechnology, vol. 12, no. 6, pp. 557–563, 2017. [Google Scholar]
5. L. Pan, Z. Liu, L. Zhong, X. Pang, F. Wang et al., “Carbon fiber/poly ether ether ketone composites modified with graphene for electro-thermal deicing applications,” Composites Science and Technology, vol. 192, no. 26, pp. 108117, 2020. [Google Scholar]
6. K. Chu, D.-J. Yun, D. Kim, H. Park and S.-H. Park, “Study of electric heating effects on carbon nanotube polymer composites,” Organic Electronics, vol. 15, no. 11, pp. 2734–2741, 2014. [Google Scholar]
7. B. Zhou, X. Han, L. Li, Y. Feng, T. Fang et al., “Ultrathin, flexible transparent joule heater with fast response time based on single-walled carbon nanotubes/poly (vinyl alcohol) film,” Composites Science and Technology, vol. 183, no. 20, pp. 107796, 2019. [Google Scholar]
8. N. Forintos and T. Czigany, “Multifunctional application of carbon fiber reinforced polymer composites: Electrical properties of the reinforcing carbon fibers–a short review,” Composites Part B: Engineering, vol. 162, no. 1, pp. 331–343, 2019. [Google Scholar]
9. G. Pal and S. Kumar, “Multiscale modeling of effective electrical conductivity of short carbon fiber-carbon nanotube-polymer matrix hybrid composites,” Materials and Design, vol. 89, no. 5, pp. 129–136, 2016. [Google Scholar]
10. T. Glaskova-Kuzmina, A. Aniskevich, M. Zarrelli, A. Martone and M. Giordano, “Effect of filler on the creep characteristics of epoxy and epoxy-based CFRPs containing multi-walled carbon nanotubes,” Composites Science and Technology, vol. 100, no. 21, pp. 198–203, 2014. [Google Scholar]
11. G. M. Kim, B. Yang, H. N. Yoon and H. K. Lee, “Synergistic effects of carbon nanotubes and carbon fibers on heat generation and electrical characteristics of cementitious composites,” Carbon, vol. 134, pp. 283–292, 2018. [Google Scholar]
12. M. R. Zakaria, H. M. Akil, M. H. A. Kudus, F. Ullah, F. Javed et al., “Hybrid carbon fiber-carbon nanotubes reinforced polymer composites: A review,” Composites Part B: Engineering, vol. 176, no. 1, pp. 107313, 2019. [Google Scholar]
13. K. Chu and S.-H. Park, “Electrical heating behavior of flexible carbon nanotube composites with different aspect ratios,” Journal of Industrial and Engineering Chemistry, vol. 35, no. 25, pp. 195–198, 2016. [Google Scholar]
14. T. Ebbesen, H. Lezec, H. Hiura, J. Bennett, H. Ghaemi et al., “Electrical conductivity of individual carbon nanotubes,” Nature, vol. 382, no. 6586, pp. 54–56, 1996. [Google Scholar]
15. K. Dydek, P. Latko-Durałek, A. Boczkowska, M. Sałaciński and R. Kozera, “Carbon fiber reinforced polymers modified with thermoplastic nonwovens containing multi-walled carbon nanotubes,” Composites Science and Technology, vol. 173, no. 22, pp. 110–117, 2019. [Google Scholar]
16. S.-J. Joo, M.-H. Yu, W. S. Kim and H.-S. Kim, “Damage detection and self-healing of carbon fiber polypropylene (CFPP)/carbon nanotube (CNT) nano-composite via addressable conducting network,” Composites Science and Technology, vol. 167, no. 20, pp. 62–70, 2018. [Google Scholar]
17. H. Nakano, K. Shimizu, S. Takahashi, A. Kono, T. Ougizawa et al., “Resistivity–temperature characteristics of filler-dispersed polymer composites,” Polymer, vol. 53, no. 26, pp. 6112–6117, 2012. [Google Scholar]
18. Z. D. Xiang, T. Chen, Z. M. Li and X. C. Bian, “Negative temperature coefficient of resistivity in lightweight conductive carbon nanotube/polymer composites,” Macromolecular Materials and Engineering, vol. 294, no. 2, pp. 91–95, 2009. [Google Scholar]
19. T. Kil, D. W. Jin, B. Yang and H. K. Lee, “A comprehensive micromechanical and experimental study of the electrical conductivity of polymeric composites incorporating carbon nanotube and carbon fiber,” Composite Structures, vol. 268, pp. 114002, 2021. [Google Scholar]
20. D. Jang, T. Kil, H. N. Yoon, J. Seo and H. R. Khalid, “Artificial neural network approach for predicting tunneling-induced and frequency-dependent electrical impedances of conductive polymeric composites,” Materials Letters, vol. 302, pp. 130420, 2020. [Google Scholar]
21. V. Daghigh, T. E. Lacy, H. Daghigh, G. Gu, K. T. Baghaei et al., “Heat deflection temperatures of bio-nano-composites using experiments and machine learning predictions,” Materials Today Communications, vol. 22, pp. 100789, 2020. [Google Scholar]
22. H.-T. Bang, S. Yoon and H. Jeon, “Application of machine learning methods to predict a thermal conductivity model for compacted bentonite,” Annals of Nuclear Energy, vol. 142, pp. 107395, 2020. [Google Scholar]
23. M.-K. Kazi, F. Eljack and E. Mahdi, “Predictive ANN models for varying filler content for cotton fiber/PVC composites based on experimental load displacement curves,” Composite Structures, vol. 254, pp. 112885, 2020. [Google Scholar]
24. X. Jiang, M. Coffee, A. Bari, J. Wang, X. Jiang et al., “Towards an artificial intelligence framework for data-driven prediction of coronavirus clinical severity,” Computers, Materials & Continua, vol. 63, no. 1, pp. 537–551, 2020. [Google Scholar]
25. B. J. Yang, K. J. Cho, G. M. Kim and H. K. Lee, “Effect of CNT agglomeration on the electrical conductivity and percolation threshold of nanocomposites: A micromechanics-based approach,” Computer Modeling in Engineering & Sciences, vol. 103, no. 5, pp. 343–365, 2014. [Google Scholar]
26. T. Rabczuk, “Agglomeration effects on static stability analysis of multi-scale hybrid nanocomposite plates,” Computers, Materials & Continua, vol. 63, no. 1, pp. 41–64, 2020. [Google Scholar]
27. H. N. Yoon, D. I. Jang, H. K. Lee and I. W. Nam, “Influence of carbon fiber additions on the electromagnetic wave shielding characteristics of CNT-cement composites,” Construction and Building Materials, vol. 269, pp. 121238, 2021. [Google Scholar]
28. D. I. Jang, H. N. Yoon, I. W. Nam and H. K. Lee, “Effect of carbonyl iron powder incorporation on the piezoresistive sensing characteristics of CNT-based polymeric sensor,” Composite Structures, vol. 244, pp. 112260, 2020. [Google Scholar]
29. G. M. Kim, T. Kil and H. K. Lee, “A novel physicomechanical approach to dispersion of carbon nanotubes in polypropylene composites,” Composite Structures, vol. 258, pp. 113377, 2021. [Google Scholar]
30. J. Niu, L. Li, Q. Xu and Z. Xia, “Toughening mechanisms in carbon nanotube-reinforced amorphous carbon matrix composites,” Computers, Materials & Continua, vol. 38, no. 1, pp. 31–41, 2013. [Google Scholar]
31. M. J. Brown, L. A. Hutchinson, M. J. Rainbow, K. J. Deluzio and A. R. De Asha, “A comparison of self-selected walking speeds and walking speed variability when data are collected during repeated discrete trials and during continuous walking,” Journal of Applied Biomechanics, vol. 33, no. 5, pp. 384–387, 2017. [Google Scholar]
32. J.-E. Park, G.-E. Yun, D.-I. Jang and Y.-K. Kim, “Analysis of electrical resistance and impedance change of magnetorheological gels with DC and AC voltage for magnetometer application,” Sensors, vol. 19, no. 11, pp. 2510, 2019. [Google Scholar]
33. H. Rahmanpanah, S. Mouloodi, C. Burvill, S. Gohari and H. M. Davies, “Prediction of load-displacement curve in a complex structure using artificial neural networks: A study on a long bone,” International Journal of Engineering Science, vol. 154, pp. 103319, 2020. [Google Scholar]
34. S. Y. Kim, J.-U. Jang, B. F. Haile, M. W. Lee and B. Yang, “Swarm intelligence integrated micromechanical model to investigate thermal conductivity of multi-walled carbon nanotube-embedded cyclic butylene terephthalate thermoplastic nanocomposites,” Composites Part A: Applied Science and Manufacturing, vol. 128, pp. 105646, 2017. [Google Scholar]
35. F. Yan, Y.-C. Chan, A. Saboo, J. Shah, G. B. Olson et al., “Data-driven prediction of mechanical properties in support of rapid certification of additively manufactured alloys,” Computer Modeling in Engineering & Sciences, vol. 117, no. 3, pp. 343–366, 2018. [Google Scholar]
36. F. Deng, Y. He, S. Zhou, Y. Yu, H. Cheng et al., “Compressive strength prediction of recycled concrete based on deep learning,” Construction and Building Materials, vol. 175, pp. 562–569, 2018. [Google Scholar]
37. G. E. Hinton and R. R. Salakhutdinov, “Reducing the dimensionality of data with neural networks,” Science, vol. 313, no. 5786, pp. 504–507, 2006. [Google Scholar]
38. V. Nair and G. E. Hinton, “Rectified linear units improve restricted boltzmann machines,” in Proc. ICML-10, Haifa, Israel, pp. 807–814, 2010. [Google Scholar]
39. Y. J. Cha, W. Choi and O. Büyüköztürk, “Deep learning-based crack damage detection using convolutional neural networks,” Computer-Aided Civil and Infrastructure Engineering, vol. 32, no. 5, pp. 361–378, 2017. [Google Scholar]
40. J. Bang, H. M. Park and B. Yang, “Repetitive heating performance of MgO-activated ground granulated blast furnace slag composites containing MWCNTs,” Functional Composites and Structures, vol. 3, pp. 015003, 2021. [Google Scholar]
41. S. Oh, Y. Jung, S. Kim, I. Lee and N. Kang, “Deep generative design: Integration of topology optimization and generative models,” Journal of Mechanical Design, vol. 141, no. 11, pp. 111405, 2019. [Google Scholar]
42. H. Jeon, J. Yu, H. Lee, G. M. Kim, J. W. Kim et al., “A combined analytical formulation and genetic algorithm to analyze the nonlinear damage responses of continuous fiber toughened composites,” Computational Mechanics, vol. 60, no. 3, pp. 393–408, 2017. [Google Scholar]
43. B. J. Yang, B. R. Kim and H. K. Lee, “Micromechanics-based viscoelastic damage model for particle-reinforced polymeric composites,” Acta Mechanica, vol. 223, no. 6, pp. 1307–1321,. 2012. [Google Scholar]
44. M. Kashif, A. Hussain, A. Munir, A. B. Siddiqui, A. Abbasi et al., “A machine learning approach for expression detection in healthcare monitoring systems,” Computers, Materials & Continua, vol. 67, no. 2, pp. 2123–2139, 2021. [Google Scholar]
45. M. M. Shokrieh and M. S. Kondoria, “Effects of adding graphene nanoparticles in decreasing of residual stresses of carbon/epoxy laminated composites,” Composite Materials and Engineering, vol. 2, no. 1, pp. 53–64, 2020. [Google Scholar]
46. A. Luque, A. Carrasco, A. Martín and A. Heras, “The impact of class imbalance in classification performance metrics based on the binary confusion matrix,” Pattern Recognition, vol. 91, pp. 216–231, 2019. [Google Scholar]
47. A. Pourmoayed, K. M. Fard and B. Rousta, “Free vibration analysis of sandwich structures reinforced by functionally graded carbon nanotubes,” Composite Materials and Engineering, vol. 3, no. 1, pp. 1–23, 2021. [Google Scholar]
 | This work is licensed under a Creative Commons Attribution 4.0 International License, which permits unrestricted use, distribution, and reproduction in any medium, provided the original work is properly cited. |