DOI:10.32604/cmc.2022.020531
| Computers, Materials & Continua DOI:10.32604/cmc.2022.020531 | |
| Article |
Attention-Based Deep Learning Model for Early Detection of Parkinson's Disease
1Department of Computer Engineering, Jamia Millia Islamia, New Delhi-110025, India
2Department of Math and Computer Science, Augustana College, Rock Island, Illinois-61201, USA
3Department of Computer Engineering, Jamia Millia Islamia, New Delhi-110025, India
*Corresponding Author: Mohd Tauheed Khan. Email: tauheedkhanmohd@augustana.edu
Received: 28 May 2021; Accepted: 17 September 2021
Abstract: Parkinson's disease (PD), classified under the category of a neurological syndrome, affects the brain of a person which leads to the motor and non-motor symptoms. Among motor symptoms, one of the major disabling symptom is Freezing of Gait (FoG) that affects the daily standard of living of PD patients. Available treatments target to improve the symptoms of PD. Detection of PD at the early stages is an arduous task due to being indistinguishable from a healthy individual. This work proposed a novel attention-based model for the detection of FoG events and PD, and measuring the intensity of PD on the United Parkinson's Disease Rating Scale. Two separate datasets, that is, UCF Daphnet dataset for detection of Freezing of Gait Events and PhysioNet Gait in PD Dataset were used for training and validating on their respective problems. The results show a definite rise in the various performance metrics when compared to landmark models on these problems using these datasets. These results strongly suggest that the proposed state of the art attention-based deep learning model provide a consistent as well as an efficient solution to the selected problem. High values were obtained for various performance metrics like accuracy of 98.74% for detection FoG, 98.72% for detection of PD and 98.05% for measuring the intensity of PD on UPDRS. The model was also analyzed for robustness against noisy samples, where also model exhibited consistent performance. These results strongly suggest that the proposed model provides a better classification method for selected problem.
Keywords: Parkinson's disease; freezing of gait; the attention mechanism; hyperparameter tuning; attentive-FoGPDNet
A critical step considered in treatment of a PD patient is the early detection of the disease, which has been a major interest of research. PD, being a neurodegenerative disorder, affects parts of the brain whose intense effects can lead to gait imbalance, which leads to motor disorders in patients. This is due to the lack of the neurotransmitter responsible for transmitting signals to motor neurons of the brain. Dopamine deficiency results in symptoms like speech impairment, tremor, muscle stiffness, posture alteration and disturbance in Gait balance [1] and anxiety.
There is an alarming increase in the number of PD cases recently. Data from the American Parkinson's Disease Association (APDA) [2] suggests that, close to 10 million people are present with this progressive disease. It also suggests that the number of patients is going to increase by a factor of two in the coming 20 years, most of whom will have an age between the ranges of 60–80 years. Currently, for the diagnosis of freezing of gait (FoG) one has to go through numerous tests and no certain cure has been discovered, but specific therapies can help to reduce and control this effect [3]. Even with advanced technologies and computation power, the diagnosis of PD is relies on traditional method like MRI, X-rays, PET, CT scan, etc. The mentioned methods are invasive, highly expensive to carry out, and are effective at the later stages of the disease where it has significantly spread over the brain. Detection of PD at the early stages is crucial to prevent damage caused to brain cells and the methods of diagnosis need to be non-invasive and inexpensive.
In recent years, various machine learning (ML) based models were proposed for diagnosis or detection of PD, including other neurodegenerative diseases. Various factors were taken into consideration like handwritten data, speech data and gait patterns [1,4–12]. Gait imbalance, also known as Bradykinesia (meaning slowness in movement), being one of the poorly understood symptoms.
Nieuwboer et al. [13] defined FoG as the inability or inadequacy of a person in dealing with concurrent cognitive motor and limbic inputs which result in pauses in locomotion and interruption lasting less than 10 s. A patient's day-to-day activity becomes affected and there is a significant reduction in the quality of life [14]. PD patients have trouble in numerous daily activities such as walking, sidestepping and climbing the stairs [15]. The assessment of FoG is a convoluted procedure since its severity and frequency are closely affiliated to the patient's activity and environment. The universal procedure for FoG detection is based on tests performed in a clinical laboratory and a FoG questionnaire [16–19]. There can be biased results emerging from their tests due to certain side effects like the clinical environment effect [17,20,21] and Hawthorne effect [22]. Contrastingly, inaccurate answers can be given by the patients, due to the fact the answers depend on the patient's subjective perception [23]. Post the detection of the disease, solutions are provided to patients using certain wearable devices.
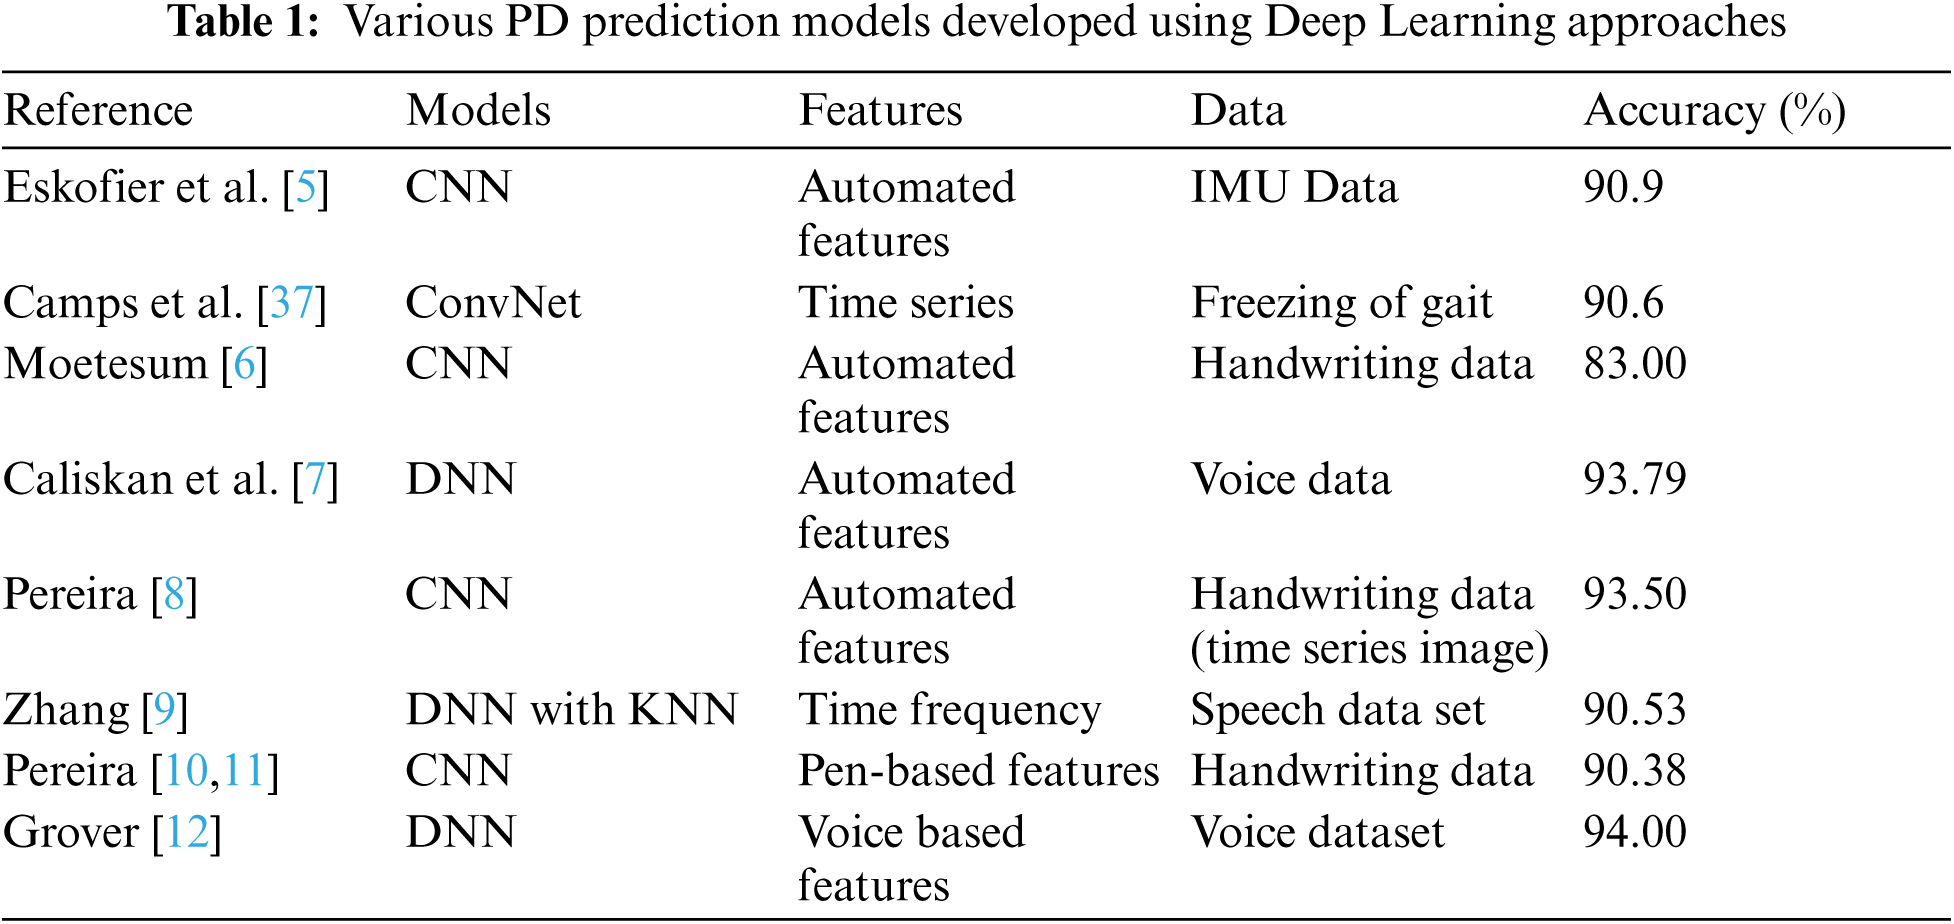
Through advancement in technology emerged lightweight, cost effective and accurate devices that can handle data collection and data pre-processing [24,25]. Development in the field of artificial intelligence has steered the attention into designing of non-intrusive wearable technologies that help to address the daily monitoring system [26–31]. Novel methods for detection of FoG are based on the conventional machine learning (ML) technologies that predict from signals obtained from various inertial measurements [28,32,33]. These ML techniques are mentioned in Tab. 1 with their respective accuracies. Bespoke features and lack of varying and consolidated data from PD patients are a major issue in developing long-term solutions from these methods.
On the flipside, many conventional algorithms use featuring learning methods that transform raw input signal into a meaningful description. Deep Learning (DL) provides these feature learning methods having several levels of representation [34]. A major advantage of DL is the non-requirement of featuring engineering as a DL model can learn from any data regardless it being multimodal or multivariate data. ML algorithms are outperformed in various complex problems, a few of them being image classification [35] and gaming [36]. Eskofer-et-al. [5] expressed the alternative of conventional ML techniques being DL techniques for IMU-based locomotive disorder for the evaluation in PD patients.
In this paper, a novel algorithm for PD detection by exploitation latest state-of-the-art deep learning concepts for prediction of FoG and PD in early prospective patients. None of the existing models presented in the recent literature reviewed in the section above have used such a composite model for this problem. Along with the detection of PD, this work also aims to predict the intensity of PD on the UPDR scale [38]. The main application of this deep learning model is as a non-invasive technique in detecting FoG and PD. Such an end-to-end system can be applied in physicians and clinics where they can assess the intensity and severity of the disease with the help of Gait patterns and also determine the kind of treatment that can be advised to these patients. This model can be used in an embedded system that includes the accelerometers and compute units along with it or it can be used solely to make predictions from gait patterns on a computer. The proposed network is based on two forms of gait signals, one is the data collected from accelerometers connected to the ankle, upper leg, and trunk, the other being the vertical ground reaction force collected from sensors placed under the feet of PD patients. The proposed model achieved an accuracy of 98.74% on detection of FoG, 98.72% on detection of PD, and 98.05% on measuring the intensity of PD. The proposed architecture includes a Convolutional Neural Network for feature extraction, which was then forwarded to an LSTM. The output of the LSTM was forwarded to an Attention Based Layer, and then finally for the final classification, its output was forwarded to a fully connected dense layer. Due to layered architecture, a heavy pre-processing of data was avoided in this work.
Detection of PD from FoG events collected through gait patterns is still an open research area despite using various conventional algorithms.
Moore et al. [39], 2008, was the first to attempt to automate detection of FoG. Threshold freeze index was used by performing frequency analysis on accelerometer signals by identifying specific bands for FoG. The prediction of FoG events was 78% correct. Bachlin et al. [40], 2009, proposed a method MBFA that was an extension of the method used by Moore et al. [39]. The addition of the power index (PI), reduction in latency time and modification of duration of the window to 4 s were the changes that were applied. Sensitivity of 73.1% and specificity of 81.6% were specified. Computation of the results were done by adding an error offset margin of 2 s. MBFA is a simple, widely accepted model that is used as a basic benchmark trained through the Daphnet dataset [40] for FoG detection.
Mazilu et al. [41], 2012, proposed the first system of automatic detection of FoG with machine learning. ML algorithms like KNN, decision trees, naïve Bayes and random forest were used. The best results obtained were 66.25% sensitivity and 95.38% specificity. In another work, Zhao et al. [42], 2012, integrated accelerometer in pants to propose an online threshold based automatic detection of FoG. 8 patients were tested, but only 6 experienced FoG and achieved sensitivity of 81.74%. Relative analysis of various sensor arrangements, parameters used in signal processing and placement of sensors was performed by Moore et al. [43]. Inertial signal data from 25 PD subjects that were documented by placing 7 sensors at the various position of the body was used. The best results can be achieved by using 7 sensors simultaneously and setting the window size to 2.5 to 5 s.
Tripoliti et al. [33], in the same year, proposed a four-stage method, which included data cleaning, data filtering, data extraction of features and classification. Conventional ML techniques like Naïve Bayes, Random Forest, decision tree and random trees were used for classification. Data was gathered from 16 subjects, among those, 5 normal individuals, 5 PD patients with FoG episodes and 6 PD patients that did not experience FoG episodes. At different body locations of the subject, two gyroscopes and six accelerometers were placed. Sensitivity of 89.3% and specificity of 79.15% were achieved.
Coste et al. [44], 2014, proposed a model in which a single wireless sensor placed at the patient's lower limbs was used for pre-FoG detection. Experiments were performed on 4 PD patients through which it was concluded that FoG detection could be enhanced by proper measurement of stride length. In another work postural assessment to implement a FoG detection model was used by Rodriguez et al. [45]. It helped in achieving a higher specificity and demonstrated an increase of specificity by 5%. Experiments were performed on 20 PD subjects by placing a midsection tri-axial accelerometer.
Zach et al. [46], 2015, published a study on the Daphnet dataset where the focus was on specificity and sensitivity of freezing index for FoG detection. Evaluation was carried out by placing an accelerometer on the lumbar region of 23 patients experiencing FoG episodes. The study targeted episodes that occurred during short step walking and full rapid turns. Specificity of 76% and sensitivity of 75% was observed.
Rodriguez [28], 2017, published a method to detect FoG in PD patients by taking in consideration the active daily life. Use of SVM for the classification of FoG episodes by extraction of 55 features from inertial signals was carried out. A total of 21 patients suffering from PD were taken into consideration for this study and only a single IMU sensor was positioned on the left waist of the subject while performing daily life activities at home. Through the episode-based evaluation method resulted in 76.8% geometric mean of sensitivity and specificity.
Sama et al. [31], 2017, modified the Rodriguez's [28] model by a reduction in the number of features to 28. A relative analysis of the model was also published. Equivalent performance could be achieved using the 28 features describes, hence leading to the simplification of the model. Camps [37], 2018, proposed a novel procedure which was built on 8-layer feed forward 1D Covnet. Data set considered for the model was a collection of inertial signals from 21 PD patients using tri-axial sensors and gyroscopes. Training of the network was done using the back-propagation algorithm. Accuracy achieved was 89% with 90.6 GM using a window size above 2 s.
San-Segundo et al. [47], 2019, proposed a CNN + MLP approach to the problem of detection of Freezing of Gait events. Here, the author, used pre-defined set of features from Mazilu et al. [41], Human Activity Recognition [48], Mel frequency cepstral coefficients [49] and speech quality assessment metrics. Different overlap sizes were used. Higher overlap leads to biasing error induced in the dataset. That is the model will tend to perform better on the Daphnet dataset but will fail on any other dataset. Hence an ideal overlap size of 50% will be considered for this study. Here the author achieved 92.3% sensitivity, 92.8% Specificity, F1-Score as 94.8% and a 0.931 AUC.
Noella et al. [50], 2019, proposed a PARAFAC + Tucker Decomposition model for detection of PD using the PhysioNet Gait in PD dataset. It achieved an impressive accuracy of 97%. No other performance metrics is specified. For problems of medical domain, other performance metrics like sensitivity and specificity are valued more due to the fact they represent the degree of false positives and negatives presented in the prediction by the model.
As shown in Fig. 1, to extract features from the given raw dataset, a Convolution Neural Network (CNN) [51] was applied. 1D Convolutions were used with an increasing number of filters and each of the convolution layers were followed by a Max Pooling layer. Each convolution layer was normalized to prevent overfitting of data. After feature extraction from CNN, the output was forwarded to a Recurrent Neural Network (RNN) [52] to provide context from the previous timestamps. LSTM [53] are best suited for this as they can learn faster and robustly in a shorter number of epochs. In this model Bidirectional LSTM [53] layers were used.

Figure 1: Detailed framework of the proposed model
Regularization and dropouts were also applied to this layer to prevent the overfitting of data. A sigmoid function was set for the recurrent activation and a hyperbolic tangent function was set as the activation function. LSTMs [53] were specified to return their sequences along with the output. After passing the data through RNN, the output is passed to an Attention layer based on the concept of the Bahdanau attention layer [54] as shown in Fig. 2. In this layer, data is passed through a given set of encoders whose hidden states are forwarded with given attention weights as a context vector to produce an attention vector. This attention vector along with the output states from the encoder are forwarded to a decoder. This highlights the nodes or features that the model should pay attention to while deciding the output.

Figure 2: Bahdanau Attention Mechanism
To forward the data to a fully connected dense layer the incoming input has to be flattened from a 3D input tensor to a 2D tensor, which is the format of the output. A fully connected dense layer was added to compute the output forwarded from the attention layer. Number of nodes in the dense layer were set as 64 and activation function was set as a Rectified Linear Unit function. A single dense layer node with a sigmoid activation function was used, as the output had to be one of two values 0/1 where 0 signified normal gait behavior and 1 signified freezing of gait behavior.
Early detection of Freezing of Gait is, without a doubt, a crucial step in early treatment of PD. For detection of FoG, the Daphnet dataset [40] is taken into consideration. FoG is not the only major task for this research and so the detection of PD and predicting a quantifiable value for the intensity of PD is necessary as well. For this purpose, the PhysioNet-Gait Parkinson's disease dataset [55] was taken into consideration. Also, the deep learning architecture responsible for detection of FoG was also tested to detect Parkinson's disease and predict its intensity on the UPDRS scale [38].
Daphnet Freezing of Gait Dataset (Detection of Freezing of Gait)
For the purpose of this research UCI – Daphnet Freezing of Gait Dataset [40] was used as raw data for detection of Freezing of Gait. This is a time series data collected from three accelerometer sources on the trunk, shank and the upper thigh at a sampling rate of 64 Hz, which is enough for detection of freezing of gait episodes as they occur at a lower sampling rate (i.e., lower than 20 Hz). The data represents the acceleration in milli G's along the x, y and z-axes. It was manually annotated later, where 0-annotated implied it wasn't part of the experiment, 1–annotated data meant normal gait behavior (or no freezing of gait behavior detected) and 2–annotated data signified freezing of gait behavior. The 0-annotated data was removed as it wasn't part of the experiment; leaving two output values -1 and 2. To reduce calculations, the 2-annotated data was one hot encoded. This way a single output in 0/1 form was obtained. The timestamp was removed from the dataset as it was equally spaced at 15 ms. The dataset was rearranged column-wise, so that data along the same axes were clubbed together and then divided into a sample size of 4 s (256 samples) with 3.5 s overlap (32 sample skips). This resulted in 35,531 samples of 256 number of timestamps and 9 features. The sampled dataset was further split in the ratio of 80:20 where 80% of the data was used for training purposes and 20% of the data was used for testing purposes.
PhysioNet Gait in PD Dataset (Detection of PD and its Measurement)
For the purpose of this work the Physionet – Gait in Parkinson's Dataset [56] was used as raw data for two purposes; detection of PD and quantify the intensity of PD on the Unified Parkinson Disease Rating Scale (UPDRS) from a person's gait [38]. This is a time series data collected from the vertical ground reaction force (VGRF) generated from 8 sensors placed underneath both feet which is a quantitative method of measuring a person's gait. Along with the individual force measured from all the sensors, the collective force generated by each leg was also appended. The sampling rate of the given data was 100 Hz. Due to equally spaced timestamps; the column corresponding to it was removed. The data was divided into 1-second samples (100 samples) with a 0.5-second overlap (50 samples); this resulted in a data of 65915 sample of 100 time steps.
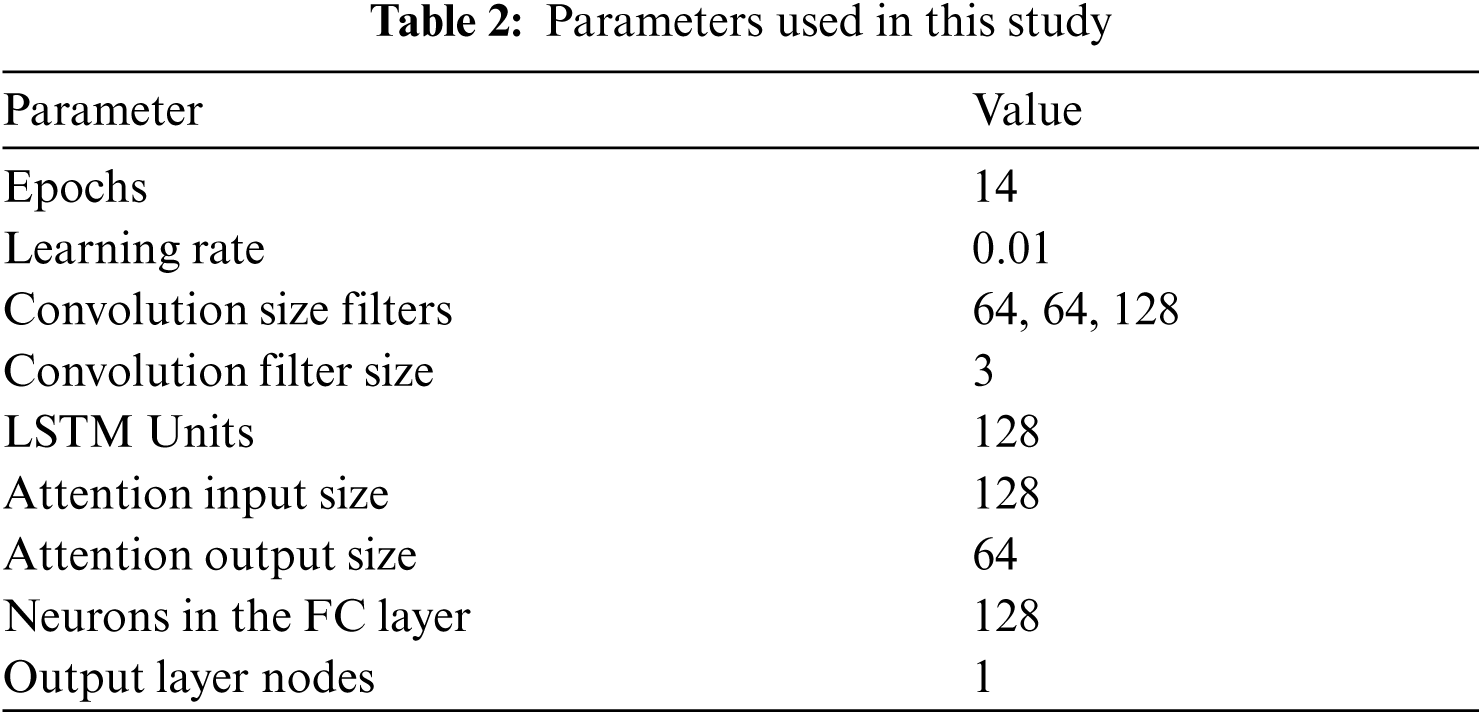
As an optimizer, Adam optimizer was selected along with loss function as binary cross entropy, since the result was dependent on two exclusive values/classes. Validation data was provided as a separate parameter by randomly splitting it from the given pool of dataset. The learning rate of the optimizer was set as 0.01, the number of epochs as 14 and batch size as 32. Input Shape = (X, 256, 9) and output shape = (X, 1), where X = batch size. The network parameters are specified in Tab. 2.
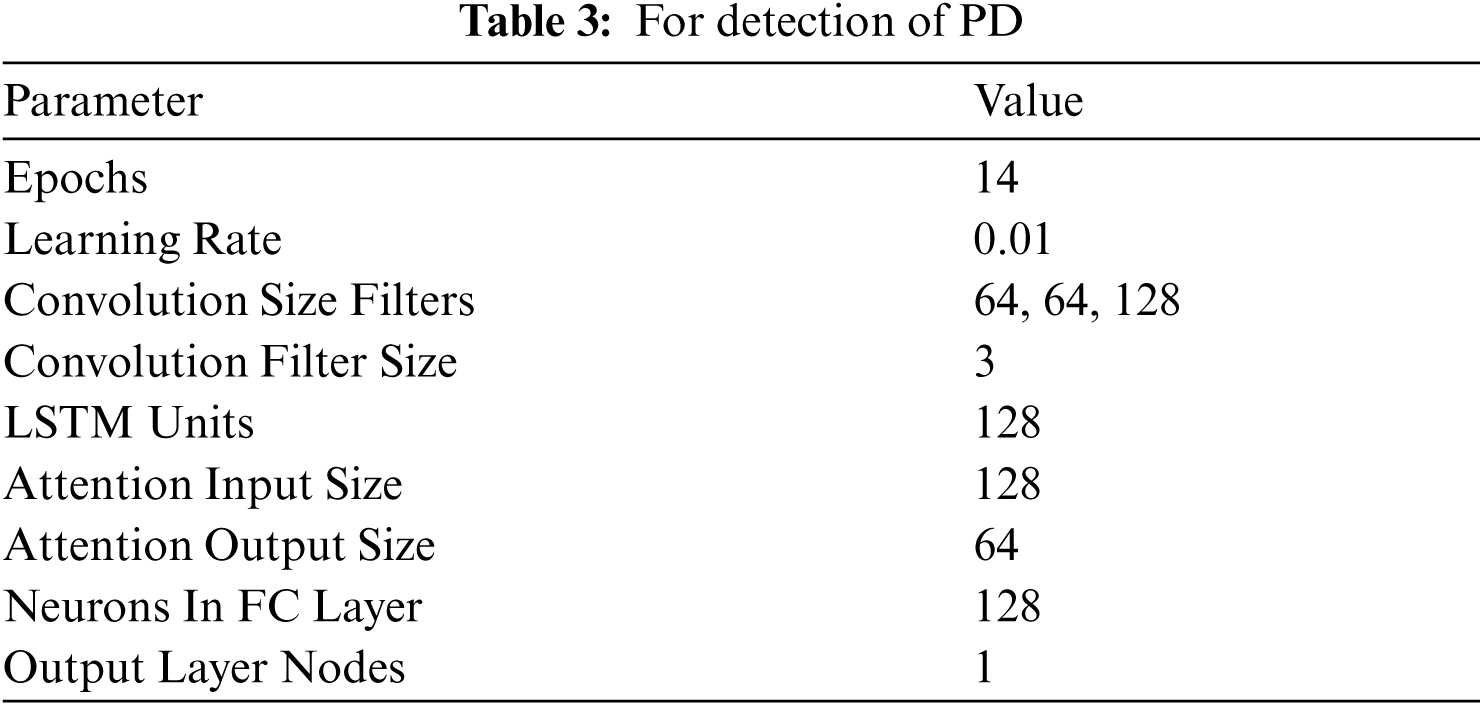
4.2.2 For Detection of Parkinson's Disease
For this specific domain of problem, individual samples were annotated whether belonging to a class of Parkinson's disease diagnosed group (class 1) or from the class of control group (class 0). This way our every sample was mapped to a certain output. Each sample had 18 features corresponding to the VGRF generated by gait.
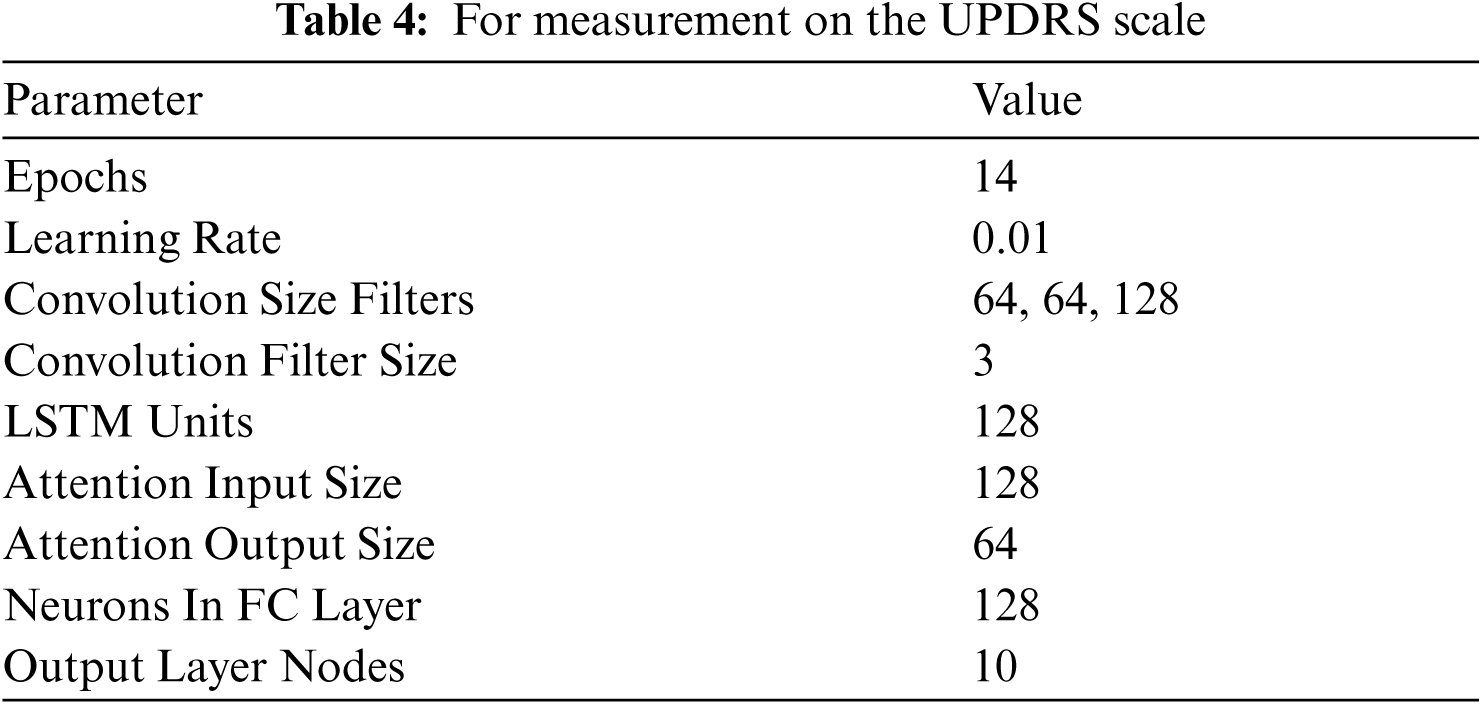
4.2.3 For Measuring the Intensity of Parkinson's Disease on UPDRS
For this specific domain of problem, along with 18 features from VGRF generated, we append the class of the data (class 1 or class 0) which it belongs. For reduction in complexity and calculations, we divide the output to 8 classes where each class determined a range of values on the UDPR scale.
Class 0: 0 ≤ x < 10
Class 1: 10 ≤ x < 20
Class 2: 20 ≤ x < 30
Class 3: 30 ≤ x < 40
Class 4: 40 ≤ x < 50
Class 5: 50 ≤ x < 60
Class 6: 60 ≤ x < 70
Class 7: 70 ≤ x
Each sample was mapped to an exclusive class, this resulted in every input being mapped to an output. Samples consisted of 19 features. As an optimizer, Adam optimizer was selected along with loss function as binary cross entropy, since the result was dependent on two exclusive values/classes. Validation data was provided as a separate parameter by randomly splitting it from the given pool of dataset. Learning rate of the optimizer was set as 0.01, the number of epochs as 14 and batch size as 32. Input Shape = (X, 100, 18) and (X, 100, 19) and output shape = (X, 1) and (X, 10), where X = batch size. The network parameters are specified in Tabs. 3 and 4.
All the experiments in this work pertaining to model development, training and testing were carried out on a Ryzen 5 3600 (6 core CPU), 24 GB RAM, RTX 2060 Super, Windows 10 machine using Tensorflow (2.2.0) and Keras (2.3.1) as the Deep Learning Frameworks.
For comparison between different models, sensitivity and specificity is of higher importance as it is not severely impacted by class imbalance. It also helps in highlighting the degree of False Positive and False Negatives that the model will predict. Tab. 5 shows that the proposed model outperforms all the other models.
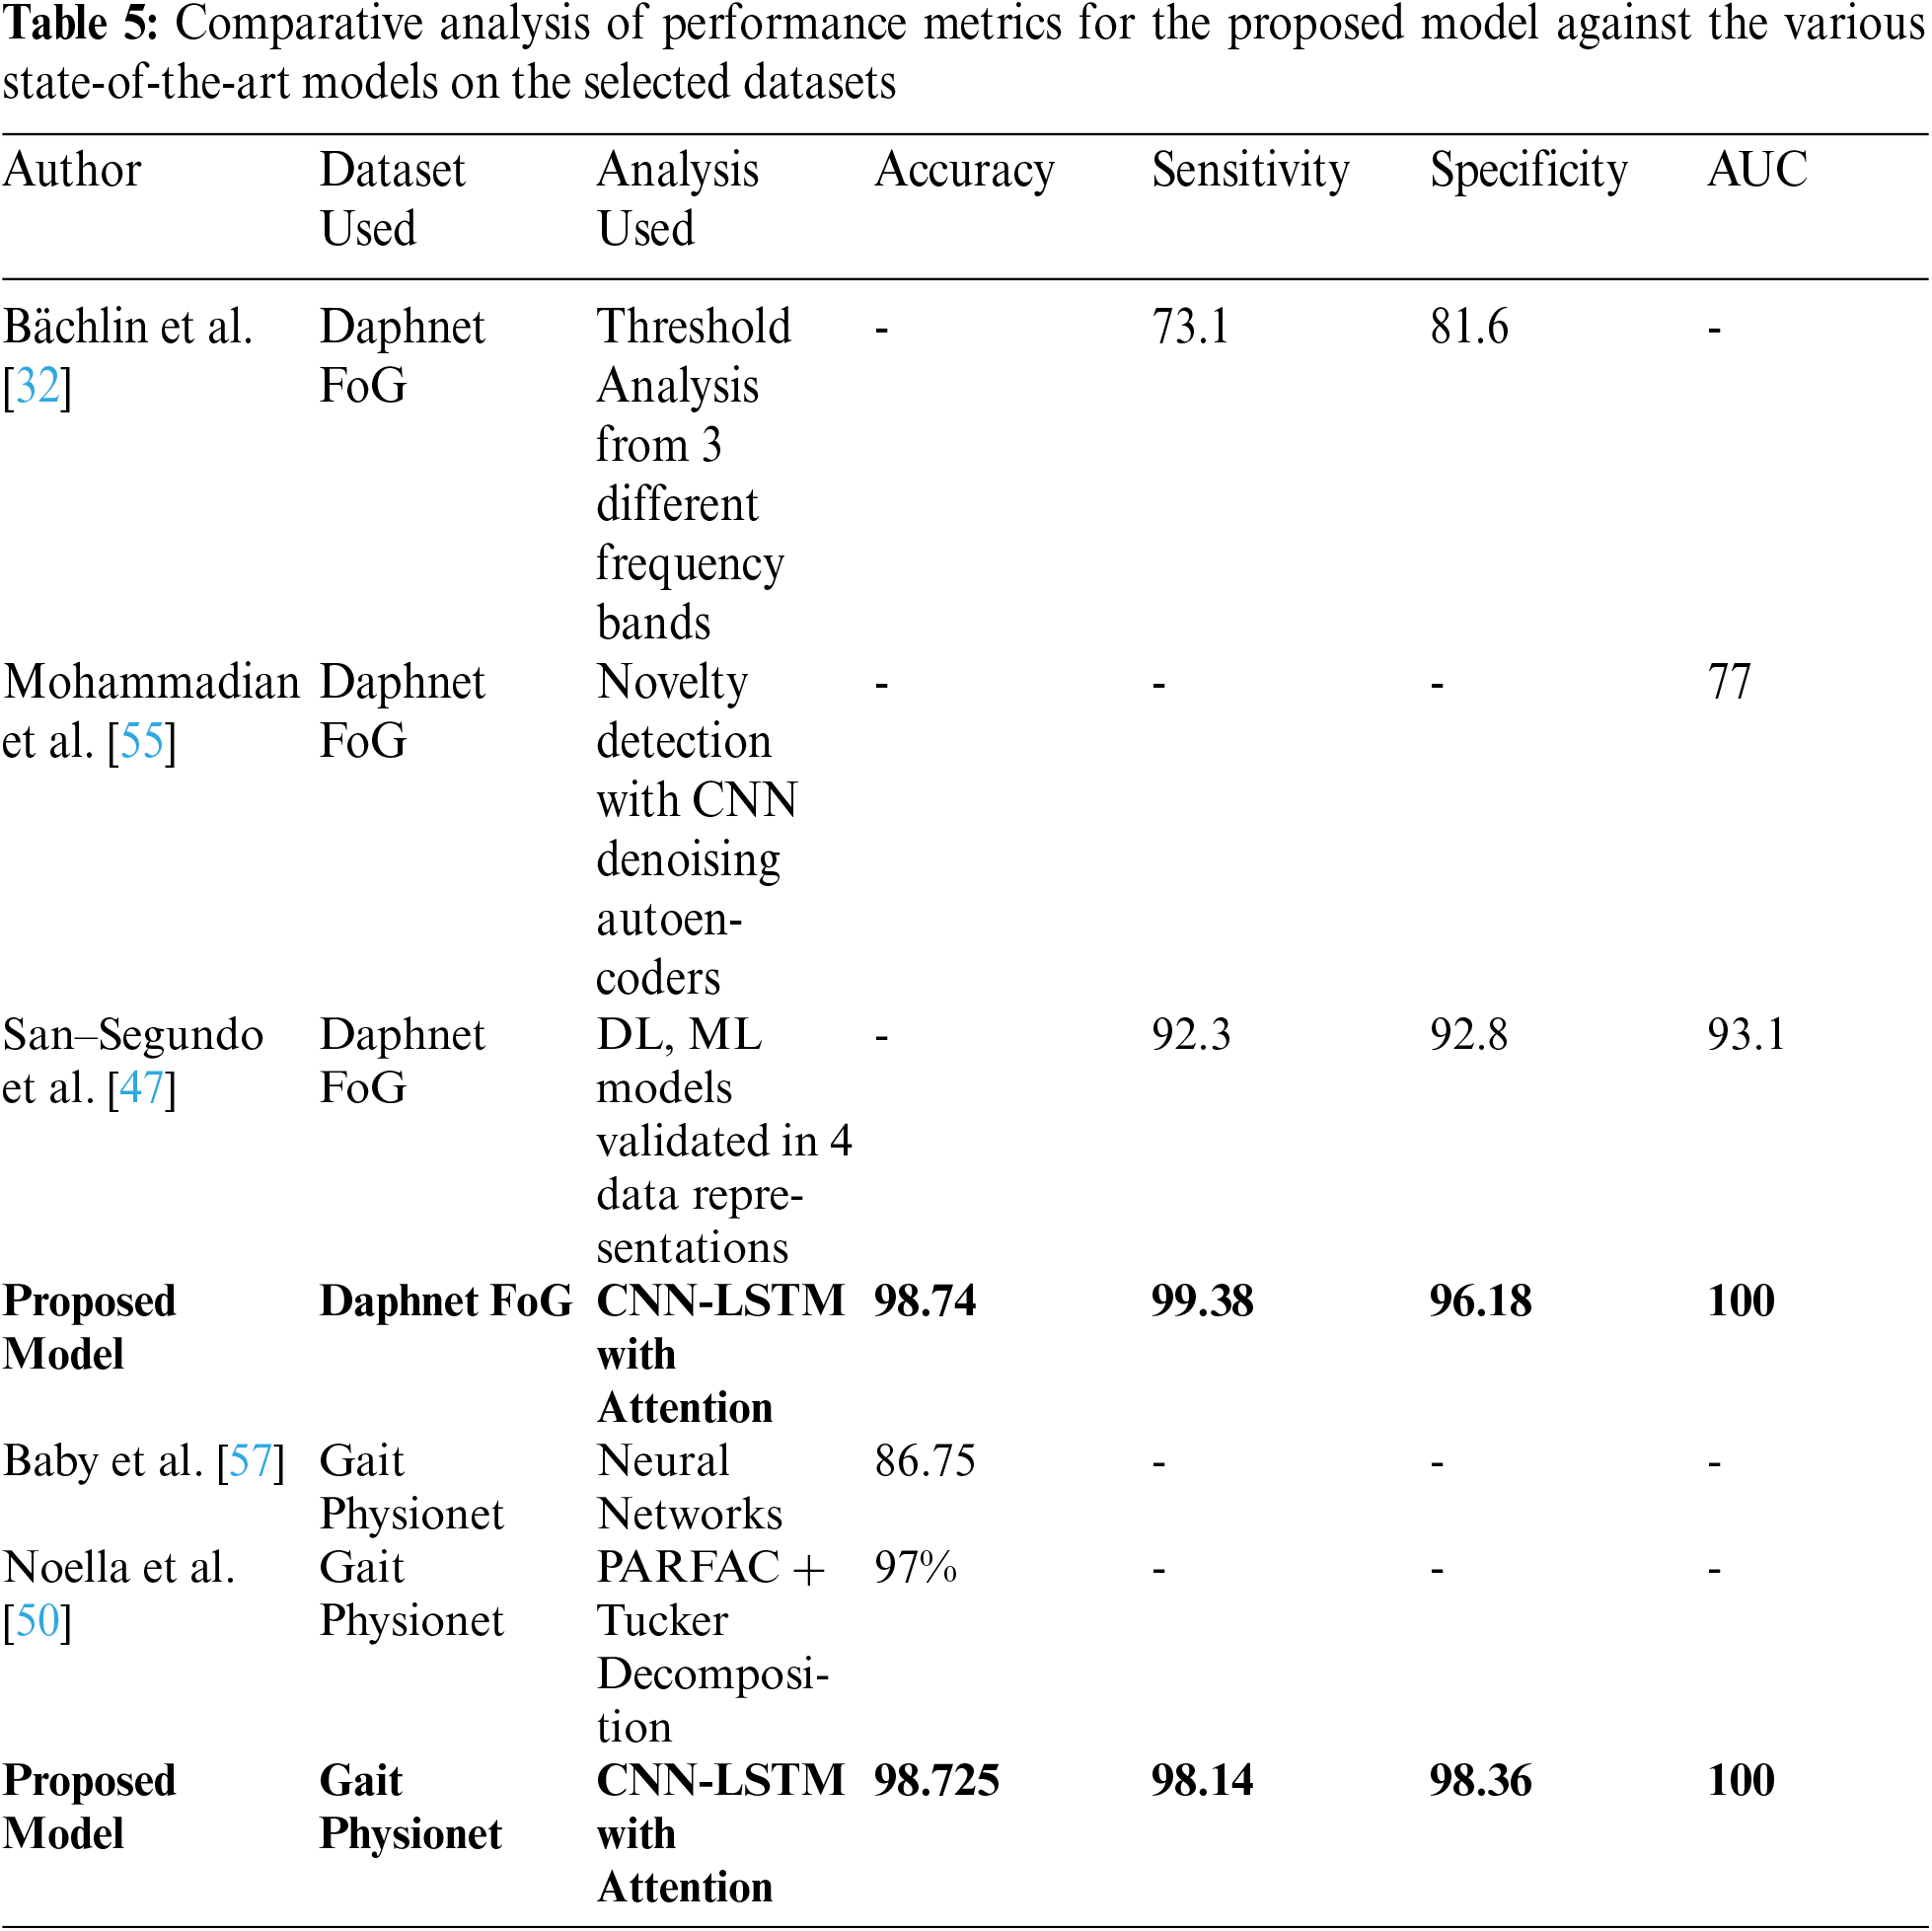
Different studies focused on different performance metrics for analyzing their respective models. Bachlin et al. [32] described the advantages of its model based on the sensitivity and accuracy achieved. The paper focused more on threshold analysis from feature extraction from the raw data provided. Mohammadian et al. [55] and San – Segundo et al. [47] used AUC as the performance metric, as it describes a relation between the true positive rate (TPR) and false positive rate (FPR). It is an evaluation of the classifier over different values of thresholds. Baby et al. [57] evaluates the model based on accuracy achieved by the model. To be able to compare the proposed model with the previously implemented ones, every performance metric had to be calculated.
The proposed Attention-based deep learning Model outperformed all the previously implemented state of the art technologies and algorithms. This can be highly useful as a non-invasive technique to, not only, detect FoG events but also be used for detection PD and measure its intensity on the basis of UPDRS scale. The results clearly show that the same attention-based model can be used for both the problems with different data formats and collection techniques.
It has been observed that due to the presence of an attention layer over the LSTM [53] layer the model should learn to pay attention to more important features. The accuracy should be higher as compared to a vanilla CNN LSTM [52,54] time-series-classification model. With the inclusion of an LSTM [54] layer, the model should not be trained for a longer duration to prevent overfitting of data. The lower number of epochs should give a relatively high validation and training accuracy. As mentioned, the architecture used on the Daphnet dataset [40] was also used for the PhysioNet dataset [56] as well as it was also of similar nature.
One of the major advantages of this proposed method is its non-invasive behavior. For detection of FoG, it managed to calculate predictions of ∼7000 batches in under 5 s, which means that close to ∼28000 s of data was processed within seconds. Similar speeds were achieved for the detection of PD and its measurement on the UPDRS. This showcases the real time application of the model as well. Although it should be noted that availability of medical data is scarce and the model is attuned to the kind of data it is trained on. Which means if there is any incorrect form of data that is forwarded to the model, it can result in garbage output as well. The scope of this model is meant to be within the professional environment of clinics or physicians to minimize any form of error generated.

Figure 3: Curves of all performance metrics for detection of FoG
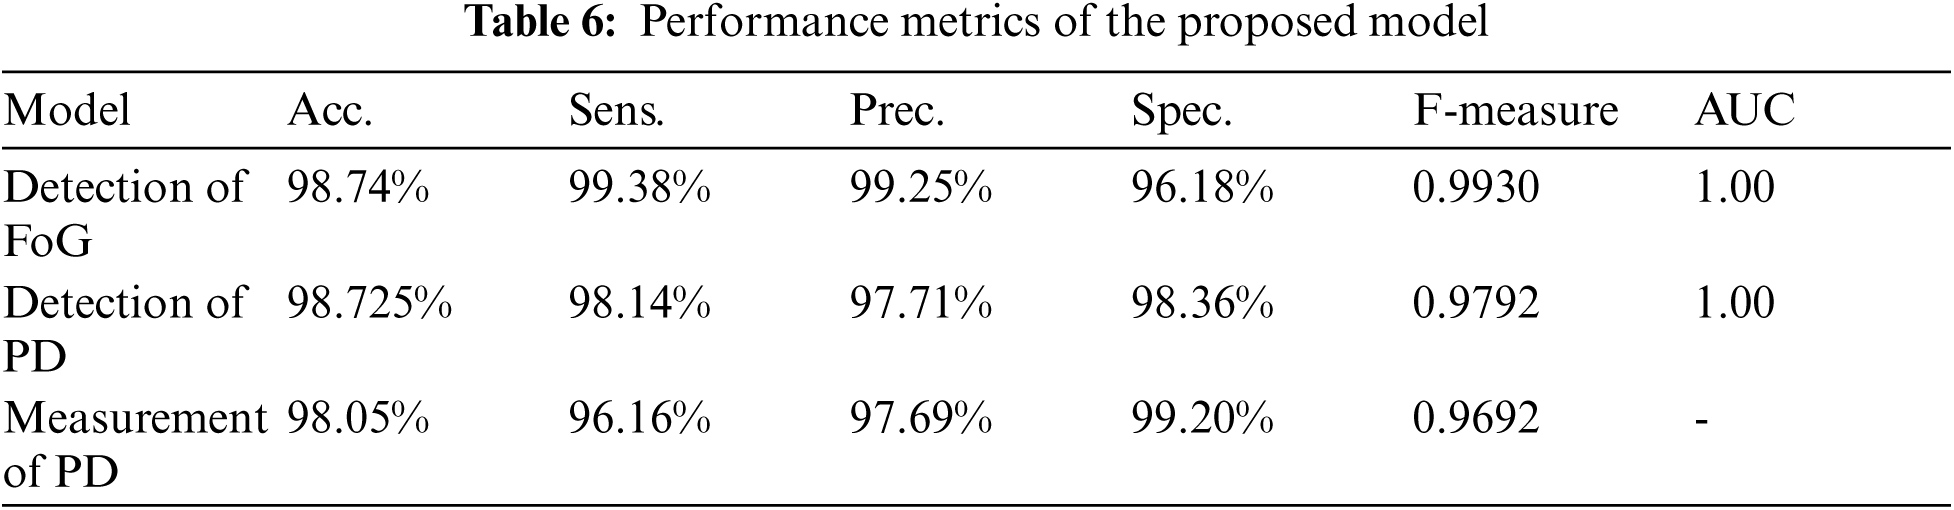
As expected, the validation accuracy and the training accuracy increase with the number of epochs, but after some epochs, the validation accuracy dips significantly and the validation loss starts to increase as the model starts to over-fit on the training data. The optimum result was obtained with 14 epochs where it resulted in a high validation and training accuracy and low validation and training loss as shown in Fig. 3. As per Fig. 3, it is evident that there is no overfitting in the model either. The validation accuracy was found to be 98.74% and the training accuracy as 98.17% with validation sensitivity of 98.38%, validation precision of 99.25% and F-measure of 0.9930. These results are shown in Tab. 6.
6.2 Detection of PD and its Measurement
The validation accuracy and the training accuracy increase along with the number of epochs, but after some epochs, the validation acc. dips significantly and the validation loss starts to increase as the model starts to over-fit on the training data. The optimum result was obtained with 14 epochs where it resulted in a high validation and training accuracy and low validation and training loss as shown in Fig. 4 and Fig. 5. As per Fig. 4 and Fig. 5, it is evident that there is no overfitting in the model either. For detection of Parkinson's disease, the validation accuracy was found to be 98.725% with sensitivity of 98.14%, precision of 97.71% and F-measure of 0.9792. For the prediction of UPDR scale, the validation accuracy was found to be 98.05% with sensitivity of 96.16%, precision of 97.69% and F-measure of 0.9692. (Weighted Average). These results are shown in Tab. 6.

Figure 4: Curves of all performance metrics for detection of PD dataset (a) Validation Accuracy vs. epochs (b) Validation Loss vs. epochs (c) AUC Characteristics

Figure 5: Curves of all performance metrics for measurement of intensity of PD dataset (a) Validation Accuracy vs. epochs (b) Validation Loss vs. epochs
From the Tab. 6, it can be said that, the attention based deep learning model, that was meant to detect Freezing of Gait events, also performed well on not only detecting Parkinson's disease also be able to classify it according to the UPDRS scale.
6.3 Robustness Analysis of the Proposed Model
In order to quantify the robustness of the proposed model, a separate set of experiment was also conducted. In this experiment, some Additive White Gaussian Noise (AWGN) was randomly added to the test dataset such that the SNR remained 20, 25, 33 and 50 respectively. When this augmented test data is fed to the model, the performance metrics values recorded in these cases are observed to be very consistent to the model's performance on the original test dataset.
The following Tab. 7 and Tab. 8 above, show the value of the performance metrics obtained for noisy test datasets of both FoG detection as well as detection of PD datasets respectively. The consistency in performance of the proposed model under noisy test data scenario is highly evident from these tables above. This analysis strongly supports the real world application of this attention based deep learning model for the selected problem of gait signals based PD detection. This consistency in performance metric values can also be observed graphically from the value plots shown in Fig. 6a and b for both the selected datasets respectively. As the SNR goes above 20, the performance metric values become highly stable at their peak positions.
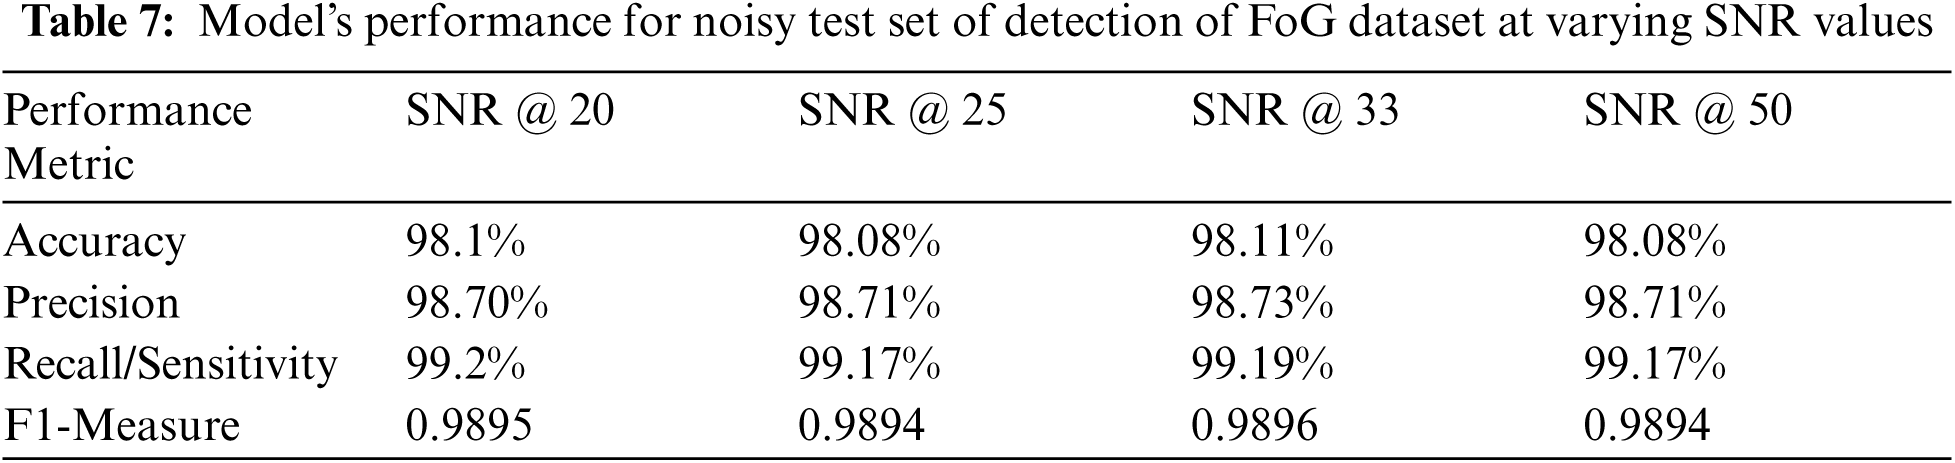
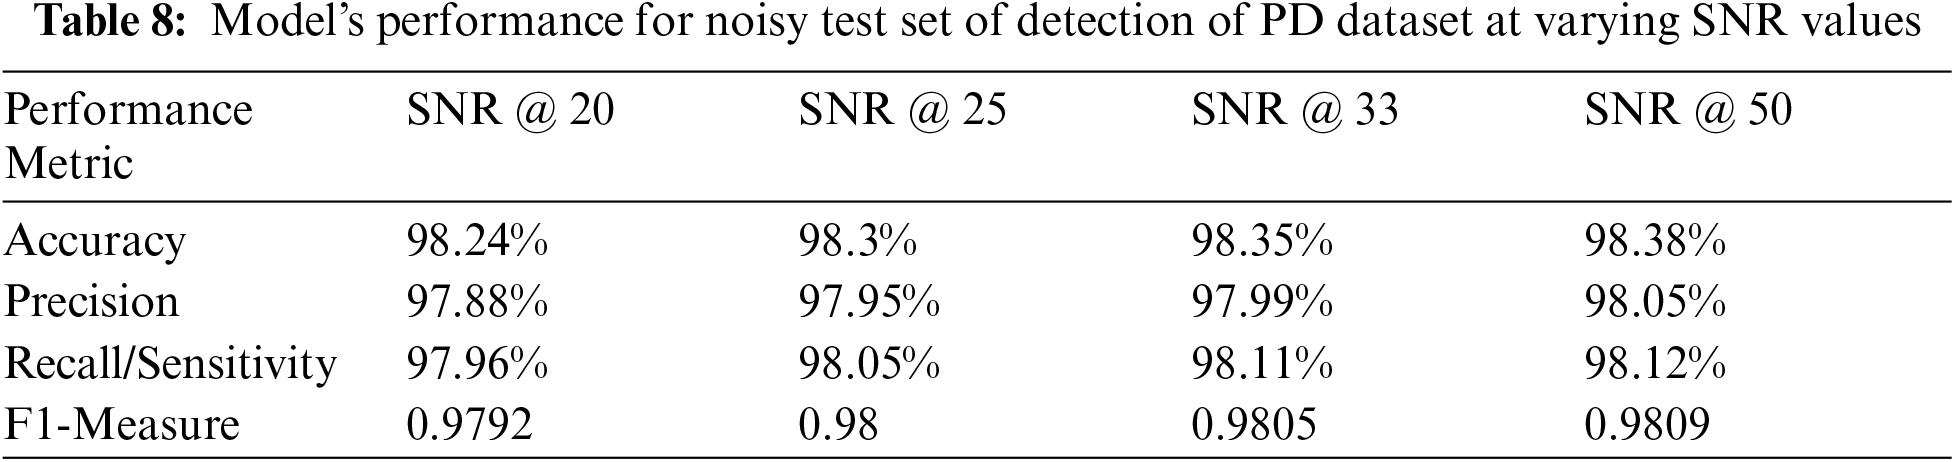

Figure 6: Plot of various performance metrics value for varying SNR instances over (a) FoG and (b) PD detection datasets. (a) Detection of Freezing of Gait (b) Detection of PD
Non-invasive techniques in the detection of neurodegenerative diseases are currently an important research area. The initial stage diagnosis can help significantly in saving lives. In this paper, the use of a DL model approach was proposed for one such neurodegenerative disease known as Parkinson's disease. The proposed attention mechanism deep learning model achieved higher values of all performance metrics and hence shall considerably enhance the existing performance of systems for FoG, PD detection purposes.
As per the performance metrics values obtained from the proposed model against various models, a significant improvement in terms of accuracy and precision of the predictions was observed. The use of attention mechanism in time series analysis has proven to be quite useful for the given problem of detecting FoG and PD from gait patterns. Implementation of such attention mechanisms in other time series analysis problems must be explored further where a certain segment of the signal determines the given output. One such example is done in the analysis of ECG, where a certain pattern in ECG signal determines the disease afflicted to the person. Also, the size of the dataset plays a key role in supervising the learning ability of any deep learning-based model. For the present problem, the dataset provided by Daphnet [40] consisted of data from 23 patients while the one provided by Physionet [56] consisted of data from 93 patients. Hence, it is also important to work in the field of dataset generation, so that future models can be further validated on larger amounts of data. Due to small size datasets, the volume of data may prove inadequate to prepare a model with considerable generalization capabilities to accurately predict the subjects of concern.
Funding Statement: This work has been funded by the Faculty Research Grants, Augustana College, Rock Island Illinois, USA, Initials of the Author: TKM, website: https://www.augustana.edu/about-us/offices/academic-affairs/scholarship-grants.
Conflicts of Interest: The authors declare that they have no conflicts of interest to report regarding the present study.
1. T. Bocklet, E. Noth, G. Stemmer, H. Ruzickova and J. Rusz, “Detection of persons with Parkinson's disease by acoustic, vocal, and prosodic analysis,” in 2011 IEEE Workshop on Automatic Speech Recognition & Understanding, Waikoloa, HI, USA, pp. 478–483, 2011. [Google Scholar]
2. C. Lücking, A. Dürr, V. Bonifati, J. Vaughan, G. De Michele et al., “Association between early-onset Parkinson's disease and mutations in the parkinGene,” New England Journal of Medicine, vol. 342, no. 21, pp. 1560–1567, 2000. [Google Scholar]
3. J. Nonnekes, A. Snijders, J. Nutt, G. Deuschl, N. Giladi et al., “Freezing of gait: A practical approach to management,” Tshe Lancet Neurology, vol. 14, no. 7, pp. 768–778, 2015. [Google Scholar]
4. G. Cascarano, C. Loconsole, A. Brunetti, A. Lattarulo, D. Buongirorni et al., “Biometric handwriting analysis to support Parkinson's disease assessment and grading,” BMC Medical Informatics and Decision Making, vol. 19, no. 9, pp. 252–252, 2019. [Google Scholar]
5. B. Eskofier, S. I. Lee, J. Daneault, F. N. Golabchi, G. Ferreira-Carvalho et al., “Recent machine learning advancements in sensor-based mobility analysis: deep learning for Parkinson's disease assessment,” in 2016 38th Annual Int. Conf. of the IEEE Engineering in Medicine and Biology Society (EMBC), Florida, USA, pp. 655–658, 2016. [Google Scholar]
6. M. Moetesum, I. Siddiqi, N. Vincent and F. Cloppet, “Assessing visual attributes of handwriting for prediction of neurological disorders—a case study on Parkinson's disease,” Pattern Recognition Letters, vol. 121, pp. 19–27, 2019. [Google Scholar]
7. A. Caliskan, H. Badem, A. Baştürk and M. Yüksel, “Diagnosis of the Parkinson disease by using deep neural network classifier,” Istanbul University-Journal of Electrical and Electronics Engineering, vol. 172, pp. 3311–3318, 2017. [Google Scholar]
8. C. Pereira, D. R. Pereira, G. H. Rosa, V. H. C. Albuquerque, S. A. T. Weber et al., “Handwritten dynamics assessment through convolutional neural networks: An application to Parkinson's disease identification,” Artificial Intelligence in Medicine, vol. 87, pp. 67–77, 2018. [Google Scholar]
9. Y. Zhang, “Can a smartphone diagnose Parkinson disease? a deep neural network method and telediagnosis system implementation,” Parkinson's Disease, vol. 2017, pp. 1–11, 2017. [Google Scholar]
10. C. Pereira, S. Weber, C. Hook, G. Rosa and J. Papa, “Deep learning-aided Parkinson's disease diagnosis from handwritten dynamics,” in 2016 29th SIBGRAPI Conf. on Graphics, Patterns and Images (SIBGRAPI), Sao Paulo, pp. 340–346, 2016. [Google Scholar]
11. C. Pereira, D. Pereira, J. Papa, G. Rosa and X. Yang, “Convolutional neural networks applied for Parkinson's disease identification,” Lecture Notes in Computer Science, vol. 9605, pp. 377–390, 2016. [Google Scholar]
12. S. Grover, S. Bhartia, Akshama, A. Yadav and K. R. Seeja, “Predicting severity of Parkinson's disease using deep learning,” Procedia Computer Science, vol. 132, pp. 1788–1794, 2018. [Google Scholar]
13. A. Nieuwboer and N. Giladi, “Characterizing freezing of gait in Parkinson's disease: Models of an episodic phenomenon,” Movement Disorders, vol. 28, no. 11, pp. 1509–1519, 2013. [Google Scholar]
14. B. Post, M. Merkus, R. de Haan and J. Speelman, “Prognostic factors for the progression of Parkinson's disease: A systematic review,” Movement Disorders, vol. 22, no. 13, pp. 1839–1851, 2007. [Google Scholar]
15. B. Bloem, J. Hausdorff, J. Visser and N. Giladi, “Falls and freezing of gait in Parkinson's disease: A review of two interconnected, episodic phenomena,” Movement Disorders, vol. 19, no. 8, pp. 871–884, 2004. [Google Scholar]
16. C. Jenkinson, V. Peto, R. Fitzpatrick, R. Greenhall and N. Hyman, “Self-reported functioning and well-being in patients with Parkinson's disease: Comparison of the short-form health survey (SF-36) and the Parkinson's disease questionnaire (PDQ-39),” Age and Ageing, vol. 24, no. 6, pp. 505–509, 1995. [Google Scholar]
17. N. Giladi, H. Shabtai, E. Simon, S. Biran, J. Tal et al., “Construction of freezing of gait questionnaire for patients with parkinsonism,” Parkinsonism & Related Disorders, vol. 6, no. 3, pp. 165–170, 2000. [Google Scholar]
18. C. Jenkinson, C. Clarke, R. Gray, P. Hewitson, N. Ives et al., “Comparing results from long and short form versions of the Parkinson's disease questionnaire in a longitudinal study,” Parkinsonism & Related Disorders, vol. 21, no. 11, pp. 1312–1316, 2015. [Google Scholar]
19. A. Rizos, P. Martiner-Martin, S. Pal, C. Carroll, D. Martino et al., “The first Parkinson's disease pain questionnaire (King's PD pain quest) – an interim analysis of a multicentre study of the patient's perspective,” Parkinsonism & Related Disorders, vol. 22, pp. e41, 2016. [Google Scholar]
20. J. Schaafsma, Y. Balash, T. Gurevich, A. Bartels, J. Hausdorff et al., “Characterization of freezing of gait subtypes and the response of each to levodopa in Parkinson's disease,” European Journal of Neurology, vol. 10, no. 4, pp. 391–398, 2003. [Google Scholar]
21. N. Giladi, T. Treves, E. Simon, H. Shabtai, Y. Orlov et al., “Freezing of gait in patients with advanced Parkinson's disease,” Journal of Neural Transmission, vol. 108, no. 1, pp. 53–61, 2001. [Google Scholar]
22. R. McCarney, J. Warner, S. Iliffe, R. van Haselen, M. Griffin et al., “The hawthorne effect: A randomised, controlled trial,” BMC Medical Research Methodology, vol. 7, no. 1, pp. 30–30, 2007. [Google Scholar]
23. A. Nieuwboer, L. Rochester, T. Herman, W. Vandenberghe, G. Emil et al., “Reliability of the new freezing of gait questionnaire: Agreement between patients with Parkinson's disease and their carers,” Gait & Posture, vol. 30, no. 4, pp. 459–463, 2009. [Google Scholar]
24. W. Maetzler, J. Domingos, K. Srulijes, J. Ferreira and B. Bloem, “Quantitative wearable sensors for objective assessment of Parkinson's disease,” Movement Disorders, vol. 28, no. 12, pp. 1628–1637, 2013. [Google Scholar]
25. C. Pasluosta, H. Gassner, J. Winkler, J. Klucken and B. Eskofier, “An emerging era in the management of Parkinson's disease: Wearable technologies and the internet of things,” IEEE Journal of Biomedical and Health Informatics, vol. 19, no. 6, pp. 1873–1881, 2015. [Google Scholar]
26. C. Pérez-López, A. Samà, D. Rodríguez-Martín, A. Català, J. Cabestany et al., “Assessing motor fluctuations in Parkinson's disease patients based on a single inertial sensor,” Sensors, vol. 16, no. 12, pp. 2132, 2016. [Google Scholar]
27. S. Mazilu, U. Blanke, A. Calatroni, E. Gazit, J. Hausdorff et al., “The role of wrist-mounted inertial sensors in detecting gait freeze episodes in Parkinson's disease,” Pervasive and Mobile Computing, vol. 33, pp. 1–16, 2016. [Google Scholar]
28. D. Rodríguez-Martín, A. Samà, C. Pérez-López, A. Català, J. M. M. Arostegui et al., “Home detection of freezing of gait using support vector machines through a single waist-worn triaxial accelerometer,” PLoS One, vol. 12, no. 2, pp. e0171764, 2017. [Google Scholar]
29. D. Rodríguez-Martín, C. Pérez-López, A. Samà, A. Català, J. M. M. Arostegui et al., “A waist-worn inertial measurement unit for long-term monitoring of Parkinson's disease patients,” Sensors, vol. 17, no. 4, pp. 827, 2017. [Google Scholar]
30. A. Samà, C. Pérez-López, D. Rodríguez-Martín, A. Català, J. M. M. Arostegui et al., “Estimating bradykinesia severity in Parkinson's disease by analysing gait through a waist-worn sensor,” Computers in Biology and Medicine, vol. 84, pp. 114–123, 2017. [Google Scholar]
31. A. Samà, D. Rodríguez-Martín, C. Pérez-López, A. Català, S. Alcaine et al., “Determining the optimal features in freezing of gait detection through a single waist accelerometer in home environments,” Pattern Recognition Letters, vol. 105, pp. 135–143, 2018. [Google Scholar]
32. M. Bächlin, D. Roggen, M. Plotnik, J. Hausdorff, N. Giladi et al., “Online detection of freezing of gait in Parkinson's disease patients: a performance characterization,” in Proc. of the 4th Int. ICST Conf. on Body Area Networks, Brussels, BEL, Article 11, pp. 1–8, 2009. [Google Scholar]
33. E. Tripoliti, A. T. Tzallas, M. G. Tsipouras, G. Rigas, P. Bougia et al., “Automatic detection of freezing of gait events in patients with Parkinson's disease,” Computer Methods and Programs in Biomedicine, vol. 110, no. 1, pp. 12–26, 2013. [Google Scholar]
34. Y. LeCun, Y. Bengio and G. Hinton, “Deep learning,” Nature, vol. 521, no. 7553, pp. 436–444, 2015. [Google Scholar]
35. K. He, X. Zhang, S. Ren and J. Sun, “Deep residual learning for image recognition,” 2016 IEEE Conference on Computer Vision and Pattern Recognition (CVPR), Las Vegas, NV, USA, pp. 770–778, 2016. [Google Scholar]
36. D. Silver, A. Huang, C. J. Maddison, A. Guez, L. Sifre et al., “Mastering the game of Go with deep neural networks and tree search,” Nature, vol. 529, no. 7587, pp. 484–489, 2016. [Google Scholar]
37. J. Camps, A. Samà, M. Martín, D. Rodríguez-Martín, C. Pérez-López et al., “Deep learning for freezing of gait detection in Parkinson's disease patients in their homes using a waist-worn inertial measurement unit,” Knowledge-Based Systems, vol. 139, pp. 119–131, 2018. [Google Scholar]
38. J. Fish, “Unified Parkinson's disease rating scale,” in Encyclopedia of Clinical Neuropsychology, New York, USA: Springer, pp. 2576–2577, 2011. [Google Scholar]
39. S. Moore, H. MacDougall and W. Ondo, “Ambulatory monitoring of freezing of gait in Parkinson's disease,” Journal of Neuroscience Methods, vol. 167, no. 2, pp. 340–348, 2008. [Google Scholar]
40. M. Bachlin, M. Plotnik, D. Roggen, I. Maidan, J. M. Hausdorff et al., “Wearable assistant for Parkinson's disease patients with the freezing of gait symptom,” IEEE Transactions on Information Technology in Biomedicine, vol. 14, no. 2, pp. 436–446, 2010. [Google Scholar]
41. S. Mazilu, M. Hardegger, Z. Zhu, D. Roggen, G. Tröster et al., “Online detection of freezing of gait with smartphones and machine learning techniques,” in Proc. of the 6th Int. Conf. on Pervasive Computing Technologies for Healthcare, San Diego, CA, USA, pp. 123–130, 2012. [Google Scholar]
42. Y. Zhao, K. Tonn, K. Niazmand, U. M. Fietzek, L. T. D’ Angelo et al., “Online FOG identification in Parkinson's disease with a time-frequency combined algorithm,” in Proc. of 2012 IEEE-EMBS Int. Conf. on Biomedical and Health Informatics, Hong Kong, China, pp. 192–195, 2012. [Google Scholar]
43. S. T. Moore, D. A. Yungher, T. R. Morris, V. Dilda, H. G. MacDougall et al., “Autonomous identification of freezing of gait in Parkinson's disease from lower-body segmental accelerometry,” Journal of NeuroEngineering and Rehabilitation, vol. 10, no. 1, pp. 19, 2013. [Google Scholar]
44. C. Azevedo Coste, B. Sijobert, R. Pissard-Gibollet, M. Pasquier, B. Espiau et al., “Detection of freezing of gait in Parkinson disease: Preliminary results,” Sensors, vol. 14, no. 4, pp. 6819–6827, 2014. [Google Scholar]
45. D. Rodríguez-Martín, A. Samà, C. Pérez-López, A. Català, J. Cabestany et al., “Posture detection based on a waist-worn accelerometer: An application to improve freezing of gait detection in Parkinson's disease patients,” in Recent Advances in Ambient Assisted Living – Bridging Assistive Technologies, e-Health and Personalized Health Care, vol. 20, Amsterdam, Netherlands, pp. 3–17, 2015. [Online]. Availbale: https://ebooks.iospress.nl/publication/42008. [Google Scholar]
46. H. Zach, A. M. Janssen, A. H. Snijders, A. Delval, M. U. Ferraye et al., “Identifying freezing of gait in Parkinson's disease during freezing provoking tasks using waist-mounted accelerometry,” Parkinsonism & Related Disorders, vol. 21, no. 11, pp. 1362–1366, 2015. [Google Scholar]
47. R. San-Segundo, R. Torres-Sánchez, J. Hodgins and F. De la Torre, “Increasing robustness in the detection of freezing of gait in Parkinson's disease,” Electronics, vol. 8, no. 2, pp. 119–119, 2019. [Google Scholar]
48. R. San-Segundo, J. Montero, J. Moreno-Pimentel and J. Pardo, “HMM adaptation for improving a human activity recognition system,” Algorithms, vol. 9, no. 3, pp. 60–60, 2016. [Google Scholar]
49. R. San-Segundo, J. Montero, R. Barra-Chicote, F. Fernández and J. Pardo, “Feature extraction from smartphone inertial signals for human activity segmentation,” Signal Processing, vol. 120, pp. 359–372, 2016. [Google Scholar]
50. R. Nancy Noella, D. Gupta and J. Priyadarshini, “Diagnosis of Parkinson's disease using gait dynamics and images,” Procedia Computer Science, vol. 165, pp. 428–434, 2019. [Google Scholar]
51. K. O'Shea and R. Nash, “An Introduction to Convolutional Neural Networks”, arXiv.org, 2015. [Google Scholar]
52. R. Pascanu, T. Mikolov and Y. Bengio, “On the difficulty of training Recurrent Neural Networks”, arXiv.org, 2012. [Google Scholar]
53. S. Hochreiter and J. Schmidhuber, “Long short-term memory,” Neural Computation, vol. 9, no. 8, pp. 1735–1780, 1997. [Google Scholar]
54. D. Bahdanau, K. Cho and Y. Bengio, “Neural Machine Translation by jointly learning to align and translate”, arXiv.org, 2014. [Google Scholar]
55. N. Mohammadian Rad, T. van Laarhoven, C. Furlanello and E. Marchiori, “Novelty detection using deep normative modeling for IMU-based abnormal movement monitoring in Parkinson's disease and autism spectrum disorders,” Sensors, vol. 18, no. 10, pp. 3533, 2018. [Google Scholar]
56. A. Goldberger, L. A. Amaral, L. Glass, J. M. Hausdorff, P. C. Ivanov et al. “Physiobank, physioToolkit, and physioNet,” Circulation, vol. 101, no. 23, pp. 215–220, 2000. [Google Scholar]
57. M. Baby, A. Saji and C. Kumar, “Parkinsons disease classification using wavelet transform based feature extraction of gait data,” 2017 International Conference on Circuit, Power and Computing Technologies (ICCPCT), Kollam, India, pp. 1–6, 2017. [Google Scholar]
 | This work is licensed under a Creative Commons Attribution 4.0 International License, which permits unrestricted use, distribution, and reproduction in any medium, provided the original work is properly cited. |