DOI:10.32604/cmc.2022.022788
| Computers, Materials & Continua DOI:10.32604/cmc.2022.022788 | |
| Article |
Deep Learning Based Automated Diagnosis of Skin Diseases Using Dermoscopy
1Chitkara University Institute of Engineering and Technology, Chitkara University, Punjab, India
2Department of Systemics, School of Computer Science, University of Petroleum & Energy Studies, Dehradun, Uttrakhand, India
3School of Electronics & Communication, Shri Mata Vaishno Devi University, Katra, 182320, India
4Department of Computer Science, College of Computers and Information Technology, Taif University, Taif, 21944, Saudi Arabia
*Corresponding Author: Deepika Koundal. Email: dkoundal@ddn.upes.ac.in
Received: 18 August 2021; Accepted: 15 October 2021
Abstract: Biomedical image analysis has been exploited considerably by recent technology involvements, carrying about a pattern shift towards ‘automation’ and ‘error free diagnosis’ classification methods with markedly improved accurate diagnosis productivity and cost effectiveness. This paper proposes an automated deep learning model to diagnose skin disease at an early stage by using Dermoscopy images. The proposed model has four convolutional layers, two maxpool layers, one fully connected layer and three dense layers. All the convolutional layers are using the kernel size of 3 * 3 whereas the maxpool layer is using the kernel size of 2 * 2. The dermoscopy images are taken from the HAM10000 dataset. The proposed model is compared with the three different models of ResNet that are ResNet18, ResNet50 and ResNet101. The models are simulated with 32 batch size and Adadelta optimizer. The proposed model has obtained the best accuracy value of 0.96 whereas the ResNet101 model has obtained 0.90, the ResNet50 has obtained 0.89 and the ResNet18 model has obtained value as 0.86. Therefore, features obtained from the proposed model are more capable for improving the classification performance of multiple skin disease classes. This model can be used for early diagnosis of skin disease and can also act as a second opinion tool for dermatologists.
Keywords: Dermoscopy images; CNN; deep learning; classification; optimizer; ResNet; diagnosis; skin disease
Skin is an outer covering that separates the environment and body of human beings. It is the largest organ of the body. It acts as a barrier guarding the body against foreign materials, harmful chemicals, UV radiations etc. The population affected from this skin disease was 15.1 crore in the year 2013 and then increased to 18.8 crore in the year 2015. The two major categories in which the lesion is spotted are malignant and benign classifications. Benign is not dangerous whereas malignant skin lesions can spread to other parts. Research prompts that one-fifth of the population is affected by skin disease, therefore the classification becomes more complex. For classification of skin disease, there are various signs that may be used like color of the lesion, body size distribution of lesion etc. It is very difficult to analyze each lesion individually. The difficulty of classification tasks is increased as the manual feature extraction method is not suitable for classification of lesions. Diagnosis of a skin disease is a difficult task as there exists many types of skin disease [1–4]. Various types of disease may have similar characteristics like some skin diseases are the same in color. There also exists inter and intra class similarities. Therefore, appropriate selection of features is important that will help in proper identification of skin disease. The success of a system depends upon how well it can perform and show results [5,6]. There are many technologies that are used for diagnosis of disease in medical images. Machine Learning (ML) and Deep Learning (DL) is an area of Artificial Intelligence (AI) which deals with the techniques that allow a machine to learn and solve a given problem. ML basically teaches computers to perform tasks that humans can naturally perform. Whereas, DL learns different features directly from the given data. The “deep” in deep learning comes from the use of multiple layers in the network. DL techniques are capable of handling data with high dimensionality and give better performance. It is efficient in focusing on the right features of the image on its own. However, machine learning is less accurate to work with large amounts of dataset for prediction purposes. Therefore, deep learning proves to be more efficient as compared to ML techniques as deep learning techniques are able to work with large databases and with more accuracy [7]. From the last few years, improvements in deep learning Convolutional Neural Networks (CNN) have shown favorable results and also became a challenging research domain for classification in medical image processing [8]. Meng et al. [9] had performed feature classification and automatic recognition in a non-invasive way. Authors had used polarized-light dermoscopy image technology. The data was collected from the hospital and a total of 642 images were used for evaluation of the model. The average classification accuracy achieved was 93.65%. Garnavi et al. [10] had presented a novel CAD system for diagnosis of melanoma. The proposed diagnostic system is applied on a set of 289 dermoscopy images. The system achieves an accuracy of 91.26% and area under curve value of 0.937. Mahmoud et al. [11] had used a total of 448 images and had achieved an accuracy of 51.1% and 75.6% with wavelet and curvelet transforms respectively. They had used wavelet and curvelet transforms. Barata et al. [12] had used a total of 176 dermoscopy images for classification of disease. They had used kNN and SVM classifiers and had achieved sensitivity of 96%, specificity of 80% for global methods and for local methods it had achieved specificity of 75%. Fassihi et al. [13] had used morphologic operators and wavelet transforms and had achieved an accuracy of 90%. They had used a total of 91 images taken from hospitals and websites. Xie et al. [14] had designed a new classifier and used two datasets. First dataset was xanthous race dataset which consists of 240 dermoscopy images and second dataset was caucasian race dataset which includes 360 dermoscopy images. They had achieved sensitivity of 95%, specificity of 93.75%, accuracy of 94.17% on xanthous race dataset and sensitivity of 83.33%, specificity of 95%, accuracy of 91.11% on caucasian race dataset. Breneman et al. [15] had used the Otsu method for segmentation and morphological operators. After that, they had ported the algorithm to a mobile platform for segmenting the lesion from the background in the live images. Smaoui et al. [16] had done pre-processing followed by a segmentation process in which region growing was used. After that feature extraction was done followed by ABCD rule. A set of 40 dermoscopic images was used. It had attained values, accuracy as 92%, sensitivity as 88.88% and specificity as 92.3%. Garnavi et al. [17] had presented a clustering-based histogram thresholding algorithm for segmentation. By using the algorithm, morphological operators are utilized to obtain the segmented lesion. The algorithm was tested on 30 high resolution dermoscopy images. It had achieved an accuracy of 97%. Lu et al. [18] had proposed a novel method, for the purpose of segmentation of the melanocytes. The dataset consists of 28 different histopathological images of skin tissue. It showed a sensitivity rate of 80% and positive prediction rate of 70%. Amin et al. [19] performed pre-processing to resize the images and used Otsu algorithm to segment the skin lesion. The publicly available datasets were combined to form a large dataset for the validation of the proposed method. The obtained results show sensitivity as 99.52%, specificity as 98.41%, positive predictive value as 98.59%, false negative rate as 0.0158 and accuracy as 99.00%. Codella et al. [20] combined latest ML techniques with deep residual networks and CNN for segmentation of dermoscopy images in order to resolve the skin disease classification issue. They worked on the dataset consisting of 900 dermoscopic images. A system was presented that includes the latest developments in DL combined with ML techniques. Also, examining the detected area of disease for detection of melanoma. It had achieved accuracy of 76%, specificity of 62% and sensitivity of 82%. Mahbod et al. [21] investigated image down-sampling and cropping of skin lesions and a three-level fusion approach. From the ISIC archive and HAM10000 dataset 12,927 images were extracted. It had achieved an accuracy of 86.2%. Koohbanani et al. [22] proposed a method by including transfer learning algorithms. The proposed method was encouraged by the UNet architecture. It consists of a validation set with 100 images and a test set of 1000 images extracted from ISIC 2018. Hekler et al. [23] examined the effects of label noise by training and evaluating CNN with 804 images. The dataset consists of 804 images taken from HAM10000 and ISIC archive. For dermatology the achieved accuracy was 75.03% and for biopsy accuracy was 73.80%. Dorj et al. [24] mainly focused on classification of skin cancer using SVM and CNN. They had used a pre-trained AlexNet model for extracting features. It consists of a set of 3753 images. The values of achieved average accuracy for actinic keratosis was 92.3%, basal cell carcinoma was 91.8%, squamous cell carcinoma was 95.1%, melanoma was 94.2%. Zafar et al. [25–28] proposed a method by combining two architectures called Res-Unet. The dataset used was taken from the PH2 dataset with 200 dermoscopic images and ISIC-17 test data consisting of a total of 600 images. On the ISIC-17 dataset the value of Jaccard index was 77.2% and Dice coefficient was 0.858. Whereas on the PH2 dataset, the value of Jaccard index was 85.4% and Dice coefficient was 0.924. Also, authors had used different datasets and different techniques for detection of skin disease. In 2020, Masni et al. [29] had used a total of 2750 images from ISIC 2016, 2017 and 2018 dataset. They had worked only on three classes such as NV, MEL and AKIEC. They had worked on four pre-trained models such as Inception-v3, ResNet-50, Inception-ResNet-v2 and DenseNet201 and had achieved an accuracy of 81.29%, 81.57%, 81.34% and 73.44% respectively. Huang et al. [30] had developed a convolution neural network and had achieved an accuracy of 85.8% and More et al. [31] had achieved an accuracy of 75.03% on HAM10000 dataset. In this paper, a model is proposed and pre-trained networks are used for detection of skin disease. The last fully connected layer has been dropped out and is replaced with a Softmax layer with weights for the classification purpose. The major contributions of the study are as follows:
1. A new Convolutional Neural Network (CNN) based model has been proposed for the classification of skin disease using dermoscopy images.
2. Proposed model has been compared with three ResNet models i.e., ResNet18, ResNet50 and ResNet101.
3. The data augmentation technique has been applied to increase the dataset and to overcome the imbalance in dataset.
4. The models are simulated using various performance parameters such as precision, sensitivity, specificity, F1 score and accuracy.
5. The proposed model has shown promising results which will act as a second opinion tool for dermatologists.
The remaining paper is structured as follows. Section 2 gives description of materials and methods. Experimental setup and comparison of results are shown in Section 3. Section 4 gives the discussion and conclusion of the study.
In this study, a complete explanation of the proposed methodology is given for skin disease detection and the dataset used for the validation of the proposed model.
For the validation of the proposed method, the dermoscopy images are obtained from the HAM10000 dataset [32]. It contains 10015 skin disease images and its detailed levels are tabulated in Tab. 1. For HAM10000 dataset, Nikon Coolscan 5000 ED was used to digitized the diapositives and files are stored in jpg format. After that scanned images are cropped with lesion in center and histogram corrections are applied manually for contrast enhancement. In this dataset, metadata is provided which includes a set of information about a particular image. It provides information about a particular image belonging to a specific type of skin disease. The images are RGB and all the images are in jpg format. The complete dataset is split into training and testing. For the training purpose, approximately 80% of the data is used and for testing 20% of the data is used.
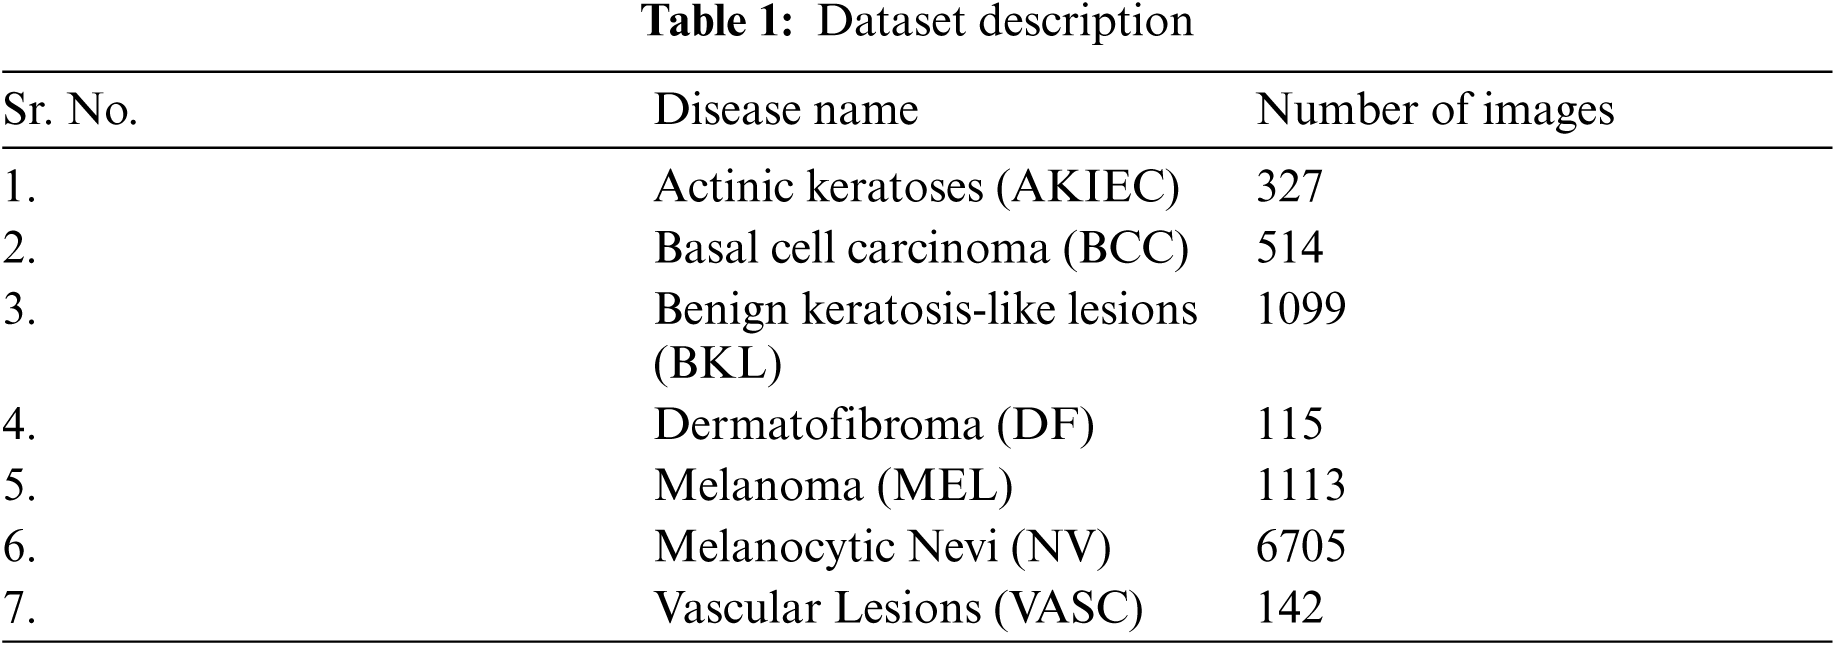
The dataset consists of seven classes: Actinic Keratoses (AKIEC), Benign Keratosis-like Lesions (BKL), Vascular Lesions (VASC), Basal Cell Carcinoma (BCC), Melanocytic Nevi (NV), Dermatofibroma (DF), and Melanoma (MEL). The proposed model classifies skin disease image into seven categories that includes mainly two steps: pre-processing (normalization and augmentation) and classification using pre-trained CNN architectures. The detailed explanation of each stage is given in the subsequent sections.
Normalization of image is used to keep numerical stability to the CNN architectures [33]. Initially, skin disease images are in the RGB format and have been normalized in between the range of 0–1 by multiplying each pixel value with 1/255. While using normalization, a model is expected to learn faster.
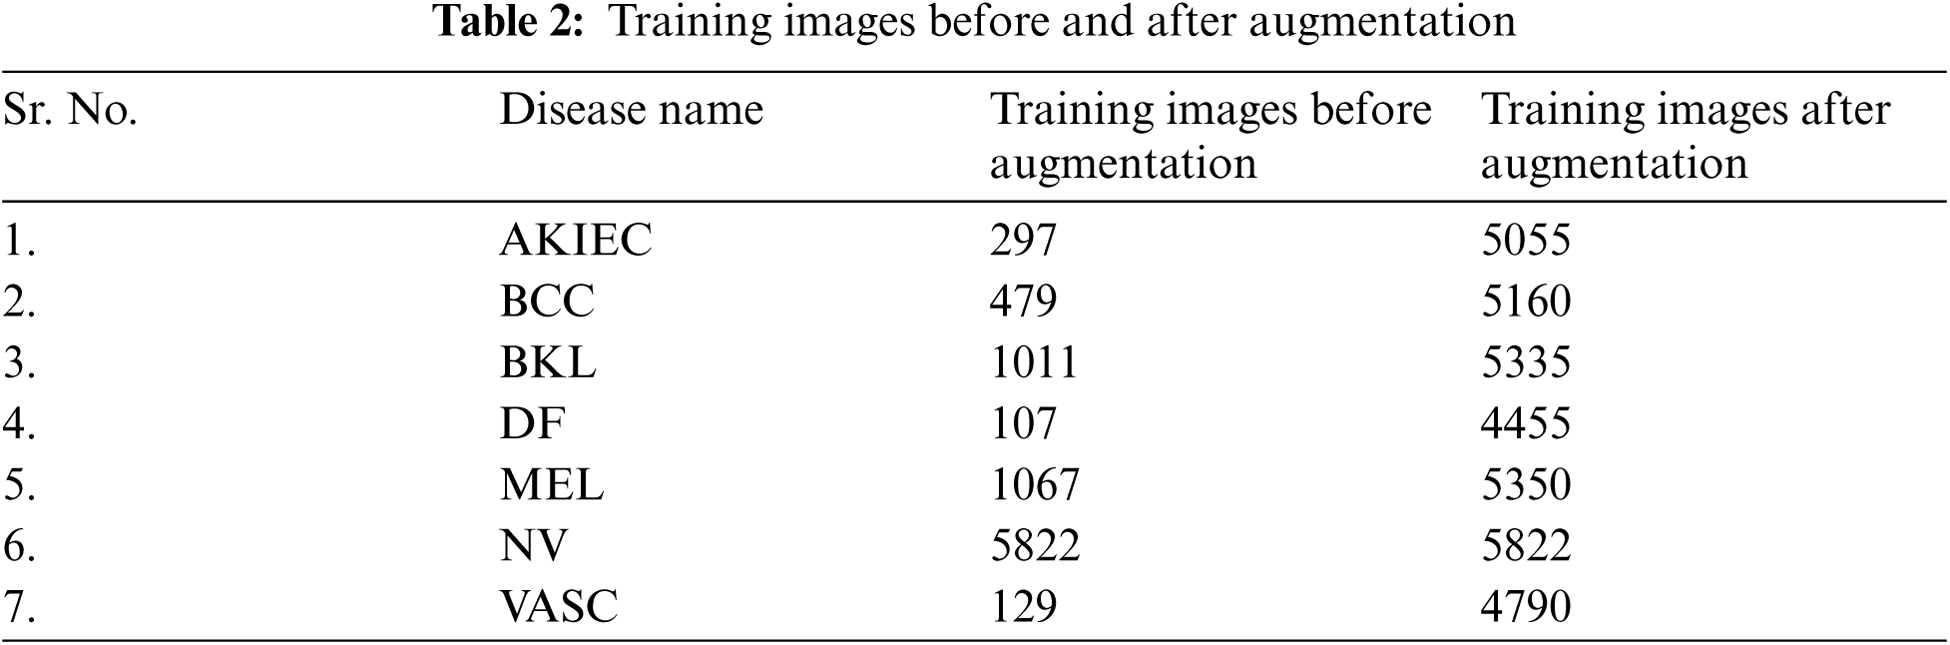
As the available training dermoscopy images in the dataset are 10015 which is very less for training the deep learning model. To resolve this issue, offline data augmentation techniques have been implemented to increase the number of sample images [34]. A major aim is to develop a technique that can function in the presence of noise and variation on a large number of images. The data augmentation on images is done using different transformation techniques like flipping, rotation, zooming etc. Flipping operation is achieved in both horizontally and vertically direction. The number of training images before and after augmentation are shown in Tab. 2. With data augmentation techniques, the number of images increased to approximately 5000 in all the cases as shown in Tab. 2. The AKIEC disease class images increased to 5055, which was earlier having only 297 images.
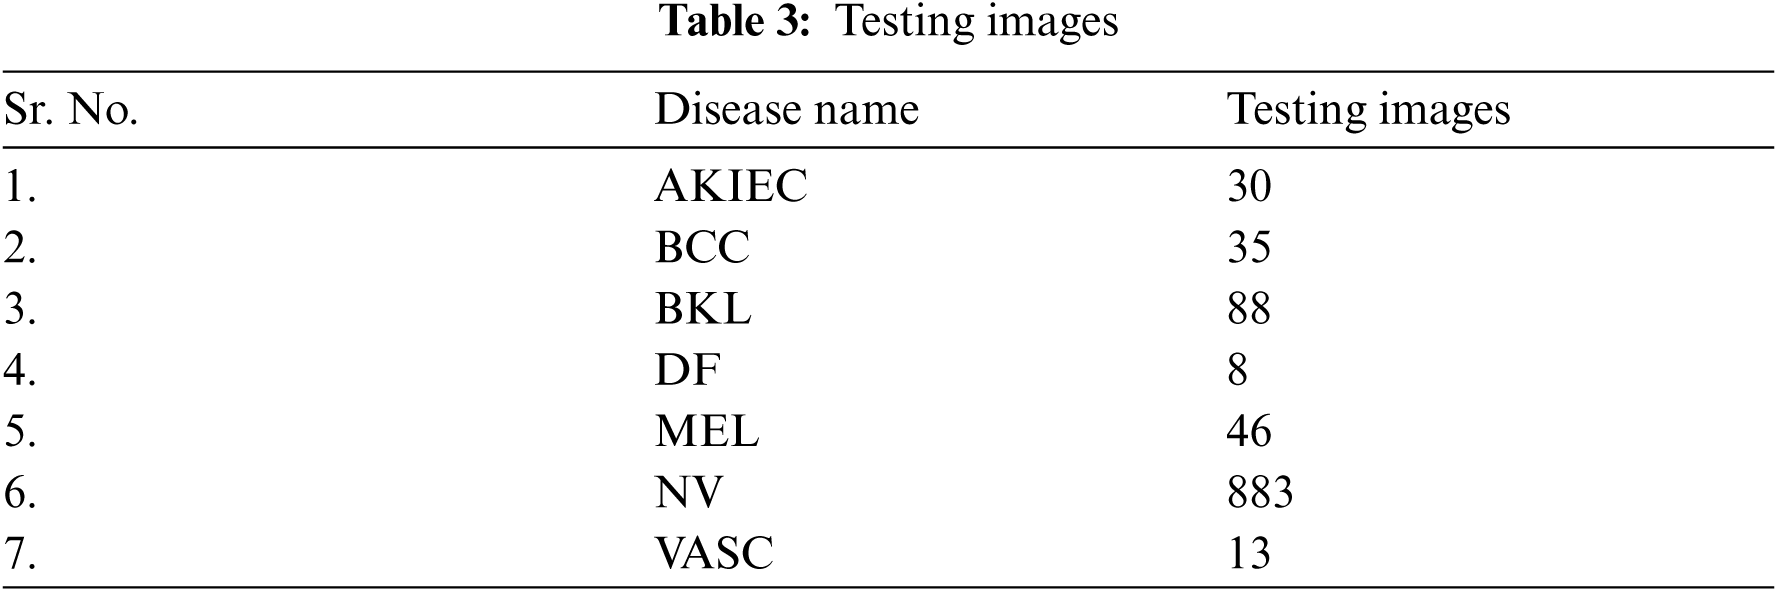
Tab. 3 shows seven classes of skin disease images taken for testing purposes. The testing images for NV were 883, whereas the testing images for VASC were 13.
A model is designed for classification of skin disease in HAM10000 dermoscopy images. Fig. 1 shows the structure of the proposed model. First layer of convolution is applied with 16 filters of size (3 * 3) on (28 * 28) size of images which generates 448 parameters. After that second convolution layer is applied with 32 filters of size (3 * 3) on output shape (26 * 26) which generates 4640 parameters. Then it is forwarded to (2 * 2) sized max pooling layer, that shows output image of size (13 * 13). Again, convolution layer is applied with 32 filters and output shape of (13 * 13) that obtained 9248 parameters. Next convolution layer is applied with 64 filters and obtained output shape of (11 * 11) that obtained 18496 parameters. Max pooling layer is applied with a pool size of (2 * 2) and has obtained output shape of 6 * 6. Flattening layer flattens all the features and then three dense layers are applied for classification of skin disease into seven different categories.
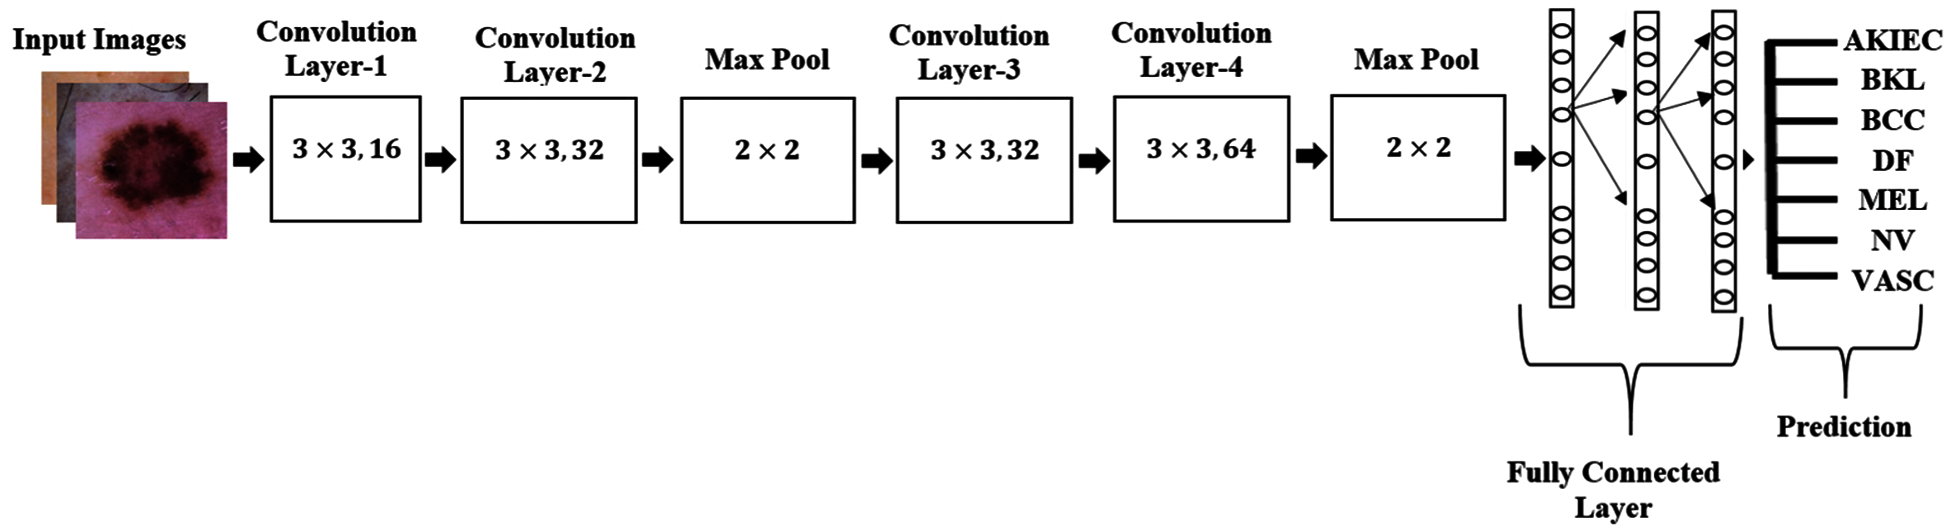
Figure 1: Structure of proposed model
The main part of CNN is the convolutional layer. A convolution is sliding a filter over the input. CNN works by extracting features directly from images. Convolution between an input signal x[n] with a system having impulse response h[n] is shown in Eq. (1)
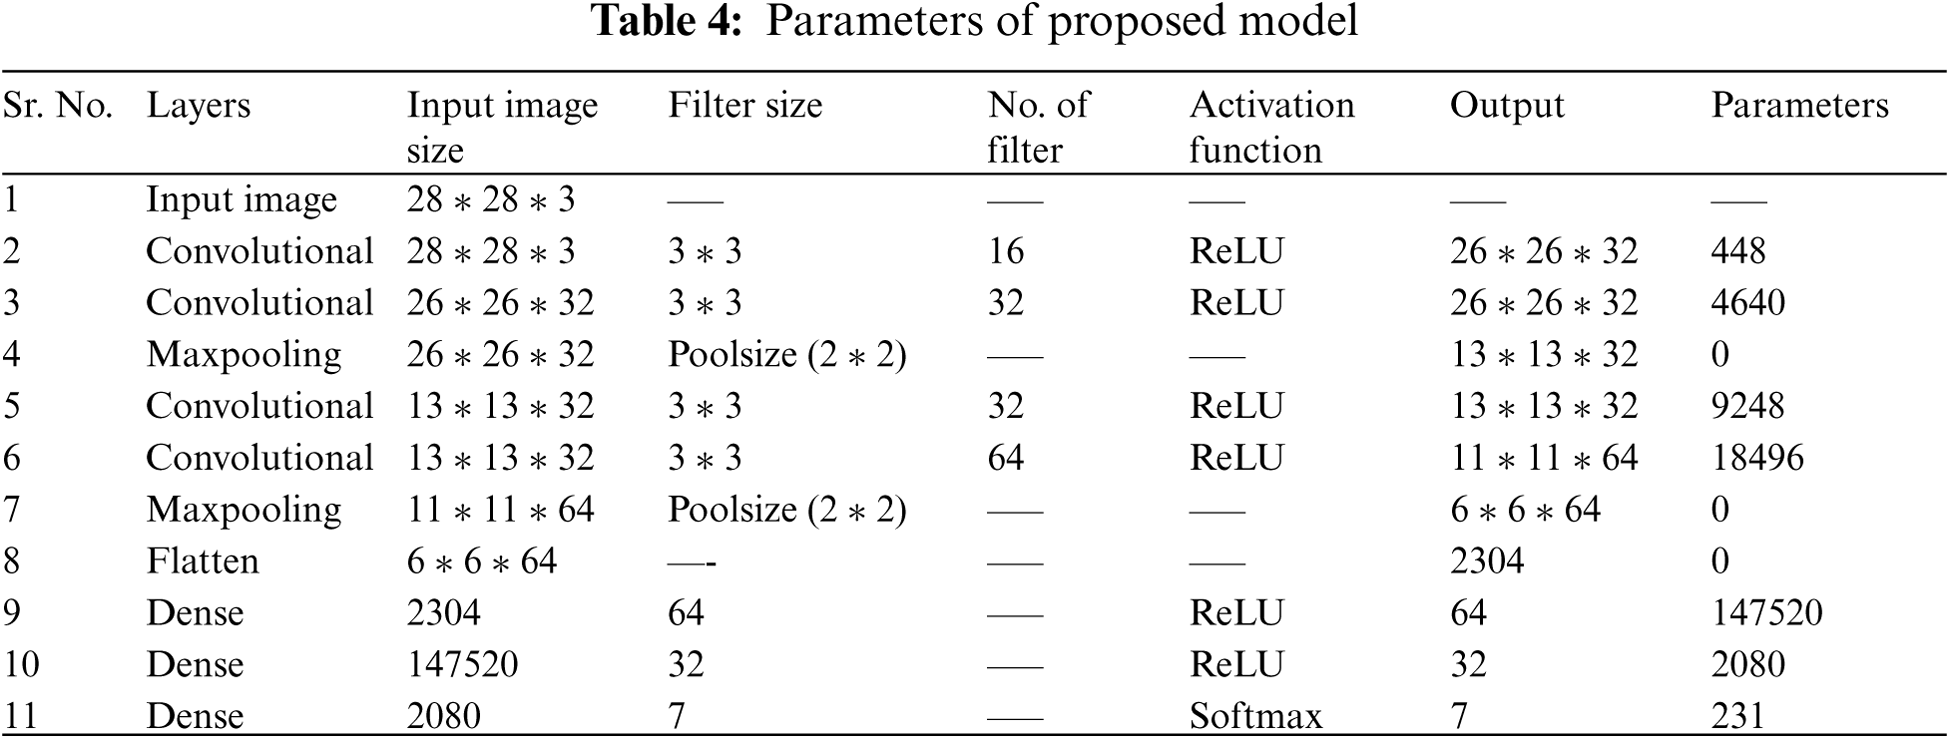
In the pooling layer, the image stack is shrinked into a smaller size. The most common methods for reduction are max pooling and average pooling. Max pooling operates by finding the highest value within the window region and discarding the rest of the values. Average pooling on the other hand uses the mean of the values within the region instead. All the flatten features are input into ANN for further processing. The flattened output is fed to a feed-forward neural network and backpropagation applied to every iteration of training. Over a series of epochs, the model is able to classify using the Softmax Classification technique. Tab. 4 describes the size of filter, number of filters, input image size, output image size and total number of parameters used at each layer for the proposed model.
3 Experimental Setup and Performance Analysis
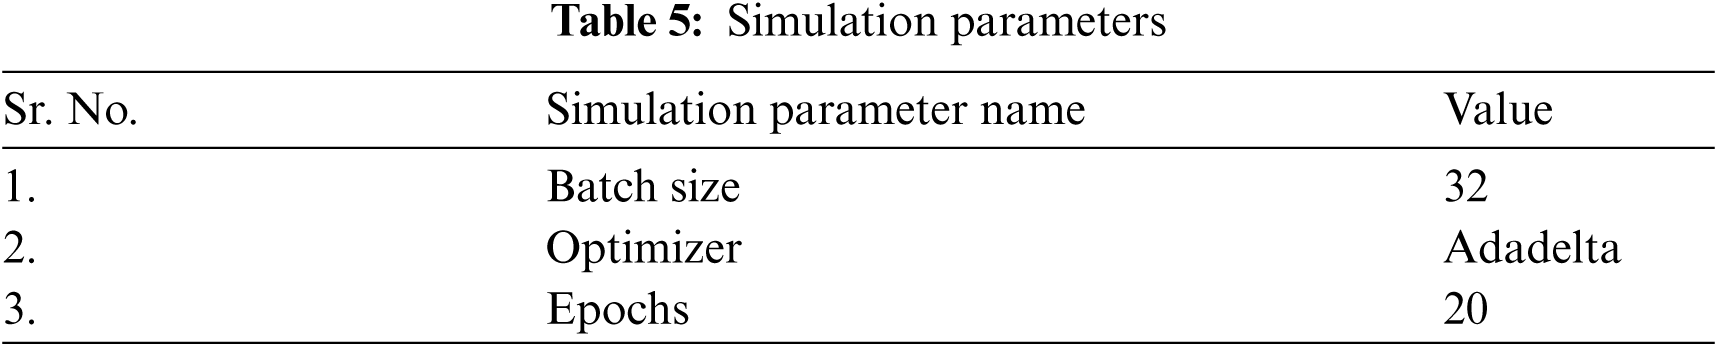
The models are evaluated using dermoscopy images taken from the HAM10000 dataset. The proposed model is compared with all the ResNet models [35,36] i.e., Resnet18, ResNet50 and ResNet101 in terms of precision, sensitivity, accuracy and F1 Score. Adadelta [37] optimizer is used for evaluation of models using 32 batch size. The features obtained from the proposed model are capable of improving the performance of classification for multiple skin disease classes. Batch Size specifies the images that are managed in only one iteration. In this paper, batch size with 32 values is used for evaluation and validation. Epochs is the total number of times; the neural network receives the entire dataset. For seven types of skin disease, the output layer was used with the softmax activation function. Respective values of these simulation parameters selected for the tuning deep neural networks are tabulated in Tab. 5.
The proposed model is evaluated using parameters such as sensitivity, precision, and F1-score. Fig. 2a shows the graph of precision, sensitivity F1 Score and specificity values taken on all the seven classes of the HAM10000 dataset. From the graph it can be seen that the value of sensitivity and F1 Score is approximately 97% in case of NV disease. The value of precision is approximately 90% in case of MEL. The values of sensitivity are nearly 90% in case of disease BCC and DF. The value of precision is higher for MEL disease as compared to other diseases. Fig. 2b shows the confusion matrix of the ResNet18 model. The matrix provides a clear view of correct and incorrect predictions. Each and every column and its corresponding row is labelled by class name. In this study, classes 0, 1, 2, 3, 4, 5 and 6 represent AKIEC, BCC, BKL, DF, NV, VASC and MEL respectively. Diagonal values of matrices represent the accurate number of images classified by the particular model.
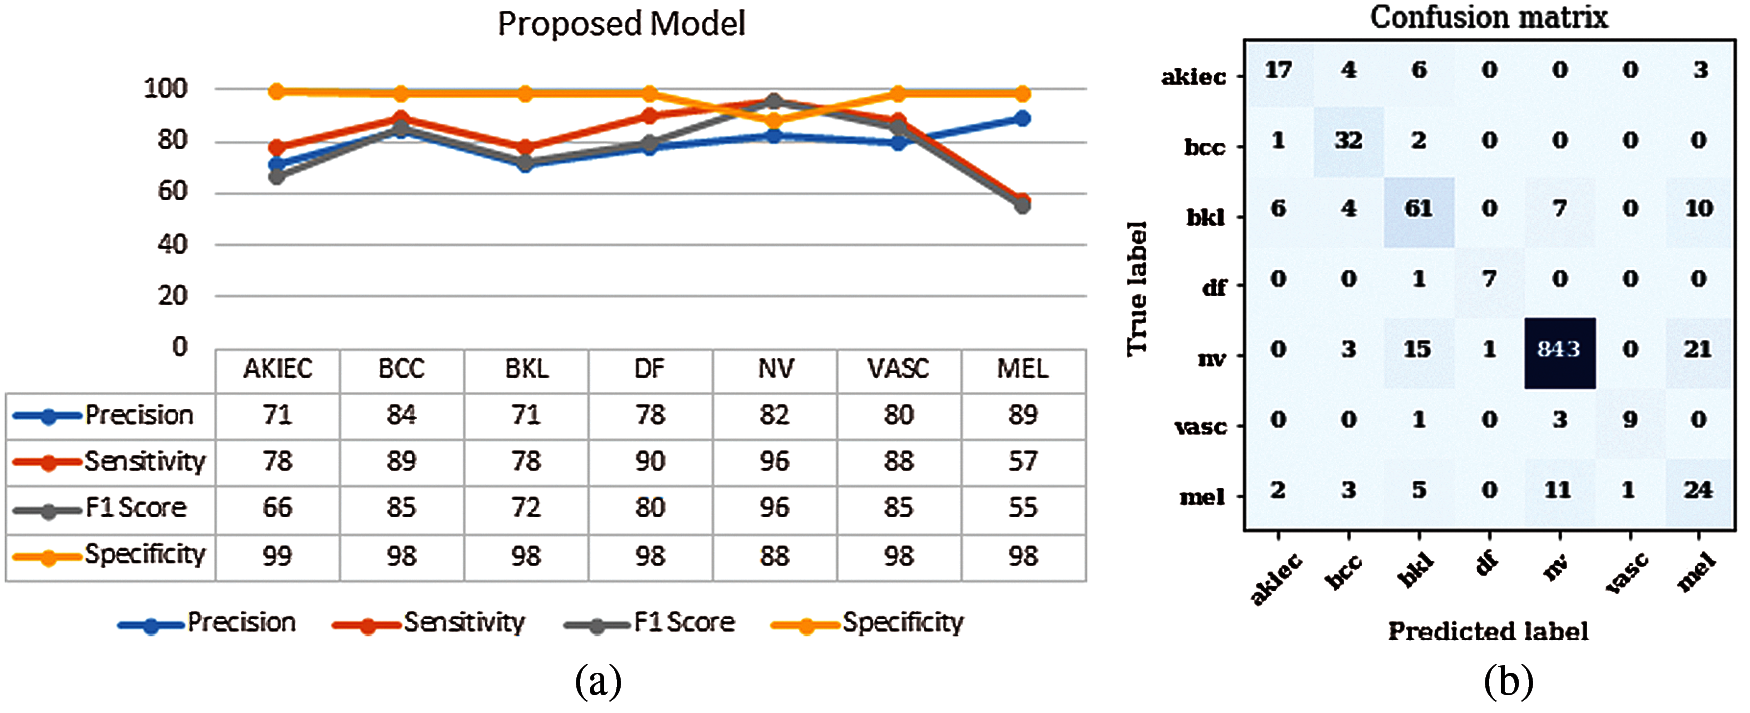
Figure 2: Results of proposed model (a) Performance parameters (b) Confusion Matrix
It is an Artificial Neural Network (ANN) that enables the design of a deep neural network by using shortcuts or skip connections. Fig. 3 shows the structure of ResNet18 [35]. Every ResNet architecture performs convolution and max-pooling using 7 * 7 and 3 * 3 filter sizes respectively. Curved arrows are showing the shortcut connections. Here the solid curves maintain the input feature dimension with the same number of channels as in the previous layer. Moreover, it does not use any stride for convolution. Whereas dotted curve lines double the number of channels and halve the feature map dimension by using stride of 2. It consists of 4 layers having four convolutional blocks each. Layer 1 of the model consists of 4 convolution blocks. The number of channels used to perform the operation is 64 and size of filter is 3 * 3. Layer 2 of the model consists of 4 convolution blocks. The number of channels used to perform the operation is 128 and size of filter is 3 * 3. Layer 3 of the model consists of 4 convolution blocks. The number of channels used to perform the operation is 256 and size of filter is 3 * 3. Layer 4 of the model consists of 4 convolution blocks. The number of channels used to perform the operation is 512 and size of filter is 3 * 3. Layers 2, 3 and 4 are using a convolution stride of 2, due to which it reduces the size of the feature map dimension to its half. The ResNet18 model is evaluated using parameters such as sensitivity, precision, and F1-score. Fig. 4a shows the graph of precision, sensitivity, F1 Score and specificity values taken on all the seven classes of the HAM10000 dataset. From the graph it can be concluded that optimizer Adadelta has shown good results in case of NV and BCC disease with a value of sensitivity approximately 90%. The value of precision is higher for NV disease in comparison to other diseases. Fig. 4b shows the confusion matrix of the ResNet18 model. The matrix provides a clear view of correct and incorrect predictions. Each and every column and its corresponding row is labelled by class name. In this study, classes 0, 1, 2, 3, 4, 5 and 6 represent AKIEC, BCC, BKL, DF, NV, VASC and MEL respectively. Diagonal values of matrices represent the accurate number of images classified by the particular model.
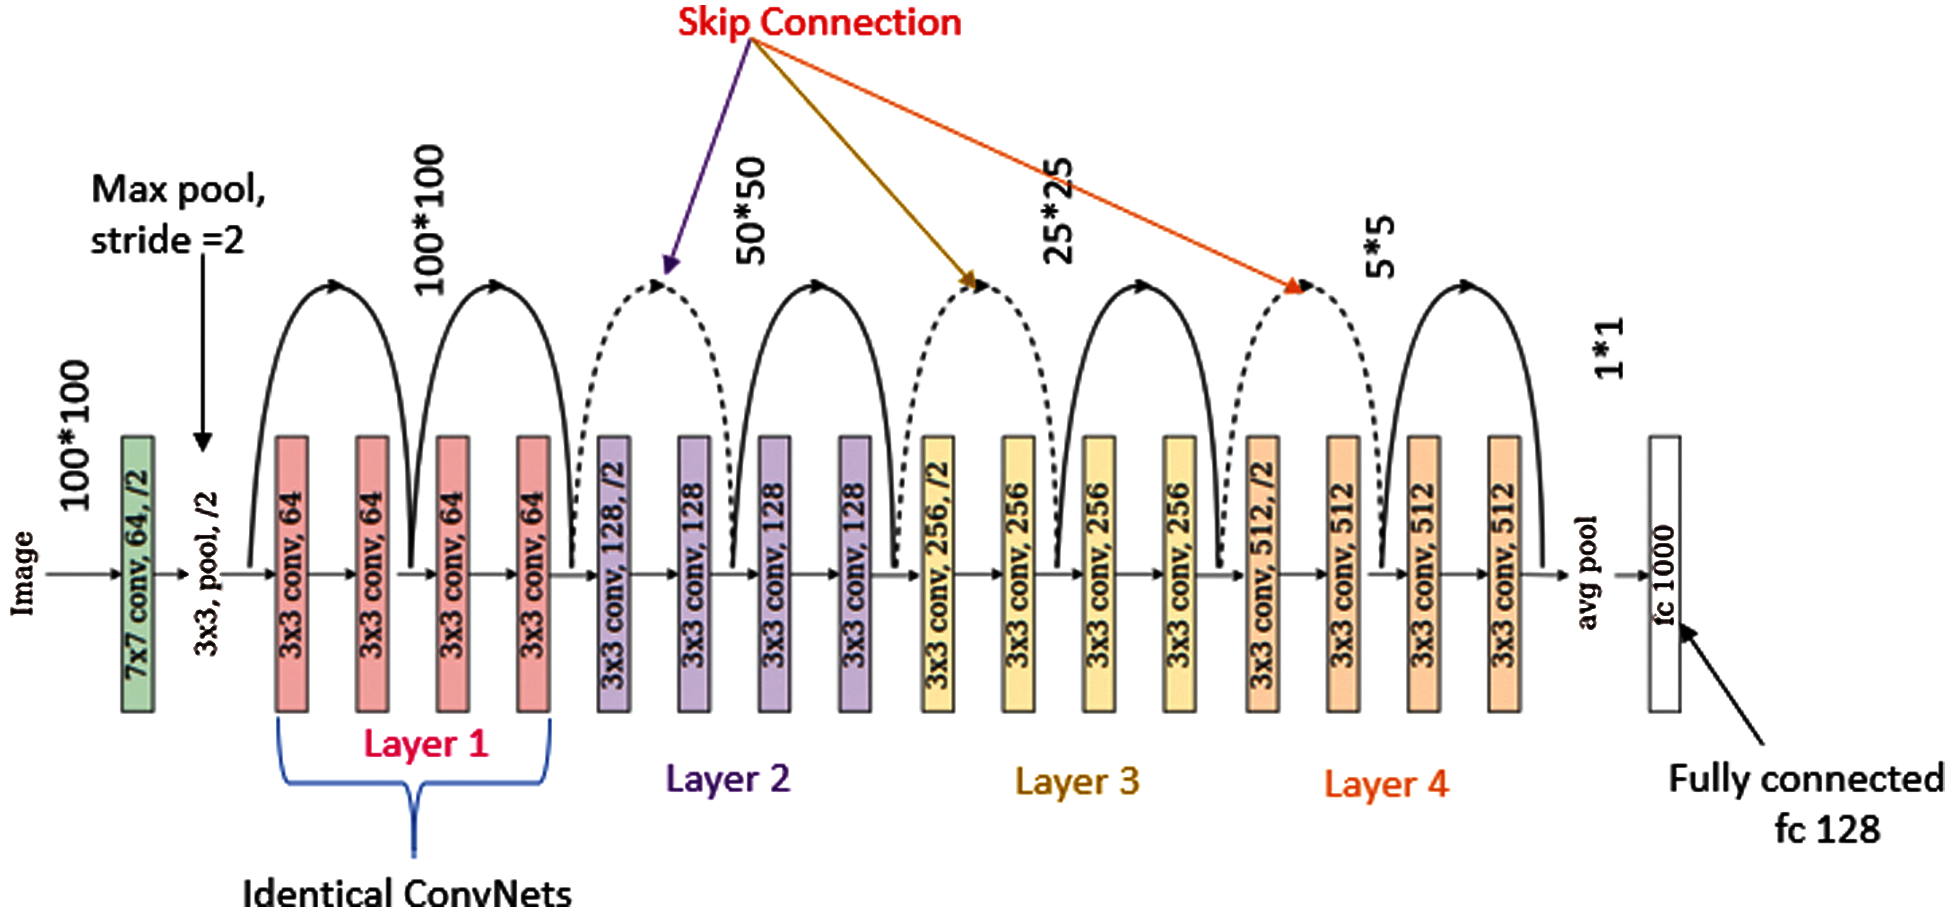
Figure 3: Structure of ResNet18
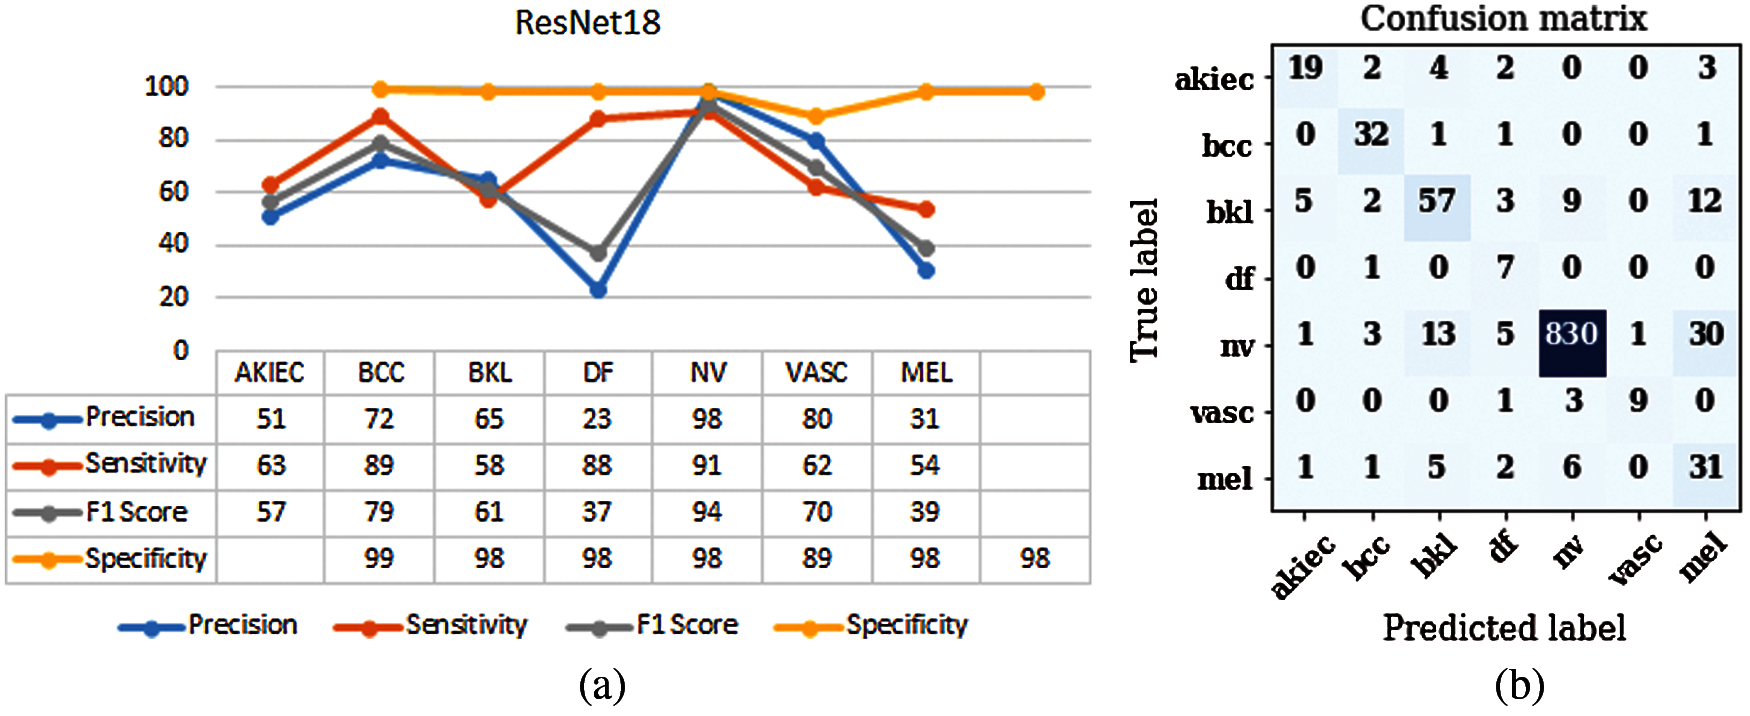
Figure 4: Results of ResNet18 (a) Performance parameters (b) Confusion Matrix
Fig. 5 shows the structure of ResNet50 [38]. Every ResNet architecture performs convolution and max-pooling using 7 * 7 and 3 * 3 filter sizes respectively. This model consists of 4 stages with each stage shown with blue and orange boxes alternatively. Curved arrows are showing the shortcut connections. Here the solid curves maintain the input feature dimension with the same number of channels as in the previous layer. Moreover, it does not use any stride for convolution. Whereas dotted curve lines double the number of channels and halve the feature map dimension by using stride of 2. Stage 1 of the model consists of 1 residual block having 2 stacked convolution layers with filter size of 3 * 3 and 64 channels. The stage 1 block is repeated three times. Stage 2 of the model consists of 2 residual blocks that contain 2 stacked convolution layers each. The second residual block of the second stage is repeated three times. Similarly, the second residual block of the third stage and fourth stage is repeated five times and two times respectively.

Figure 5: Structure of ResNet50
The ResNet50 model is evaluated using parameters such as sensitivity, precision, and F1-score. Fig. 6a shows the graph of precision, sensitivity, F1-score and specificity values taken on all the seven classes of the HAM10000 dataset. From the graph it can be seen that optimizer Adadelta has outperformed on DF disease with value above 98%. Fig. 6b shows the confusion matrix of the ResNet50 model. This model has performed best on Adadelta optimizer with batch size 32. The matrix provides a clear view of correct and incorrect predictions. Each and every column and its corresponding row is labelled by class name. In this study, classes 0, 1, 2, 3, 4, 5 and 6 represent AKIEC, BCC, BKL, DF, NV, VASC and MEL respectively. Diagonal values of matrices represent the accurate number of images classified by the particular model.

Figure 6: Results of ResNet50 (a) Performance parameters (b) Confusion Matrix
Fig. 7 shows the structure of ResNet101 [38]. This model consists of 4 stages with each stage shown with blue and orange boxes alternatively. Curved arrows are showing the shortcut connections. Here the solid curves maintain the input feature dimension with the same number of channels as in the previous layer. Moreover, it does not use any stride for convolution. Whereas dotted curve lines double the number of channels and halve the feature map dimension by using stride of 2. Stage 1 of the model consists of 1 residual block having 2 stacked convolution layers with filter size of 3 * 3 and 64 channels. The stage 1 block is repeated three times. Stage 2 of the model consists of 2 residual blocks that contain 2 stacked convolution layers each. The second residual block of the second stage is repeated three times. Similarly, the second residual block of the third stage and fourth stage is repeated twenty-two times and two times respectively.

Figure 7: Structure of ResNet101
The ResNet101 model is evaluated using parameters like sensitivity, precision, and F1-score. Fig. 8a shows the graph of precision, sensitivity and F1-score values taken on all the seven classes of the HAM10000 dataset. VASC disease has shown values as 89–90% approximately for all the parameters. In case of MEL disease, the values of precision are very less. In case of sensitivity parameter, optimizer Adadelta has outperformed on NV disease with value above 95%. Fig. 8b shows the confusion matrix of the ResNet101 model. The matrix provides a clear view of correct and incorrect predictions. Each and every column and its corresponding row is labelled by class name. In this study, classes 0, 1, 2, 3, 4, 5 and 6 represent AKIEC, BCC, BKL, DF, NV, VASC and MEL respectively. Diagonal values of matrices represent the accurate number of images classified by the particular model.

Figure 8: Results of ResNet101 (a) Performance parameters (b) Confusion Matrix
3.5 Comparison of Proposed Model with Three ResNet Models
The proposed model is evaluated using Adadelta optimizer and 32 batch size. The parameters used for evaluation of the proposed model are precision, sensitivity, F1 score and accuracy. The proposed model is compared with the ResNet model. Fig. 9 shows the comparison of precision values of the proposed model with ResNet18, ResNet50 and ResNet101. Precision refers to the closeness of two or more measurements to each other. Precision is the positive predictive value means the correctly identified cases from all the predicted cases. From Fig. 9 it can be seen that the proposed model is showing best results for each and every skin disease. It is showing 89% precision value in case of MEL whereas 84% in case of BCC. So, the overall proposed model is showing outperforming results for precision.

Figure 9: Precision of proposed model and all ResNet models
Fig. 10 shows the comparison of sensitivity values of the proposed model with the ResNet18, ResNet50 and ResNet101 model. Sensitivity is the true positive rate and it is the proportion of actual positives that are identified correctly. A good sensitivity value is approximately 90%. It is analyzed from the figure that the best value of sensitivity is 96% for NV disease whereas in case of DF disease value of sensitivity is 90%.
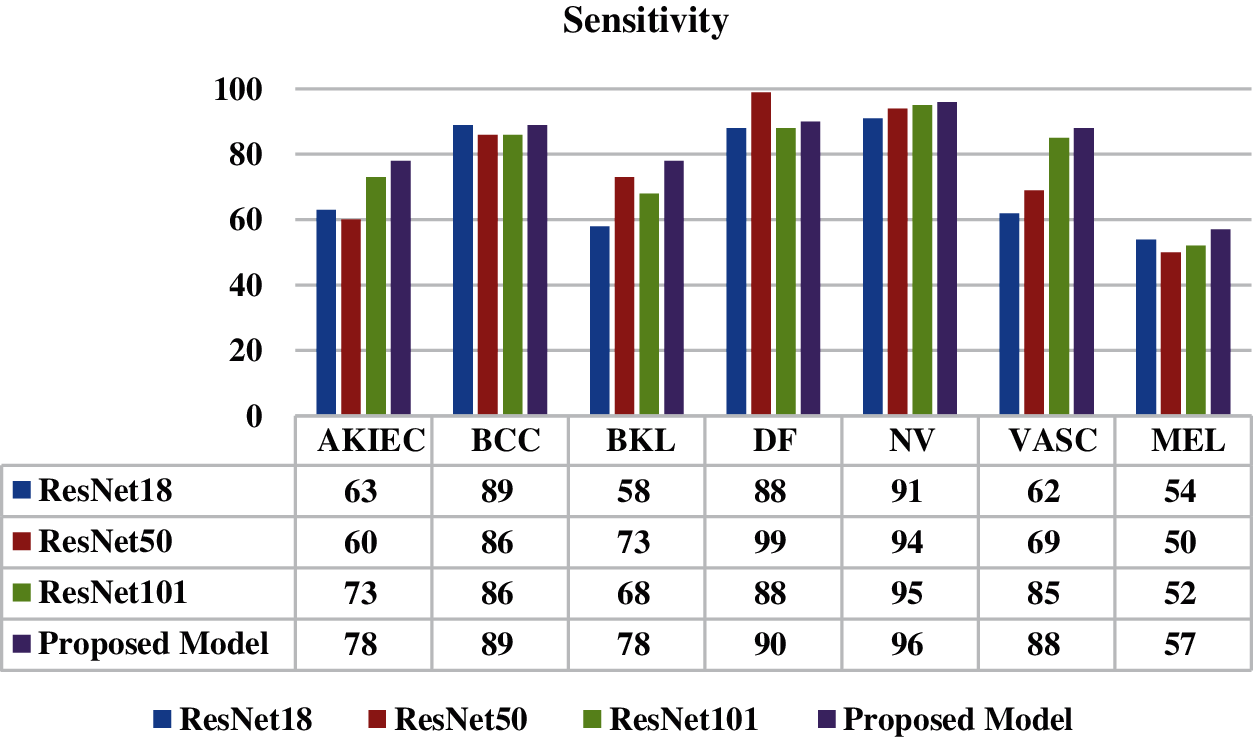
Figure 10: Sensitivity of proposed model and all ResNet models
F1 Score is used for a better measure when there is an uneven class distribution. It is the harmonic mean of precision and recall. Fig. 11 shows the best value of F1 score as 96% for disease NV.

Figure 11: F1 score of proposed model and all ResNet models
Fig. 12 shows the comparison of specificity values of the proposed model with the ResNet18, ResNet50 and ResNet101 model. Specificity is the ability of a test to correctly identify people without the disease. It is analyzed from the figure that the best value of specificity is 99% for disease AKIEC. The proposed model has shown best results on all skin disease classes.
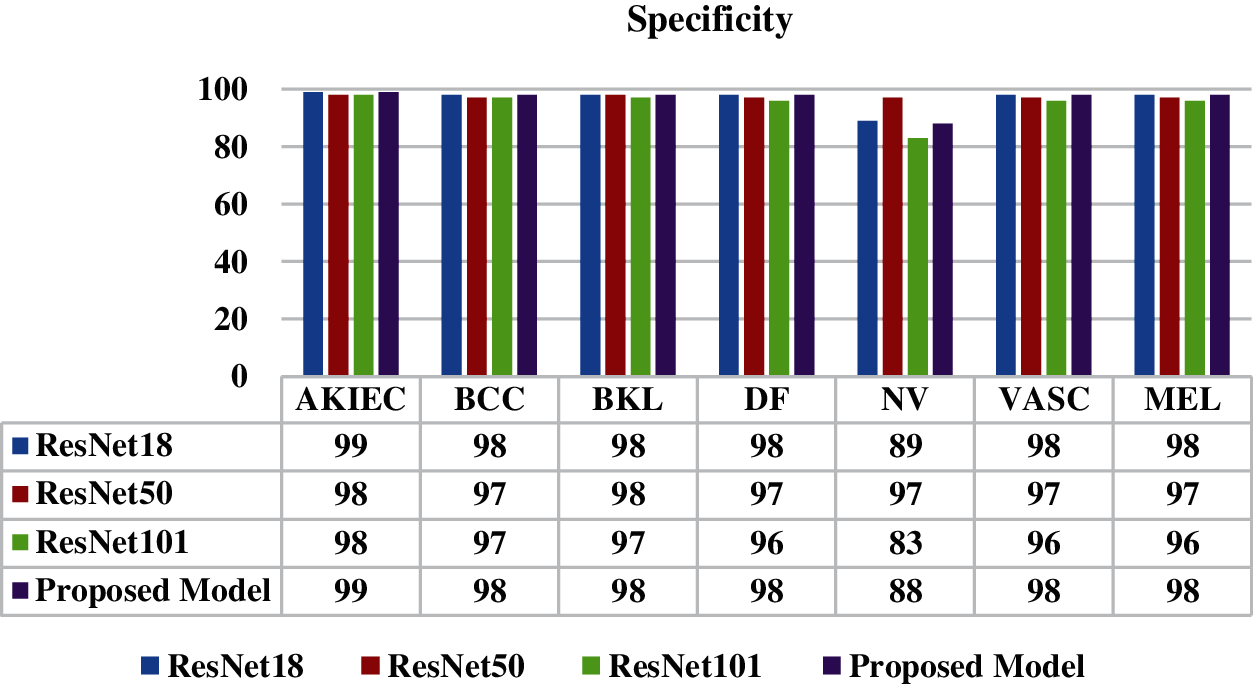
Figure 12: Specificity of proposed model and all ResNet models
Fig. 13 shows the comparison of ResNet18, ResNet50, ResNet101 and the proposed model in terms of Adadelta optimizer with 32 batch size. The proposed model has obtained accuracy of 0.96 whereas ResNet101 model has obtained 0.90, ResNet50 has obtained value as 0.89 and ResNet18 model has obtained value as 0.86.

Figure 13: Accuracy of proposed model and all ResNet models
In this study, a deep learning based model is proposed for the classification of seven skin disease classes using dermoscopy images. Various pre-trained ResNet architectures are studied and their results are analyzed using publicly available skin disease dataset. Although, the proposed model has only 10 layers as compared to ResNet 18, ResNet 50 and Resnet 101 that are having 18, 50 and 101 layers respectively. Even then the proposed model outperforms these ResNet models in terms of accuracy, sensitivity, precision and F1 Score. The dermoscopy images are taken from the HAM10000 dataset. The models are simulated with 32 batch size and Adadelta optimizer. The reason for choosing the Adadelta optimizer is that it is an extended version of Adagrad that adapts learning rates based on a moving window of gradient updates, instead of accumulating all past gradients. All the models are compared in terms of accuracy and the proposed model has a best accuracy value of 0.96 whereas the ResNet101 model has obtained 0.90, ResNet50 has obtained 0.89 and ResNet18 model has obtained value as 0.86. Therefore, features obtained from the proposed model are capable of improving the performance of classification for multiple skin disease classes. Dorj et al. [24] had used a pre-trained AlexNet model and used a total of 3753 images for extracting features. The values of achieved average accuracy for actinic keratoses was 92.3%, basal cell carcinoma was 91.8%, squamous cell carcinoma was 95.1%, melanoma was 94.2%. In 2020, Huang et al. [30] had developed a convolution neural network and had achieved an accuracy of 85.8% and More et al. [31] had achieved an accuracy of 75.03% on HAM10000 dataset. In future, the accuracy of the proposed model can be improved by applying the noise removal filter in the pre-processing stage. Further, the proposed model can be simulated using different types of optimizers, batch sizes, epochs and learning rates to enhance the results. Moreover, the processing time for the proposed model can be compared with the pre-trained models.
Acknowledgement: This work was supported by Taif university Researchers Supporting Project Number (TURPS-2020/114), Taif University, Taif, Saudi Arabia.
Funding Statement: This work was supported by Taif university Researchers Supporting Project Number (TURPS-2020/114), Taif University, Taif, Saudi Arabia.
Conflicts of Interest: Authors declare that they have no conflicts of interest to report regarding the present study.
1. M. Silveira, J. C. Nascimento, J. S. Marques, A. R. Marçal, T. Mendonça et al., “Comparison of segmentation methods for melanoma diagnosis in dermoscopy images,” IEEE Journal of Selected Topics in Signal Processing, vol. 3, no. 1, pp. 35–45, 2009. [Google Scholar]
2. M. E. Celebi, H. Iyatomi, G. Schaefer and W. V. Stoecker, “Lesion border detection in dermoscopy images,” Computerized Medical Imaging and Graphics, vol. 33, no. 2, pp. 148–153, 2009. [Google Scholar]
3. M. Emre Celebi, Q. Wen, S. Hwang, H. Iyatomi and G. Schaefer, “Lesion border detection in dermoscopy images using ensembles of thresholding methods,” Skin Research and Technology, vol. 19, no. 1, pp. 252–258, 2013. [Google Scholar]
4. S. Sigurdsson, P. A. Philipsen, L. K. Hansen, J. Larsen, M. Gniadecka et al., “Detection of skin cancer by classification of Raman spectra,” IEEE Transactions on Biomedical Engineering, vol. 51, no. 10, pp. 1784–1793, 2004. [Google Scholar]
5. Z. She, Y. Liu and A. Damatoa, “Combination of features from skin pattern and ABCD analysis for lesion classification,” Skin Research and Technology, vol. 13, no. 1, pp. 25–33, 2007. [Google Scholar]
6. M. E. Celebi, Q. Wen, H. Iyatomi, K. Shimizu, H. Zhou et al., “A state-of-the-art survey on lesion border detection in dermoscopy images,” Dermoscopy Image Analysis, vol. 10, no. 1, pp. 97–129, 2015. [Google Scholar]
7. P. P. Shinde and S. Shah, “A review of machine learning and deep learning applications,” in Fourth Int. Conf. on Computing Communication Control and Automation (ICCUBEAPune, India, pp. 1–6, 2018. [Google Scholar]
8. A. Goyal, “Around 19 crore Indians likely to suffer from skin diseases by 2015-notes frost & sullivan,” 2014. [Google Scholar]
9. R. S. Meng, X. Meng and F. Y. Xie, “Early diagnosis for cutaneous malignant melanoma based on the intellectualized classification and recognition for images of melanocytic tumour by dermoscopy,” Journal of Biomedical Graphics and Computing, vol. 2, no. 2, pp. 37–47, 2012. [Google Scholar]
10. R. Garnavi, M. Aldeen and J. Bailey, “Computer-aided diagnosis of melanoma using border-and wavelet-based texture analysis,” IEEE Transactions on Information Technology in Biomedicine, vol. 16, no. 6, pp. 1239–1252, 2012. [Google Scholar]
11. M. K. Mahmoud, A. Al-Jumaily and M. Takruri, “The automatic identification of melanoma by wavelet and curvelet analysis: study based on neural network classification,” in 11th Int. Conf. on Hybrid Intelligent Systems (HISMelacca, Malaysia, pp. 680–685, 2011. [Google Scholar]
12. C. Barata, M. Ruela, M. Francisco, T. Mendonça and J. S. Marques, “Two systems for the detection of melanomas in dermoscopy images using texture and color features,” IEEE Systems Journal, vol. 8, no. 3, pp. 965–979, 2013. [Google Scholar]
13. N. Fassihi, J. Shanbehzadeh, H. Sarrafzadeh and E. Ghasemi, “Melanoma diagnosis by the Use of wavelet analysis based on morphological operators,” in Proc. Int. MultiConf. of Engineers and Computer Scientists (Ed.Hong Kong, pp. 193–196, 2011. [Google Scholar]
14. F. Xie, H. Fan, Y. Li, Z. Jiang, R. Meng et al., “Melanoma classification on dermoscopy images using a neural network ensemble model,” IEEE Transactions on Medical Imaging, vol. 36, no. 3, pp. 849–858, 2016. [Google Scholar]
15. J. Breneman, “Towards early-stage malignant melanoma detection using consumer mobile devices,” Stanford Center for Professional Development, vol. 6, no. 1, pp. 1–6, 2012. [Google Scholar]
16. N. Smaoui and S. Bessassi, “A developed system for melanoma diagnosis,” International Journal of Computer Vision and Signal Processing, vol. 3, no. 1, pp. 10–17, 2013. [Google Scholar]
17. R. Garnavi, M. Aldeen, M. E. Celebi, A. Bhuiyan, C. Dolianitis et al., “Automatic segmentation of Dermoscopy images using histogram thresholding on optimal color channels,” International Journal of Medicine and Medical Sciences, vol. 1, no. 2, pp. 126–134, 2010. [Google Scholar]
18. L. Cheng, M. Mahmood, N. Jha and M. Mandal, “Automated segmentation of the melanocytes in skin histopathological images,” IEEE Journal of Biomedical and Health Informatics, vol. 17, no. 2, pp. 284–296, 2013. [Google Scholar]
19. J. Amin, A. Sharif, N. Gul, M. A. Anjum, M. W. Nisar et al., “Integrated design of deep features fusion for localization and classification of skin cancer,” Pattern Recognition Letters, vol. 131, pp. 63–70, 2020. [Google Scholar]
20. N. C. Codella, Q. B. Nguyen, S. Pankanti and D. A. Gutman, “Deep learning ensembles for melanoma recognition in dermoscopy images,” IBM Journal of Research and Development, vol. 61, no. 4, pp. 1–5, 2017. [Google Scholar]
21. A. Mahbod, G. Schaefer, C. Wang, G. Dorffner, R. Ecker et al., “Transfer learning using a multi-scale and multi-network ensemble for skin lesion classification,” Computer Methods and Programs in Biomedicine, vol. 193, no. 1, pp. 1–9, 2020. [Google Scholar]
22. N. A. Koohbanani, M. Jahanifar, N. Z. Tajeddin, A. Gooya and N. Rajpoot, “Leveraging transfer learning for segmenting lesions and their attributes in dermoscopy images,” arXiv preprint arXiv:1809.10243, 2018. [Google Scholar]
23. A. Hekler, J. N. Kather, E. Krieghoff-Henning, J. S. Utikal, F. Meier et al., “Effects of label noise on deep learning-based skin cancer classification,” Frontiers in Medicine, vol. 7, no. 1, pp. 1–7, 2020. [Google Scholar]
24. U. O. Dorj, K. K. Lee, J. Y. Choi and M. Lee, “The skin cancer classification using deep convolutional neural network,” Multimedia Tools and Applications, vol. 77, no. 8, pp. 9909–9924, 2018. [Google Scholar]
25. K. Zafar, S. O. Gilani, A. Waris, A. Ahmed, M. Jamil et al., “Skin lesion segmentation from dermoscopic images using convolutional neural network,” Sensors, vol. 20, no. 6, 2020. [Google Scholar]
26. S. Chatterjee, D. Dey and S. Munshi, “Integration of morphological Pre-processing and fractal based feature extraction with recursive feature elimination for skin lesion types classification,” Computer Methods and Programs in Biomedicine, vol. 178, pp. 201–218, 2019. [Google Scholar]
27. K. Duggani and M. K. Nath, “A technical review report on deep learning approach for skin cancer detection and segmentation,” Data Analytics and Management, vol. 54, no. 1, pp. 87–99, 2021. [Google Scholar]
28. M. A. Khan, Y. D. Zhang, M. Sharif and T. Akram, “Pixels to classes: Intelligent learning framework for multiclass skin lesion localization and classification,” Computers & Electrical Engineering, vol. 90, no. 1, 2021. [Google Scholar]
29. A. Masni, A. Mohammed, D. H. Kim and T. S. Kim, “Multiple skin lesions diagnostics via integrated deep convolutional networks for segmentation and classification,” Computer Methods and Programs in Biomedicine, vol. 190, no. 1, pp. 1–12, 2020. [Google Scholar]
30. H. W. Huang, B. W. Hsu, C. H. Lee and V. S. Tseng, “Development of a light-Weight deep learning model for cloud applications and remote diagnosis of skin cancers,” The Journal of Dermatology, vol. 48, no. 3, pp. 310–316, 2021. [Google Scholar]
31. J. More, M. Nath, P. Yamgar and A. Bhatt, “Skin disease classification using convolutional neural network,” International Research Journal of Engineering and Technology, vol. 7, pp. 38306–38313, 2019. [Google Scholar]
32. P. Tschandl, C. Rosendahl and H. Kittler, “The HAM10000 dataset, a large collection of multi-source dermatoscopic images of common pigmented skin lesions,” Scientific Data, vol. 14, no. 5, pp. 1–9, 2018. [Google Scholar]
33. S. Anish, E. Kadam, H. Shah, S. Shinde and S. Shingade, “Deep residual networks with exponential linear unit,” in Proc. Third Int. Symp. on Computer Vision and the Internet, Jaipur, India, pp. 59–65, 2016. [Google Scholar]
34. S. Connor and T. Khoshgoftaar, “A survey on image data augmentation for deep learning,” Journal of Big Data, vol. 6, no. 1, pp. 1–48, 2019. [Google Scholar]
35. K. He, X. Zhang, S. Ren and J. Sun, “Deep Residual Learning for Image Recognition,” In Computer Vision Foundation, Las Vegas, Nevada, United States, IEEE, pp. 770–778, 2016. [Google Scholar]
36. K. A. AlAfandy, H. Omara, M. Lazaar and M. Al Achhab, “Using classic networks for classifying remote sensing images: Comparative study,” Advances in Science, Technology and Engineering Systems Journal, vol. 5, no. 5, pp. 770–780, 2020. [Google Scholar]
37. M. D. Zeiler, “Adadelta: An adaptive learning rate method,” arXiv preprint arXiv:1212.5701, 2012. [Google Scholar]
38. P. J. Won, S. Wagner-Carena, S. Birrer, P. J. Marshall, J. Yao-Yu Lin et al., “Large-scale gravitational lens modeling with Bayesian neural networks for accurate and precise inference of the hubble constant,” The Astrophysical Journal, vol. 910, no. 1, pp. 1–23, 2021. [Google Scholar]
 | This work is licensed under a Creative Commons Attribution 4.0 International License, which permits unrestricted use, distribution, and reproduction in any medium, provided the original work is properly cited. |