DOI:10.32604/cmc.2022.022705
| Computers, Materials & Continua DOI:10.32604/cmc.2022.022705 | |
| Article |
Automated Grading of Breast Cancer Histopathology Images Using Multilayered Autoencoder
1Knowledge Unit of System and Technology, University of Management & Technology, Sialkot Campus, 51310, Pakistan
2Department of Computer Science, University of Management and Technology, Sialkot Campus, 51310, Pakistan
3Faculty of Computing and Technology, University of Engineering & Technology, Narowal, 51610, Pakistan
4College of Computer Science and Engineering, University of Jeddah, 21493, Saudi Arabia
5Faculty of Computing and Information Technology, King Abdulaziz University, Jeddah, 21589, Saudi Arabia
6Department of Computer Engineering, College of Computers and Information Technology, Taif University, Taif, Saudi Arabia
7Faculty of Engineering, Moncton University, NB, E1A3E9, Canada
8Department of Information and Communication Engineering, Yeungnam University, Gyeongsan, 38541, Korea
*Corresponding Author: Muhammad Shafiq. Email: shafiq@ynu.ac.kr
Received: 16 August 2021; Accepted: 30 September 2021
Abstract: Breast cancer (BC) is the most widely recognized cancer in women worldwide. By 2018, 627,000 women had died of breast cancer (World Health Organization Report 2018). To diagnose BC, the evaluation of tumours is achieved by analysis of histological specimens. At present, the Nottingham Bloom Richardson framework is the least expensive approach used to grade BC aggressiveness. Pathologists contemplate three elements, 1. mitotic count, 2. gland formation, and 3. nuclear atypia, which is a laborious process that witness's variations in expert's opinions. Recently, some algorithms have been proposed for the detection of mitotic cells, but nuclear atypia in breast cancer histopathology has not received much consideration. Nuclear atypia analysis is performed not only to grade BC but also to provide critical information in the discrimination of normal breast, non-invasive breast (usual ductal hyperplasia, atypical ductal hyperplasia) and pre-invasive breast (ductal carcinoma in situ) and invasive breast lesions. We proposed a deep-stacked multi-layer autoencoder ensemble with a softmax layer for the feature extraction and classification process. The classification results show the value of the multi-layer autoencoder model in the evaluation of nuclear polymorphisms. The proposed method has indicated promising results, making them more fit in breast cancer grading.
Keywords: Breast cancer; nuclear atypia; autoencoder
Breast cancer (BC) alludes to a hostile tumour that has been created from nuclei in the breast. BC can originate in three areas: (1) lobules, which are the milk drain organs; (2) ducts, which are paths that empty the drain out of the lobules to the nipples; or (3) stromal tissues, which incorporate the fatty stringy connective tissues of the breast. Among them, the first two are the most common classes of BC [1]. Diagnosis with higher precision is desirable to provide treatment efficiently. Regardless of extensive development in the diagnosis and management of breast cancer, it is still the second leading cause of high mortality [2]. However, it is necessary to diagnose cancer in the early phases and exact regions to avoid severity. Pathologists use different medical imaging modalities, such as mammography studies, ultrasound scanning, computerized scanning and magnetic resonance imaging, to obtain images of the breast for later analysis [3]. The analysis was performed to obtain the aggressiveness of cancerous cells. The aggressiveness of cells is categorically explained by using a grading system that has impacts on treatment. Cancer grading determines how the tumour nuclei look under microscopic tests [4,5]. It is not the same as measuring the tumour size and its aggression and metastasis.
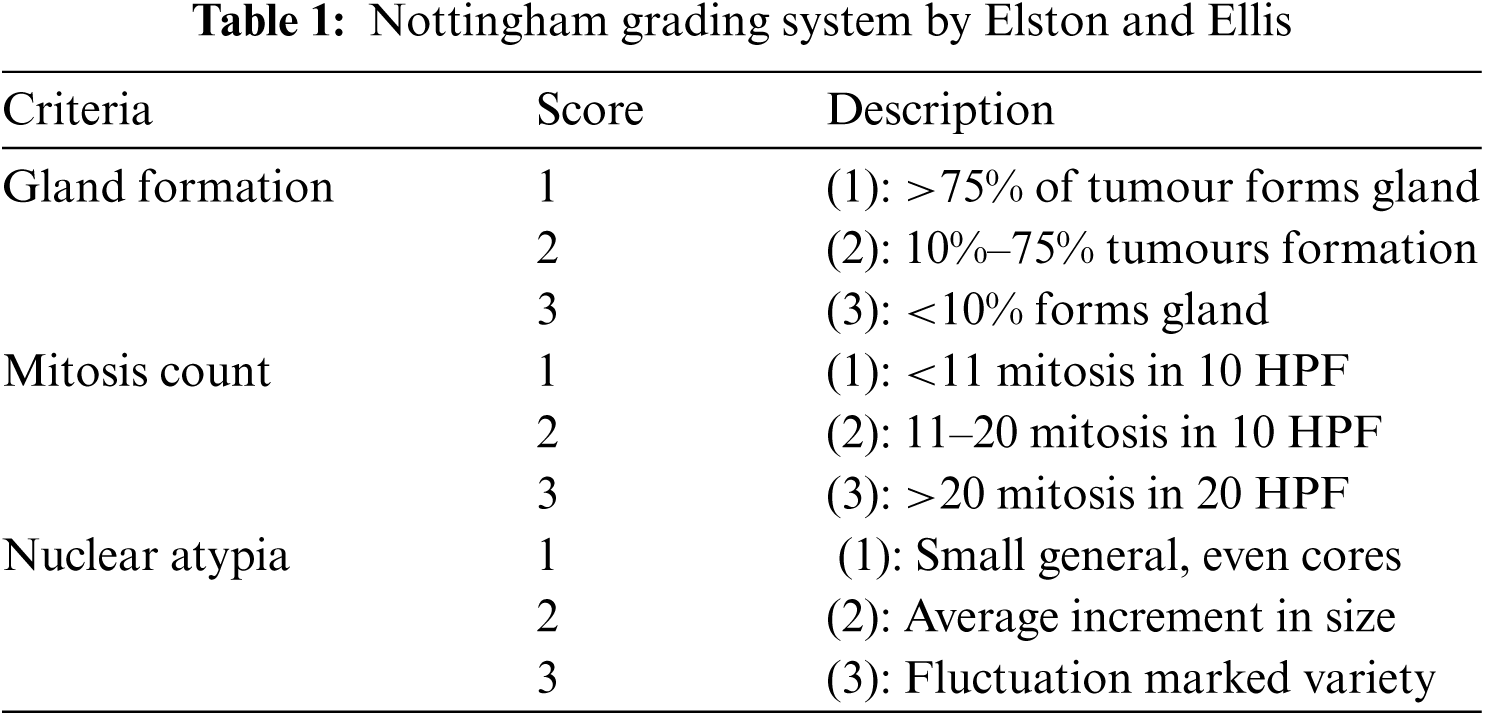
The Nottingham grading system (NGS) proposed by Elston and Ellis is a universal grading system prescribed by the WHO to evaluate BC aggressiveness by pathologists worldwide [6]. It compares the appearance of BC tissues with the appearance of normal breast tissues, as shown in Tab. 1. It consists of three grades (I), (II), and (III) achieved from the expansion of these three measures: mitotic count, gland formation and nuclear atypia. These three criteria are valued as 1, 2, or 3 (Tab. 1) [6]. The evaluation of the BC grade is semi-quantitative. The computation of the three parameters provides tumour aggressiveness. The minimum conceivable score is 3 (1 + 1+1), and the maximum conceivable score is 9 (3 + 3+3). Patients with a score of 8 or 9 are assigned Grade-III. Grade-II alludes to scores of 6 or 7, while Grade-I alludes to scores of 3, 4 or 5. High-grade nuclear atypia shows a high deviation in cell shape. Low-grade nuclear atypia, for the most part, has round nuclei [5].
The rest of this paper is structured as follows. Section 2 outline the latest research on automated image analysis in histopathology and contribution of the paper. Section 3 describes the proposed methodology. Section 4 presents the results and discussion. In the last section, we have drawn our conclusion.
2 Automated Image Analysis in Histopathology
The microscopic study of cell morphology plays a vital role for medical experts in decision making [7]. Automated nuclei segmentation and classification is a repetitive activity and challenging for pathological images. Due to rapid development in digital pathology, various cancer diagnosis and grading systems have been proposed, including brain image analysis [8–10], cervix [11], lungs [12], liver [13] and breast [5,14–18]. In this regard, we can find more systems in [19–22].
BC image analysis can be applied to handle numerous pathology jobs, such as mitosis detection [18,23], tissue segmentation [24], histological classification or cancer grading [15]. Automatic analysis is commonly performed by using hematoxylin and eosin (H&E)-stained slides and deep learning techniques to enhance model performance [25]. Breast cancer diagnosis from histopathological images always remains the benchmark in clinical pathology [20–24]. Histopathology is the investigation of microscopic variations or abnormalities in tissues. Distinctive types of nuclei in BC histological images call attention to the difficulties in their recognition [26]. The images that are obtained through traditional radiology, such as mammograms, ultrasound and MRI, are greyscale and do not cover interesting regions, whereas histopathology images have better quality in diagnosing various diseases, including an extensive variety of cancers, due to distinctive features achieved through the staining process in biopsy tests [27]. Cancer detection and grading are performed on histopathological images that are obtained by different high-resolution scanners, such as Aperio XT and Hamamatsu NanoZoomer. Cancer cell identification and grading are achieved at different magnifications, such as 10×, 20× and 40×, because of the tissue structure morphology [28]. The obtained whole slide images are exposed to pathologists, who examined the images manually to segment regions of interest for assessing critical information for classification [29]. The proper classification of breast lesions can provide critically important diagnostic information to prevent under- and over-treatment and properly guide patient treatment.
The major problem with the current manual diagnosis system is inter- and intra-observer variability and reproducibility problems. Computer-aided diagnosis (CAD) is a developing interdisciplinary area that consolidates components of machine learning and digital image processing with medicinal information [21]. Novel CAD techniques for analysing breast tissue will enable pathologists to have more accurate and reproducible diagnoses, leading to improvements in the ability of pathologists to diagnose and prognosis breast cancer. Several studies exist about breast cancer detection and classification using deep learning. Sadad et al. [4] proposed the methodology to classify pre-segmented breast lumps as cancerous and non-cancerous in X-ray images. They used a convolutional neural network and pre-trained models, combined data augmentation and transfer learning to address overfitting problems. The authors only used limited pre-trained networks on a digital database for screening mammography (DDSM), which might be inadequate to generalize the results of their study. Huynh et al., [19] presented a computer-aided system that extracted 219 breast lesions from breast mammographic images. They used CNN as a feature extractor and support vector machine for classification purposes. Although classification accuracy improved, due to the small number of training data, it might experience overfitting [16]. Khan et al., [21] proposed a framework intended to score cancerous tumour tissues based on ER and PR hormone receptors by using image processing techniques. This system scores ER/PR pervasiveness more accurately than conventional methods that usually assist pathologists in exploring histopathological images. The results are recorded in a database to facilitate further analysis. Doyle et al., [30] segregated poor quality from high-grade BC tumour slides by applying a mix of surface-based components for recognizing tumours from non-cancer, and afterward, extended design elements to recognize low from high evaluations. However, this method depends on the precision of the position of nuclei. In their dataset, the nuclei were commented on physically. However, Abirami et al., [31] proposed an artificial neural network-based classifier to detect micro-classifications in every area of breast cancer mammograms. They used discrete wavelet transform (DWT) for feature extraction and neural networks such as multi-layer perceptron and radial basis function for the classification of BC mammographic images.
Evaluation of the histopathological images of nuclear polymorphism BC is a qualitative method of treatment for assessment and prognosis. In 2020, a study is conducted for mitotic cell detection by using deep learning techniques instead of image processing techniques, as those techniques are costly and not up to the mark. For detection of mitotic cell Faster-RCNN has been used, but this generates results that has unacceptable rate of false positives. These false positives are generated because of small size of mitotic cell or it is similar looking to normal cell. To reduce false positives post processing is applied. In post processing two deep learning method RESNET 50 and DENSENET-201 has been applied that results in refined set of mitotic cell candidates, which are further refined by using statistical parameters such as shape, texture etc. This technique is tested on two open source databases ICPR 2012, ICPR 2014 and for generalization testing on TUPAC16. On all these datasets the proposed methodology performs well [32]. In another study, authors proposed two deep learning models for semantic segmentation and classification to increase robustness. The findings indicate that by combining traditional image processing methodologies and deep learning approaches with hand-crafted features, the efficiency of traditional image processing methodologies and deep learning approaches can be significantly improved [33].
Different from the existing techniques, the proposed method in our study selects only critical cell nuclei features and utilizes them to grade NA into I, II and III accordingly. The results comprise the prediction of nuclear atypia, which will not merely help pathologists in diagnosis but also bring robust and productive changes in the field of medical imaging.
To identify histological grades in breast cancer images, we developed an automated grading of nuclei using unsupervised feature extraction. Our major contributions in this paper are as follows:
• The proposed system combines a patch-based automated feature extraction method with controlled decision fusion for feature extraction and classification.
• An autoencoder-based model is proposed that automatically isolates discriminative patches from high-resolution images for data training.
• Our model attains several state-of-the-art outcomes classifying whole slide images (WSIs) into cancer grades and is closely related to inter-observer agreement among pathologists.
• Experimental evidence shows that training deep learning models on high-resolution WSI blocks can produce promising results, making them more suitable for breast cancer grading.
In this research, a publicly available nuclear atypia dataset containing Grade-I, II and III BC anomalies by the ICPR (International Conference on Pattern Recognition), is used to assess the effectiveness of the proposed model. The dataset was generated by using 300 manually tagged whole 50 high power field (HPF) slide images of size 1539 × 1376. These images were scanned by an Aperio scanner at ×20 magnification. A solitary WSI of 20 × magnification tissue sample comprises almost 1010 multi-channel, representing a highly complex multi-scale structure [34]. An HPF is a territory of 0.262 mm2, which is a surface comparable to that of a magnifying lens field breadth of 0.58 mm. The Aperio scanner has a resolution of 0.2273 μm horizontal and 0.222753 μm vertical per pixel. For each frame, two files are maintained. One contains a list of marked scores by each pathologist, and the other is the final score of nuclear atypia decided on majority opinions. The score for nuclear atypia requires a wide zone to have the ability to assess the shape and size of an expansive populace of nuclei. For this purpose, the pathologists worked at × 20 magnification, and the final score was given by two or three pathologists. The dataset has been split into training and validation sets. The training and validation sets contain 70 percent and 30 percent of total dataset respectively. Each set contains WSIs for three grades, 19% of training dataset is grade-1%, 40% is grade-II and remaining is grade-III. In validation set, grade-I, II and III are 16%, 42% and 42% respectively. The data used in our experiments also accessible through [35].
For deep learning models, the fundamental object is the dataset. Deep learning algorithms truly perform well when the dataset is large [36]. This is mainly accurate in the medical imaging field, where access to data is highly protected due to patient secrecy concerns [37]. To overcome this matter, we used data augmentation to increase the dataset. The main purpose of data augmentation is generating genuine-looking training data by applying a transformation to an example without altering its label [38–40]. Some non-categorical image transformation techniques are used to produce new examples from the training data for image classification, such as cropping, flipping, shifting, and colour jittering, adding Gaussian noise and rotating images at different angles. To balance our dataset, we applied data augmentation of the WSI at different angles (45°, 90°, 120° and 270°). Algorithms 1 was used for data augmentation.
3.3 Patch Extraction for Whole Slide Nuclei Image Classification
Patch extraction is normally used to represent larger scan. Deep neural networks, though, operate on smaller image dimensions as stated in [41] that input size of image may not be larger than 350 by 350 pixels. To reduce the significant image size, input space, computational time and system specifications, WSIs of size 1539 × 1376 were divided into 128 by 128 size patches, 20 manually annotated patches by expert, were used in our study as patch with higher grade will represent WSI [42]. As far as number of patches concerns, it is observed that deep neural networks with larger input size may need large number of training parameters i.e., neurons. This may cause difficulty for neural network during training [41]. Every patch consisted of associated features that were representative of the WSI. All patches were assigned a unique identifier and grade according to the Nottingham grade system by a pathologist. Our patch extraction approach is elaborated in Algorithm-2. The overall architecture of the proposed methodology is illustrated in Fig. 1.


Figure 1: Framework for nuclei grading based on the Nottingham grading system
3.4 Feature Learning with Two-Layered Autoencoders
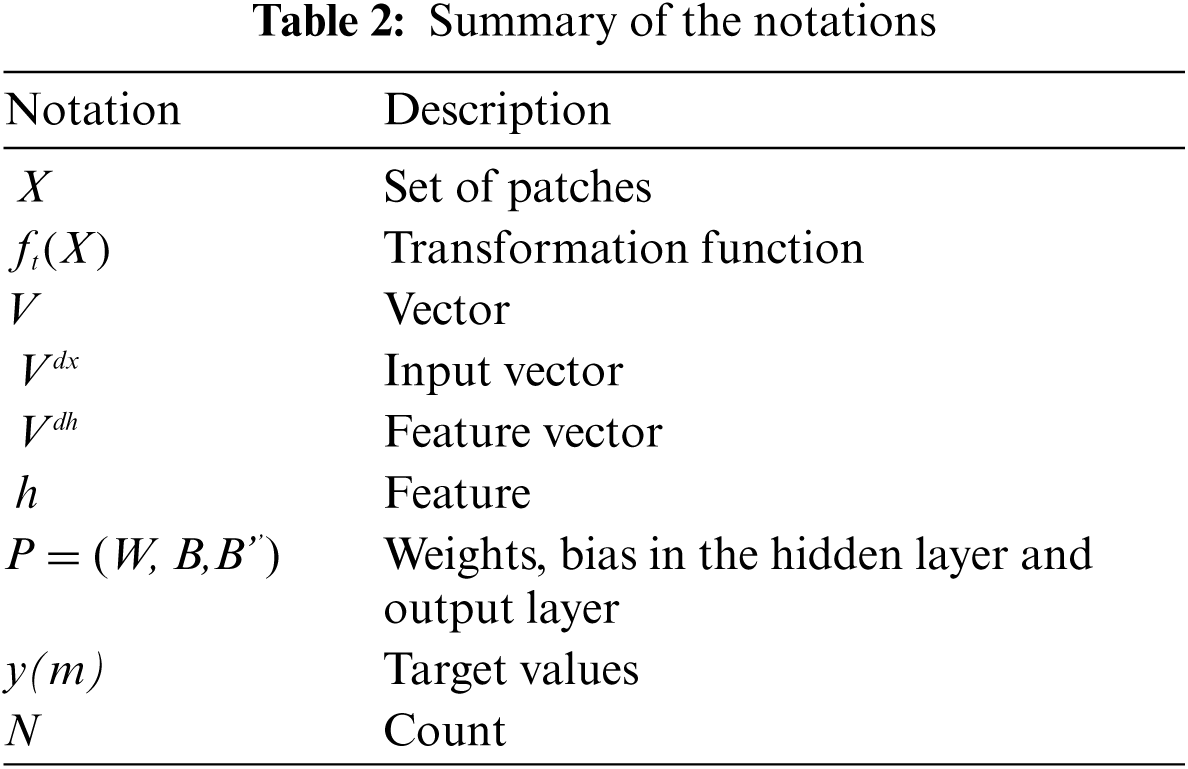
The architecture of the autoencoder mainly consists of two blocks of layers [34]. The first layer is the input layer, which resides as an encoder that is intended to perform the encoding of input data into a lower-dimensional latent compression; a hidden layer can be seen as a new feature representation of input data. The other block contains an output layer that is trained to reconstruct the input from the hidden representation [43,44]. The autoencoder simultaneously reduces the divergence between feed data and its reconstruction. The output feature set, which is obtained after applying the transformation function, of every connected layer is the input of successive layers [45]. Conventionally, the autoencoder takes input and finds weights that are evaluated on the basis of a threshold. If that threshold matches, data training is stopped; otherwise, weights are again calculated to meet that required criterion. The working architecture of the autoencoder is shown in Fig. 2. The autoencoder finds the optimal parameters

Figure 2: Feature learning process from BC histopathology
In proposed framework, the autoencoder has three hidden layers, the output of the hidden layer is given as input to the next layer. The first hidden layer generates 3000 features which were given as input to the second layer that filter out 300 features from given feature set. Later on, these 300 features maps into 50 features by third layer. The final 50 features are used in classification as shown in Fig. 2.
The support vector machine (SVM) is a supervised machine learning classifier that combines the influence of conventional theoretical statistical approaches [46]. SVMs are commonly used classifiers in various machine learning-based healthcare areas, such as medical imaging [47] and bioinformatics [48]. SVM incorporates the capability to overcome the issue of overfitting by using the idea of error minimization. The SVM classifier looks for the ideal hyperplane, which is in the middle of the classes [49]. This ideal unscrambling hyperactive plane has numerous refined measurable qualities. SVM additionally learns a non-linear decision function that captures extreme edge hyperplanes by a kernel in high-dimensional vector space that is mapped from input space [50]. Typically, SVM addresses noisy data problems and is usually used for binary classification, but it can be specifically stretched out for multi-class classification. In this study, SVM was used for paired characterization of aggressive tumours of Grades I, II and III, as shown in Fig. 3. For classification, we designed three parameters for each grade as:

Figure 3: Multi-class support vector machine using three hyperplanes, classifying Grades-I, II and III
Numerous machine learning (ML) algorithms are available, among which j48 and random forest are the most frequently used decision trees for classification [51]. A decision tree is a method that classifies data as an n-array hierarchy. The initial step, known as tree building, generates a decision tree model through training data and a function, i.e., entropy for obtaining the latest knowledge trends, given in Eq. (3). The other step is tree pruning, in which the insignificant branches do not contribute. To classify, from the root hub, the property estimation of the entered records is tested until a leaf hub is achieved for its respective class. The purpose of tree pruning is to decrease the background distortion or noise in the training data [10,52,53]. In this study, random forest (Fig. 4) and J48 decision tree (Fig. 5) classifiers are used. The random forest (RF) algorithm classifies a given problem by executing the combination of a few decision trees where each tree depends on the value of a distinctly sampled random vector. The distinction of such ensembles of classifiers is that their tree-based components are developed from a specific measure of irregularity, and random forest is characterized as a non-specific standard of the randomized gathering of decision trees. In addition to randomization, achieved by developing trees using bootstrapping, a second layer of randomization is presented at the hub level when growing the tree. RF predicts the output by mapping test features to rules that are generated by using information gain, i.e., Eq. (4). Finally, it considers the highly voted predicted target as the final prediction from random forest.
where

Figure 4: RF architecture that generates N trees to classify nuclei classification
The J48 decision tree for classification purposes was also used. J48 uses entropy to calculate the homogeneity of the sample data. If the entropy is zero, then the sample data are completely homogeneous, and if the sample data are divided unequally, then it has entropy one. The supplementary features of J48 are detecting missing values, finding persistent characteristic value ranges, determining principles and decision tree pruning. This algorithm delivers the principles for the prediction of the objective variable. In different algorithms, the classification is performed recursively until each sheet is pure; that is, the classification of the data must be as precise as might be expected in the circumstances [54].

Figure 5: The J48 decision tree shows that the features with the highest information gain classify them into their perspective classes
3.5.3 Multi-Layer Perceptron Network
Multi-layer perceptron (MLP) is a supervised neural network consisting of many processing parameters, i.e., weights that are linked with each other. MLPs are neural systems with an input layer comprised of entities, at least one computation hidden layer that uses the default activation function and an output layer comprising computation nodes. An optimization class is used to minimize the given loss function [55]. All attributes of the system are standardized before being given as input. In the input layer, the feature vector is given to the source node that generates the input signal. The input signal moves onward on a path via layers and produces an output signal. As a final point, the computational process terminates on the output layer, which produces results as shown in Fig. 6.

Figure 6: Multi-layer perceptron with N hidden Neurons
3.5.4 Performance Metrics for Classification
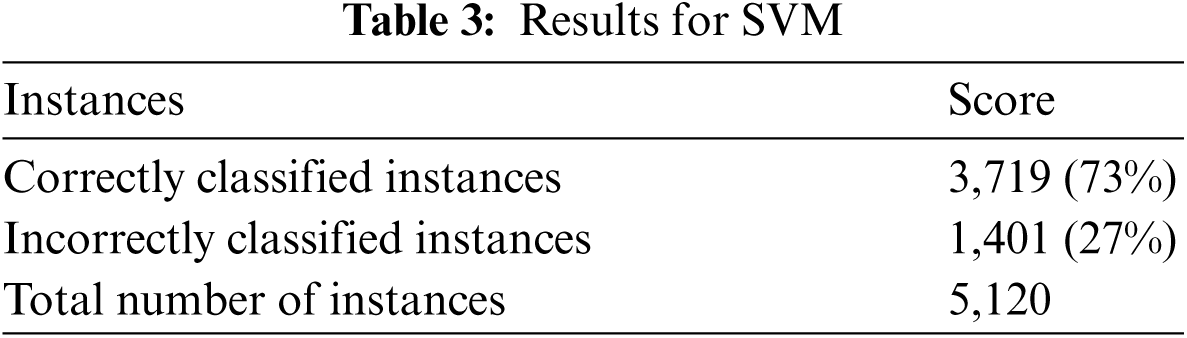
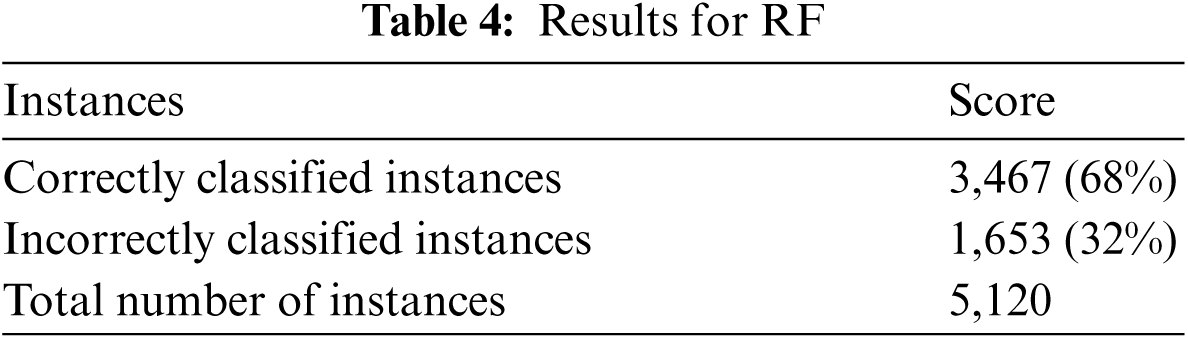
The quantitative performance of our framework with different models is shown in Tabs. 3–7, where we computed our results using metrics in Eqs. (5)–(8). The performance of automatic grading on the basis of nuclei is quantified in terms of the F-measure, precision, and recall (sensitivity) [56,57].
X = correctly identified instances, Y = incorrectly identified instances, N = number of identified instances that do not align with manual labels.


In Eq. (8),
The proposed framework is evaluated on a publicly available nuclei dataset. This dataset consists of 30 HPF whole slide images at ×20 magnification. The study is implemented on a desktop computer (16 GB RAM with Intel Core (TM) 3.2 GHz processor) and Intel graphic processing unit. For software implementation, we performed experiments using MATLAB 2016a.
Deep learning models require a large dataset for effective learning, we augmented the data and extracted them into 128 × 128 equal size patches to reduce the computational complexity. Our input patch contains significant A101_01= 128 × 128 = 16,384 pixels characterized as learning features. Each patch contains malignant and benign areas of different grades. For feature learning, we used an unsupervised deep learning-based autoencoder model that contains hidden layers along with encoding and decoding layers. The features extracted from a single patch are pixel vectors. This vector is s a portion vector of pixel forces with degree (128 × 128 × 3) × 1. Thus, there are Sx = S0 = 128 × 128 × 3 input units in the input layer. The first, second and third hidden layers have h(i) = 3000, j(i) = 300 and K(i) = 50, where i = 1, 2, 3,…, n hidden units, respectively. Finally, the softmax layer classifies these 50 neurons into 3 grades accordingly.
Along with automatic classification with autoencoders, we used various other classifiers because softmax layer classification does not show promising results for this problem. The overall accuracy that was achieved using the softmax function was 63%. The extracted features are given as input to four different machine learning classifiers, i.e.; SVM, RF, J48 and MLP. For SVM, a normalized feature vector is given as input to the RBF kernel with cost 0.1 and precision threshold 0.0005. Second, we use RF for classification with attribute selection and noise removal performed by information gain and pruning, respectively. Along with RF, we also classify grades by considering another decision tree algorithm known as J48. Finally, we use a multi-layer neural network that has 50 hidden neurons and sigmoids as the activation function. The results are compiled at patch-level, however the final label of WSIs can be predicated by considering grade that is assigned to maximum patches of respective WSI. All four classifiers show better results than softmax, as shown in Tabs. 3–7.

Figure 7: Performance of proposed classifies: (a) recall; (b) F-measure, (c) precision; (d) accuracy
In the classification problem, the sizes of the training and testing data are constrained. We used the N-fold cross-validation technique, where N = 10. Various N-fold cross-validations attempt distinctive things with a comparable learning design, and the data index afterwards conveys differing results because of the effect of sporadic assortment in selecting the folds. Stratification reduces the assortment, yet it most likely does not abstain from it totally. We used the N-fold cross-validation method for estimating a tuning parameter t (subset size). This strategy reserves a certain quantity of data for training and testing. N-fold cross-validation is used to predict the error rate of feature learning techniques. We divided our data set into N equal parts, for each N= 1, 2, 3,…, 10 fit the model with t parameter to the other N-1 parts, giving α-N (t) and computed its error in predicting the Nth part. Since it was a hectic and tedious job to have a specialist or pathologist that physically recognized every single nucleus in each of these patches (to give a ground truth to quantitative assessment), we compared the results of classifiers with ground truth details provided along with the dataset. The metrics used to evaluate the nuclei scoring of each method include sensitivity, precision, F-measure and accuracy. The performance measures of all classifiers are shown in Fig. 7 including (a) recall; (b) F-measure, (c) precision; (d) accuracy.
The core aim of this study was to explore challenges in the automated nuclei grading framework for H&E images. The qualitative analysis of BC histopathology images was achieved by performing patch extraction, feature learning, and classification of nuclei. The outcome of the proposed methodology was comparable with pathologists’ observations given along the dataset. This technique can conceivably help build a computerized grading system for BC. A significant number of studies have been conducted in the field of computer-aided diagnostic tools, emphasizing nuclei segmentation and classification in various image modalities. Nevertheless, there are some open areas to delve into, which may have unique challenges that should be covered in future research. This study was designed to focus specifically on feature engineering using multi-layered autoencoder. Later on in part b of this study, we will test our extracted features using more advance classifiers. Furthermore, we intended to compute the BC grade by combining mitosis and nuclei regions. We also plan to conduct an investigation of the relationship between different grading parameters to evaluate the morphology of the breast in BC.
Acknowledgement: We deeply acknowledge Taif University for supporting this study through Taif University Researchers Supporting Project Number (TURSP-2020/150), Taif University, Taif, Saudi Arabia.
Funding Statement: This work was supported by Taif University (in Taif, Saudi Arabia) through the Researchers Supporting Project Number (TURSP-2020/150).
Conflicts of Interest: The authors declare that they have no conflicts of interest to report regarding the present study.
1. A. M. Khan, K. Sirinukunwattana and N. Rajpoot, “A global covariance descriptor for nuclear atypia scoring in breast histopathology images,” IEEE Journal of Biomedical and Health Informatics, vol. 19, no. 5, pp. 1637–1647, 2015. [Google Scholar]
2. R. L. Siegel, K. D. Miller and A. Jemal, “Cancer statistics, 2016,” CA: A Cancer Journal for Clinicians, vol. 66, no. 1, pp. 7–30, 2016. [Google Scholar]
3. S. Yu, S. Wu, L. Zhuang, X. Wei, M. Sak et al., “Efficient segmentation of a breast in B-mode ultrasound tomography using three-dimensional grabCut (GC3D),” Sensors, vol. 17, no. 8, 2017. [Google Scholar]
4. T. Sadad, A. Hussain, A. Munir, M. Habib, S. Ali Khan et al., “Identification of breast malignancy by marker-controlled watershed transformation and hybrid feature set for healthcare,” Applied Sciences, vol. 10, no. 6, pp. 1–16, 2020. [Google Scholar]
5. P. Wang, X. Hu, Y. Li, Q. Liu and X. Zhu, “Automatic cell nuclei segmentation and classification of breast cancer histopathology images,” Signal Processing, vol. 122, pp. 1–13, 2016. [Google Scholar]
6. C. W. Elston and I. O. Ellis, “Pathological prognostic factors in breast cancer. I. The value of histological grade in breast cancer: Experience from a large study with long-term follow-up,” Histopathology, vol. 19, no. 5, pp. 403–410, 1991. [Google Scholar]
7. H. Irshad, A. Veillard, L. Roux and D. Racoceanu, “Methods for nuclei detection, segmentation, and classification in digital histopathology: A review-current status and future potential,” IEEE Review Biomedical Engineering, vol. 7, pp. 97–114, 2014. [Google Scholar]
8. O. S. Al-Kadi, “Texture measures combination for improved meningioma classification of histopathological images,” Pattern Recognition, vol. 43, no. 6, pp. 2043–2053, 2010. [Google Scholar]
9. J. Kong, L. Cooper, T. Kurc, D. Brat and J. Saltz, “Towards building computerized image analysis framework for nucleus discrimination in microscopy images of diffuse glioma,” in Proc. IEEE Engineering in Medicine and Biology Society, Boston, USA, pp. 6605–6608, 2011. [Google Scholar]
10. C. Lo, Y. Yang, C. Hsu, C. Chen and W. Huang, “Applied sciences development of a mortality risk model in elderly hip fracture patients by different analytical approaches,” Applied Sciences, vol. 10, no. 19, pp. 6787, 2020. [Google Scholar]
11. Y. Miyasaka, Y. Yoshimoto, K. Murata, S. Noda, K. Ando et al., “Treatment outcomes of patients with adenocarcinoma of the uterine cervix after definitive radiotherapy and the prognostic impact of tumor-infiltrating CD8+ lymphocytes in pre-treatment biopsy specimens: A multi-institutional retrospective study,” Journal of Radiation Research, vol. 61, no. 2, pp. 275–284, 2020. [Google Scholar]
12. M. P. Paing, K. Hamamoto, S. Tungjitkusolmun, S. Visitsattapongse and C. Pintavirooj, “Automatic detection of pulmonary nodules using three-dimensional chain coding and optimized random forest,” Applied Sciences, vol. 10, no. 7, pp. 2346, 2020. [Google Scholar]
13. R. Ribeiro, R. Marinho, J. Sanches and S. Member, “Classification and staging of chronic liver disease from multimodal data,” IEEE Transactions on Biomedical Engineering, vol. 60, no. 5, pp. 1336–1344, 2013. [Google Scholar]
14. D. González-Patiño, Y. Villuendas-Rey, A. Argüelles and F. Karray, “A novel bio-inspired method for early diagnosis of breast cancer through mammographic image analysis,” Applied Sciences, vol. 9, no. 21, pp. 4492, 2019. [Google Scholar]
15. T. Wan, J. Cao, J. Chen and Z. Qin, “Automated grading of breast cancer histopathology using cascaded ensemble with combination of multi-level image features,” Neurocomputing, vol. 229, pp. 34–44, 2017. [Google Scholar]
16. M. Alkhaleefah, S. Ma, Y. Chang, B. Huang, P. Chittem et al., “Double-shot transfer learning for breast cancer classification from x-ray images,” Applied Sciences, vol. 10, no. 11, pp. 3999, 2020. [Google Scholar]
17. H. Irshad, “Automated mitosis detection in histopathology using morphological and multi-channel statistics features,” Journal of Pathology Informatics, vol. 4, no. 1, pp. 10, 2013. [Google Scholar]
18. D. Cai, X. Sun, N. Zhou, X. Han and J. Yao, “Efficient mitosis detection in breast cancer histology images by RCNN,” in Proc. Int. Symp. on Biomedical Imaging, Venice, Italy, pp. 919–922, 2019. [Google Scholar]
19. B. Q. Huynh, H. Li and M. L. Giger, “Digital mammographic tumor classification using transfer learning from deep convolutional neural networks,” Journal of Medical Imaging, vol. 3, no. 3, pp. 034501, 2016. [Google Scholar]
20. P. Sudharshan, C. Petitjean, F. Spanhol, L. Oliveira, L. Heutte et al., “Multiple instance learning for histopathological breast cancer image classification,” Expert System Application, vol. 117, pp. 103–111, 2019. [Google Scholar]
21. A. M. Khan, A. F. Mohammed, S. A. Al-Hajri, H. M. Al Shamari, U. Qidwai et al., “A novel system for scoring of hormone receptors in breast cancer histopathology slides,” in Proc. Middle East Conf. on Biomedical Engineering, Doha, Qatar, pp. 155–158, 2014. [Google Scholar]
22. M. Banys-Paluchowski, F. Reinhardt and T. Fehm, “Circulating tumor cells in metastatic breast cancer: Clinical applications and future possibilities,” Applied Sciences, vol. 10, no. 9, pp. 3311, 2020. [Google Scholar]
23. D. Tellez, M. Balkenhol, I. O. Holler, R. van de Loo, R. Volges et al., “Whole-slide mitosis detection in H&E breast histology using PHH3 as a reference to train distilled stain-invariant convolutional networks,” IEEE Transaction Medical Imaging, vol. 37, no. 9, pp. 2126–2136, 2018. [Google Scholar]
24. F. A. Spanhol, L. S. Oliveira, C. Petitjean and L. Heutte, “A dataset for breast cancer histopathological image classification,” IEEE Transaction Biomedical Engineering, vol. 63, no. 7, pp. 1455–1462, 2016. [Google Scholar]
25. S. Oliveira, J. Pinto, T. Goncalves, R. Marques, M. Cardos et al., “Weakly-supervised classification of HER2 expression in breast cancer haematoxylin and eosin stained slides,” Applied Sciences, vol. 10, no. 14, pp. 4728, 2020. [Google Scholar]
26. D. C. Ciresan, A. Giusti, L. M. Gambardella and J. Schmidhuber, “Mitosis detection in breast cancer histology images using deep neural networks,” in Proc. Medical Image Computing and Computer-Assisted Intervention, Toronto, Canada, pp. 411–418, 2011. [Google Scholar]
27. H. Irshad, S. Jalali, L. Roux, D. Racoceanu, L. J. Hwee et al., “Automated mitosis detection using texture, SIFT features and HMAX biologically inspired approach,” Journal of Pathology Informatics, vol. 4, no. 2, pp. 12, 2013. [Google Scholar]
28. H. Irshad, L. M. Kouhsari, G. Waltz, O. Bucur, J. A. Nowak et al., “Crowdsourcing image annotation for nucleus detection and segmentation in computational pathology,” Pacific Symp. on Biocomputing, pp. 294–305, 2015. [Google Scholar]
29. A. M. Khan, K. Sirinukunwattana and N. Rajpoot, “Geodesic geometric mean of regional covariance descriptors as an image-level descriptor for nuclear atypia grading in breast histology images,” in Proc. Machine Learning in Medical Imaging, Cambridge, MA, USA, pp. 101–108, 2014. [Google Scholar]
30. S. Doyle, S. Agner, A. Madabhushi, M. Feldman and J. Tomaszewski, “Automated grading of breast cancer histopathology using spectral clustering with textural and architectural image features,” in Proc. Biomedical Imaging: from Nano to Macro, Paris, Farance, pp. 496–499, 2008. [Google Scholar]
31. C. Abirami, R. Harikumar and S. Chakravarthy, “Performance analysis and detection of micro calcification in digital mammograms using wavelet features,” in Proc. Int. Conf. on Wireless Communications, Chennai, India, pp. 2327–2331, 2016. [Google Scholar]
32. T. Mahmood, M. Arsalan, M. Owais, M. B. Lee and K. R. Park, “Artificial intelligence-based mitosis detection in breast cancer histopathology images using faster R-cNN and deep CNNs,” Journal of Clinical Medicine, vol. 9, no. 3, pp. 749, 2020. [Google Scholar]
33. G. Jiménez and D. Racoceanu, “Deep learning for semantic segmentation vs. classification in computational pathology: Application to mitosis analysis in breast cancer grading,” Frontiers in Bioengineering and Biotechnology, vol. 7, pp. 4583–4611, 2019. [Google Scholar]
34. H. Hecht, M. H. Sarhan and V. Popovici, “Disentangled autoencoder for cross-stain feature extraction in pathology image analysis,” Applied Sciences, vol. 10, no. 18, pp. 6427, 2020. [Google Scholar]
35. L. Roux, D. Racoceanu, F. Capron, J. Calvo, E. Attieh et al., “MITOS & ATYPIA detection of mitosis and evaluation of nuclear atypia score in breast cancer histological images, 2014. [Online]. Available: https://mitos-atypia-14.grand-challenge.org”. [Google Scholar]
36. T. Miyato, S. I. Maeda, M. Koyama and S. Ishii, “Virtual adversarial training: A regularization method for supervised and semi-supervised learning,” IEEE Transactions on Pattern Analysis and Machine Intelligence, vol. 41, no. 8, pp. 1979–1993, 2019. [Google Scholar]
37. J. Wang and L. Perez, “The effectiveness of data augmentation in image classification using deep learning,” Convolutional Neural Networks Visual Recognition, vol. 11, pp. 1–8, 2017. [Google Scholar]
38. Q. Xie, Z. Dai, E. Hovy, M. -T. Luong and Q. V. Le, “Unsupervised data augmentation for consistency training,” in 34th Conference on Neural Information Processing Systems, Vancouver, Canada, pp. 121–132, 2019. [Google Scholar]
39. J. Shijie, W. Ping, J. Peiyi and H. Siping, “Research on data augmentation for image classification based on convolution neural networks,” in Proc. Chinese Automation Congress, Jinan, China, pp. 4165–4170, 2017. [Google Scholar]
40. A. Sakai, Y. Minoda and K. Morikawa, “Data augmentation methods for machine-learning-based classification of bio-signals,” in Proc. Biomedical Engineering Int. Conf., Hokkaido, Japan, pp. 1–4, 2017. [Google Scholar]
41. L. Hou, D. Samaras, T. Kurc, Y. Gao, J. Davis et al., “Patch-based convolutional neural network for whole slide tissue image classification,” in Proc. Computer Vision and Pattern Recognition, Los Vegas, USA, pp. 2424–2433, 2016. [Google Scholar]
42. P. Ginter, A. Sattar, A. Chagpar, P. Wilson and M. Harigopal, “Histologic grading of breast carcinoma: A multi-institution study of interobserver variation using virtual microscopy,” Modern Pathology, vol. 34, pp. 701–709, 2020. [Google Scholar]
43. Y. Zhou, A. Amimeur, C. Jiang, D. Dou, R. Jin et al., “Density-aware local siamese autoencoder network embedding with autoencoder graph clustering,” in Proc. Big Data, Seattle, WA, USA, pp. 1162–1167, 2018. [Google Scholar]
44. S. Moorthi, I. Misra, R. Kaur, N. Darji and R. Ramakrishnan, “Kernel based learning approach for satellite image classification using support vector machine,” in Proc. Recent Advances in Intelligent Computational Systems, Trivandrum, India, 2011, pp. 107–110. [Google Scholar]
45. J. Xu, L. Xiang, R. Hang and J. Wu, “Stacked sparse autoencoder (SSAE) based framework for nuclei patch classification on breast cancer histopathology,” in Proc. Int. Sympo. on Biomedical Imaging, Beijing, China, 2014, pp. 999–1002, 2014. [Google Scholar]
46. N. Rahimi, F. Eassa and L. Elrefaei, “An ensemble machine learning technique for functional requirement classification,” Symmetry, vol. 12, no. 10, pp. 1601, 2020. [Google Scholar]
47. M. F. Siddiqui, A. W. Reza and J. Kanesan, “An automated and intelligent medical decision support system for brain MRI scans classification,” PLoS One, vol. 10, no. 8, pp. 1–16, 2015. [Google Scholar]
48. Y. Komiyama, M. Banno, K. Ueki, G. Saad and K. Shimizu, “Automatic generation of bioinformatics tools for predicting protein-ligand binding sites,” Bioinformatics, vol. 32, no. 6, pp. 901–907, 2016. [Google Scholar]
49. D. Bazazeh and R. Shubair, “Comparative study of machine learning algorithms for breast cancer detection and diagnosis,” in Proc. Electronic Devices, Systems and Applications, Ras Al Khaimah, UAE, pp. 2–5, 2017. [Google Scholar]
50. D. Liu, Y. Tian, R. Bie and Y. Shi, “Self-universum support vector machine,” Personal and Ubiquitous Computing, vol. 18, no. 8, pp. 1813–1819, 2014. [Google Scholar]
51. S. Kiranmai and A. Laxmi, “Data mining for classification of power quality problems using WEKA and the effect of attributes on classification accuracy,” Protection and Control Model Power System, vol. 3, no. 1, pp. 1–12, 2018. [Google Scholar]
52. M. Ahmad, N. Al-Shayea, X. -W. Tang, A. Jamal, H. Al-Ahmadi et al., “Predicting the pillar stability of underground mines with random trees and C4.5 decision trees,” Applied Sciences, vol. 10, no. 18, pp. 6486, 2020. [Google Scholar]
53. W. Yu and Y. Xiaowei, “Application of decision tree for MRI images of premature brain injury classification,” in Proc. Computer Science & Education, Nagoya, Japan, pp. 792–795, 2016. [Google Scholar]
54. M. F. Siddiqui, G. Mujtaba, A. W. Reza and L. Shuib, “Multi-class disease classification in brain MRIs using a computer-aided diagnostic system,” Symmetry, vol. 9, no. 3, pp. 37, 2017. [Google Scholar]
55. A. Bhandari, S. Sharma, R. Uyyala, R. Pal and M. Verma, “Reversible data hiding using multi-layer perceptron based pixel prediction,” in Proc. Advances in Information Technology, Bangkok, Thailand, pp. 1–8, 2020. [Google Scholar]
56. V. Mitko, J. Pluim, V. Diest and V. Viergever, “Breast cancer histopathology image analysis: A review,” IEEE Transaction on Biomedical Engineering, vol. 61, no. 5, pp. 1400–1411, 2014. [Google Scholar]
57. J. Xu, L. Xiang, Q. Liu, H. Gilmore, J. Wu et al., “Stacked sparse autoencoder (SSAE) for nuclei detection on breast cancer histopathology images,” IEEE Transaction on Medical Imaging, vol. 35, no. 1, pp. 119–130, 2016. [Google Scholar]
 | This work is licensed under a Creative Commons Attribution 4.0 International License, which permits unrestricted use, distribution, and reproduction in any medium, provided the original work is properly cited. |