DOI:10.32604/cmc.2022.022264
| Computers, Materials & Continua DOI:10.32604/cmc.2022.022264 | |
| Article |
Citrus Diseases Recognition Using Deep Improved Genetic Algorithm
1Department of Computer Science, HITEC University Taxila, Taxila, Pakistan
2College of Computer Engineering and Sciences, Prince Sattam Bin Abdulaziz University, Al-Khraj, Saudi Arabia
3Department of Computer Science, Bahria University, Islamabad, Pakistan
4Department of EE, HITEC University Taxila, Taxila, Pakistan
5Department of ICT Convergence, Soonchunhyang University, Korea
6Department of Computer Science and Engineering, Soonchunhyang University, Korea
*Corresponding Author: Yunyoung Nam. Email: ynam@sch.ac.kr
Received: 02 August 2021; Accepted: 30 September 2021
Abstract: Agriculture is the backbone of each country, and almost 50% of the population is directly involved in farming. In Pakistan, several kinds of fruits are produced and exported the other countries. Citrus is an important fruit, and its production in Pakistan is higher than the other fruits. However, the diseases of citrus fruits such as canker, citrus scab, blight, and a few more impact the quality and quantity of this Fruit. The manual diagnosis of these diseases required an expert person who is always a time-consuming and costly procedure. In the agriculture sector, deep learning showing significant success in the last five years. This research work proposes an automated framework using deep learning and best feature selection for citrus diseases classification. In the proposed framework, the augmentation technique is applied initially by creating more training data from existing samples. They were then modifying the two pre-trained models named Resnet18 and Inception V3. The modified models are trained using an augmented dataset through transfer learning. Features are extracted for each model, which is further selected using Improved Genetic Algorithm (ImGA). The selected features of both models are fused using an array-based approach that is finally classified using supervised learning classifiers such as Support Vector Machine (SVM) and name a few more. The experimental process is conducted on three different datasets-Citrus Hybrid, Citrus Leaf, and Citrus Fruits. On these datasets, the best-achieved accuracy is 99.5%, 94%, and 97.7%, respectively. The proposed framework is evaluated on each step and compared with some recent techniques, showing that the proposed method shows improved performance.
Keywords: Citrus diseases; data augmentation; deep learning; features selection; features fusion
Fruits diseases are the simplest problem that has significantly impacted the production and quality in the agriculture sector [1]. Identifying fruits diseases at the early stages is one of the most critical tasks for improving agriculture production [2]. The citrus organic product industry is one of the main organic product enterprises in the world, with development in 137 nations [3]. The ceaseless stock of Citrus is fundamental for people's sound way of life. Its high Vitamin-C substance and other helpful supplements offer various points of interest to the human body contrasted with different natural products [4]. The major citrus diseases are Anthracnose [5], Canker, Scabies, Black Spot [6], and Sandpaper Rust [7].
In computer vision, many techniques are introduced in the literature for fruits diseases recognition [8]. The researchers of CV followed the four steps process: image contrast enhancement, symptom extraction, features extraction and reduction, and finally classification [9]. In contrast stretching step, the visual quality of an image is improved using some image processing filtering techniques like Gaussian filter etc., [10]. In the symptoms extraction step, the infected regions are segmented using several segmentation techniques such as K-Means clustering, Watershed segmentation, and Saliency methods [11]. In the feature extraction step, shape, texture, point, and colour features are extracted, which are later reduced using some reduction techniques like PCA etc. [12]. In the last step, the reduced feature vector is passed into the classifiers for final classification. These techniques are useful when the size of the input dataset is not much higher. For the high dimensional dataset, these traditional techniques are not performed well.
Recently, deep learning showed a significant impact in agriculture using high dimensional data [13]. Convolutional Neural Network (CNN) is a type of deep learning which includes several hidden layers utilized for automated features extraction [14]. A CNN model is a more powerful form of deep learning which performed better for high dimensional datasets. A simple CNN model includes several hidden layers such as a convolutional layer, pooling layer, activation layer, normalization layer, fully connected layer, and output layer [15]. Many pre-trained deep models are publically available for feature extraction, such as GoogleNet [16], AlexNet, and ResNet.
The researchers of CV recently used these deep pre-trained models for features extraction [17]. Extracted deep features are later reduced by reduction techniques such as entropy controlled approach and classified using supervised learning algorithms [18]. The existing studies related to agriculture did not focus on the fusion and features and selection of best features. The fusion of deep features of different deep learning models is a new research motivation. In the agriculture domain, the fusion process can perform better. Another important step is feature selection. The main purpose of this step is minimizes the number of predictors, which are later decreases the entire system computational time.
The key problems of citrus fruits diseases that focus on in the article are as follows: i) The identification of plant disease using classical techniques is the problem of high computational time. In this type of technique, hand-crafted features are extracted, which is not a better solution for an automated system; ii) A handsome amount of data is required for the training of a dep learning model; however, some citrus diseases have very limited training data, which causes a problem of training a new model; iii) In the data augmentation phase, the general practice is performing geometric transformations; however, augmentation by a particular type of process generated alike data, which increases the possibility of over-fitting; iv) The multiclass classification is another problem due to the composite nature of each disease. Moreover, each disease has several common symptoms that cause a misclassification problem, and v) Similar variations in fruit characteristics such as colour and texture create uncertainty of the correct identification in their appropriate category. Our major contributions in this study are as follows:
• Proposed a sequential algorithm for data augmentation. In this algorithm, images are saved automatically after each implemented operation.
• Two deep learning models are fine-tuned and trained on three different citrus datasets. Then, high-level features are extracted from the deep layers.
• Proposed a Modified Genetic Algorithm (MGA) for the best feature selection.
• Selected features of both deep models are fused using an array size-based approach.
• Comparison is conducted among all hidden steps of the proposed framework to analyze which step is better performed.
As a rest of the manuscript, the related work is presented in Section 2, proposed work is discussed in Section 3, results of the proposed framework are presented in Section 4. In the end, conclusion has been added.
Recently, many computer vision (CV) and deep learning techniques [19] are introduced to identify plant diseases in agriculture [20]. In general, agriculture has been an important area of research in the field of CV over the past decade [21]. Many CV researchers have developed strategies for diagnosing and classifying fruit diseases [2]. They focused on certain key steps such as pre-processing [22] of input data, partial detection [23], segmentation [24], feature removal, and final separation. Barman et al. [25] introduced two types of CNN, such as Self-Structured CNN (SSCNN) and MobileNet for citrus leaf separators. In this work, initially, the database was set up using Smartphones. After that, both in-depth study models were trained on the same datasets of the citrus plants. Zhong et al. [26] presented a production model of the novel and conditional opposing autoencoders (CAAE) in a zero-shot instruction to address the acceptance of Citrus aurantium L. In this work, they produced artificial samples from both visual and non-visual classes. Synthetic samples are used to differentiate training to improve the problem of inequality. The initial process of diagnosing citrus plant diseases includes image processing, feature removal, trait selection, and classification methods. The accuracy of zero recognition was 53.4% which is 50.4% higher than existing techniques.
Janarthan et al. [27] presented a deep metric learning-based framework for citrus disease detection from sparse data. In this work, the database has been processed using depleted devices, such as mobile phones. They introduced a class action-based network patch consisting of various modules such as focus, collection, and simple neural network classes to differentiate citrus illness. Khalifa et al. [28] presented an automated system for potato leaf blight diagnosis. A deep CNN architecture was used, which consists of two basic feature layers. Zhang et al. [29] presented a machine vision approach for classifying citrus surface defects. In this work, the citrus images were preprocessed using the Fuzzy C-Means algorithm (FCM) and Gray Wolf Optimizer (GWO) algorithm. Then, the infected region of Citrus is detected using upgraded CNN.
James et al. [30] presented an automated system for classifying ten types of apple fruit diseases. The presented method was based on the Hybrid Neural Clustering (HNC) Classifier. The classifier receives the outcome of the feature extraction vector as input. The main strength of this approach was region extraction using K-Means Clustering. The extracted regions are evaluated using a Feed Forward Back Propagation Neural Network (FFBP). Safdar et al. [31] presented an automated system for citrus fruit diseases recognition. In the presented work, five basic steps are performed: contrast enhancement, disease recognition, feature extraction and reduction, features integration, and classification. Three different image datasets were used for the experimental process and achieved an accuracy of 96.5%. Saeed et al. [15] presented a deep learning and PLS based features fusion framework for plant diseases recognition. Features are extracted from the two fully connected layers such as FC6 and FC7 of the VGG19 deep model, later fused using the PLS approach. The integration and selection with the PLS increase the recognition accuracy of the identification and reduce the testing and training time.
In summary, the researcher of computer vision mostly used deep learning techniques for fruits diseases recognition. The focused-on data preprocessing in which they performed contrast enhancement. In the later step, they extract features and performed some reduction techniques like PCA. In the latter, they classified using machine learning algorithms. However, from the recent studies, they did not focus on fusion and data augmentation steps. Also, they did not show interest in the feature selection techniques. This research work proposes a new framework based on deep learning feature selection and fusion for fruits diseases recognition.
Three datasets are utilized in this work for the experimental process, such as the Hybrid Citrus dataset, Citrus Leaves dataset, and Citrus Fruits dataset. The Hybrid Citrus dataset has 3988 images, the Citrus Fruits dataset has 1328 images, and the Leaves dataset has 2184 images. The nature of all images of the three datasets is RGB. Each dataset consists of the following diseases: anthracnose, citrus greening, black spot, canker, citrus scab, Melanose, and healthy. The nature images of the selected datasets is in RGB format and the size of each image is
This work proposes an automated framework for citrus leaf and fruit disease recognition using an ensemble of deep learning models. The architecture diagram of the proposed framework is shown in Fig. 1. This figure shows that the initial augmentation technique was applied to the original images by creating more training data from existing samples. Then modifying the two pre-trained models named Resnet18 and Inception V3. The modified models are trained using contrast-enhanced images through transfer learning. Features are extracted for each model, which is later refined using MGA based feature selection. The selected features are finally classified using supervised learning classifier such as SVM. The experimental process is conducted on the collected citrus dataset and compared with existing techniques in terms of accuracy. The detail of each step is given below:
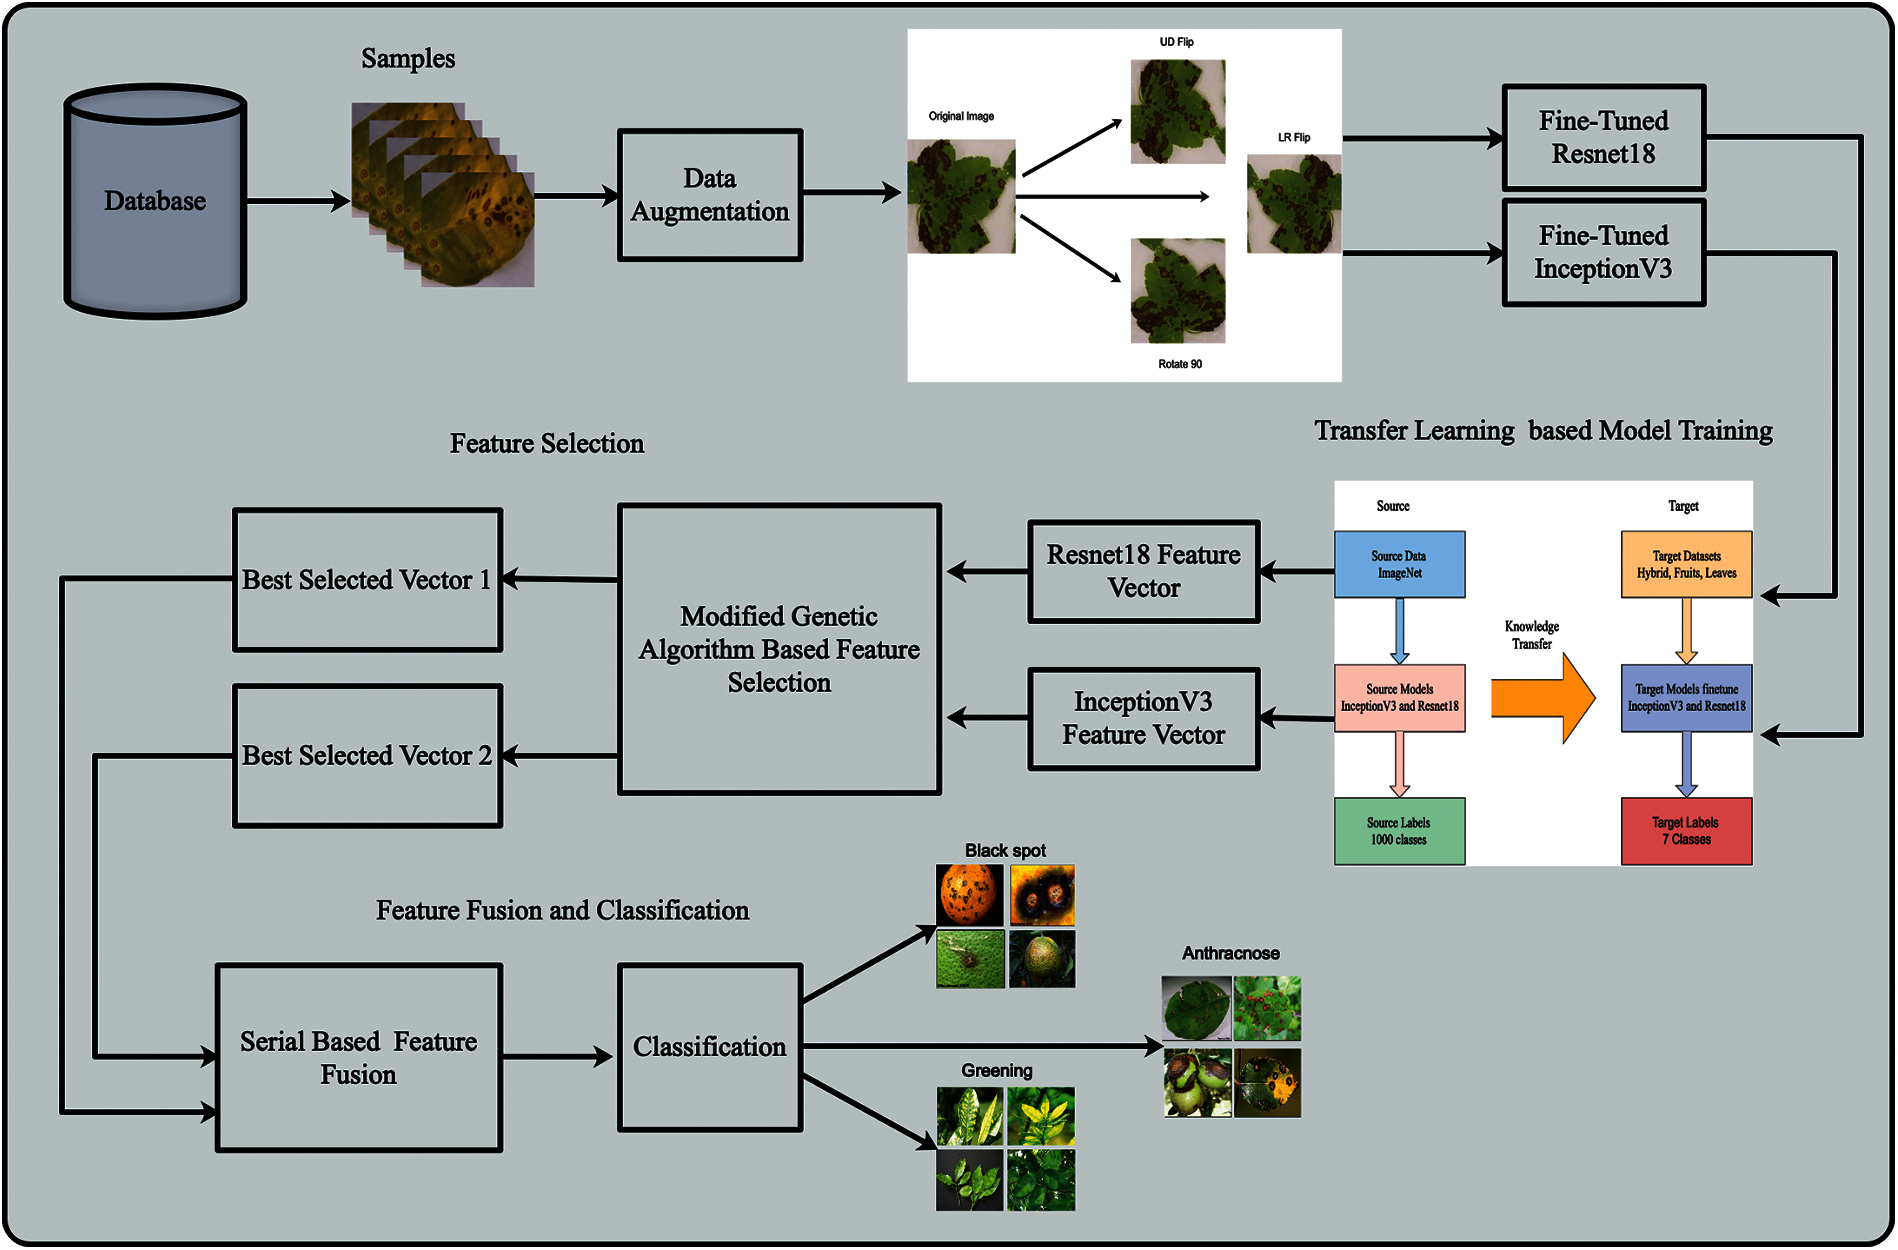
Figure 1: Architecture of proposed framework for citrus disease recognition
In this work, the data augmentation step is performed to address the problem of less size imaging datasets. For the deep learning model training, a massive number of training data always gives better performance. Therefore, three operations, such as rotation at 90 degrees, flipping at the vertical direction (UD), and flip at the horizontal direction (LR), are performed in this work. In this work, three datasets are utilized for the experimental process: Hybrid dataset, Citrus Leaves Dataset, and Citrus Fruits Dataset. Originally, this dataset consists of 285 images, 609 images, and 150 images, respectively. After the augmentation step, each step's number of images reached 3988, 2184, and 1328, respectively. These augmented datasets are further utilized for the models training.
4.2 Convolutional Neural Network
Convolutional Neural Network (CNN) is a deep learning method used to analyze the visual image information [32]. It takes an input image and assigns learnable weights and biases for objects in the image, allowing it to distinguish between them. Normally, a CNN is built for working with two-dimensional image data; however, it may also be utilized with one-dimensional and three-dimensional data. In general, a simple CNN model for image classification consists of various layers such as input layer, convolutional layer, activation layer (ReLU), pooling layer, fully connected layer or feature layer, and classification layer.
Transfer learning (TL) is a learning new task through the transfer of knowledge from another existing task, which has already been learned. The TL process consists of two main components: i) source domain and ii) target domain. The advantage of TL is to train a pre-trained model for a new task with less data because a CNN model always required many images for the training purpose.
Giving a source domain
With TL, deep neural networks can learn very complicated relationships leading to overfitting. The visual process of TL is illustrated in Fig. 2. In this figure, it is noted two domains are defined as source and target. In the source domain, two deep models are selected, which are fine-tuned in the target domain. In this work, three datasets are used in the target domain, where the maximum number numbers of classes are seven.
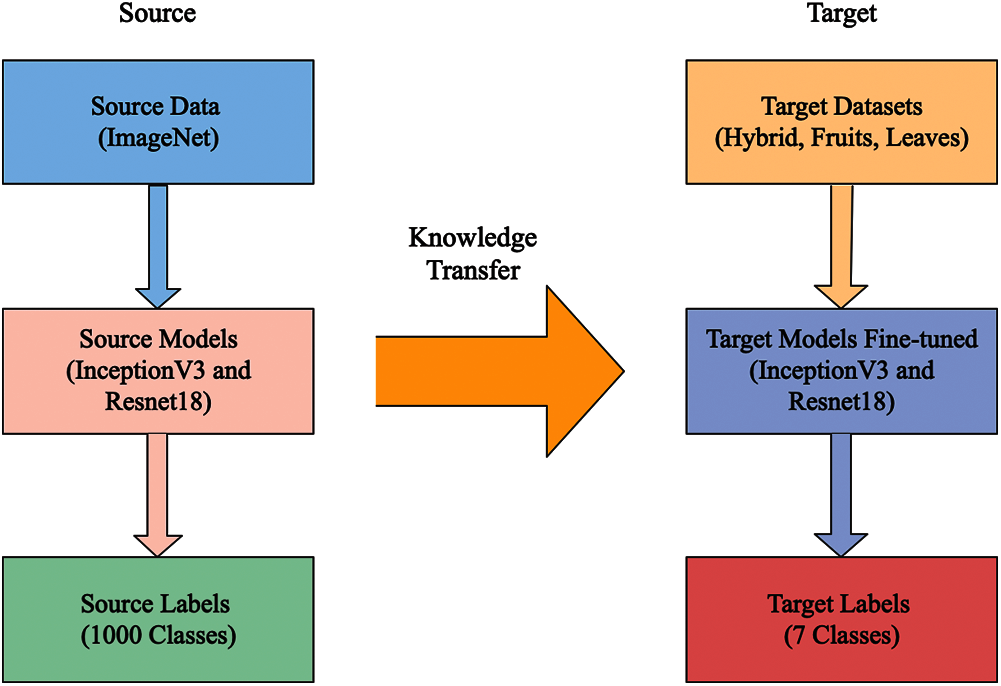
Figure 2: The schematic figure of transfer learning
4.4 Feature Extraction Using Inception V3 CNN
Inception V3 is becoming popular and performed well in image processing for object classification. This model consists of max pooling, average pooling, convolutions, dropouts, concate, and fully connected (FC) layers. For the classification layer, the SoftMax layer is added. Initially, this model was trained on ImageNet Dataset, which includes millions of images. As compared to Inception V1, this model is computationally less and more efficient. This model includes several kinds of filters such as
In the fine-tuning phase, the output of the last FC layer was 1000; however, in the proposed framework, the output of the selected dataset is seven. Therefore, it is essential to update this layer. For this purpose, the original FC layer was removed and added a new FC layer. For the new input layer, the input classes are seven, and mini-batch size is 64. Moreover, the learning rate and learning type are 0.0001 and Stochastic Gradient Descent (SGD). After this FC layer, the SoftMax and Classification layers are connected and trained using transfer learning. After training of a modified model, features are extracted from the average pool layer. On this layer, the dimension of extracted features is
4.5 Feature Extraction Using ResNet-18 CNN
ResNet-18 is an 18-layer deep CNN model, introducing the idea of residual learning. The residual neural network (ResNet) is designed to address vanishing/exploding gradients and accuracy loss. In general, these issues arise as the depth of the pool gets deeper. A residual connection essentially creates a shortcut in a sequential network by making the output of an earlier layer available as an input to a later layer. Instead of being concatenated with the later activation, the earlier output is combined, assuming that both activations are the same size. Mathematically, it can be defined as follows:
An output of the
where
The vanishing gradient problem is not encountered in the ResNet due to the backpropagation. In the fine-tuning phase, the original FC layer was removed, and added a new FC layer. For the new input layer, the input classes are seven, and mini-batch size is 64. Moreover, the other variables such as learning rate, mini batch size, and learning type are 0.0001, 64, and SGD. After the updated FC layer, the SoftMax and Classification layers are added and connected with previous layers. After that, this modified model was trained using transfer learning (TL). Features are extracting from the global average pool layer, where the dimension of extracted features is
4.6 Feature Selection Using Modified Genetic Algorithm
Genetic Algorithms (GA) is an optimization methodology that uses population-based and algorithmic heuristics search to replicate man's natural evolution process. GA decreases computational complexity and speeds up the verification process. In this proposed framework, an Improved Genetic Algorithm (ImGA) is proposed for the best feature selection and to reduce the computational time. In the ImGA, initially initialize the parameters of GA and then check the fitness. A single-layered feed-forward neural network is selected as a fitness function. The later step is to select the features using Roulette Wheel and performed uniform crossover and mutation. After the mutation step, check the stopping criteria, such as number of iterations. Once all iterations are performed, and the selected feature vector is obtained, compute the absolute entropy vector. The purpose of this step is to remove the negative features if selected in the previous step. After this step, again fitness function is applied and check the criteria. If the criteria are not met, update the features in the previous step, else consider as a final selected feature vector. Visually, this process is shown in Fig. 3. A brief description of each step is given below.
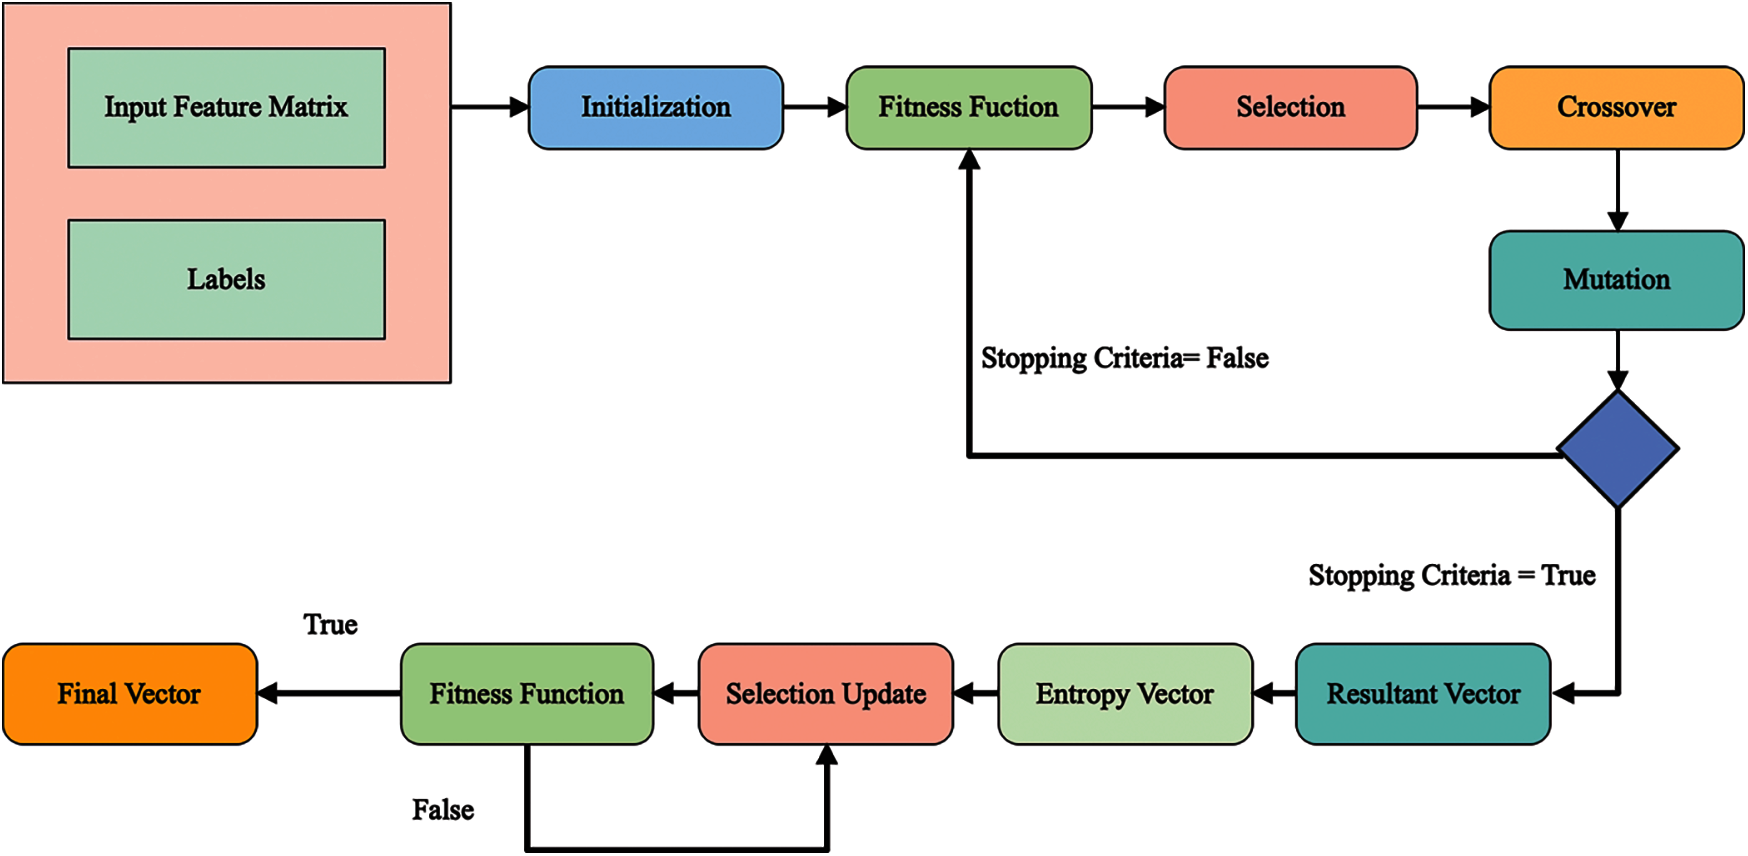
Figure 3: Architecture of ImGA for best feature selection
4.6.1 Parameter Initialization
This stage fixes the number of iterations, crossover rate, population size, number of offspring, mutation rate, number of mutants, mutation rate, and selection pressure. In the proposed framework, the number of populations is 50, the crossover rate is 0.5, the mutation rate is 0.2, the selection pressure is 7, and a total number of iterations are 200.
After selecting population size, each population's position is assigned at random, and populations are ranked according to their fitness function. Finally, the best population's cost is calculated and kept for future usage. Here the population is representing the number of features.
The Crossover is a genetic operator that is passed down through generations in chromosomes. The crossover function determines GA's performance and combining multiple parent solutions to create a child solution. Mathematically, the process of Crossover is defined as follows:
where
To add some distinctive features to the offspring, a mutation operation is conducted for each offspring generated by a crossover operation. Mathematically, it is defined as follows:
where
4.6.4 Selection and Reproduction
The reproduction process is carried out on selected individuals, and each offspring's fitness value is calculated. The individuals with the lowest cost are chosen for a new generation from the old population and offspring chromosomes. After this step, features are encoded into a resultant vector. This process is continuing until, the stopping criteria did not full fill. The features of each iteration are put in the fitness function if stopping criteria nor meet. Mathematically, the fitness function is defined as follows:
Consider a single-hidden layer feedforward neural network (SLFN) that consists of an input layer, a hidden layer and an output layer. Consider a training dataset X with N training samples, X =
where
where L ∈
4.6.5 Entropy Vector Selection
After the first step feature selection, entropy vector is computed from GA selected vector. Through entropy formulation, features are further refined and set a threshold function. Through threshold function, features are selected and passed in the fitness function for the fitness value. The threshold function is defined as follows:
This function's output is analyzed using fitness function and if fitness function criteria meet, then pass to the next step. If the criteria did not meet, then repeat the previous step.
This proposed feature selection algorithm name ImGA is applied on both deep feature vectors such as InceptionV3 and ResNet-18. In the output, two best-selected vectors are obtained which are finally fused using a array-based concatenation. Mathematically, this concatenation process is defined as follows:
where,
The proposed method is evaluated on three datasets as detail of datasets is given in Section 3. The 50% images are used for the training purpose, whereas the rest of the 50% images are used for the training purpose. Results of each dataset were calculated using 10-Fold cross-validation. For the learning of CNN models, the learning rate is initilized 0.05, mini-btach size is 32, and number of epochs are 100. Moreover, the learning method is stochastic gradient descent. Multiple classifiers are used to validate the proposed method, and the best of them is selected based on the accuracy value. The selected classifiers are subspace discriminant analysis (SGD), linear discriminant (LDA), linear SVM (L-SVM), fine K-Nearest Neighbor (F-KNN), and few others. Each classifier is validated using several performance measures like recall rate, precision rate, false negative rate (FNR), accuracy, area under the curve (AUC), F1-Score, and testing time. All the simulations are performed on MATLAB2020a on Personal Desktop Computer Corei7 with 16GB of RAM and 8GB Graphics Card.
The proposed method results are computed in five different steps: i) Classification using fine-tuned InceptionV3 deep features; ii) Classification using fine-tuned resnet18 deep features; iii) Classification using best feature selection for fine-tune InceptionV3 deep features; iv) Classification using best feature selection for fine-tune resnet18 deep features, and v) Classification using deep feature fusion.
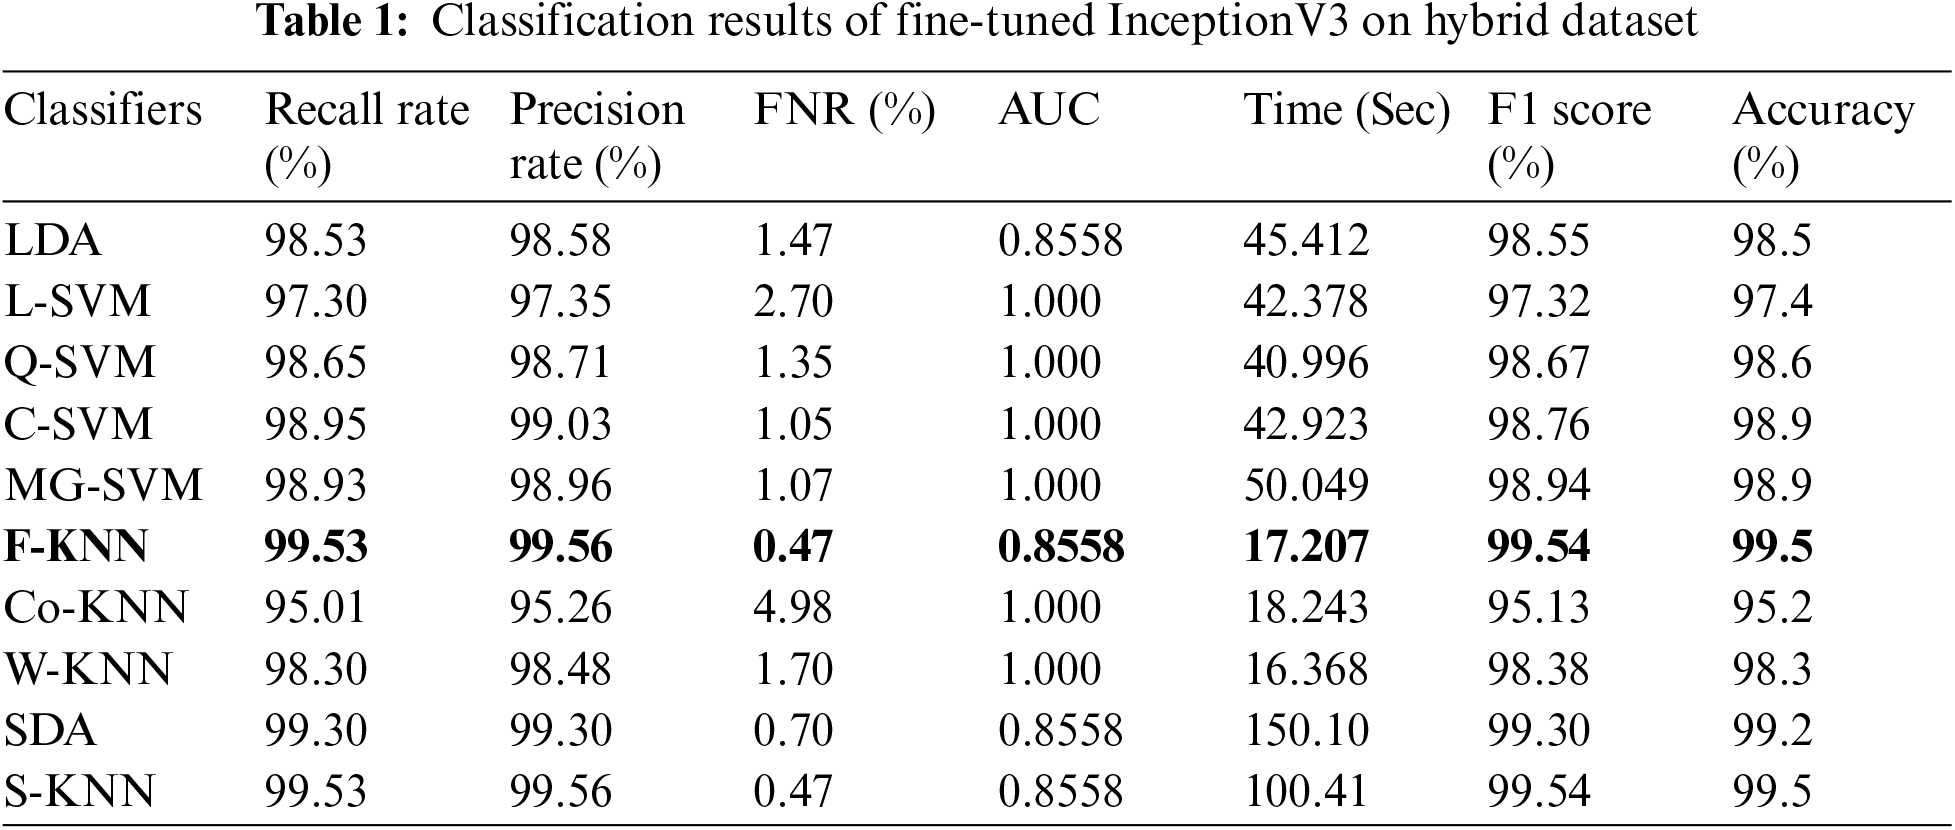
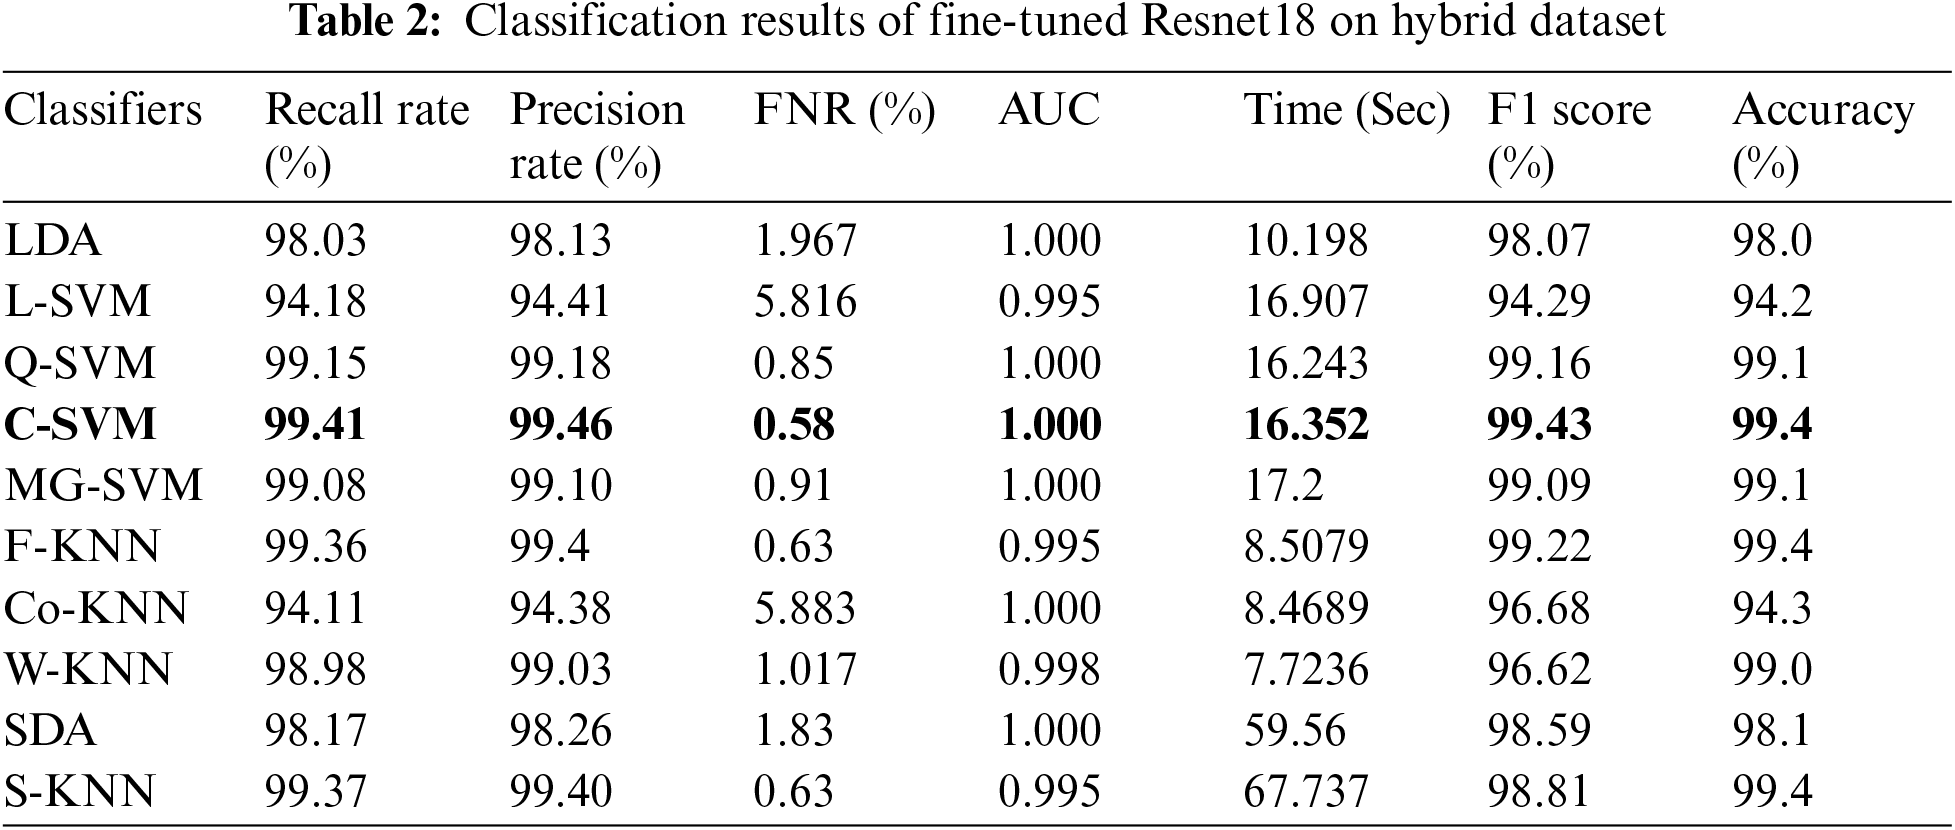
The first step results are given in Tab. 1. In this table, it is noted that Fine KNN achieved the best accuracy of 99.5%. The Subspace KNN also achieved an accuracy of 99.5. During the testing process, the processing time is also measured in this experiment. The lowest noted time is 17.207 (sec) for the Fine KNN classifier, where SDA consumes maximum time of 150.10 (sec). In the second step, Cubic SVM achieved the best accuracy of 99.4%, given in Tab. 2. The minimum computational time of this experiment is 16.352 (sec) for C-SVM, whereas the maximum noted time is 59.56 (sec) on SDA classifier. Based on these results, it is noted that performance of step 2 is better in the form of computational time.
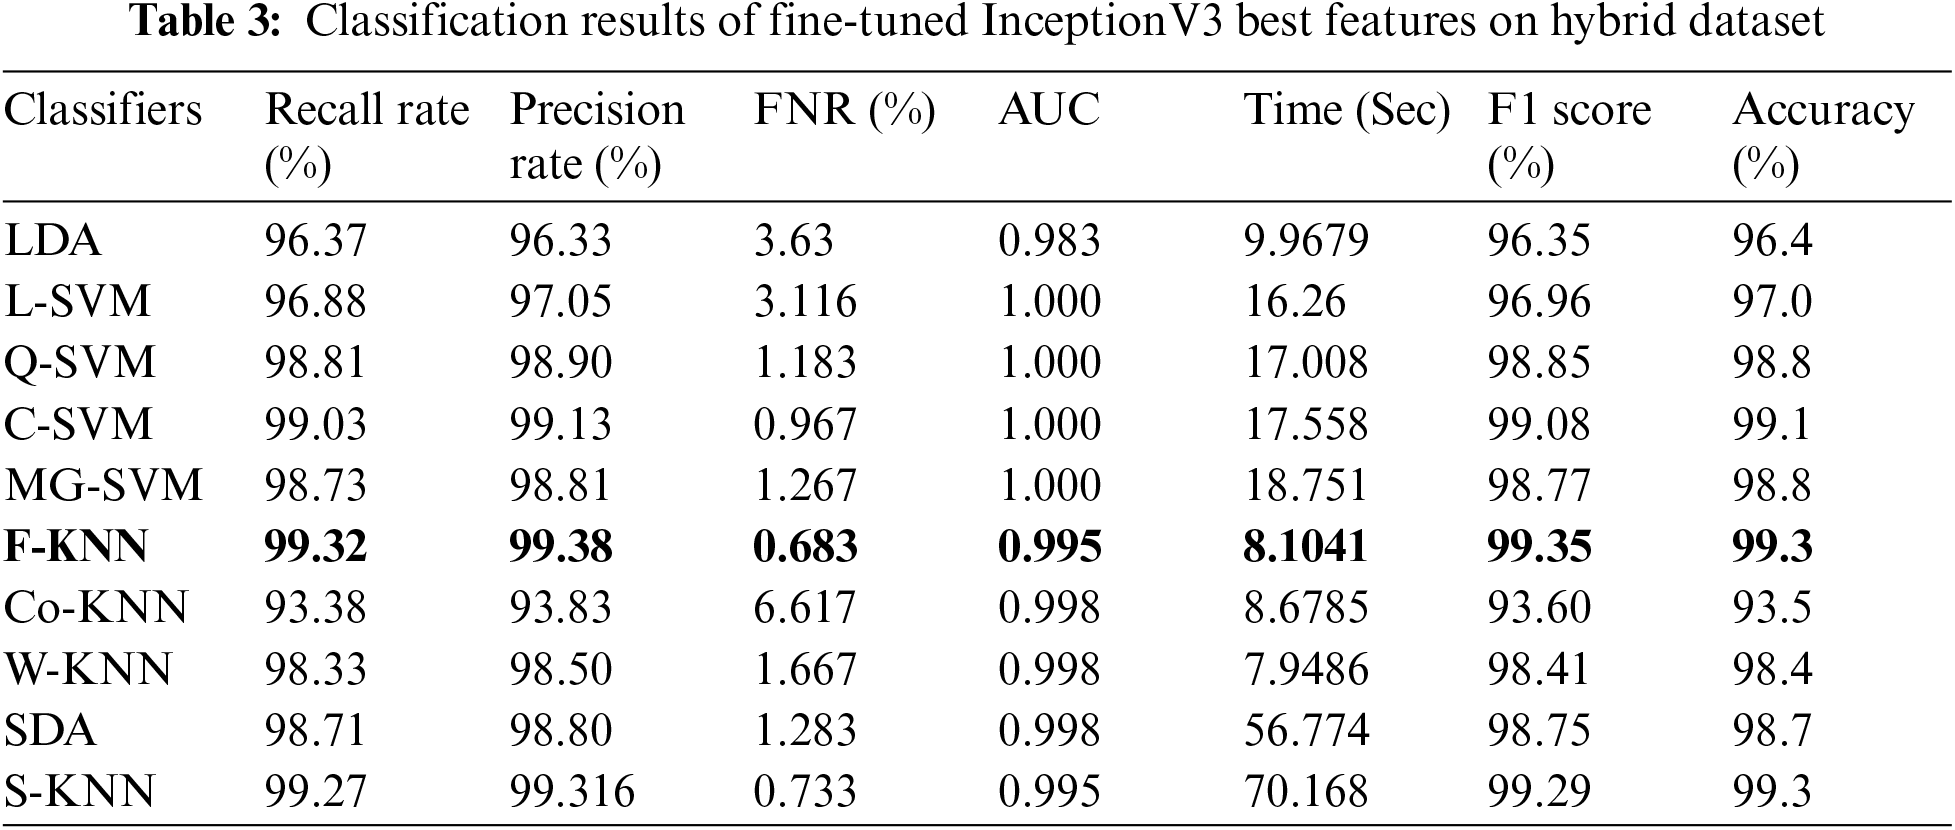
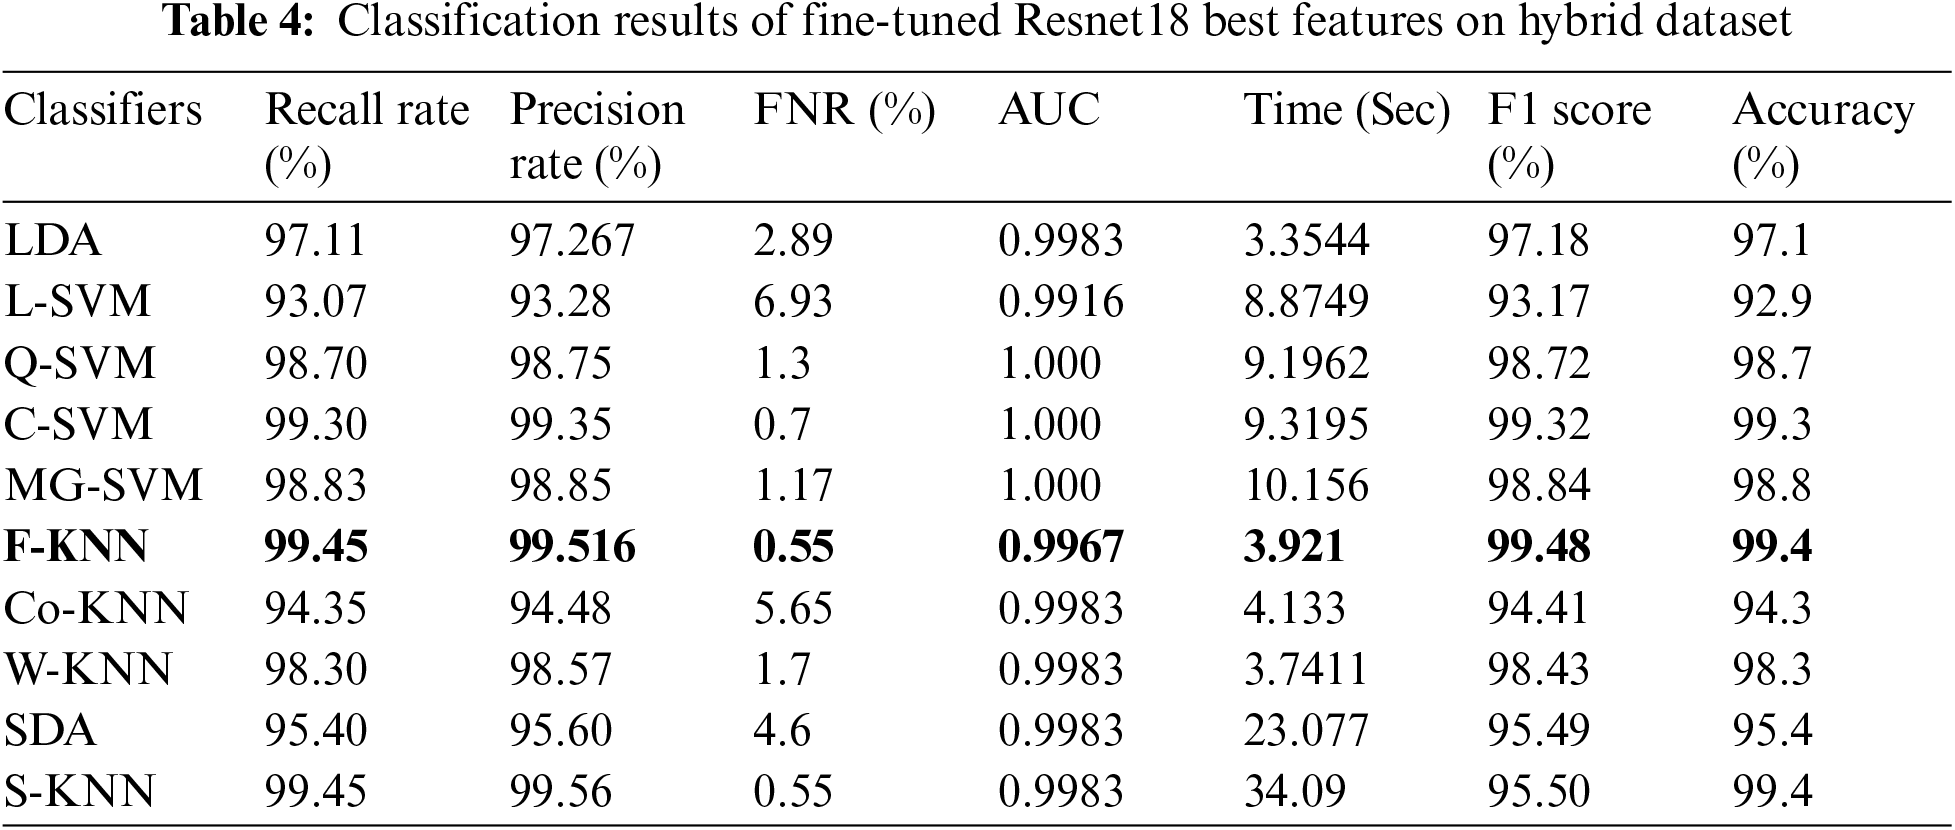
Tab. 3 presented the results of fine-tuned InceptionV3 best features on the hybrid dataset. This table shows the best accuracy of 99.3% for the Fine-KNN classifier. The Subspace KNN also gives the same accuracy of 99.3%. The computational time is also noted, and the minimum time is 8.1041(sec) for the Fine KNN classifier, whereas the highest computational time is 56.7 (sec). The results given in this table show that selecting the best features process improves accuracy and minimizes the computational time compared to the results given in Tab. 1. Similarly, the results of fine-tuned ResNet18 best features on hybrid dataset are given in Tab. 4. From this table, Fine-KNN achieved the best accuracy of 99.48%. The computational time of this experiment is 3.92 (sec), which is significantly better than time noted in Tab. 2. The results given in Tabs. 3 and 4 show that the feature selection step expressively increases the classification accuracy and reduces the computational time.
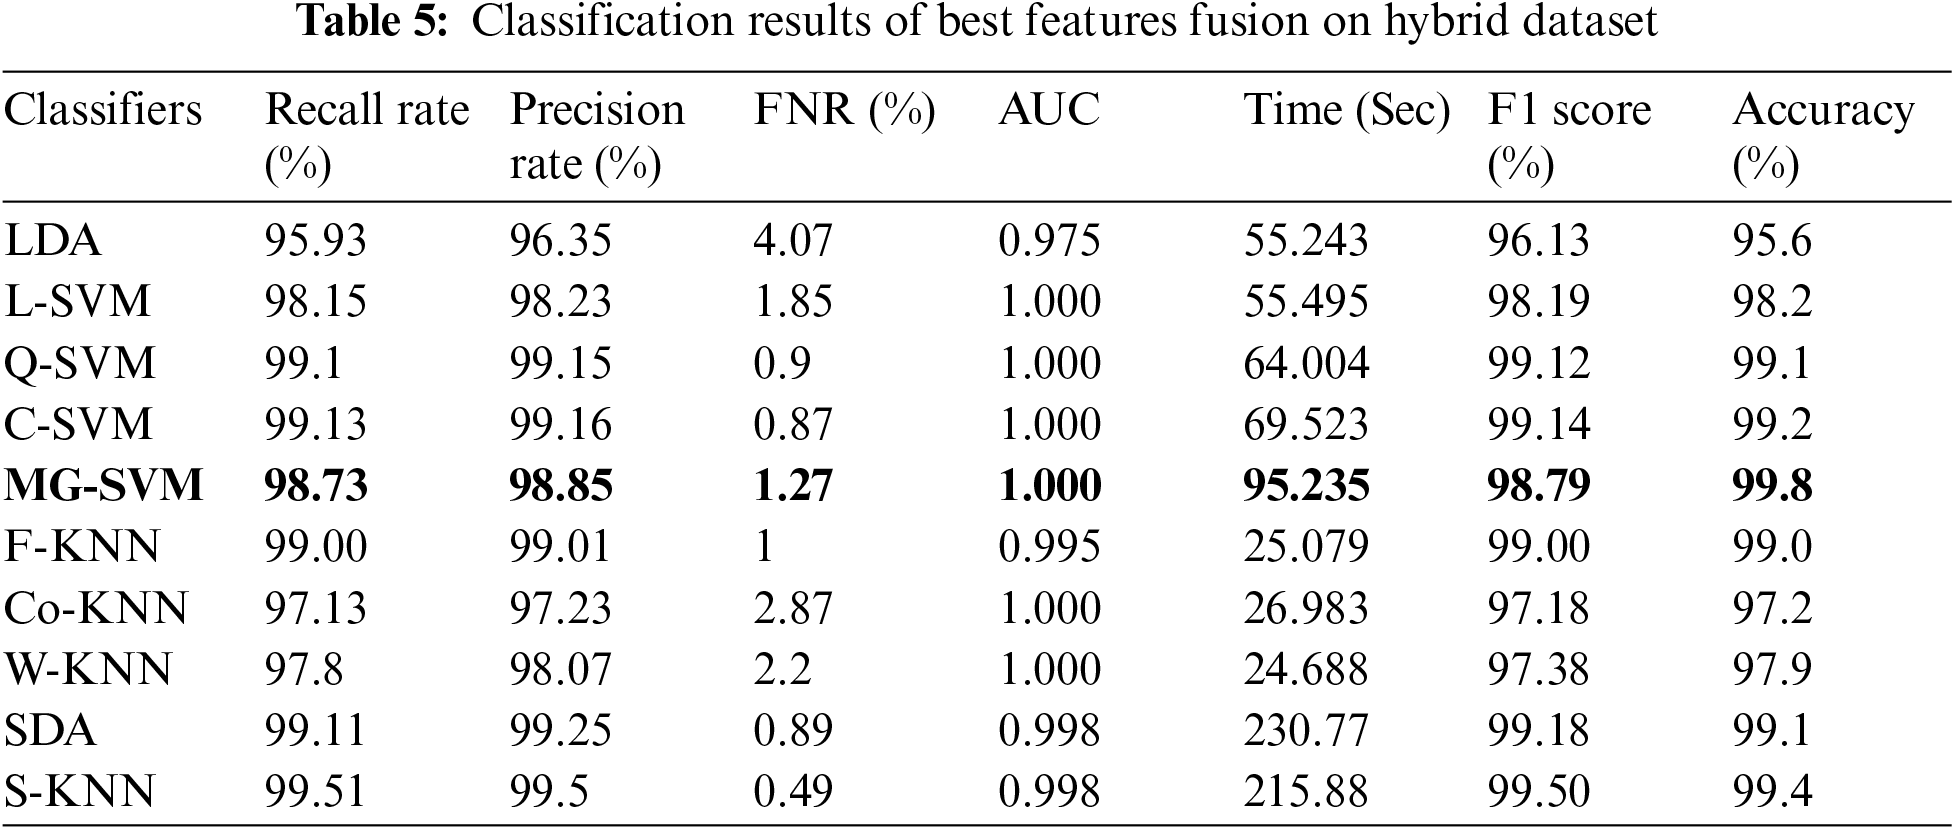
In the last experiment, the best selected features of both deep models are fused using the proposed approach. The results of this experiment are given in Tab. 5. This table shows the best accuracy achieved by a Medium Gaussian SVM of 99.8%. The second-best accuracy of this experiment is 99.4%, achieved by subspace KNN classifiers. The accuracy for the rest of the classifiers is also above 95%. This shows that the results are minor improved after the fusion process.
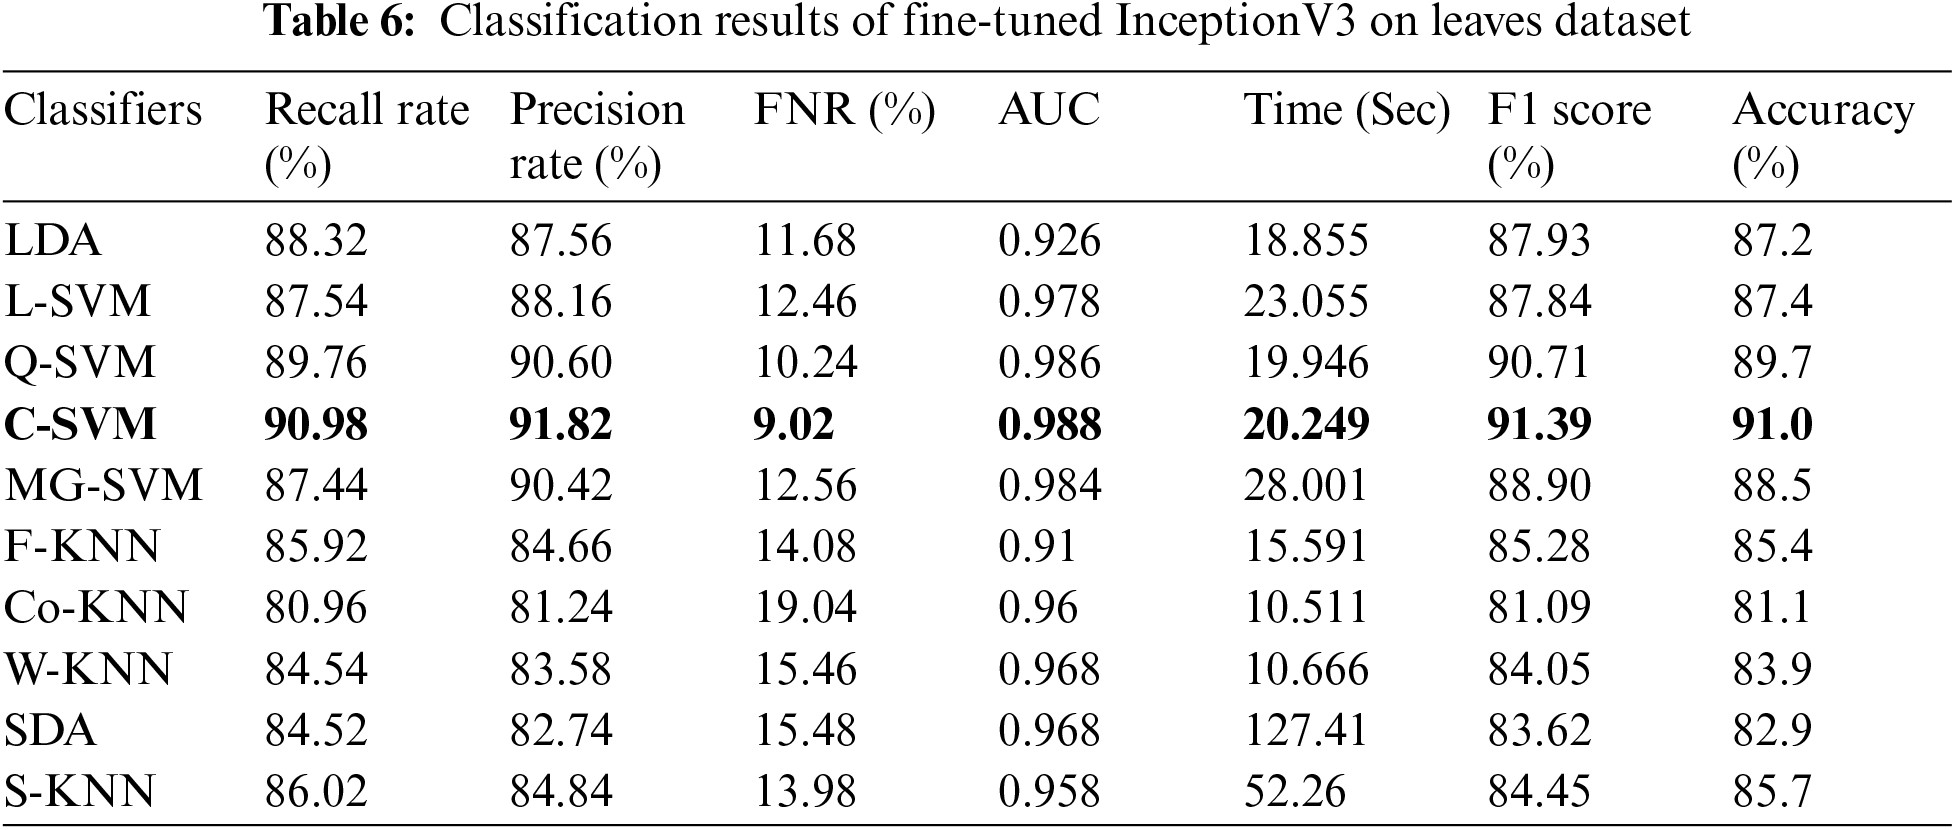
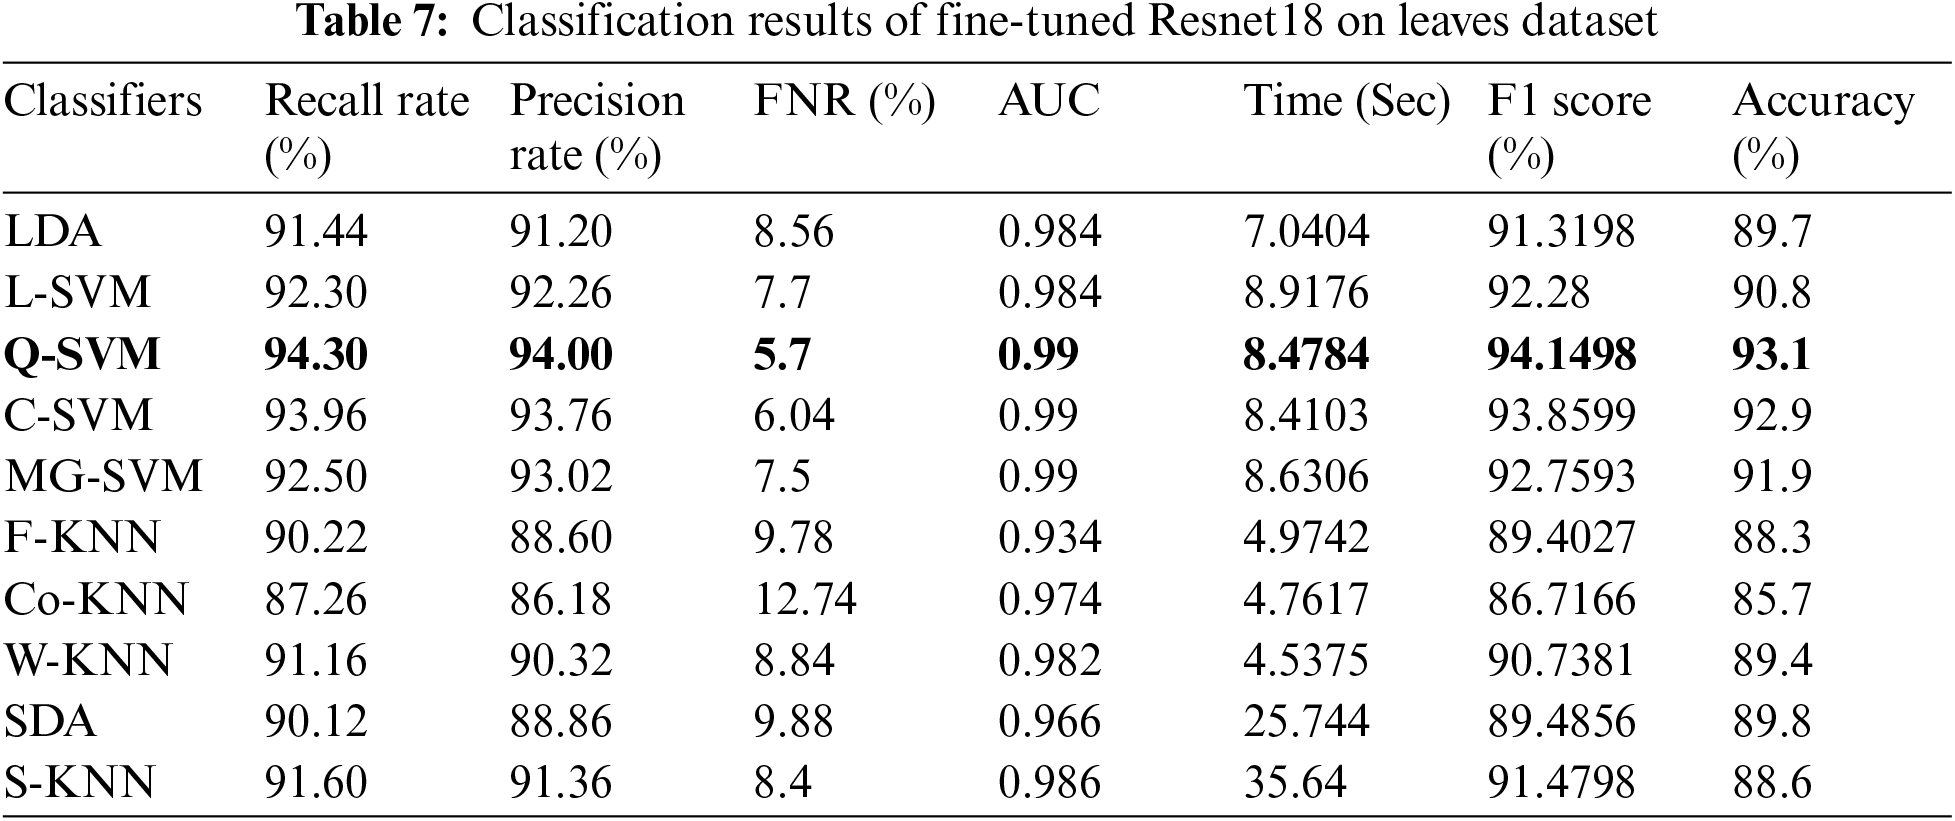
In this experiment, we perform classification on publicly available datasets named Leaves dataset using fine-tune InceptionV3 deep features. The classification outcomes are presented in Tab. 6. Cubic SVM achieved the best accuracy of 91.0%. The lowest noted time of this experiment is 20.249 (sec) for the Cubic SVM classifier, whereas the highest time is 127.47 (sec) for SDA classifier. Similarly, the results of ResNet18 deep features are given in Tab. 7. This table presented the best accuracy of 93.1% for QSVM. The time is also noted during the testing process, and the best noted time is 8.47 (sec) for QSVM. This shows that the performance of fine-tuned ResNet18 CNN model is better than InceptionV3 in terms of accuracy and time.
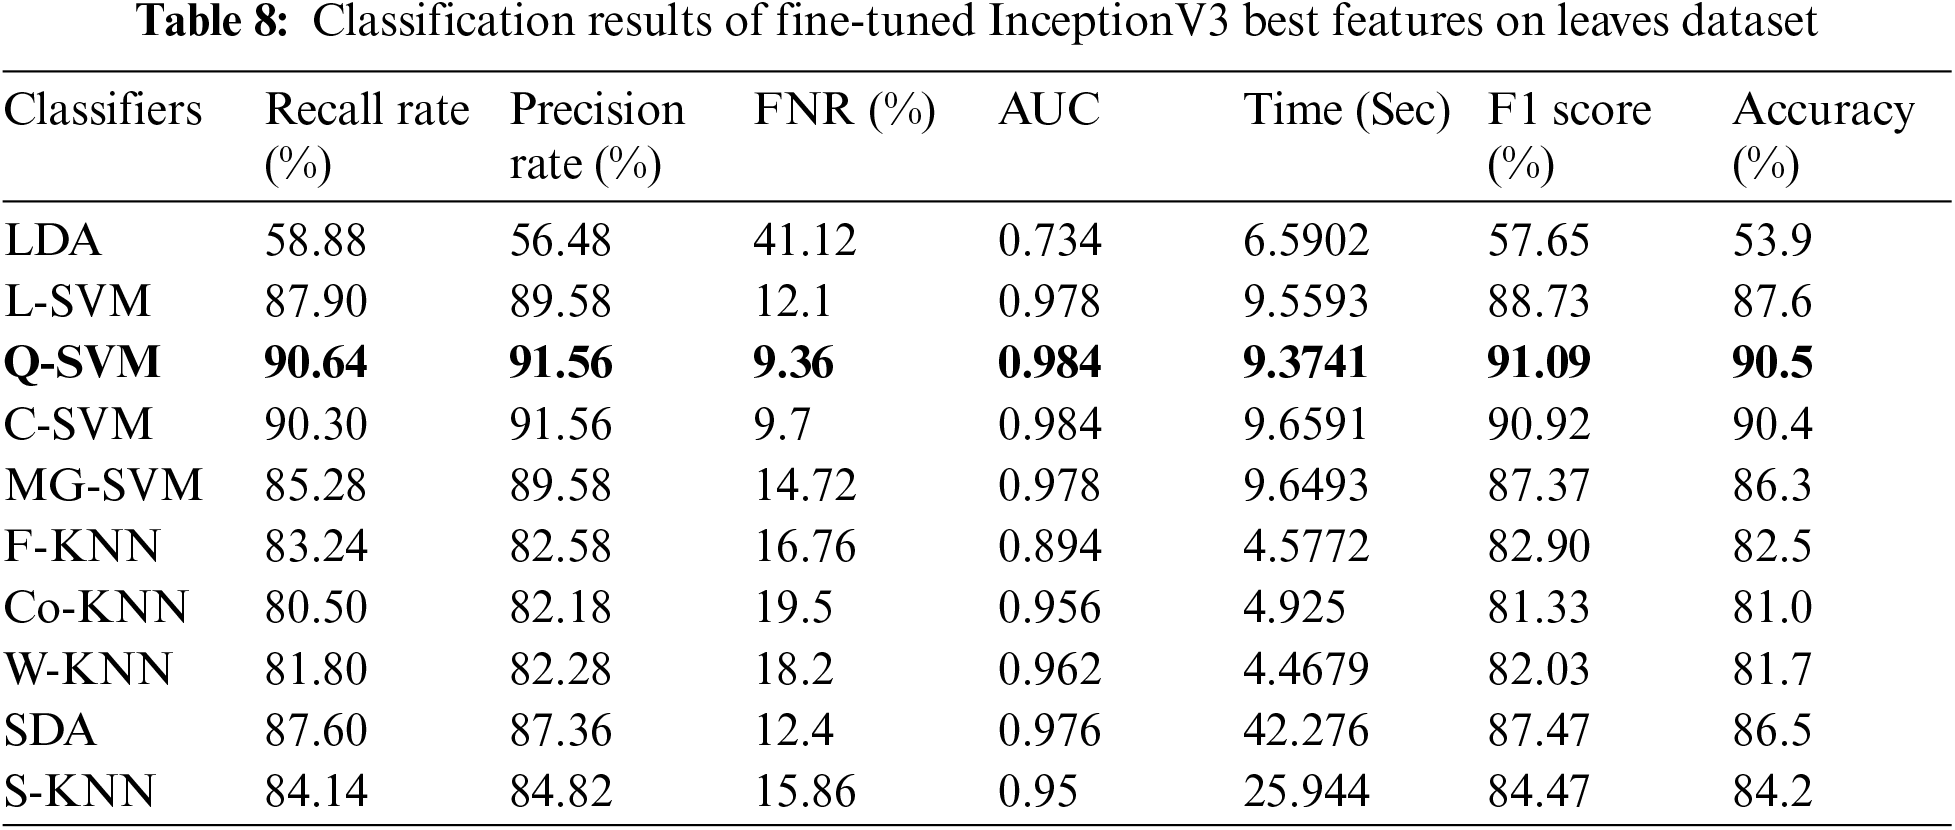
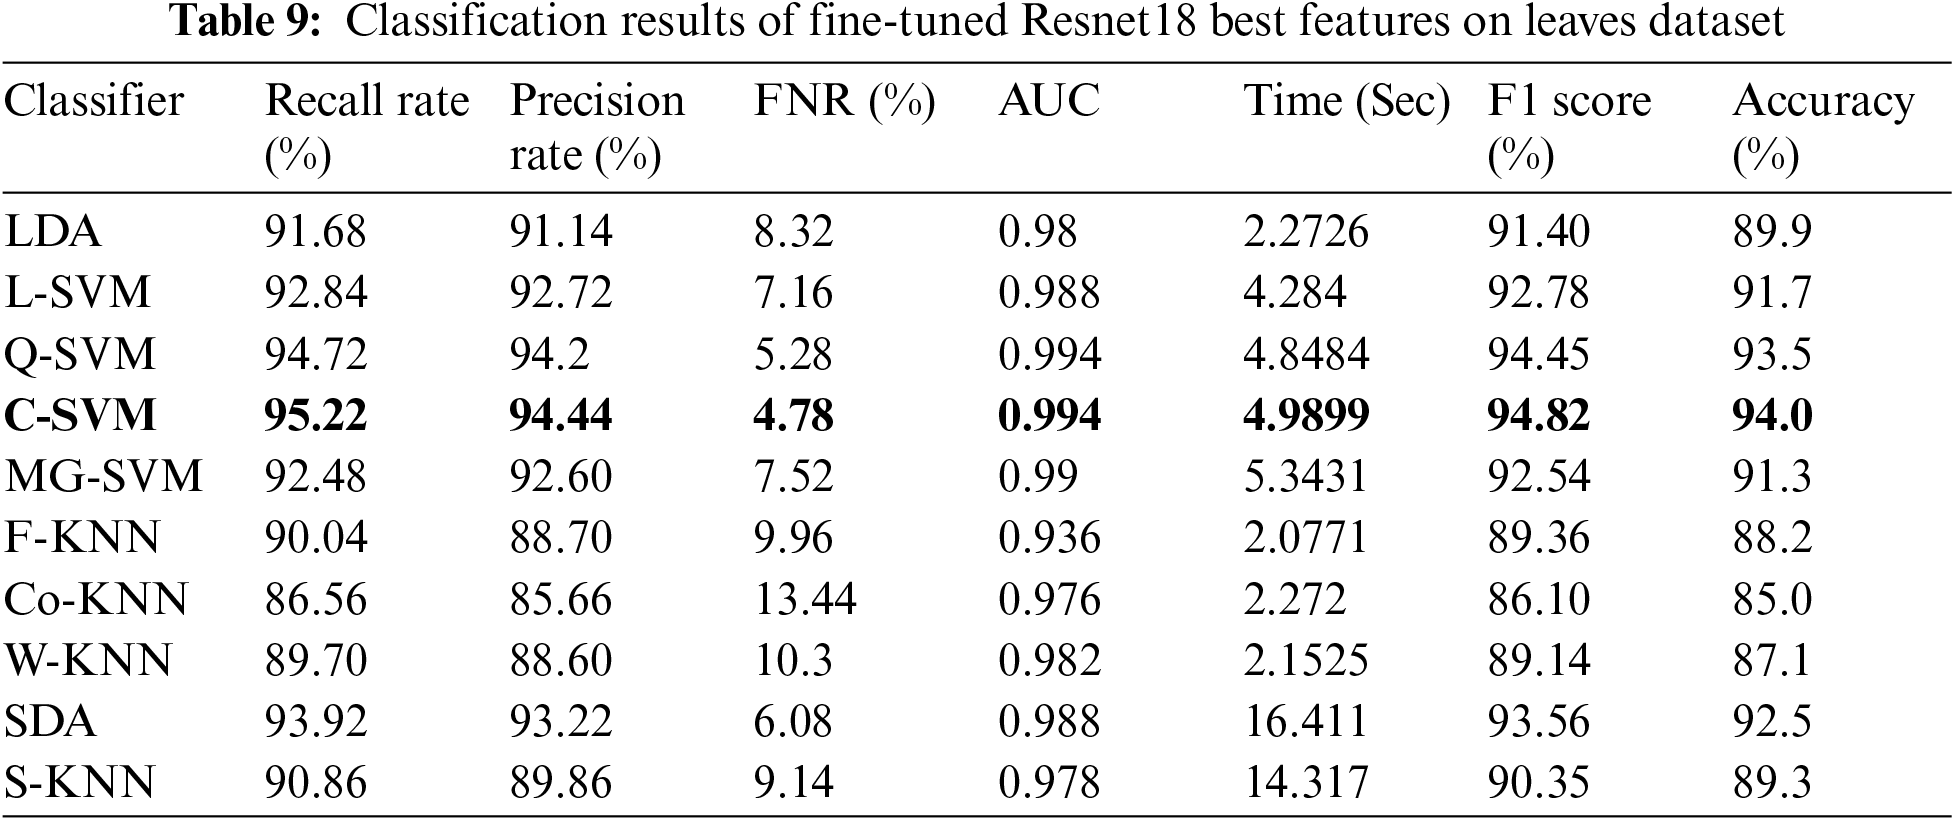
Tab. 8 presented the results of fine-tuned InceptionV3 best features on the leaves dataset. This table shows the best accuracy of 90.5% for Q-SVM. This experiment also measured the processing time, and the best noted time is 9.3741 (sec) for the Quadratic SVM classifier. The highest noted time of this experiment is 42.276 (sec) for SDA classifier. The results and computational time is given in this table showed that the feature selection process shrinkage the computational time than the performance given in Tab. 6. Similarly, Tab. 9 presented the results of fine-tuned ResNet18 best features on the leaves dataset. This table shows the best accuracy of 94% for C-SVM. The lowest noted time of this experiment is 4.9899 (sec) for the Cubic SVM classifier, which is significantly better than the noted time in Tab. 7.
In the last experiment, best-selected features of both deep models are fused using the proposed fusion approach. The results of this experiment are given in Tab. 10. This table shows the best accuracy achieved by Quadratic SVM of 95.2%. The second-best accuracy of this experiment is 95.1%, achieved by Cubic SVM classifier. As compared to Tabs. 6–9, the fusion-based accuracy is significantly improved.
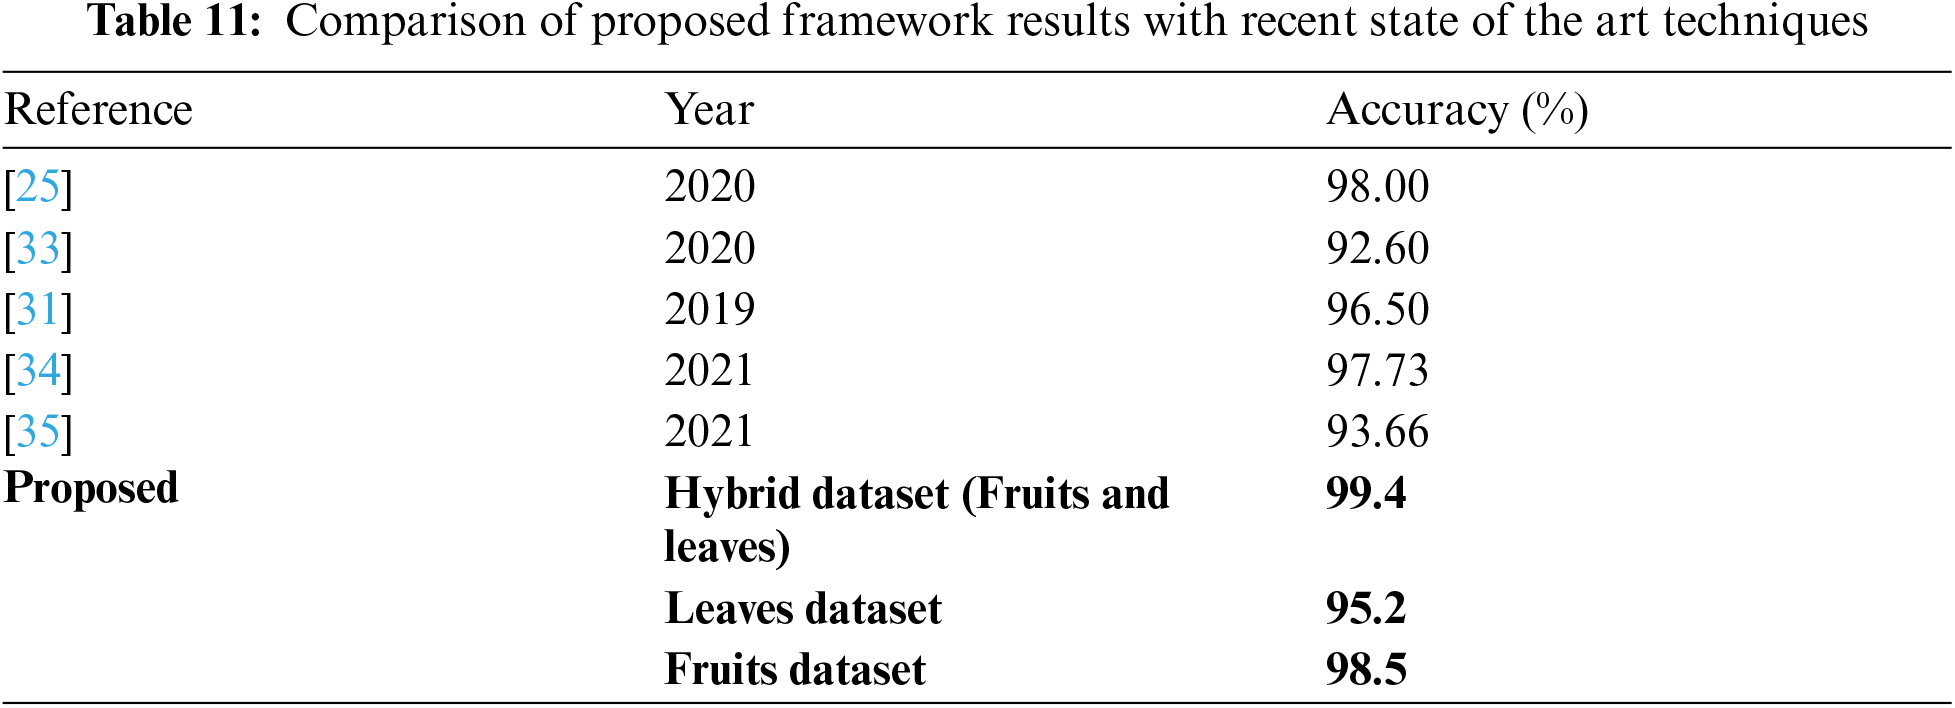
The proposed method is also evaluated on the Fruits dataset. Results are computed on all five steps. In the first step, fine-tuned InceptionV3 deep model features are validated and achieved max accuracy of 96.8% for C-SVM. The computational time of this classifier was 13.841 (sec). In the next step, fine-tuned Resnet18 model features are validated and obtained an accuracy of 96.95% for Q-SVM. The computational time of this classifier is 5.994 (sec). This shows that the performance of fine-tuned Resnet18 model is better than fine-tuned InceptionV3 model. In the third step, best features selection algorithm is applied on fine-tuned InceptionV3 features and obtained max accuracy of 97.49%. This accuracy is improved as compared to the obtained accuracy of fine-tuned InceptionV3. Moreover, the computational time of this step is 6.46 (sec), which is significantly decreased. Similarly, the best feature selection algorithm is applied on ResNet18 features and obtained an accuracy of 97.7%. In the last, best features are fused using the proposed algorithm and obtained the best accuracy of 98.5%. This accuracy shows that the fusion process improves the overall system accuracy. Visually, these values are plotted in Fig. 4. The last comparison of the proposed method is conducted with some recent techniques, given in Tab. 11. This table shows that the proposed method has improved performance.
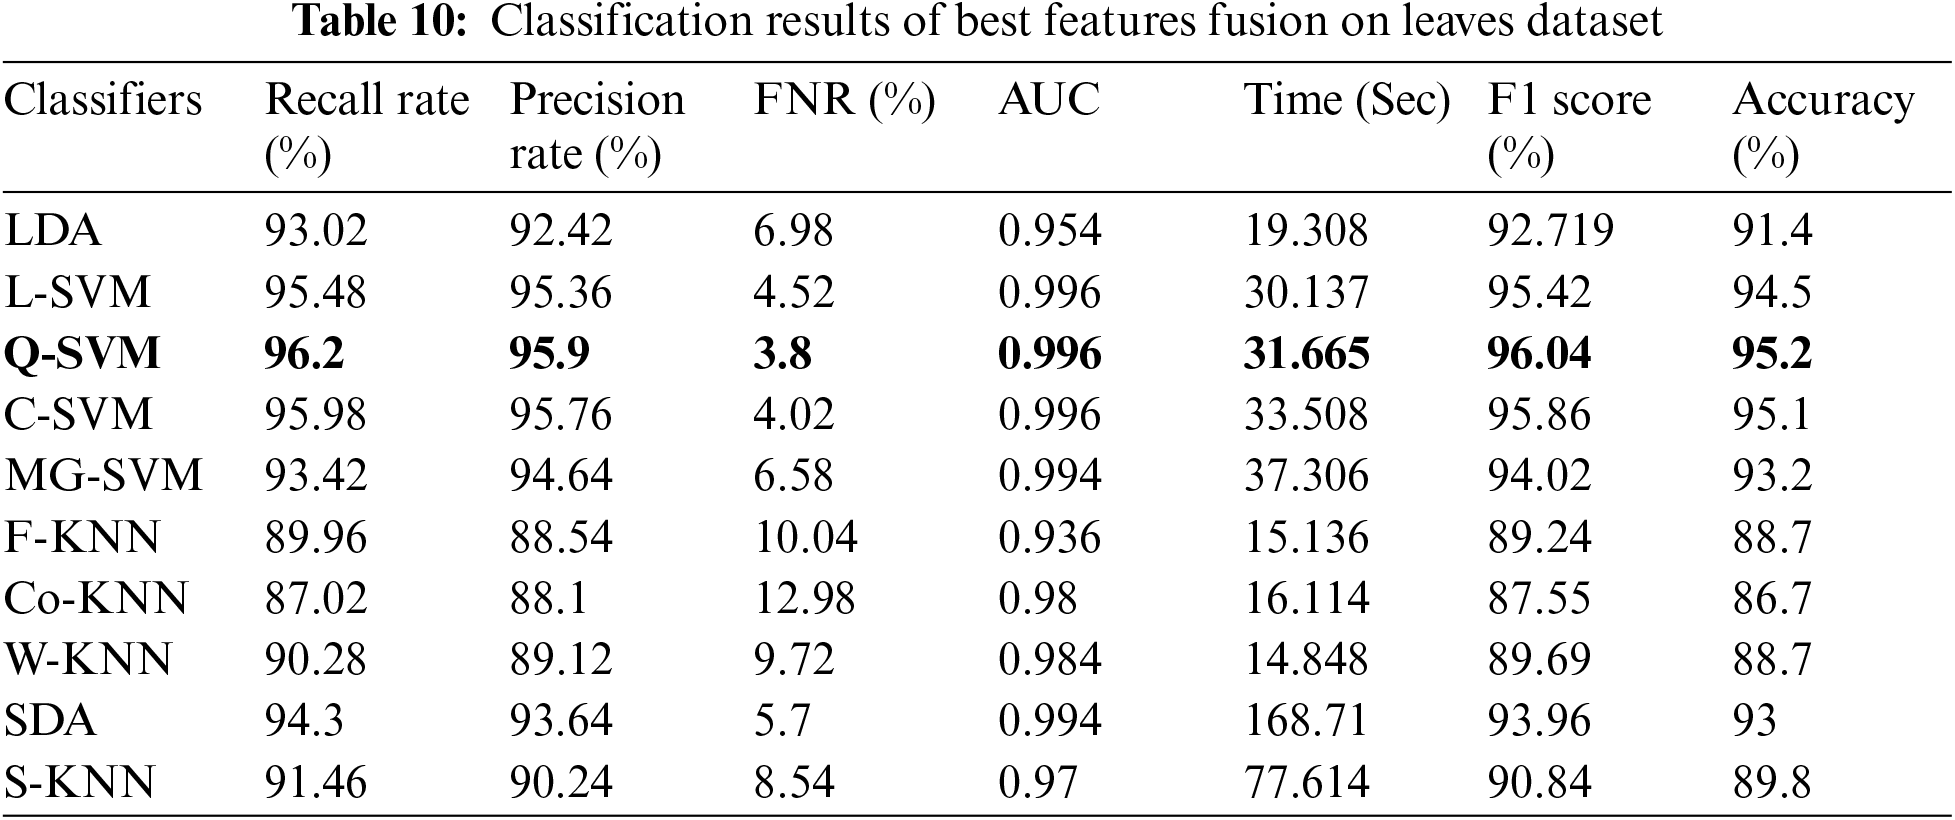
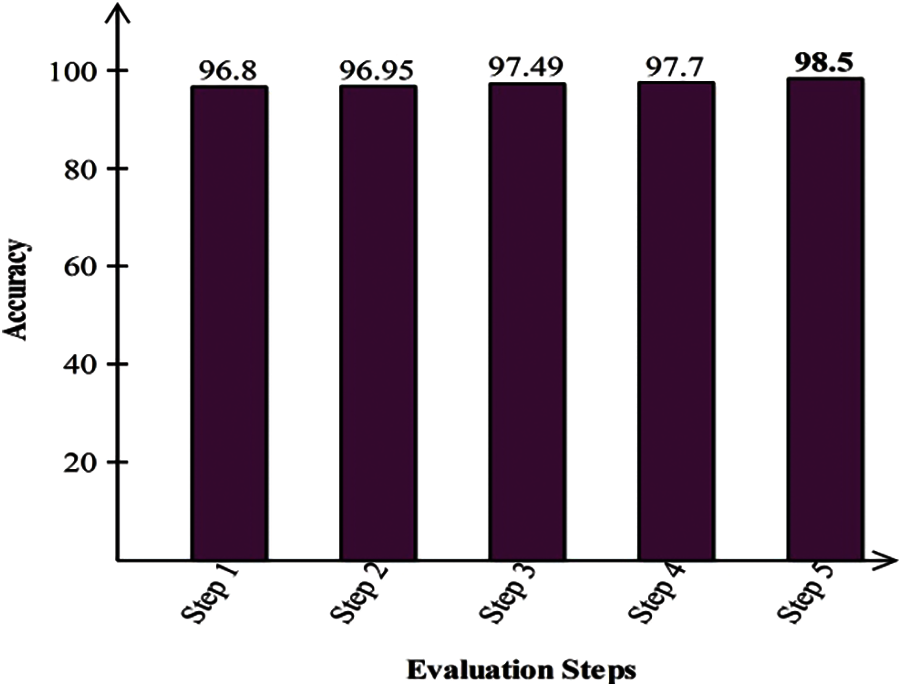
Figure 4: Classification results of proposed method on fruits dataset
This research work proposes an automated system for citrus fruits and leaves diseases using deep learning and best feature selection. The experimental process was conducted on three types of dataset: Hybrid dataset, Fruit's dataset, and Leave dataset and achieved an accuracy of 99.5%, 94%, and 97.7%, respectively. Based on the results, the following points are concluded: i) The data augmentation step improves the training data, which is helpful for better learning of pre-trained deep learning models; ii) Models learning using TL is easy as compared to the models learning from the scratch; iii) Selection of best features significantly improves the recognition accuracy on all three selected datasets as compared to the achieved accuracy by original pre-trained models; iv) The selection process decreases the computational time for the recognition process, and v) Fusion of selected deep features expressively improves the recognition accuracy but on the other end, increased the computational time. The increase in the computational time is a main limitation of this work.
Funding Statement: This work was supported by the National Research Foundation of Korea (NRF) grant funded by the Korea government (MSIT) (No. NRF-2021R1A2C1010362) and the Soonchunhyang University Research Fund.
Conflicts of Interest: The authors declare that they have no conflicts of interest to report regarding the present study.
1. M. Sharif, Z. Iqbal, M. F. Azam, M. I. U. Lali and M. Y. Javed, “Detection and classification of citrus diseases in agriculture based on optimized weighted segmentation and feature selection,” Computers and Electronics in Agriculture, vol. 150, no. 7, pp. 220–234, 2018. [Google Scholar]
2. Z. Iqbal, M. Sharif, J. H. Shah, M. H. ur Rehman and K. Javed, “An automated detection and classification of citrus plant diseases using image processing techniques: A review,” Computers and Electronics in Agriculture, vol. 153, no. 3, pp. 12–32, 2018. [Google Scholar]
3. H. Karaca, “Use of ozone in the citrus industry,” Ozone: Science & Engineering, vol. 32, pp. 122–129, 2010. [Google Scholar]
4. P. K. Farris, “Cosmeceutical vitamins: Vitamin C,” Cosmeceuticals E-Book: Procedures in Cosmetic Dermatology Series, vol. 37, pp. 11–31, 2014. [Google Scholar]
5. T. Abdullah, H. Shokrollah, K. Sijam and S. Abdullah, “Control of Huanglongbing (HLB) disease with reference to its occurrence in Malaysia,” African Journal of Biotechnology, vol. 8, pp. 1–21, 2009. [Google Scholar]
6. K. Geurts, G. Wets, T. Brijs and K. Vanhoof, “Identification and ranking of black spots: Sensitivity analysis,” Transportation Research Record, vol. 1897, pp. 34–42, 2004. [Google Scholar]
7. J. C. V. Guzman, S. Basu, R. Rabara, L. K. Huynh, G. C. Basu et al., “Liposome delivery system of antimicrobial peptides against huanglongbing (HLB) citrus disease,” Biophysical Journal, vol. 114, pp. 266a, 2018. [Google Scholar]
8. T. Akram, M. Sharif, M. Awais, K. Javed, H. Ali et al., “CCDF: Automatic system for segmentation and recognition of fruit crops diseases based on correlation coefficient and deep CNN features,” Computers and Electronics in Agriculture, vol. 155, pp. 220–236, 2018. [Google Scholar]
9. M. I. U. Lali, M. Sharif, K. Javed, K. Aurangzeb, S. I. Haider et al., “An optimized method for segmentation and classification of apple diseases based on strong correlation and genetic algorithm based feature selection,” IEEE Access, vol. 7, pp. 46261–46277, 2019. [Google Scholar]
10. H. T. Rauf, B. A. Saleem, M. I. U. Lali, M. Sharif and S. A. C. Bukhari, “A citrus fruits and leaves dataset for detection and classification of citrus diseases through machine learning,” Data in Brief, vol. 26, pp. 104340, 2019. [Google Scholar]
11. A. Adeel, M. Sharif, F. Azam, J. H. Shah, T. Umer et al., “Diagnosis and recognition of grape leaf diseases: An automated system based on a novel saliency approach and canonical correlation analysis based multiple features fusion,” Sustainable Computing: Informatics and Systems, vol. 24, pp. 100349, 2019. [Google Scholar]
12. A. Adeel, T. Akram, A. Sharif, M. Yasmin, T. Saba et al., “Entropy-controlled deep features selection framework for grape leaf diseases recognition,” Expert Systems, vol. 11, no. 2, pp. 1–26, 2020. [Google Scholar]
13. U. N. Hussain, I. U. Lali, K. Javed, I. Ashraf, J. Tariq et al., “A unified design of ACO and skewness based brain tumor segmentation and classification from MRI scans,” Journal of Control Engineering and Applied Informatics, vol. 22, pp. 43–55, 2020. [Google Scholar]
14. T. Akram, M. Sharif and T. Saba, “Fruits diseases classification: Exploiting a hierarchical framework for deep features fusion and selection,” Multimedia Tools and Applications, vol. 79, pp. 25763–25783, 2020. [Google Scholar]
15. F. Saeed, M. Sharif, M. Mittal, L. M. Goyal and S. Roy, “Deep neural network features fusion and selection based on PLS regression with an application for crops diseases classification,” Applied Soft Computing, vol. 103, pp. 107164, 2021. [Google Scholar]
16. A. Fuentes, S. Yoon, S. C. Kim and D. S. Park, “A robust deep-learning-based detector for real-time tomato plant diseases and pests recognition,” Sensors, vol. 17, pp. 2022, 2017. [Google Scholar]
17. T. Akram, M. Sharif, M. Alhaisoni, T. Saba and N. Nawaz, “A probabilistic segmentation and entropy-rank correlation-based feature selection approach for the recognition of fruit diseases,” EURASIP Journal on Image and Video Processing, vol. 2021, pp. 1–28, 2021. [Google Scholar]
18. Z. u. Rehman, F. Ahmed, R. Damaševičius, S. R. Naqvi, W. Nisar et al., “Recognizing apple leaf diseases using a novel parallel real-time processing framework based on MASK RCNN and transfer learning: An application for smart agriculture,” IET Image Processing, vol. 11, no. 8, pp. 1–20, 2021. [Google Scholar]
19. N. O'Mahony, S. Campbell, A. Carvalho, S. Harapanahalli, G. V. Hernandez et al., “Deep learning vs. traditional computer vision,” in Science and Information Conf., Cham, Springer, pp. 128–144, 2019. [Google Scholar]
20. Q. Wu, Y. Chen and J. Meng, “Dcgan-based data augmentation for tomato leaf disease identification,” IEEE Access, vol. 8, pp. 98716–98728, 2020. [Google Scholar]
21. T. K. Hariadi, Z. Fadholi, A. N. Chamim, N. A. Utama and I. Prabasari, “Development of leaf area meter using open cv for smartphone application,” Telkomnika, vol. 16, pp. 1857–1863, 2018. [Google Scholar]
22. S. D. Khirade and A. Patil, “Plant disease detection using image processing,” in 2015 Int. Conf. on Computing Communication Control and Automation, Pune, India, pp. 768–771, 2015. [Google Scholar]
23. J. G. A. Barbedo, “Digital image processing techniques for detecting, quantifying and classifying plant diseases,” SpringerPlus, vol. 2, pp. 1–12, 2013. [Google Scholar]
24. V. Singh and A. K. Misra, “Detection of plant leaf diseases using image segmentation and soft computing techniques,” Information Processing in Agriculture, vol. 4, pp. 41–49, 2017. [Google Scholar]
25. U. Barman, R. D. Choudhury, D. Sahu and G. G. Barman, “Comparison of convolution neural networks for smartphone image based real time classification of citrus leaf disease,” Computers and Electronics in Agriculture, vol. 177, pp. 105661, 2020. [Google Scholar]
26. F. Zhong, Z. Chen, Y. Zhang and F. Xia, “Zero-and few-shot learning for diseases recognition of Citrus aurantium L. using conditional adversarial autoencoders,” Computers and Electronics in Agriculture, vol. 179, pp. 105828, 2020. [Google Scholar]
27. S. Janarthan, S. Thuseethan, S. Rajasegarar, Q. Lyu and J. Yearwood, “Deep metric learning based citrus disease classification with sparse data,” IEEE Access, vol. 8, pp. 162588–162600, 2020. [Google Scholar]
28. N. E. M. Khalifa, M. H. N. Taha, L. M. Abou El-Maged and A. E. Hassanien, “Artificial intelligence in potato leaf disease classification: A deep learning approach,” in Machine Learning and Big Data Analytics Paradigms: Analysis, Applications and Challenges, Cham, Springer, pp. 63–79, 2021. [Google Scholar]
29. W. Zhang, A. Tan, G. Zhou, A. Chen, M. Li et al., “A method for classifying citrus surface defects based on machine vision,” Journal of Food Measurement and Characterization, vol. 15, pp. 2877–2888, 2021. [Google Scholar]
30. G. M. James and S. Sujatha, “Categorising apple fruit diseases employing hybrid neural clustering classifier,” Materials Today,vol. 44, no. 2, pp. 1–23, 2021. [Google Scholar]
31. A. Safdar, J. H. Shah, M. Sharif, T. Saba, A. Rehman et al., “Intelligent microscopic approach for identification and recognition of citrus deformities,” Microscopy Research and Technique, vol. 82, pp. 1542–1556, 2019. [Google Scholar]
32. M. B. Tahir, K. Javed, S. Kadry, Y. D. Zhang, T. Akram et al., “Recognition of apple leaf diseases using deep learning and variances-controlled features reduction,” Microprocessors and Microsystems, vol. 8, pp. 104027, 2021. [Google Scholar]
33. Q. Zeng, X. Ma, B. Cheng, E. Zhou and W. Pang, “Gans-based data augmentation for citrus disease severity detection using deep learning,” IEEE Access, vol. 8, pp. 172882–172891, 2020. [Google Scholar]
34. H. Zhang, Y. Chen, X. Liu, Y. Huang and B. Zhan, “Identification of common skin defects and classification of early decayed citrus using hyperspectral imaging technique,” Food Analytical Methods, vol. 4, no. 7, pp. 1–18, 2021. [Google Scholar]
35. Y. Chen, X. An, S. Gao, S. Li and H. Kang, “A deep learning-based vision system combining detection and tracking for fast on-line citrus sorting,” Frontiers in Plant Science, vol. 12, pp. 171, 2021. [Google Scholar]
 | This work is licensed under a Creative Commons Attribution 4.0 International License, which permits unrestricted use, distribution, and reproduction in any medium, provided the original work is properly cited. |