DOI:10.32604/cmc.2022.022161
| Computers, Materials & Continua DOI:10.32604/cmc.2022.022161 | |
| Article |
Optimization of Deep Learning Model for Plant Disease Detection Using Particle Swarm Optimizer
1Department of Computer Science, Faculty of Computers and Information, South Valley University, Qena, Egypt
2Department of Math., & Computer Science Faculty of Science, Port Said University, Egypt
3College of Computer and Information Sciences, Jouf University, Sakaka, Aljouf, Kingdom of Saudi Arabia
*Corresponding Author: Ahmed Elaraby. Email: ahmed.elaraby@svu.edu.eg
Received: 29 July 2021; Accepted: 20 October 2021
Abstract: Plant diseases are a major impendence to food security, and due to a lack of key infrastructure in many regions of the world, quick identification is still challenging. Harvest losses owing to illnesses are a severe problem for both large farming structures and rural communities, motivating our mission. Because of the large range of diseases, identifying and classifying diseases with human eyes is not only time-consuming and labor intensive, but also prone to being mistaken with a high error rate. Deep learning-enabled breakthroughs in computer vision have cleared the road for smartphone-assisted plant disease and diagnosis. The proposed work describes a deep learning approach for detection plant disease. Therefore, we proposed a deep learning model strategy for detecting plant disease and classification of plant leaf diseases. In our research, we focused on detecting plant diseases in five crops divided into 25 different types of classes (wheat, cotton, grape, corn, and cucumbers). In this task, we used a public image database of healthy and diseased plant leaves acquired under realistic conditions. For our work, a deep convolutional neural model AlexNet and Particle Swarm optimization was trained for this task we found that the metrics (accuracy, specificity, Sensitivity, precision, and F-score) of the tested deep learning networks achieves an accuracy of 98.83%, specificity of 98.56%, Sensitivity of 98.78%, precision of 98.67%, and F-score of 98.47%, demonstrating the feasibility of this approach.
Keywords: Deep neural networks; plant diseases detection; classification; AlexNet; PSO
Agriculture sector is both a major component in industry and economy. The proposed work aims to improve the state of the art in plant diseases detection in agriculture sector. The recent studies have highlighted that automated plant diseases detection algorithms using machine learning techniques can contribute to this area. In this context, utilizing modern technological solutions to make efficient farming, remains one of the highest necessities. This is especially useful in a variety of areas in agriculture sector. In economy and food security worldwide, Plant diseases are considering a serious threat as indicated to studies, crop losses by diseases are between 10% and 30% [1–3]. Using modern technologies, human society now can produce enough food to feed more than 7 billion people. However, several factors still a threat to food security [4,5].
Plant diseases may be devastating for smallholder farmers whose livelihoods are needy healthy crops. Smallholder farmers account for more than 80% of agricultural production in the developing countries [6]. Furthermore, they account for most hungry people (50 percent) making them particularly susceptible to pathogen-related food supply disruptions [7,8]. Reports of crop losses of more than 50% due to pests and diseases which are prevalent so it's critical to stop the disease from spreading at its initial stage [9]. The rising smartphones numbers and advances in the field of deep learning has opened novel vistas in the identification of plant diseases but a big, validated dataset of images for diseased and healthy plants is needed to construct accurate image classifiers for plant disease diagnosis like a dataset did not occur until recently, and even smaller datasets were not openly available [10].
Plantix (http://plantix.net) is a genuine program that could diagnose diseases using images. Plantix which has a lot of features and very wide functionality, it can recognize over 300 illnesses but unfortunately, accessibility to the Plantix image database is restricted, and it is unable to obtain any information about the disease detection procedures. A specific study was conducted to assess the quality of the Plantix application, which involved feeding 70 images of grapes from our own database as input to the Plantix program for further disease detection. Plantix did a good job identifying the plant type: 60 images from 70 images (87%) were specified as grapes [11]. Simultaneously, disease recognition was restricted: only around 10% of images had the correct disease at the top of the listing of options, so it is decided to create our own application. The main goal of our proposed model is to develop a plants diseases classification platform that will combine advanced organization and deep learning technology to deliver a new standard of serving to the farming community. To accomplish this, we will need to collect diseased and healthy plant leaves in a specific dataset [12].
Regardless of the method, appropriately recognizing a disease when it first emerges is critical for effective illness management [13]. Identification of disease has been supported by agricultural extension agencies or other institutions such as local plant clinics. More recently, such approaches have been facilitated by making disease diagnosis information available online, taking advantage of the increasing global Internet access. Even more recently, mobile phone-based tools have emerged, capitalizing on the historically unprecedented rapid adoption of technology in mobile phones at all parts of the globe [14].
Because of their computer power, high-performance CPUs, high-resolution displays, and full built-in accessory sets, such as HD cameras, smartphones provide unique approaches to help identify diseases. Therefore, disease diagnosis based on automatic picture identification would be made available at an unprecedented scale if technically possible. By 2020, it is expected that there will be between 5 and 6 billion cellphones in use around the world, By the ending of the year 2015, 69% of the world's inhabitance had access to mobiles broad band coverage, and mobiles broad band penetration had risen to 47%, a 12-fold increase from 2007 [15]. 54,306 images of 14 crops classed with 26 healthy or diseases from the Plant Village project were used to demonstrate technical feasibility using a deep learning approach. The models were performed based on their ability to predicting the correct pair of crop diseases, given the 38 possible categories, the best-performing model achieves an average F1 score of 0.9934 (overall accuracy of 99.35%), thus demonstrating the technical feasibility of this approach [16].
In the last few years, computer vision, and specifically object recognition, had made great progress. The PASCAL VOC Challenge [17] and, more recently, the Large-Scale Visual Recognition Challenge (ILSVRC) [18] based on the Image Net dataset [19] have been extensively used as benchmarks for a variety of visualization-related computer vision tasks, including object categorization. In 2012, a big, deep convolutional neural network classified images into 1000 potential categories with a top-5 error of 16.4 percent [20] The mistake rate was reduced to 3.57 percent because of breakthroughs in deep convolutional neural networks [21].
Neural networks create map between an input, for example, images of a diseased plant to output, for example, a crops disease pair. The nodes of a neural network are mathematical functions that collect numerical inputs from the incoming edges and emit numerical values through the outgoing edges [22]. Deep neural networks are just a series of stacked layers of nodes that map the input layer to the output layer. The goal is to build a deep network that appropriately maps the input to the output based on the network's structure, functions (nodes), and edge weights. This is a computationally challenging that has recently been greatly improved by several conceptual and engineering innovations [23].
We use the deep learning method for plant disease classification in our research, which is motivated by the advancement of deep learning techniques and their use in practice. The advance and accuracy of the developed model give us the advantage to powerful classification and enabling the model to differentiate between healthy leaves and diseased ones by using deep CNN. In the sections below, we'll show you how we used deep CNN to classify our data.
The following is a breakdown of the paper's structure. Section 2 describes the materials and methods of our models. While Section 3 describes the image dataset and the experimental results of the proposed approach Finally, Section 4 describes the conclusion and the suggestion models for classification in the future.
We present a description of the proposed framework that will be used for plant disease detection using deep learning. This paper processes the challenge of classifying plant disease images as healthy or diseased, which might be a difficult task for some farmers. The challenge is solved by utilizing a deep learning network that has been extensively trained to extract high to low levels of characteristics from images of ordinary plant leaves and various other disease condition using a specially designed and training filter. These characteristics determine whether a plant disease image is healthy or not. However, the transmission of knowledge from the main task to the target task, which in this case is planted disease taxonomy is also considered by transmission knowledge of a pre-trained model known as AlexNet to a novel classification task and test with the same number of images CNN generated from the beginning. We want to address the primary challenge in plant disease classification in this way: instead of training deep CNN from scratch, we will employ a pre-trained modified AlexNet with an CNN classifiers to transmission his knowledge to a new target job is enough fine-tuning. The validity and correctness of this essential issue will be demonstrated by our conducted experiment on plant disease classification utilizing a CNN developed from scratch and pre-trained models.
The plant disease images dataset trained using an adaption of the AlexNet Convolutional Neural Network (AlexNet CNN). This network developed on the ImageNet dataset (25 classes of five crops) owing to image recognition and outperformed previous state of the art technologies.
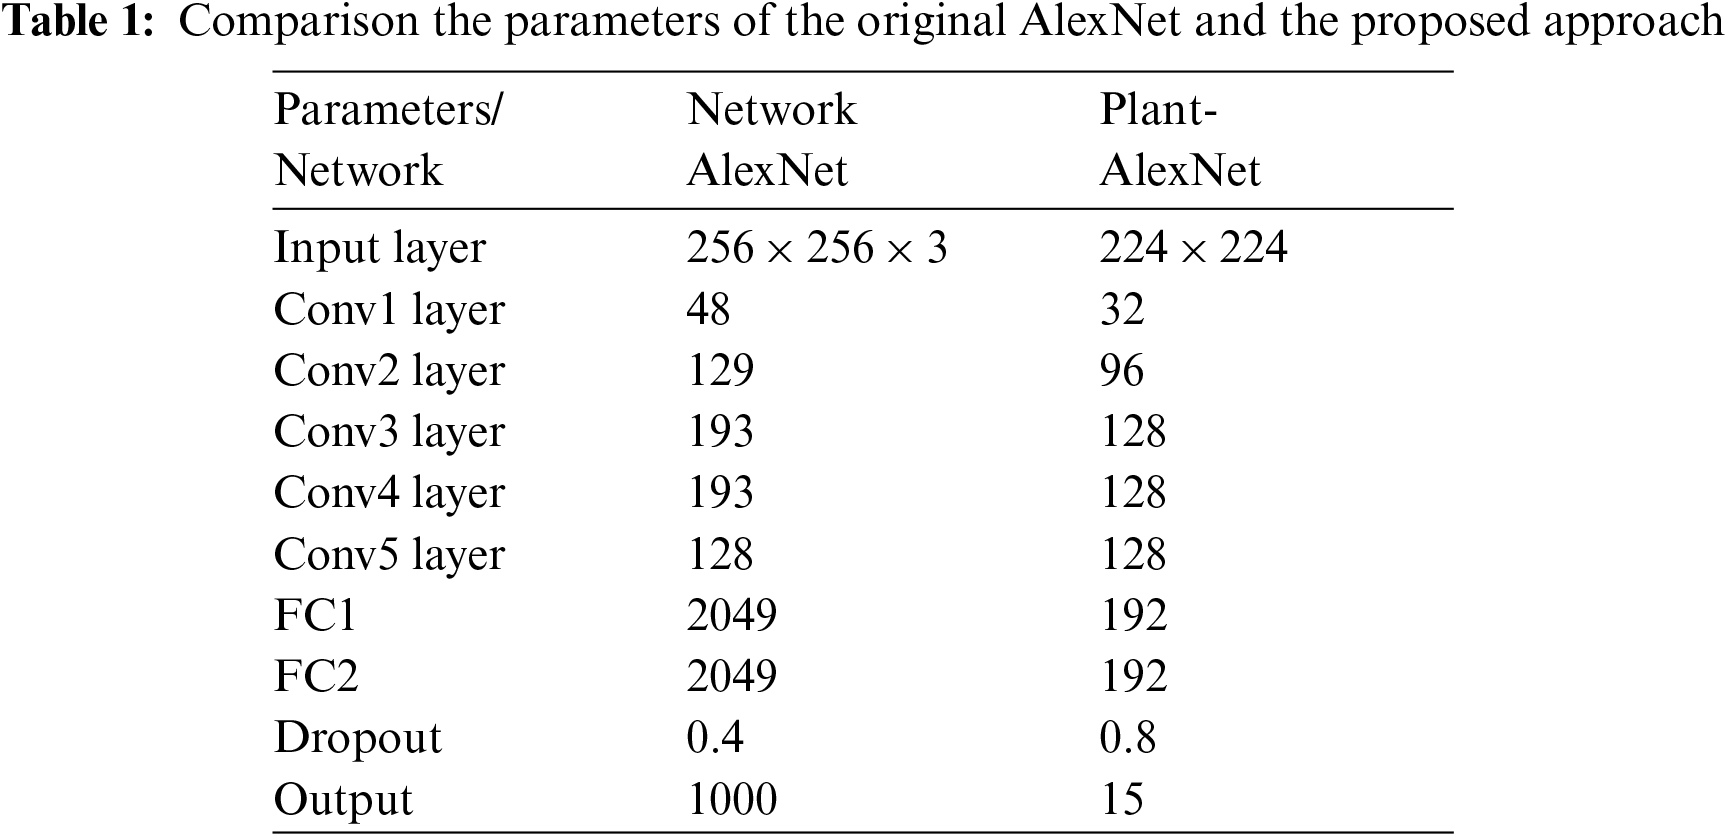
Because the plant classification problem addressed in this paper necessitates far fewer training examples and classes, employing the AlexNet CNN as initially described results to overfitting and low classification accuracy. Weight regularization and dropout have been proposed as ways to reduce overfitting in CNNs. Furthermore, according to [23], overfitting is caused by the employment of the most popular models sophisticated, i.e., models with additional parameters than the data support. Considering the above factors, we suggested reducing the complication of the model without sacrificing the power that AlexNet CNN provides, allowing a correct impersonation of features for each class without personalization. As a result, starting with the AlexNet infrastructure, network parameters including the number of dense neurons, dropout ratio, and feature maps for layers were tuned. The results presented in our paper are better and we can come up with after experimentally modifying the parameters indicated earlier. The network has five maximum convolutional layers after the first, second, and fifth convolutional layers, and trailers after the first and second fully connected layers, with maximum convolutional layers after the first, second, and fifth fully connected layers, as shown in the diagram.
Fig. 1 shows the structure of this network and Tab. 1 shows a comparison of the parameters with respect to the original AlexNet.
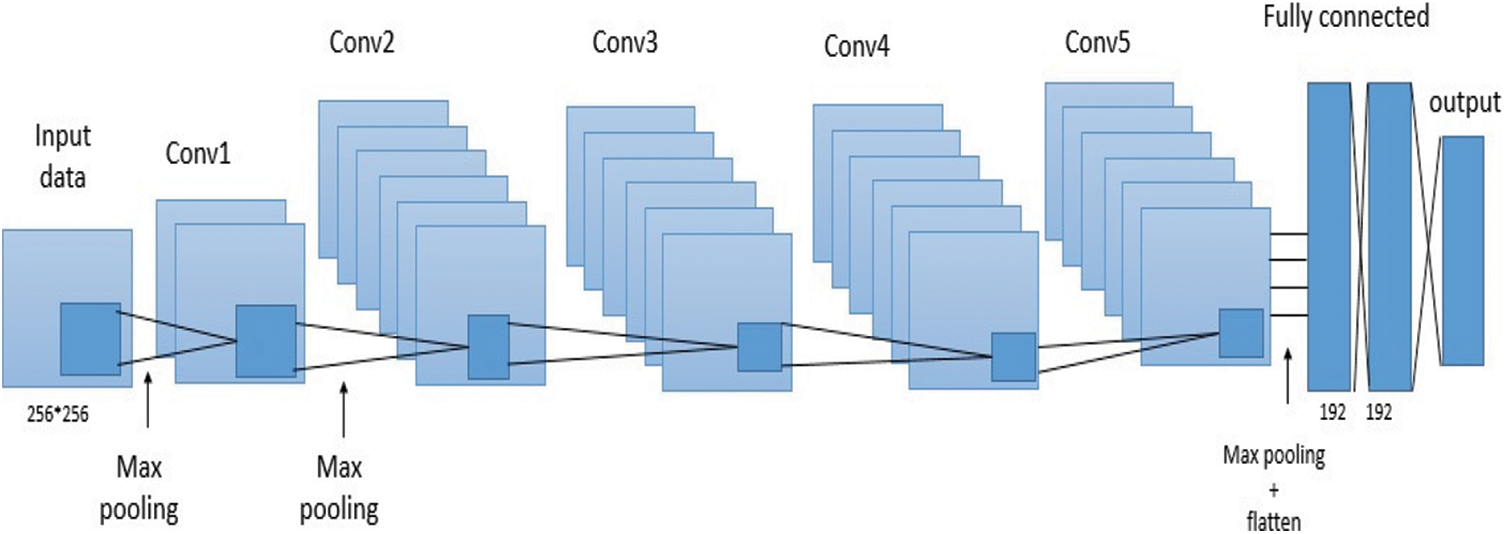
Figure 1: AlexNet suggested variation for the plant disease classification
The convolutional layer weight configuration was matrix orthogonal, while the fully connected layers initialization was Glorot normalized. ReLU used as an activation function for all hidden layers, and for the output layer, it was softmax. A maximum pooling layer was also introduced after the first, second, and fifth convolutional layers, according to the original AlexNet model. This done after down sampling the input images of our produce dataset by a factor of 16, producing 224 × 224 input-size images.
Using data augmentation for the training set on a plants disease classification problem was regarded as relevant. By using label-preserving changes, this strategy artificially expands the training data. They are flipped, moved, and rotated in the case of images, enhancing the variety of training instances from a smaller dataset. When image zoom is applied, the network is more likely to develop a better and more general representation of the input. Vertical image shifts and Random horizontal, to supplement the data in this investigation, randomization rotations of up to 45 degrees and randomization horizontal and vertical shifts of up to 20% of the width and height of the images were used, as well as a combination of previous methodologies. Keras Image Generator class used to perform this increment.
Feature extraction, feature selection, and classification are the three aspects of our technique. When it comes to extracting features from colored raw photos, a deep neural network comes in handy. We used transfer learning to train such architecture, AlexNet, to extract features from inputs. PSO is used to pick features based on the 100 features collected from AlexNet. We proposed representing each feature with a binary selection in PSO for feature selection. As a result, it gives us a sample space of 1 to 2100, from which we choose a population size of 70. Using the local best and global best for each particle, the velocity and parameters were adjusted using the multi-objective fitness function. The self-confidence was set in the range of 0.75 and the swarm confidence range to 0.75 for the velocity function. After experimenting with various values, these parameters were chosen for the best outcomes. As shown in Fig. 2. The flowchart depicting the main process of the Plants-AlexNet CNN model.
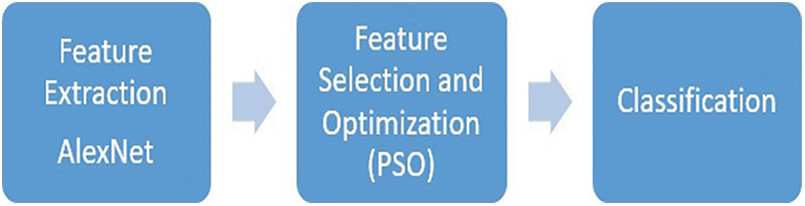
Figure 2: Flowchart for the optimization Plants-AlexNet CNN model
In the previous stage, deep neural networks were used to extract a total of 100 features for each image. More than 100 features can be extracted using deep neural networks. Because the preceding stage is computationally intensive, an optimization model is required that can identify only the dominant or important traits. For the selection of an optimal collection of characteristics, PSO, a heuristic technique, is applied. Social behaviors such as crowding birds and teaching fish encourage PSO. The basic concept of PSO is that knowledge is enhanced through social engagement with the public, in which thinking is both personal and social. Each particle swarm optimization solution can be represented as a particle in the swarm. A vector
2.4 Classification of Plants Disease
The complete database was initially separated into two datasets: a training set and a test set. By randomly splitting them into two groups, with 80% of them forming the training set and 20% of them forming the test set. We used transfer learning, which is commonly used in pre-existing neural networks, to detect and compare the model's accuracy. The considered models produce more exact results after modification and retraining with our own training photos. To categorize the image into numerous disease categories. For the classification of the photos, the optimal set of features picked by PSO from the features recovered by AlexNet were utilized to train the classifier (Fig. 3).
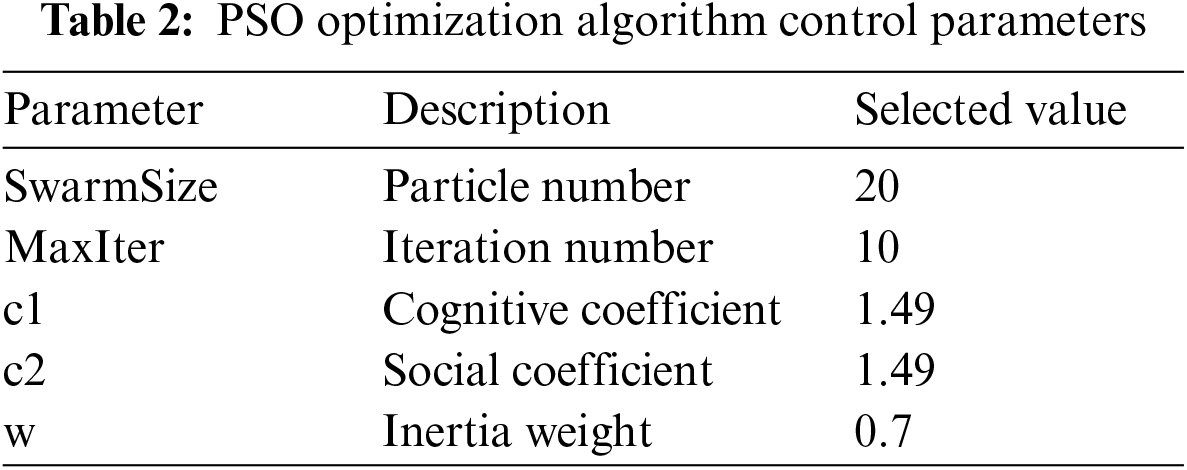
2.5 Hyper-parameters Optimizing Phase
The hyperparameters of AlexNet were optimized using PSO optimization techniques in this work. These optimization methods’ control parameters must be determined. Tab. 2 provide descriptions and selected values for control parameters.
Several performance criteria are used to validate the effectiveness of the pre-trained AlexNet models with transfer learning. The most widely used metrics are sensitivity, specificity, and accuracy. The classification accuracy, specificity, and sensitivity are interrelated which utilize the terms: true negative (TN), true positive (TP), false positive (FP), and false-negative (FN). TP stands for the total number of the anomalous images that have been identified as abnormal, TN stands for the number of normal images that have been tagged as normal, FP stands for the number of normal images that have been classified as abnormal, and FN stands for the number of aberrant images that have been classified as normal. Equations of sensitivity, accuracy and specificity are given as
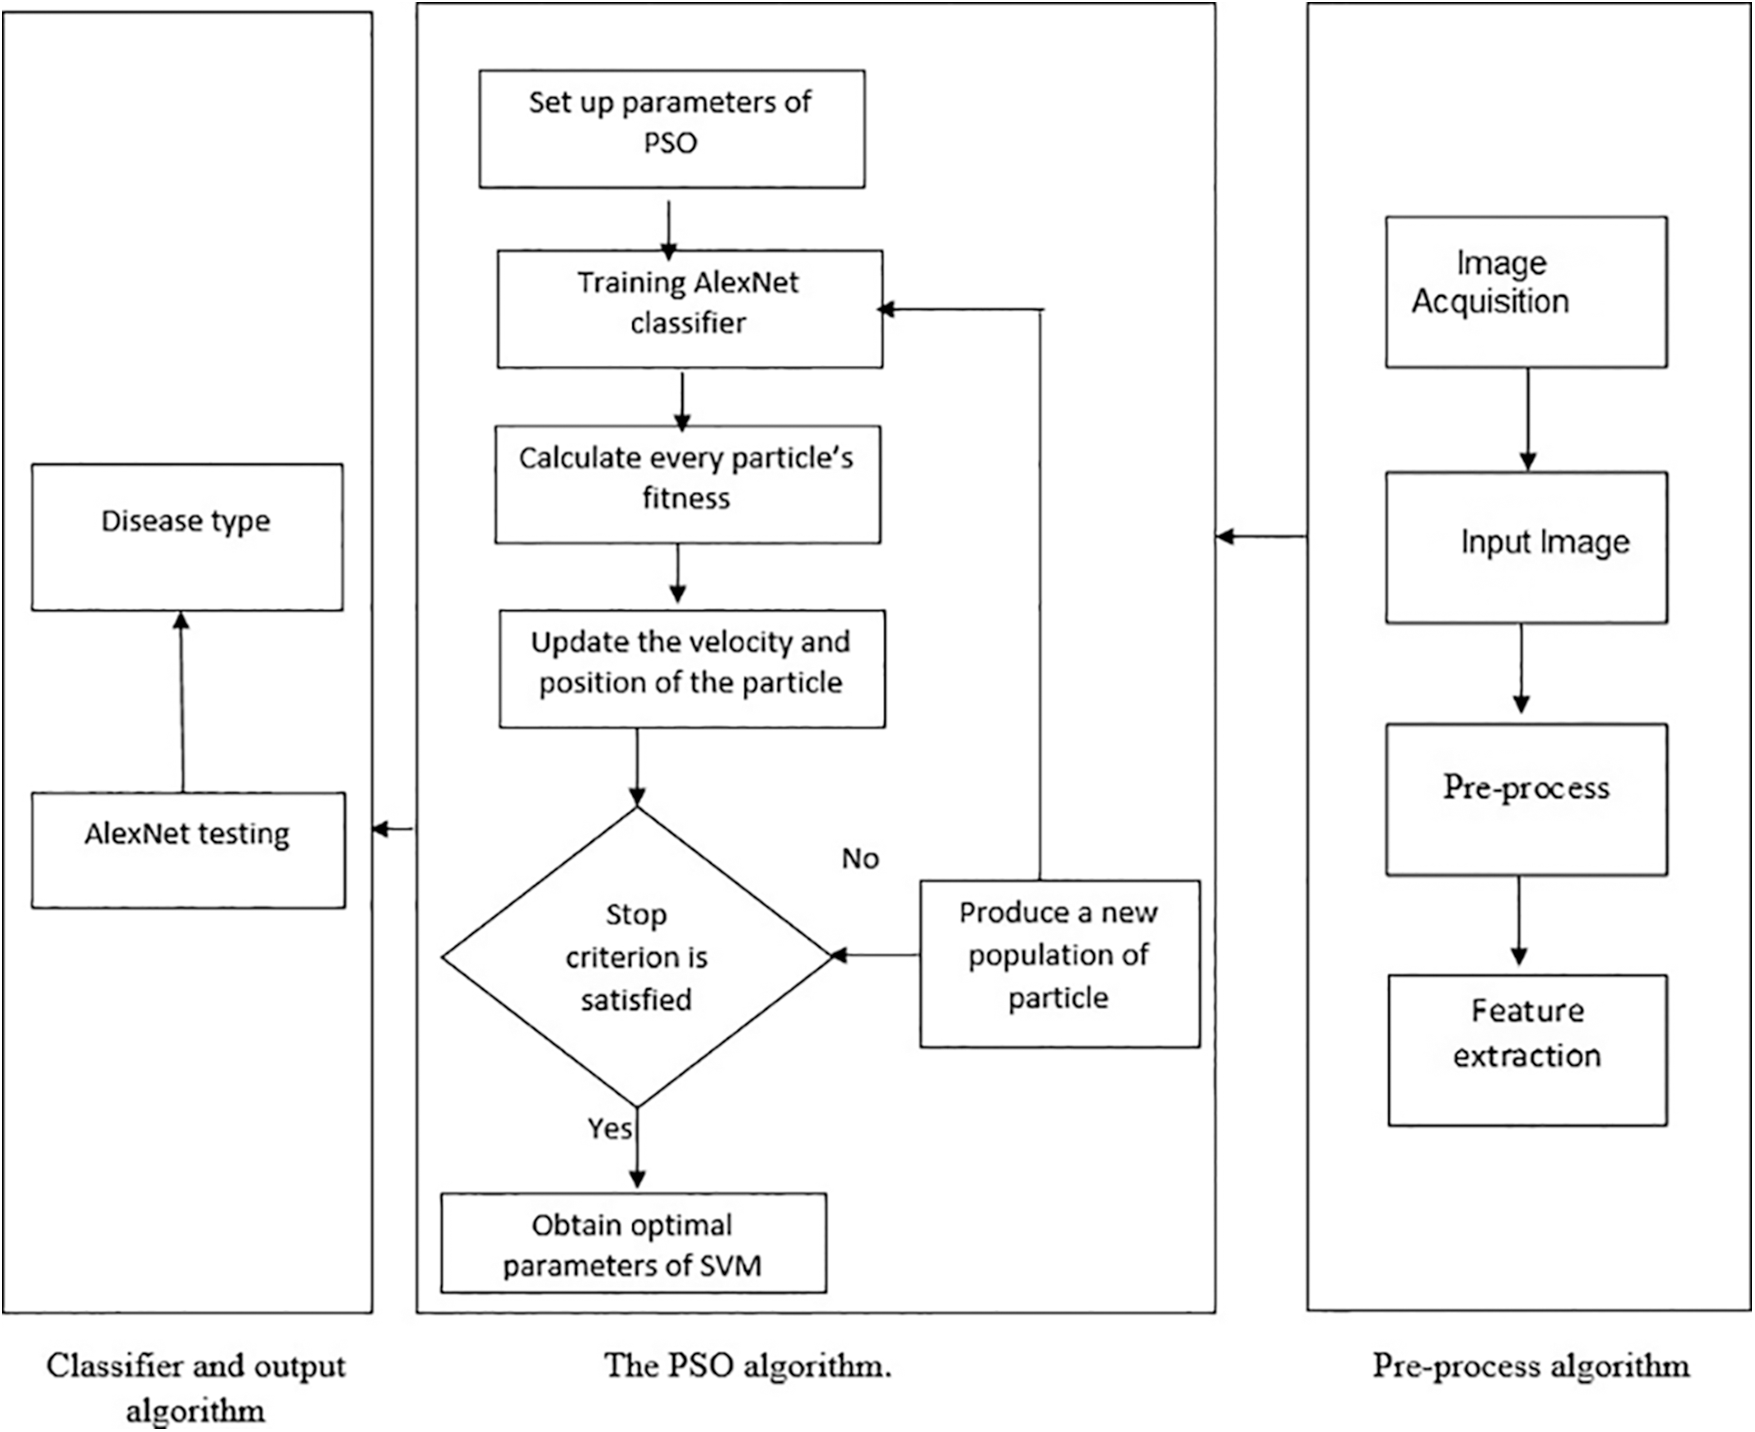
Figure 3: Flowchart shows PSO feature selection process
Additional indices were computed from the resulting confusion matrix, which included the precision and F-score, for additional performance measures to our datasets, using the method proposed as follows:
In our experiments, we used the image data set includes over 13,000 images of 5 crops, such as cotton, grape, cucumbers, wheat, and corn, the sample of images are shown in Fig. 4 as in [1]. In Tab. 3 there are 20 diseases that affect five different types of plants, as well as five healthy plant categories. If a sufficient number of training images are provided before final model creation, the system will be able to recognize any other disease or plant category. Fig. 5 depicts an example of each sample class.
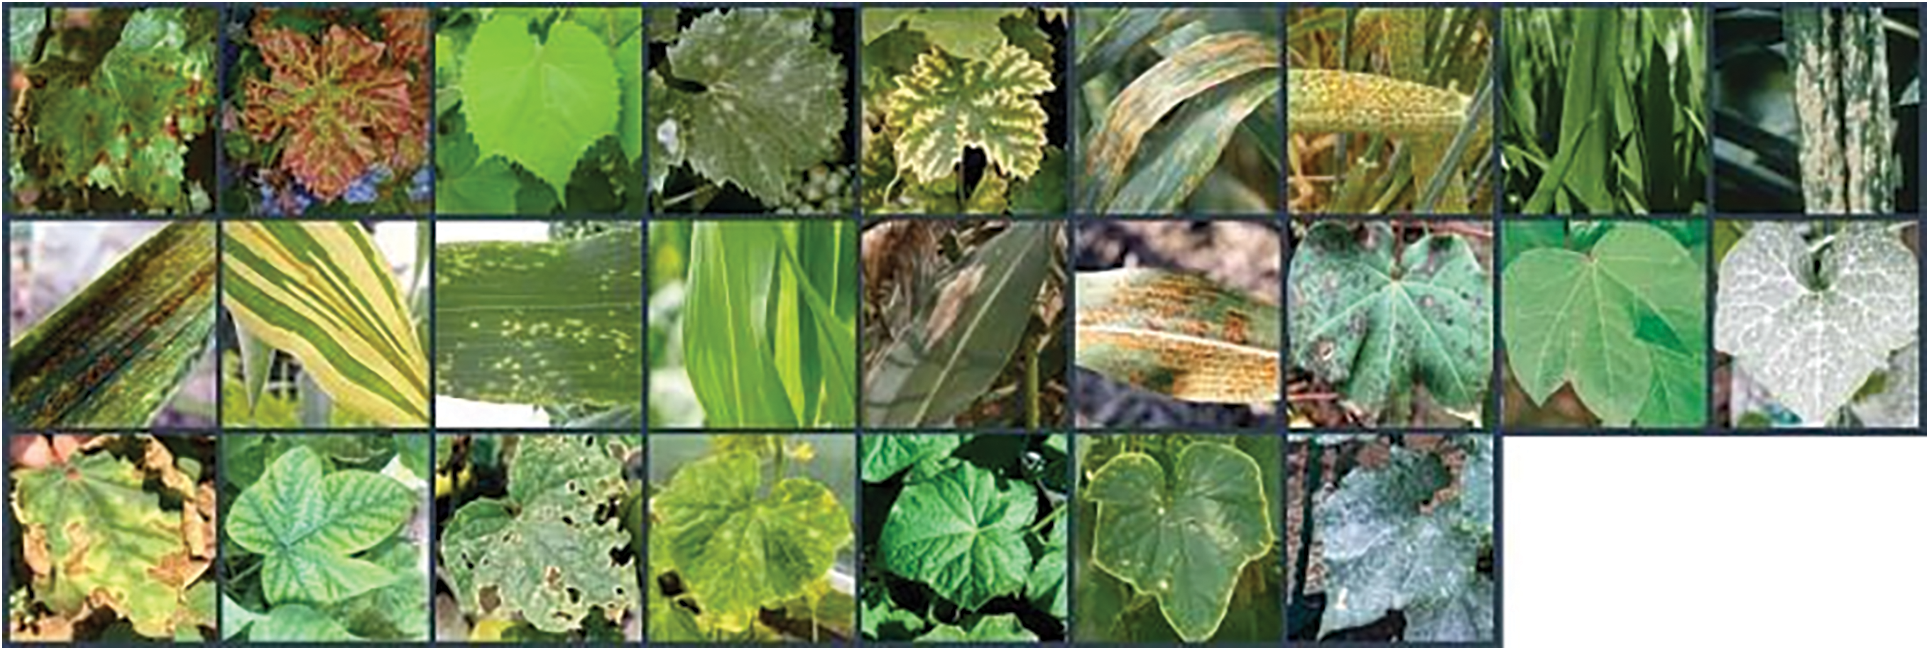
Figure 4: Sample of images
All experiments were carried out on a 64-bit Windows 10 operating system with an Intel (R) inside core i7 CPU and 4 GB RAM in a Google cloud environment. All of the codes are built in Python using the Keras 2.3.1 framework, which is an open source deep neural network toolkit. The studies on the pre-trained AlexNet and AlexNet + PSO to learn plant disease classifications are described in this part. Sensitivity, specificity, accuracy, precision, and F-score were the assessment measurements employed, and we calculated them using the prior equations. Our experiments were carried out to evaluate the suggested plant disease classification network's performance. To meet the problem, the training alternatives were tweaked. The mini-batch size was set to 50, which refers to a portion of the training data used in each iteration of the experiment. The maximum epochs, or the total number of epochs used in training, were set to 50. The pre-processing stages were initially implemented. The AlexNet input layer received each image. The training testing rate was chosen at random, ranging from 80% to 20%. As an input, each scalogram image was sent into the AlexNet. Tab. 2 shows that the pre-trained AlexNet and PSO outperformed the end-to-end learning technique in terms of sensitivity and specificity, reaching greater levels of accuracy as in Tab. 4.
The obtain results as shown in Tab. 4 of our algorithm have been compared with results in [1] as we used the same dataset. The experimental findings that our model outperforms the compared model in terms of accuracy and performance as mentioned in [1] that the average accuracy for plant disease detection amounted is 97.8%. The Fig. 6 shows the curves of the best Performance Measures model discovered by AlexNet+PSO on the Convex dataset for 50 epochs in comparison to the AlexNet model. We can observe that our model outperforms the AlexNet model in terms of accuracy, implying that the suggested AlexNet+PSO is genuinely adequate for finding acceptable models for a specific image classification dataset.
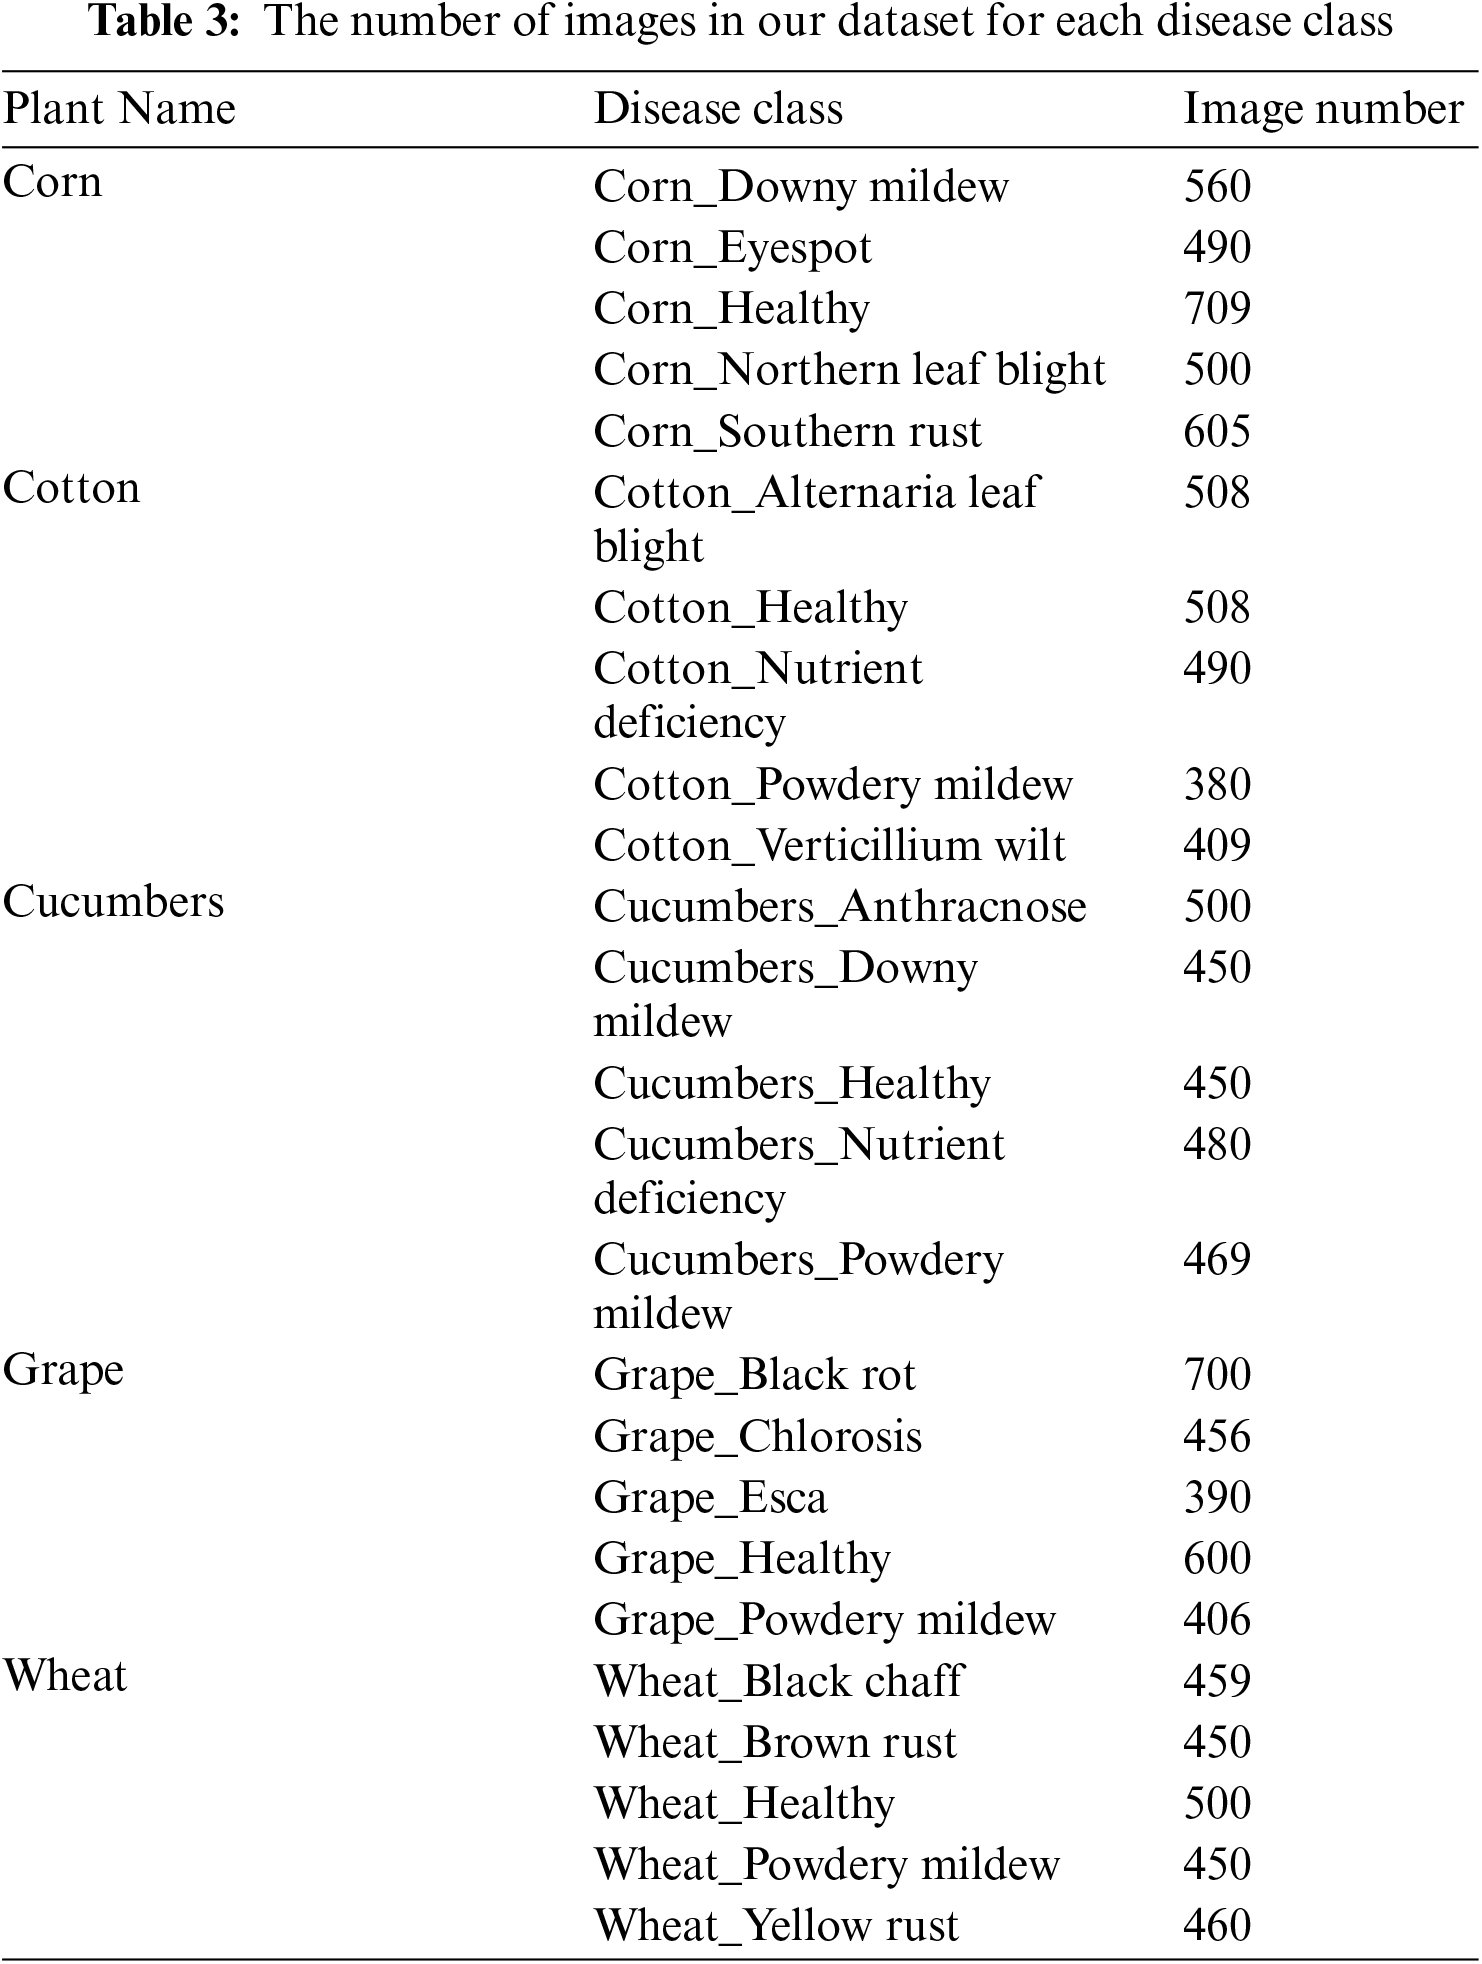
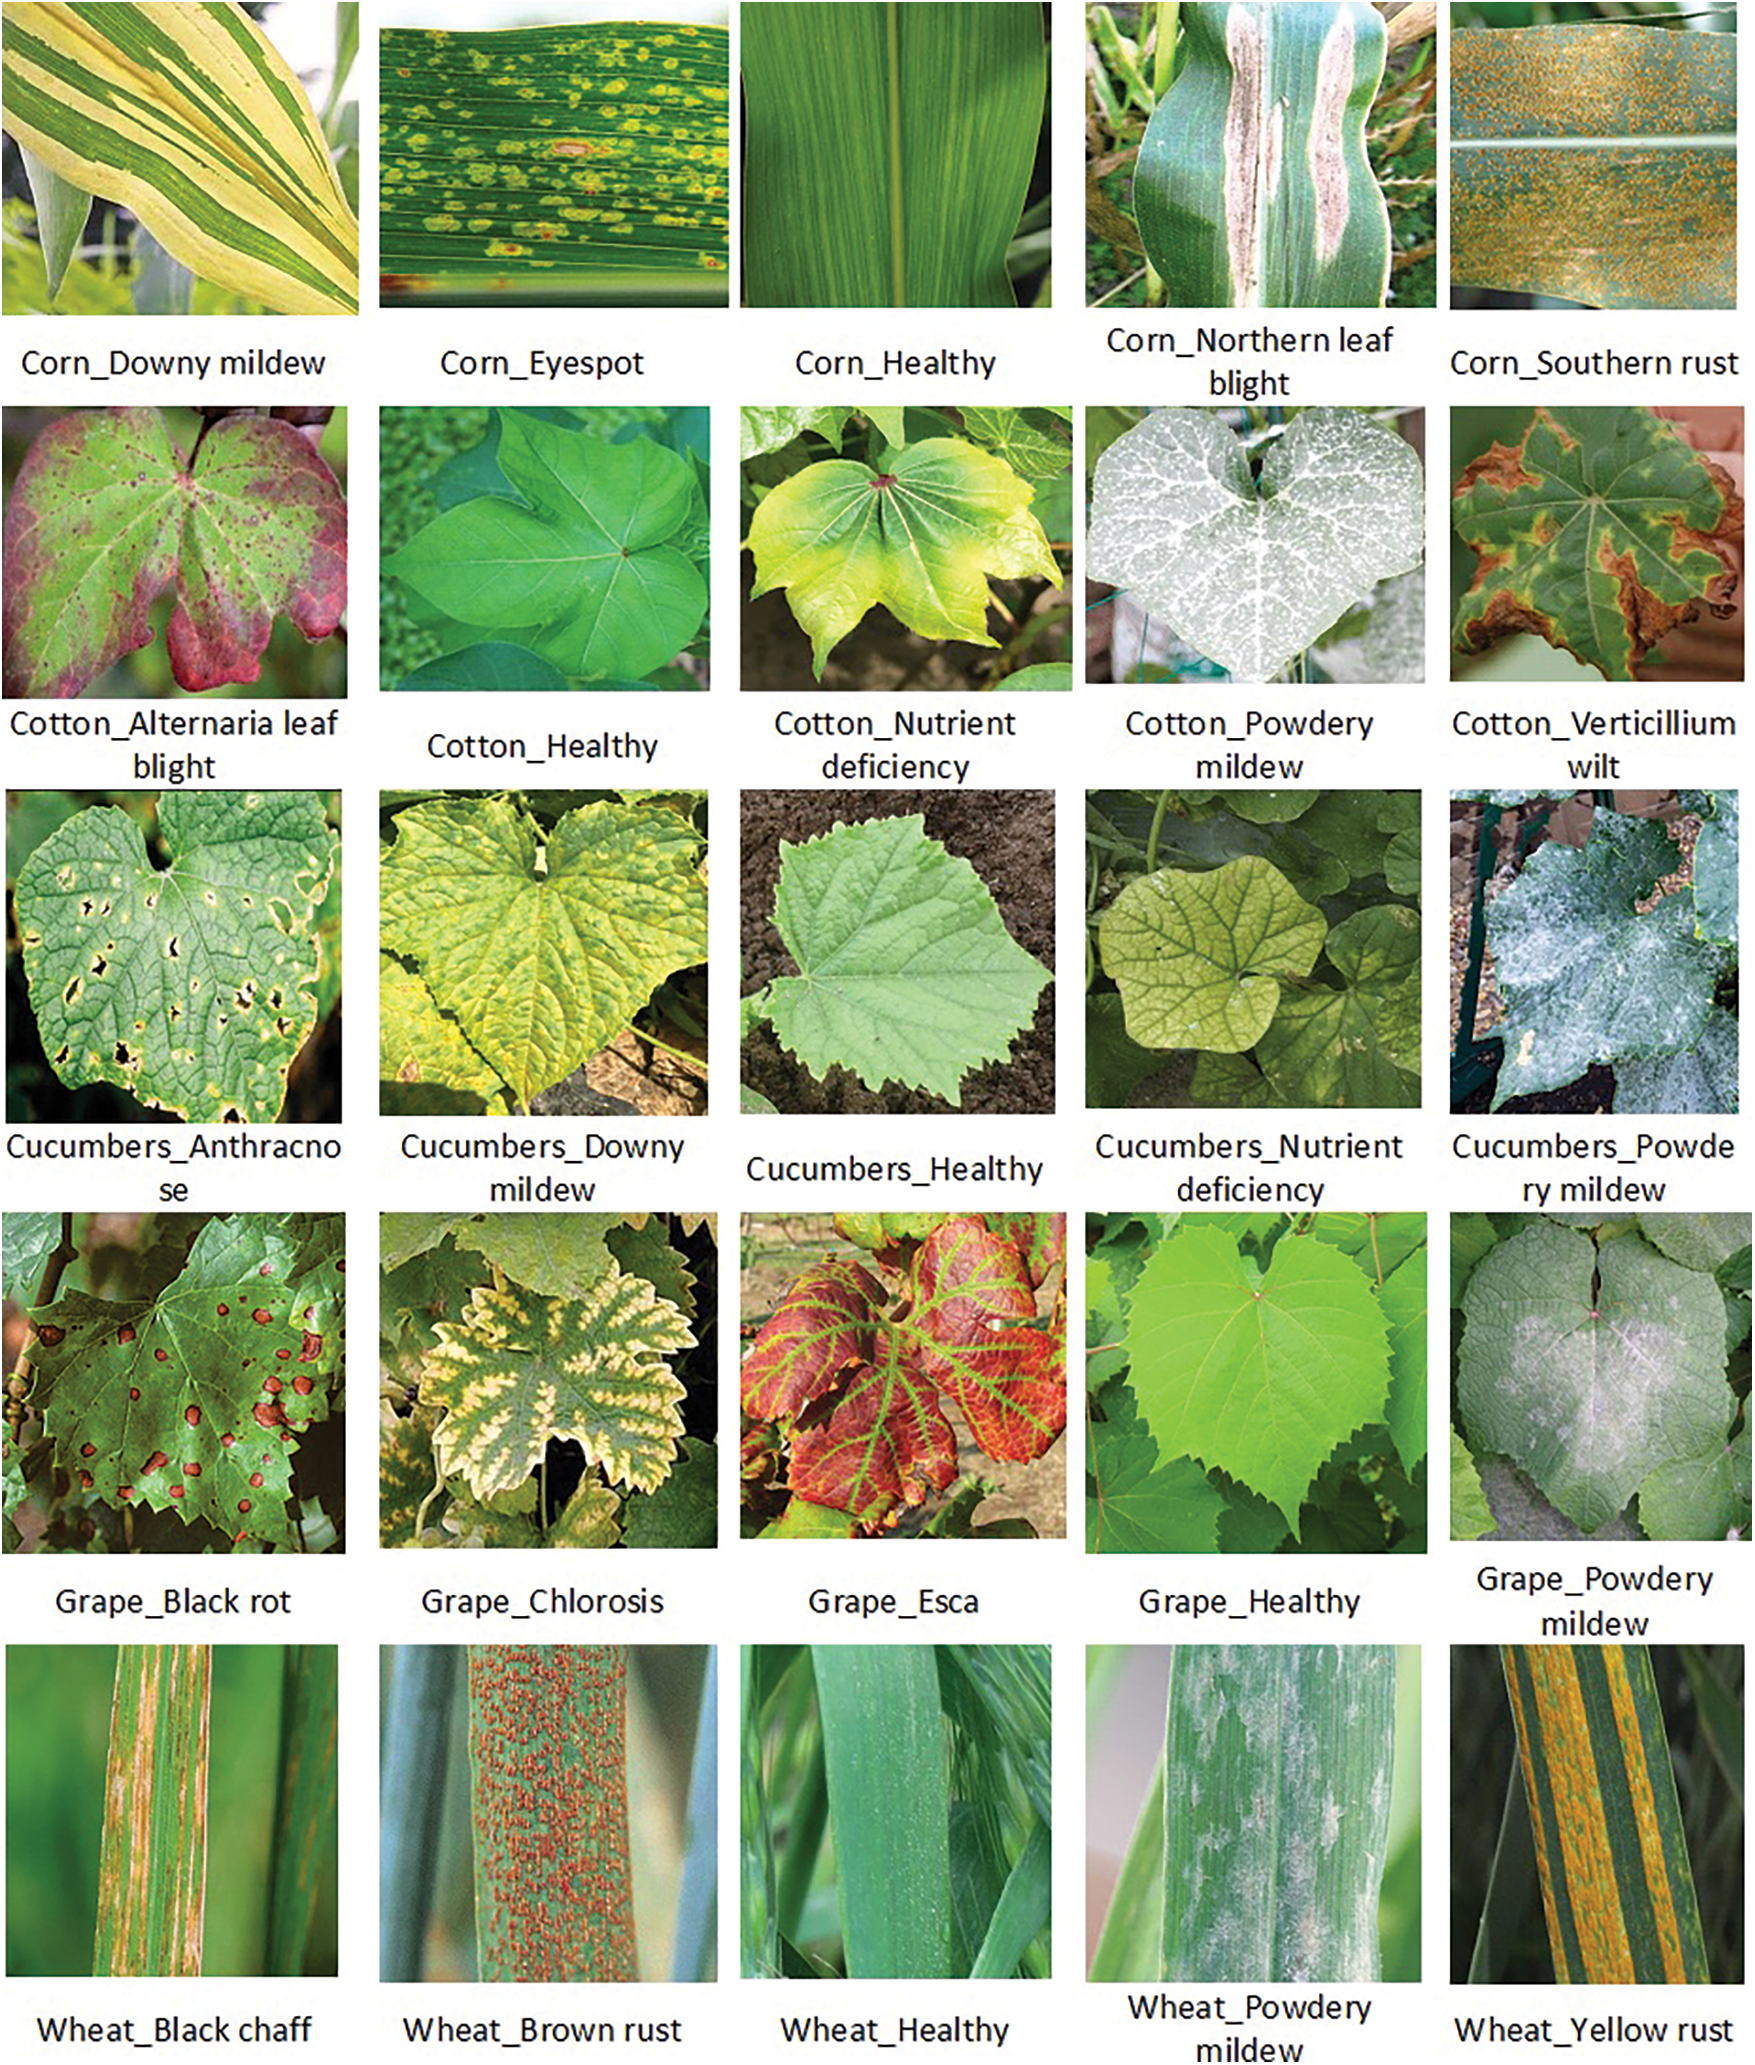
Figure 5: This figure illustrates the five plants and the diseases that each of them carries
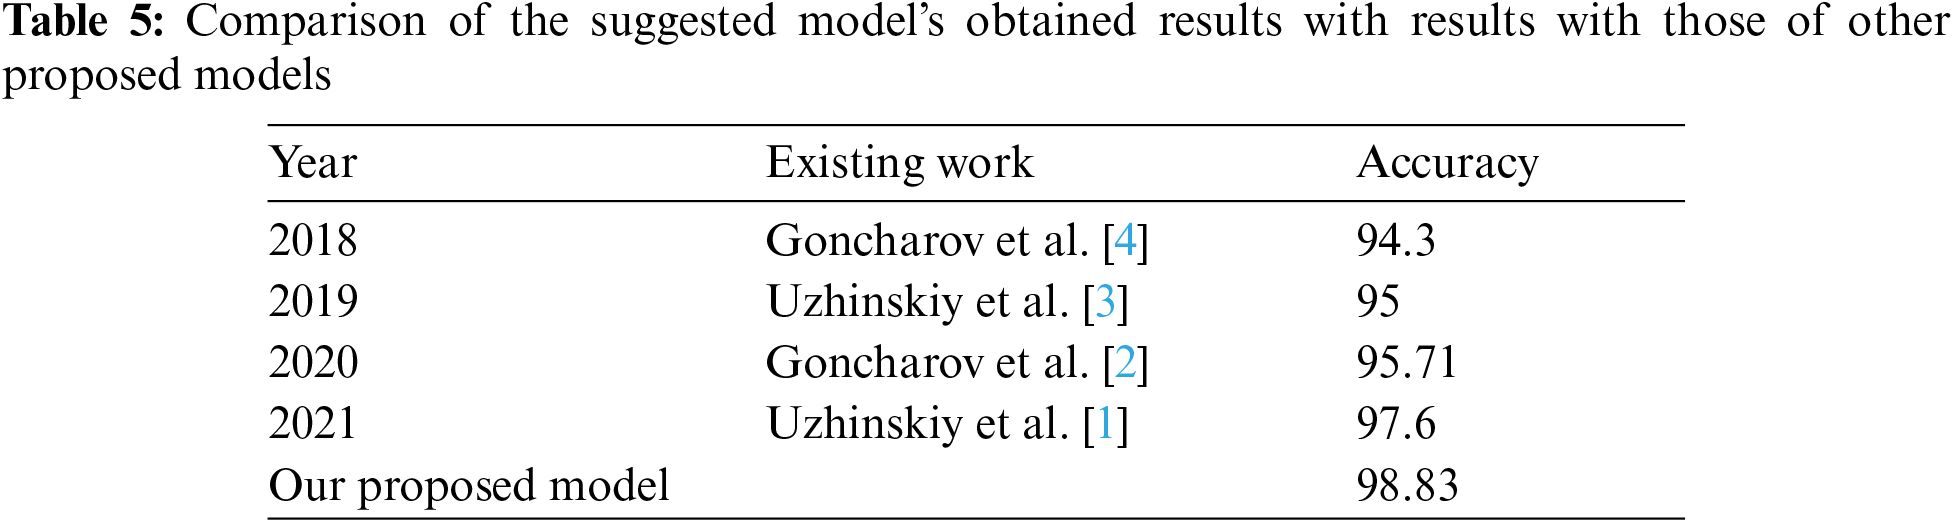
We compared our model with existing work well-known AutoML models most of the methods have used train/test split for training and validation. As showed in Tab. 5 that our results are better than other models.
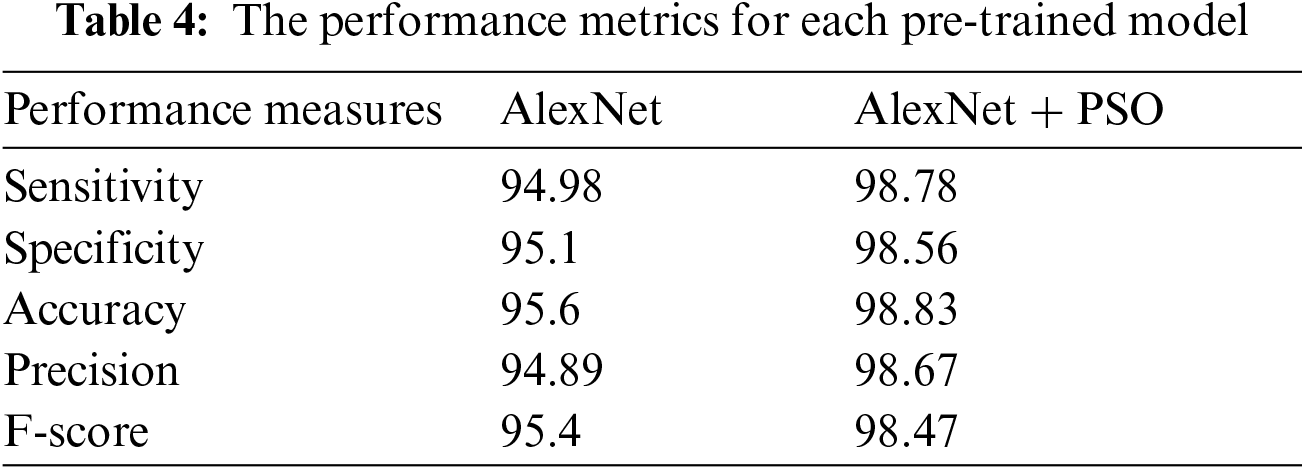
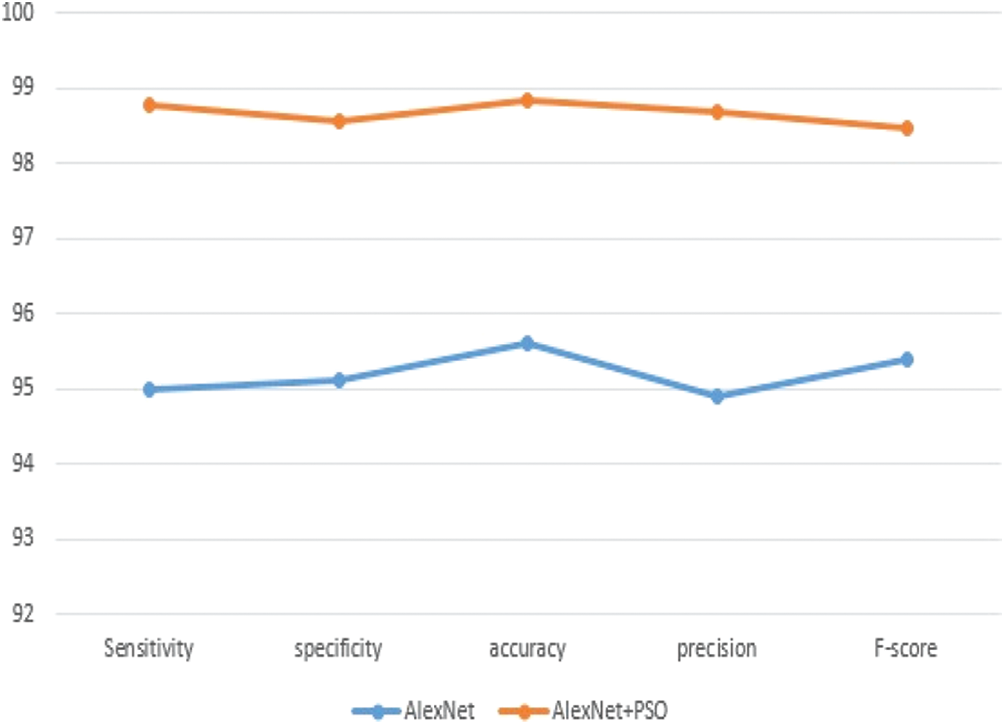
Figure 6: Performance measures for AlexNet model and AlexNet+PSO model
We developed a deep learning approach for plant disease detection trained on 25 classes of five crops shows 98.83% accuracy to facilitate the detection and prevention of diseases of agricultural plants. We compared our solution with some well-known AutoML products and showed that our model detected diseases well. This result is better than comparison approach with the Siamese network with two twins and with cross-entropy loss. Our approach has a great potential for classification tasks with a very small training dataset.
In future work, the possibility of the proposed model performing well on other datasets in the agriculture field. Moreover, it would be interesting to investigate the impact of an ensemble of other deep learning models or the use of another optimization method.
Acknowledgement: We would like to acknowledge the group effort made in this research and authors of articled [1–4] for making their dataset available free online.
Funding Statement: The authors received no specific funding for this study.
Conflicts of Interest: The authors declare that they have no conflicts of interest to report regarding the present study.
1. A. V. Uzhinskiy, G. A. Ososkov, P. V. Goncharov, A. V. Nechaevskiy and A. A. Smetanin, “One-shot learning with triplet loss for vegetation classification tasks,” Computer Optics, vol. 45, no. 4, pp. 608–614, 2021. [Google Scholar]
2. P. Goncharov, A. Uzhinskiy, G. Ososkov, A. Nechaevskiy and J. Zudikhina, “Deep siamese networks for plant disease detection,” in EPJ Web of Conf., Slovakia, vol. 226, pp. 03010. EDP Sciences, 2020. [Google Scholar]
3. A. V. Uzhinskiy, G. A. Ososkov, P. V. Goncharov and A. V. Nechaevskiy, “Multifunctional platform and mobile application for plant disease detection,” in Proc. 27th Symp. Nucl. Electr. Comp. CEUR Workshop Proc., Montenegro, vol. 2507, pp. 110–114, 2019. [Google Scholar]
4. P. Goncharov, G. Ososkov, A. Nechaevskiy, A. Uzhinskiy and I. Nestsiarenia, “Disease detection on the plant leaves by deep learning,” in Int. Conf. on Neuroinformatics, Cham, Springer, pp. 151–159, 2018. [Google Scholar]
5. F. Schroff, D. Kalenichenko and J. Philbin, “Facenet: A unified embedding for face recognition and clustering,” in Proc. of the IEEE Conf. on Computer Vision and Pattern Recognition, Boston, MA, USA, pp. 815–823, 2015. [Google Scholar]
6. A. Uzhinskiy, G. Ososkov and M. Frontasyeva, “Management of environmental monitoring data: UNECE ICP vegetation case,” in CEUR Workshop Proc., Montenegro, pp. 206–211, 2019. [Google Scholar]
7. D. Hughes and M. Salathé, “An open access repository of images on plant health to enable the development of mobile disease diagnostics,” ArXiv preprint arXiv: 1511.08060, 2015. [Google Scholar]
8. S. P. Mohanty, D. P. Hughes and M. Salathé, “Using deep learning for image-based plant disease detection,” Frontiers in Plant Science, vol. 7, pp. 1419, 2016. [Google Scholar]
9. E. C. Too, L. Yujian, S. Njuki and L. Yingchun. “A comparative study of fine-tuning deep learning models for plant disease identification,” Computers and Electronics in Agriculture, vol. 161, pp. 272–279, 2019. [Google Scholar]
10. K. P. Ferentinos. “Deep learning models for plant disease detection and diagnosis,” Computers and Electronics in Agriculture, vol. 145, pp. 311–318, 2018. [Google Scholar]
11. A. Fuentes, S. Yoon, S. C. Kim and D. S. Park, “A robust deep-learning-based detector for real-time tomato plant diseases and pests recognition,” Sensors, vol. 17, no. 9, pp. 2022–2043, 2017. [Google Scholar]
12. M. Türkoğlu and D. Hanbay, “Plant disease and pest detection using deep learning-based features,” Turkish Journal of Electrical Engineering & Computer Sciences, vol. 27, no. 3, pp. 1636–1651, 2019. [Google Scholar]
13. M. G. Selvaraj, A. Vergara, H. Ruiz, N. Safari, S. Elayabalan et al., “AI-Powered banana diseases and pest detection,” Plant Methods, vol. 15, no. 1, pp. 1–11, 2019. [Google Scholar]
14. M. H. Saleem, J. Potgieter and K. M. Arif, “Plant disease detection and classification by deep learning,” Plants, vol. 8, no. 11, pp. 468, 2019. [Google Scholar]
15. T. Ise, M. Minagawa and M. Onishi, “Identifying 3 moss species by deep learning, using the chopped picture method,” arXiv preprint arXiv: 1708.01986, 2017. [Google Scholar]
16. D. Cheng, Y. Gong, S. Zhou, J. Wang and N. Zheng, “Person re-identification by multi-channel parts-based cnn with improved triplet loss function,” in Proc. of the IEEE Conf. on Computer Vision and Pattern Recognition, Las Vegas, NV, USA, pp. 1335–1344, 2016. [Google Scholar]
17. A. Hermans, L. Beyer and B. Leibe, “In defense of the triplet loss for person re-identification,” arXiv preprint arXiv: 1703.07737, 2017. [Google Scholar]
18. X. Dong and J. Shen, “Triplet loss in siamese network for object tracking,” in Proc. of the European Conference on Computer Vision (ECCVMunich, Germany, pp. 459–474, 2018. [Google Scholar]
19. S. Puch, I. Sánchez and M. Rowe, “Few-shot learning with deep triplet networks for brain imaging modality recognition,” in Domain Adaptation and Representation Transfer and Medical Image Learning with Less Labels and Imperfect Data, Cham, Springer, pp. 181–189, 2019. [Google Scholar]
20. A. Thakur, D. Thapar, P. Rajan and A. Nigam, “Deep metric learning for bioacoustic classification: Overcoming training data scarcity using dynamic triplet loss,” The Journal of the Acoustical Society of America, vol. 146, no. 1, pp. 534–547, 2019. [Google Scholar]
21. J. Zhang, C. Lu, J. Wang, X. G. Yue, S. J. Lim et al., “Training convolutional neural networks with multi-size images and triplet loss for remote sensing scene classification,” Sensors, vol. 20, no. 4, pp. 1188, 2020. [Google Scholar]
22. M. Brahimi, M. Arsenovic, S. Laraba, S. Sladojevic, K. Boukhalfa et al., “Deep learning for plant diseases: Detection and saliency map visualisation,” in Human and Machine Learning, Cham, Springer, pp. 93–117, 2018. [Google Scholar]
23. D. M. Hawkins, “The problem of overfitting,” Journal of Chemical Information and Computer Sciences, vol. 44, no. 1, pp. 1–12, 2004. [Google Scholar]
 | This work is licensed under a Creative Commons Attribution 4.0 International License, which permits unrestricted use, distribution, and reproduction in any medium, provided the original work is properly cited. |