DOI:10.32604/cmc.2022.021998
| Computers, Materials & Continua DOI:10.32604/cmc.2022.021998 | |
| Article |
Forecasting of Appliances House in a Low-Energy Depend on Grey Wolf Optimizer
Computer Engineering Department, College of Computer and Information Technology, Taif University, Al Huwaya, Taif 26571, Saudi Arabia
*Corresponding Author: Hatim G. Zaini. Email: h.zaini@tu.edu.sa
Received: 23 July 2021; Accepted: 30 August 2021
Abstract: This paper gives and analyses data-driven prediction models for the energy usage of appliances. Data utilized include readings of temperature and humidity sensors from a wireless network. The building envelope is meant to minimize energy demand or the energy required to power the house independent of the appliance and mechanical system efficiency. Approximating a mapping function between the input variables and the continuous output variable is the work of regression. The paper discusses the forecasting framework FOPF (Feature Optimization Prediction Framework), which includes feature selection optimization: by removing non-predictive parameters to choose the best-selected feature hybrid optimization technique has been approached. k-nearest neighbors (KNN) Ensemble Prediction Models for the data of the energy use of appliances have been tested against some bases machine learning algorithms. The comparison study showed the powerful, best accuracy and lowest error of KNN with RMSE = 0.0078. Finally, the suggested ensemble model's performance is assessed using a one-way analysis of variance (ANOVA) test and the Wilcoxon Signed Rank Test. (Two-tailed P-value: 0.0001).
Keywords: Prediction; optimization; appliances; energy; feature selection
Many research studies have been introduced to understand the energy appliances which use in buildings. The appliances represent a significant portion (between 20% and 30%) of the electrical energy demand appliances, such as televisions and consumer electronics operating in standby, attributed to a 10.2% increase in electricity consumption. Many Regression models for energy can be used to comprehend the connections between different factors and evaluate their effect [1].
Prediction models of electrical vitality utilization in structures can be helpful for various applications. For example, it is used to decide sufficient estimating of photovoltaics and vitality stockpiling. In addition, lessen power flow into the grid, model predictive control applications where the heaps are required for demand-side management (DSM) and demand-side response (DSR). Furthermore, it uses to evaluate building performance simulation analysis [2].
The power utilization in residential structures is clarified by two primary factors: the sort and number of electrical apparatuses and the utilization of the machines by the inhabitants. In addition, the structure in various areas could likewise decide the utilization of the devices.
In the indoor condition close to the region of the apparatus, for example, the temperature, mugginess, vibrations, light, and commotion. Typically, the two components are interrelated [3].
The no-free lunch NFL theorem and attempts to address existing flaws inspired us to create the suggested optimization method. Unfortunately, there is no one-size-fits-all meta-heuristic that can solve all optimization issues. It explains why some meta-heuristics are better at solving certain optimization problems than others. As a result, additional optimizations continue to be offered. Slow convergence, the balance between exploration and exploitation, and stagnation into local optima are some of the shortcomings of existing optimization methods addressed by our suggested optimization algorithm [4].
The main goal of this paper is to understand the relationships between appliances' energy consumption and different predictors. And introduce prediction models can deal with appliances energy dataset. The outline of this paper is proposed our framework (Feature Optimization Prediction framework) FOPF discuss its performance compared with different models (linear regression, Artificial Neural Network, and Random Forest) to predict energy consumption.
Many research discusses electricity load prediction to identify the parameters. Typically studies have used models such as multiple regression, neural networks, support vector machines, etc., for forecasting the electricity demand. The models ordinarily have considered parameters such as wind speed, open-air temperature, end of the week, occasions, worldwide sun-powered radiation, and hour of the day [5].
Most paper in this topic highlights the following points [6]:
• The vitality utilization of appliances to a significant portion of the collected power request
• The vitality utilization of appliances might be separated into different commitments and here and there may incorporate HVAC (heating, ventilation, and air conditioning)
• Is the weather agent enough to improve the apparatuses' vitality utilization expectation?
• Could the temperature and dampness estimations from a remote system help in the vitality expectation?
• Which parameters are the most significant in vitality expectation?
Meta-heuristic optimization algorithms have grown in popularity due to their ease of use and flexibility compared to traditional and precise optimization methods such as Greedy Search and Local Search. Furthermore, those meta-heuristic optimization algorithms are versatile because they may be used in various domains and applications without requiring significant design and implementation adjustments. Likewise, owing to their stochastic character, they can avoid local optima by exploring the search space extensively and avoiding stagnation in local optima [7].
On various optimization issues, such as temperature prediction, battery storage optimization, and leukemia detection [8], optimization algorithms have improved performance [9–11]. Electronics [12], informatics [13], energy [14–16], health [17], and many more disciplines of business [18–21] and research are among the numerous real-world applications [22–27].
The point of regression analysis is to anticipate a result dependent on verifiable information. However, in some genuine relapse issues, one regularly experiences uncertain information, including non-useful highlights, which significantly expands the blunder of the calculations. To beat this issue, we propose FOPF, which comprises two stages: First Phase: Feature Selection Optimization, Second Phase: Training Ensemble Model. As shown in Fig. 1.
3.1 First Phase: Feature Selection Optimization
Feature analysis is usually recommended before regression analysis.
Dataset
“The data set is at 10 min for about 4.5 months. The house temperature and humidity conditions were monitored with a ZigBee wireless sensor network.”
Removal of Null Values
We removed rows that contain null values or contains any missing data.
Feature Scaling (between 0--1)
As shown in the equation for scaling, we used Min-Max-Scalar to bring the attribute's value between 0 and 1.

Figure 1: Propose FOPF first phase: Feature selection optimization
Information gain
IG ranks each feature according to its entropy and selects the most important features according to the prespecified threshold to complete feature selection for the preprocessed dataset hybrid optimization technique has been approached by equipping it with three powerful algorithms. The first set of rules is PSO, in which individuals are shifting influenced with the aid of their local best positions and by the high-quality global position. The 2d optimizer in our proposed hybrid approach is Grey Wolf Optimizer. GWO is a swarm-primarily based meta-heuristic optimizer that mimics the social hierarchy and the foraging conduct of the grey wolves. Individuals in GWO circulate influenced utilizing the three leader's alpha, beta, and delta areas. The third is a genetic algorithm that accrues convergence with decorating the position of a selected solution around randomly selected leaders called Mutation operator random modifications one or more additives of the offspring.
Particle Swarm Optimization
Velocity is the position Change of a particle. During this time, the position of the particle is changed. At the flight, the particle's velocity is randomly accelerated toward its previous best position and a neighborhood best solution
Grey Wolf Optimizer
GWO is originated from mathematically formulating the hunting behavior used by the grey wolves hunting technique as shown in Fig. 2.

Figure 2: Search agents’ positions updating in GWO
The position of each wolf is updated using the following equations:
where t refers to the current iteration,
Mutation
The random modification of portions of a solution, which enhances population diversity and provides a means for escape from a local optimum, is presented. The addition of new traits to the population pool may be beneficial, in which case the mutated person has a high fitness value and is likely to be selected many times, or it may be detrimental, in which case the individual is removed from the population pool. Mutation operator involves creating three indices randomly in range over [1, n] where n is the population size.
Crossover
In chromosomes or solution representations, they are swapping portions of the solution with another. The basic function is to offer mixing and convergence of solutions in a subspace. Crossover between the new mutant solution vector Vi and the original solution vector Xi according.
Elitism
Elitism or fittest's survival is defined as the use of high-fit solutions to pass on to future generations, which is generally done in the form of some sort of best-solution selection.
3.2 Second Phase: Training Ensemble Model
In addition to feature selection Optimization, we have divided the dataset into two parts: training data (75%) and testing data (25%). The original dataset contains 19737 records. The training data comprises 14804 records, and the testing data contains 4933 records. The training data is used to train (linear regression, Artificial Neural Network, and Random Forest) used to calculate the error, and the accuracy of each then compared the results with our proposed KNN ensemble.
Linear regression
Linear regression constitutes the relation between two variables by fitting a linear equation to the observed data. One variable is regarded as an explanatory variable, while the other is viewed as a dependent variable. A modeler may, for example, use a linear regression model to connect people's weights to their heights. Linear regression is used to model the linear relationship between a based variable and one or more dependent variables. The linear regression model was able to predict the value with RMSE = 0.0131.
Artificial Neural Network (ANN)
An artificial neural network is made up of three or more linked layers. Input neurons make up the first layer. These neurons send input to deeper layers, then deliver the final output data to the output layer. Inner layers are concealed and are produced by units that use a series of transformations to adjust the information received from layer to layer. Multi-Layer perceptron (MLP) is a type of feedforward neural network with one or more hidden layers among the input and output layers. MLP layers are entirely connected, meaning that a neuron in one layer is hooked up to all neurons within the following layer. Each connection has a distinctive weight value. MLP is educated with a backpropagation algorithm. The network was able to predict the value with RMSE = 0.0944.
Random Forest Algorithm
Because it uses both bagging and feature randomness to generate an uncorrelated forest of decision trees, the random forest technique extends the bagging method. Feature bagging is another term for feature randomness. Assures minimal correlation among decision trees by generating a random selection of features. A fundamental distinction between decision trees and random forests is this. Random forests only evaluate a subset of the available feature splits, whereas decision trees consider all. The random forest algorithm comprises a group of decision trees, each of which is made up of a bootstrap sample selected from a training set. Combines a couple of decision trees to enhance the generalizability and the robustness over an unmarried choice tree. The Random Forest was able to predict the value with RMSE = 0.0123.
Ensemble approaches, which combine several regressors, have received much interest in the recent two decades as potential strategies for improving the regression performance of weak learners. In many real-world applications, these approaches reduce regression error significantly and, in general, are more resistant to non-informative data characteristics than individual models. However, using an ensemble to improve KNN performance is a difficult challenge. Because KNN is already a stable regressor, the “traditional” ensemble approaches of bagging and boosting do not work with it. The component regressors must be correct to improve performance using an ensemble.
The ensemble method is combining the output of algorithms by giving each weight. Ensemble techniques turn out to be one of all the good-sized techniques in improving the foreseeing potential of standard models as shown in Fig. 3.

Figure 3: KNN ensemble
The output value of K training records became chosen as the nearest friends are used to predict the output cost of the unknown testing statistics. KNN regression use the subsequent formula
KNN Ensemble was able to predict the value of the lowest error in comparison with others by RMSE = 0.0078.
KNN gives the lowest error compared to the three-based model. KNN can control overfitting and handle missing values. This method seeks the understanding of crowds in predicting KNN regression. RMSE, MAE Results was shown in Tab. 1. KNN Ensemble Real Predicted Values shown in Fig. 4. Also, a positive correlation between appliances’ consumption and weather conditions was found. shown in Fig. 5


Figure 4: KNN ensemble real predicted values
In statistics, estimation refers to many techniques for calculating the value of a population's property based on observations from a sample selected from the population.

Figure 5: Conditions correlation
We will need evidence to back our strategy in order to make a confident and trustworthy conclusion. This is where the ANOVA idea comes in handy as in Tab. 2.

The Q-Q plot, also known as a quantile-quantile plot, is a graphical tool that may be used to determine if a collection of data is likely to have come from a theoretical distribution such as a Normal or exponential distribution, which is shown in Fig. 6. Tab. 3 illustrated the Wilcoxon Signed Rank Test.
Internally, histograms are used to summarize data and offer size estimates for searches, as shown in Fig. 7. Because these histograms are not offered to consumers or exhibited physically, a larger range of possibilities for their creation are accessible.
Compression with Optimization algorithms
The compression methods introduce many optimization algorithms such as genetic algorithm GA and practical swarm optimization PSO and grey wolf optimization GWO, which appear to be a strong the proposed framework FOPF quality and reducing the limitations of cost and superiority as results show in Tab. 4 and Fig. 8.
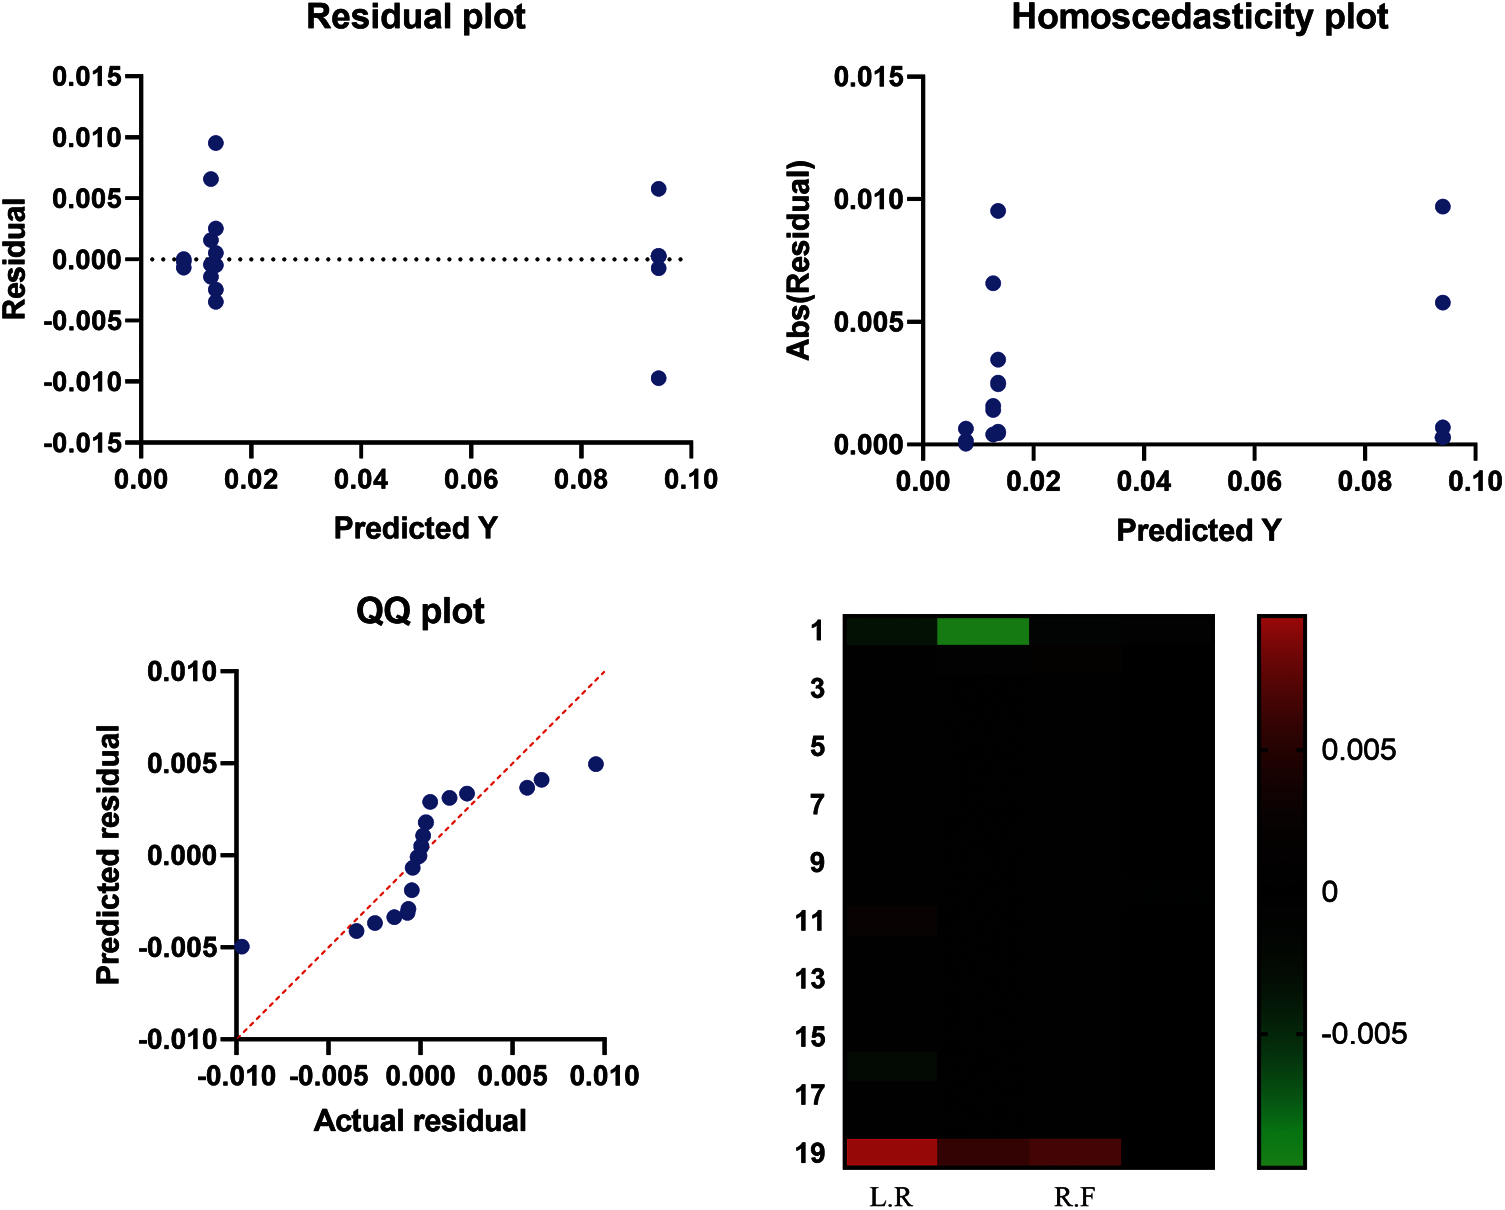
Figure 6: The Q-Q plot


Figure 7: Histogram of RMSE

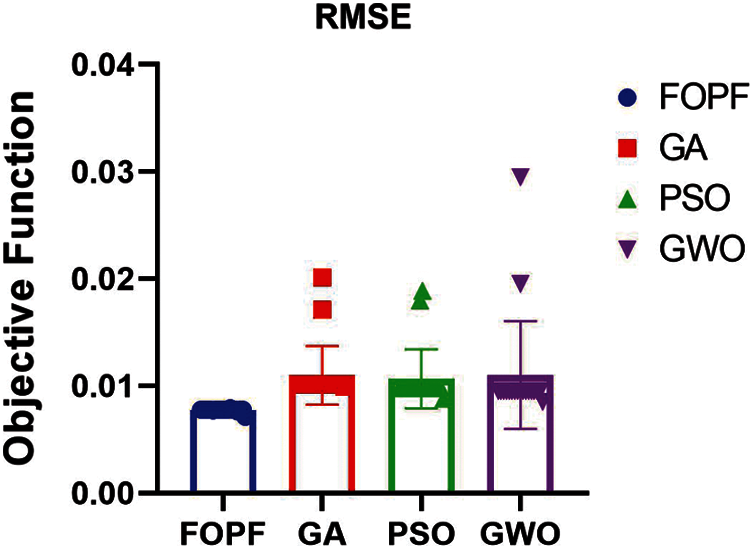
Figure 8: FOPF against optimization algorithms
Appliance energy consumption was ranked first in significance for energy forecasting: feature ranking and data filtering to eliminate non-predictive factors. Although FOPF has high performance in the feature Selection case, it depends on a hybrid optimization technique. Therefore, using various machine learning techniques, there is a need to control energy consumption by employing various optimization techniques and forecasting demand. Nevertheless, the comparative results show the performance. Furthermore, they can be justified because the KNN Ensemble is appropriate for dealing with appliances' energy forecasting and a positive correlation between appliances' consumption and weather conditions.
Funding Statement: This work was supported by the Taif University Researchers Supporting Project Number (TURSP-2020/345), Taif University, Taif, Saudi Arabia.
Conflicts of Interest: The authors declare that they have no conflicts of interest to report regarding the present study.
1. K. Jasmeet and A. Bala, “A hybrid energy management approach for home appliances using climatic forecasting,” in Building Simulation. vol. 12, Tsinghua, China: Tsinghua University Press, pp. 1033–1045, 2019. [Google Scholar]
2. C. Chellaswamy, R. Babu and A. Vanathi, “A framework for building energy management system with residence mounted photovoltaic,” in Building Simulation. vol. 14, Tsinghua, China: Tsinghua University Press, pp. 1031–1046, 2021. [Google Scholar]
3. M. S. Alkatheiri, M. Alqarni and S. H. Chauhdary, “Cyber security framework for smart home energy management systems,” Sustainable Energy Technologies and Assessments, vol. 46, no. 11, pp. 101232, 2021. [Google Scholar]
4. M. M. Fouad, A. I. El-Desouky, R. Al-Hajj and E. S. M. El-Kenawy, “Dynamic group-based cooperative optimization algorithm,” IEEE Access, vol. 8, pp. 148378–148403, 2020. [Google Scholar]
5. E. M. Hassib, A. I. El-Desouky, E. M. El-Kenawy and S. M. El-Ghamrawy, “An imbalanced big data mining framework for improving optimization algorithms performance,” IEEE Access, vol. 7, no. 1, pp. 170774–170795, 2019. [Google Scholar]
6. E. M. Hassib, A. I. El-Desouky, L. M. Labib and E. S. M. T. El-Kenawy, “Woa + brnn: An imbalanced big data classification framework using whale optimization and deep neural network,” Soft Computing, vol. 24, no. 8, pp. 5573–5592, 2020. [Google Scholar]
7. A. Ibrahim, H. A. Ali, M. M. Eid and E. S. M. El-Kenawy, “Chaotic harris hawks optimization for unconstrained function optimization,” in 2020 16th Int. Computer Engineering Conf. (ICENCOCairo, Egypt, IEEE, pp. 153–158, 2020. [Google Scholar]
8. E. S. M. El-kenawy, A. Ibrahim, S. Mirjalili, M. M. Eid and S. E. Hussein, “Novel feature selection and voting classifier algorithms for COVID-19 classification in CT images,” IEEE Access, vol. 8, no. 1, pp. 179317–179335, 2020. [Google Scholar]
9. E. S. M. El-Kenawy, M. M. Eid, M. Saber and A. Ibrahim, “MbGWO-SFS: Modified binary grey wolf optimizer based on stochastic fractal search for feature selection,” IEEE Access, vol. 8, no. 1, pp. 107635–107649, 2020. [Google Scholar]
10. M. M. Eid, E. S. M. El-Kenawy and A. Ibrahim, “A binary sine cosine-modified whale optimization algorithm for feature selection,” in 4th National Computing Colleges Conf. (NCCC 2021IEEE, pp. 1–6, 2021. [Google Scholar]
11. A. Ibrahim, A. Tharwat, T. Gaber and A. E. Hassanien, “Optimized superpixel and adaboost classifier for human thermal face recognition,” Signal, Image and Video Processing, vol. 12, no. 4, pp. 711–719, 2018. [Google Scholar]
12. S. S. M. Ghoneim, T. A. Farrag, A. A. Rashed, E. S. M. El-Kenawy and A. Ibrahim, “Adaptive dynamic meta-heuristics for feature selection and classification in diagnostic accuracy of transformer faults,” IEEE Access, vol. 9, pp. 78324–78340, 2021. [Google Scholar]
13. A. Ahmed, A. Ibrahim and S. Hussein, “Detection of palm tree pests using thermal imaging: A review,” in Hassanien, A. (Eds.Machine Learning Paradigms: Theory and Application. Studies in Computational Intelligence, vol. 801. Cham: Springer, 2019. [Google Scholar]
14. E. S. M. El-kenawy and M. Eid, “Hybrid gray wolf and particle swarm optimization for feature selection,” International Journal of Innovative Computing, Information and Control, vol. 16, no. 3, pp. 831–844, 2020. [Google Scholar]
15. A. Ibrahim, S. Mohammed, H. A. Ali and S. E. Hussein, “Breast cancer segmentation from thermal images based on chaotic salp swarm algorithm,” IEEE Access, vol. 8, no. 1, pp. 122121–122134, 2020. [Google Scholar]
16. M. M. Eid, E. S. M. El-Kenawy and A. Ibrahim, “Anemia estimation for covid-19 patients using a machine learning model,” Journal of Computer Science and Information Systems, vol. 17, no. 11, pp. 1–7, 2021. [Google Scholar]
17. H. R. Hussien, E. S. M. El-Kenawy and A. I. El-Desouky, “EEG channel selection using a modified grey wolf optimizer,” European Journal of Electrical Engineering and Computer Science, vol. 5, no. 1, pp. 17–24, 2021. [Google Scholar]
18. E. S. M. El-Kenawy, S. Mirjalili, A. Ibrahim, M. Alrahmawy, M. El-Said et al., “Advanced meta-heuristics, convolutional neural networks, and feature selectors for efficient COVID-19 x-ray chest image classification,” IEEE Access, vol. 9, pp. 36019–36037, 2021. [Google Scholar]
19. A. Ibrahim, M. Noshy, H. A. Ali and M. Badawy, “PAPSO: A poweraware VM placement technique based on particle swarm optimization,” IEEE Access, vol. 8, no. 1, pp. 81747–81764, 2020. [Google Scholar]
20. M. Noshy, A. Ibrahim and H. Arafat Ali, “Optimization of live virtual machine migration in cloud computing: A survey and future directions,” Journal of Network and Computer Applications, vol. 110, no. 2, pp. 1–10, 2018. [Google Scholar]
21. H. Hassan, A. I. El-Desouky, A. Ibrahim, E. M. El-Kenawy and R. Arnous, “Enhanced QoS-based model for trust assessment in cloud computing environment,” IEEE Access, vol. 8, no. 1, pp. 43752–43763, 2020. [Google Scholar]
22. H. Banerjee, G. Saparia, V. Ganapathy, P. Garg and V. M. Shenbagaraman, “Time series dataset for risk assessment in supply chain networks,” Mendeley Data, vol. V2, pp. 1–3, 2019. [Google Scholar]
23. R. Al-Hajj, A. Assi and M. M. Fouad, “Stacking-Based ensemble of support vector regressors for one-day ahead solar irradiance prediction,” in 8th Int. Conf. on Renewable Energy Research and Applications (ICRERABrasov, Romania, pp. 428–433, 2019. [Google Scholar]
24. T. Gaber, A. Tharwat, A. Ibrahim, V. Snael and A. E. Hassanien, “Human thermal face recognition based on random linear oracle (RLO) ensembles,” in Int. Conf. on Intelligent Networking and Collaborative Systems, Taipei, Taiwan, pp. 91–98, 2015. [Google Scholar]
25. A. Ibrahim and E. S. M. El-Kenawy, “Image segmentation methods based on superpixel techniques: A survey,” Journal of Computer Science and Information Systems, vol. 15, no. 3, pp. 1–11, 2020. [Google Scholar]
26. A. Ibrahim and E. S. M. El-Kenawy, “Applications and datasets for superpixel techniques: A survey,” Journal of Computer Science and Information Systems, vol. 15, no. 3, pp. 1–6, 2020. [Google Scholar]
27. A. Ibrahim, T. Gaber, T. Horiuchi, V. Snasel and A. E. Hassanien, “Human thermal face extraction based on superpixel technique,” in 1st Int. Conf. on Advanced Intelligent System and Informatics (AISI2015Beni Suef, Egypt, pp. 163–172, 2016. [Google Scholar]
 | This work is licensed under a Creative Commons Attribution 4.0 International License, which permits unrestricted use, distribution, and reproduction in any medium, provided the original work is properly cited. |