DOI:10.32604/cmc.2022.017220
| Computers, Materials & Continua DOI:10.32604/cmc.2022.017220 | |
| Article |
Webpage Matching Based on Visual Similarity
1School of Cyberspace Science, Harbin Institute of Technology, Harbin, 150001, China
2Department of Computer and Information Science, Temple University, Philadelphia, 42101, USA
*Corresponding Author: Xiangzhan Yu. Email: yxz@hit.edu.cn
Received: 24 January 2021; Accepted: 03 July 2021
Abstract: With the rapid development of the Internet, the types of webpages are more abundant than in previous decades. However, it becomes severe that people are facing more and more significant network security risks and enormous losses caused by phishing webpages, which imitate the interface of real webpages and deceive the victims. To better identify and distinguish phishing webpages, a visual feature extraction method and a visual similarity algorithm are proposed. First, the visual feature extraction method improves the Vision-based Page Segmentation (VIPS) algorithm to extract the visual block and calculate its signature by perceptual hash technology. Second, the visual similarity algorithm presents a one-to-one correspondence based on the visual blocks’ coordinates and thresholds. Then the weights are assigned according to the tree structure, and the similarity of the visual blocks is calculated on the basis of the measurement of the visual features’ Hamming distance. Further, the visual similarity of webpages is generated by integrating the similarity and weight of different visual blocks. Finally, multiple pairs of phishing webpages and legitimate webpages are evaluated to verify the feasibility of the algorithm. The experimental results achieve excellent performance and demonstrate that our method can achieve 94% accuracy.
Keywords: Web security; visual feature; perceptual hash; visual similarity
More people surf online due to the development of Internet technology which creates an increasingly insecure environment at the same time. According to the 44th Statistical Report on Internet Development in China [1], 44.4% of netizens have been threatened by network security, where phishing webpages [2] account for the most substantial proportion. The emergence of phishing webpages is to acquire user information by imitating the interface, so as to conduct illegal activities, such as fraud. Existing webpage recognition methods can identify simple phishing webpages. In practice, however, they may fail owing to the well-concealed phishing webpages that are difficult to recognize; for example, traditional Deep Packet Inspection (DPI) [3] has difficulty detecting encrypted phishing webpages. The most effective way to identify phishing webpages is to calculate their similarity [4], which can be measured from their features.
Besides, webpage feature extraction methods [5,6] can be mainly divided into three parts: webpage source-based extraction [7], DOM structure-based extraction [8], and visual feature-based extraction [9]. Webpage source extraction method is highly efficient but does not make full use of all related information. Meanwhile, DOM structure extraction technology fakes the phishing webpage as the real one for the sake of deceiving users by considering text density and the webpage’s DOM tree structure. However, neither of the above two methods involves webpages’ visual features.
Humans can quickly identify whether the webpages’ contents are similar by observing the corresponding titles, the navigation bars, and the advertising frames through their visual features. Therefore, the visual features of webpages can be used to measure the similarity of webpages to identify phishing webpages. In addition, this method can be extended to malware detection in network traffic [10,11] and encrypted traffic [12], such as the analysis of traffic in 5G networks [13].
In this paper, the improved VIPS algorithm [14] is applied to extract webpages’ visual block features [15], including pictures, font size, background color, and location information. Each visual block corresponds to a sub-picture on the webpage; thus, the visual blocks can measure the similarity of webpages. Suppose there is a webpage that has been changed slightly by an attacker, with little effect on the visual feature of the webpage. A perceptual hash [16,17] algorithm can be used to extract each visual block’s visual features to find small changes from the picture and generate a new signature. Then, the signature can be compared to that of another webpage to distinguish the differences.
To integrate the visual features of visual blocks, a tree structure is employed, where each tree node corresponds to a visual block. Subsequently, the weight of the visual block is related to its position in the tree the higher the position, the greater the weight. Hence, the visual similarity can be calculated according to the position information of the visual blocks, the picture signatures, and visual features.
The contribution of this paper are:
(1) We propose a webpage matching technology based on webpage blocks visual features.
(2) We propose a tree structure to organize different webpages visual blocks, and use Hamming distance to measure the similarity of the trees of different webpages visual blocks features.
(3) We evaluated the similarity of different webpages and proved its effectiveness in classifying webpages.
The remainder of this paper is organized as follows. Section 2 presents the related work. Section 3 proposes the similarity matching algorithm, and Section 4 introduces the evaluation results. Finally, Section 5 concludes our work.
Phishing detection methods consist of two main categories: URLs detection [18] and content identification [19]. The former distinguishes the phishing webpage by its URL through mathematical modeling, which is more suitable and works better based on large quantities of webpages. The latter is webpage similarity identification based on the webpage’s content. Webpage similarity can be divided into the following categories: studies on traditional text, structural, and visual similarity.
Research on similarity detection aims at solving problems in large file systems and has been expanded to search engine systems and digital library projects. Heintze [20] proposed the KOALA algorithm to identify the target document by matching the fingerprint set of each document. Hivakumar et al. [21] determined target documents by comparing signatures of segmented text. Other representative algorithms, including the YAP3 algorithm [22], only use the string comparison method without taking into account the webpage text content or the overall structure of ordinary documents. Shivakumar et al. [23] presented the SCAM methods that utilize word frequency statistics to check documents. Si et al. [24] described the Check method in 1997 and introduced the structural information of the document; that is, the document was organized into a document tree by the structure of chapters, sections, and paragraphs, and then a depth-first comparison of the document tree was provided to calculate the similarity.
Document Object Model (DOM) was used to express the internal structure of HTML files; thus, it contributes significantly to HTML parsing. Wagner et al. [25] proposed the similarity of strings based on the edit distance, which considers three ways to edit a string: converting a character into another character, deleting a character in a string, and inserting a character into a string. Meanwhile, the minimum edit number is a standard to measure the similarity between two strings—a small edit distance implies great similarity. Hence, Tai [26] presented an edit distance-based tree similarity measuring method to turn a tree into another tree by applying the three aforementioned editing ways—replacing a node in the tree with another node, inserting a node into the tree, and deleting a node in the tree. Therefore, it is possible to calculate the similarity of a webpage by determining the edit distance of the DOM tree.
Besides, Liu et al. [27] introduced a webpage visual similarity calculation method based on the DOM tree, which is divided into visual blocks, and then further compared the similarity between blocks, webpage’s layout similarity, and the webpage’s overall style similarity. The three similarities were finally weighted and combined as the final webpage similarity. Additionally, Fu et al. [28] described an approach for phishing webpage detection by calculating webpage similarity based on Empirical Mode Decomposition (EMD), where they converted the webpage to a compressed image, generated a signature according to the image, and calculated the distance between the webpage image signatures.
This section introduces the webpage’s similarity calculation method based on visual features, consisting of three steps: visual block extraction, visual feature extraction and visual similarity calculation. Firstly, an improved VIPS algorithm is used to extract visual blocks. Secondly, a modified perceptual hash algorithm is employed to extract visual features of webpages. Thirdly, the reconstructed visual tree based on the visual block is checked to meet the visual similarity comparison needs. Finally, the coordinates, length, width, visual features, and weights of visual blocks are employed to calculate webpage similarity. When the visual similarity of two webpages is greater than a certain threshold, the two webpages are considered similar.
Each webpage structure can be represented by a triple
Before running the algorithm, a Permitted Degree of Coherence (PDoC) value is calculated to define the roughness of the segmented visual block. The smaller the PDoC, the rougher the segmented visual block. On the contrary, the greater the PDoC, the smoother the segmented visual block. Furthermore, each node in the DOM tree represents a visual block normally; however, some special nodes, such as <Table> and <P> tags, are only constructed to organize text and not suitable for use as a single visual block. Under this situation, these nodes should be divided and replaced by the child nodes considering as visual blocks instead. It should be mentioned that those nodes do not be extract because they are too large in the DOM tree.
At the end of this step, each visual block’s DOC value is set according to its visual difference. This process repeats until all reasonable visual blocks of the entire webpage are extracted. After that, visual blocks are fed into the pool for separator detection, where the separator is a horizontal or vertical line on the webpage and does not cross any block in the collection. From the visual point of view, the separator is an essential indicator for distinguishing different visual content on the webpage. A visual separator can be represented by a two-tuple
(1) Initialize the separator list with only one separator, whose initial and end pixels represent all blocks’ boundaries in the pool.
(2) For each block in the pool, its relationship with each separator follows:
(a) if the separator contains a block, then separate the separator;
(b) if the block covers the separator, then delete the separator;
(c) if the block and the separator cross (i.e., contains each other), then update the separator parameter.
(3) Delete the boundary separator in the pool.
Subsequently, the weight of the separator is set by the information difference in the surrounding blocks because the separator is used to distinguish different visual blocks on the webpage. Next, the reconstruction of the visual block starts with the separator with the smallest weight, and the visual blocks on both sides of these separators will form a new visual block. This process repeats until the separator with the highest weight is encountered. Then, the DOC value of the new visual block is reset by the separator detection algorithm. After this, each visual block is checked whether it satisfies DOC >= PDoC. For those unsatisfied ones, the visual block extraction step is performed; otherwise, the process terminates.
Through this process, a bridge between the DOM tree and the visual structure of the webpage is established. Simply put, the webpage is separated by visual separators and reconstructed into a hierarchical structure with content-related parts grouping together even if they exist in different DOM tree nodes.
For a given webpage, the visual blocks’ position and content may have subtle changes. A typical example of this is the news webpages, within which the length, quantity, area, and position of the visual block are often different. Thanks to human vision, we can recognize similar webpages on different dates by some iconic features, such as trademarks, branding, and fixed signs, and we can also tolerate some subtle changes like changed length in visual blocks. Thus, we need to find a way to imitate our human perception of webpages, and the perceptual hash plays a vital role because it can generate visual block’s signature and the degree of similarity by ignoring the details. Pictures with high similarity have similar signatures generated by perceptual hashing.
In this section, the image perception hash function is applied to calculate the visual block signature based on discrete cosine transform feature points. Thus, the visual feature extraction of the visual block is realized, and the quick comparison of visual blocks is facilitated later on. The perceptual hash algorithm used in this section depends on the DCT transformation. After performing DCT transformation on the visual block, it is clear after the picture is compressed into a JPEG, and the relationship between DCT coefficients at the same position in different blocks does not change.
The DCT transformation converts a picture from the color domain to the frequency domain and brings two advantages. First, the signal concentrates most of its energy in a small range in the frequency domain. Second, the frequency domain decomposition matches the processing of the human visual system and allows the subsequent quantization to meet sensitivity requirements. Besides, DCT has a corresponding inverse transformation process, which means that the data before and after the DCT transformation are equivalent. Also, most of the energy is accumulated in the upper-left corner of the matrix after the change. Thus, the upper-left corner of the matrix after the DCT transformation can be on behalf of the entire picture, as well as the DCT transform can describe image features.
For two webpages, the problem of how to find their corresponding visual block sets needs to be solved. Comparing the visual block sets one by one can calculate the similarity between them. Then, the edit distance calculation between trees is utilized to observe the relationship between the visual blocks of the two webpages. The reconstruction of the visual tree is based on the parent-child relationship. When extracting the visual block, an XML file describing the visual block is generated.
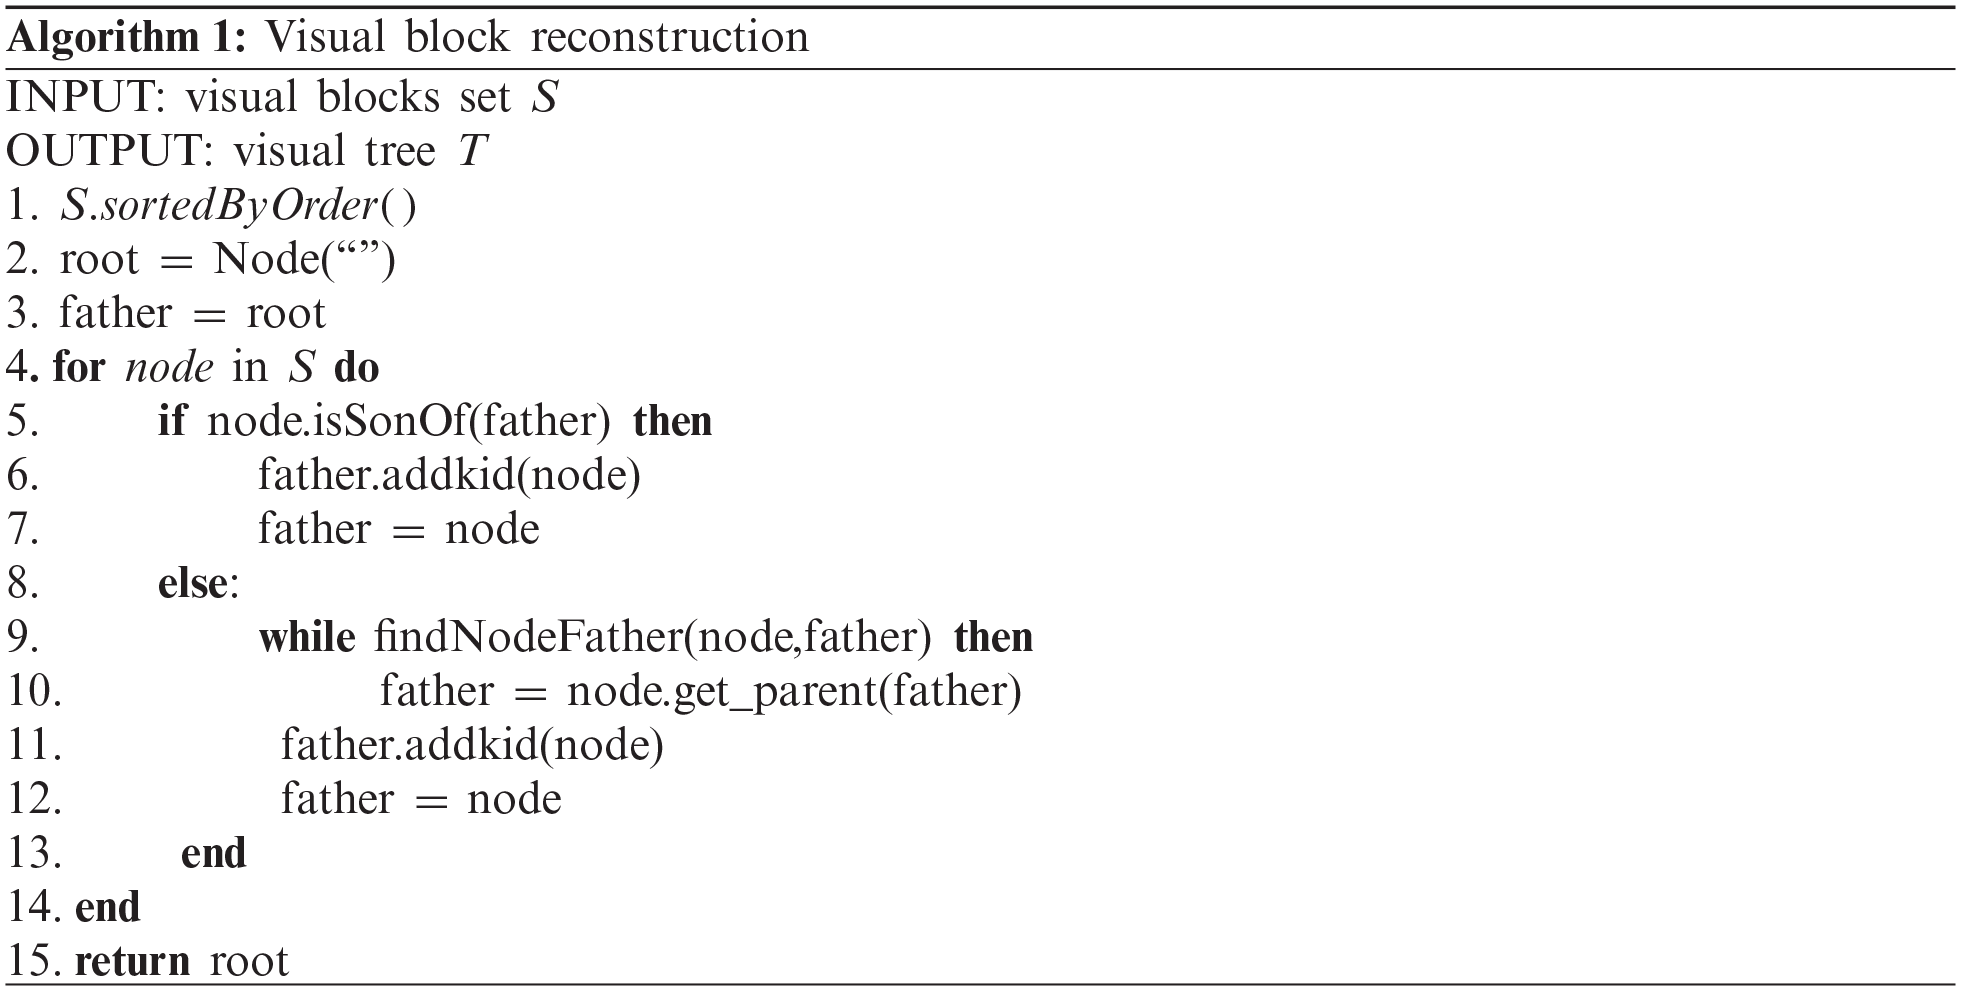
According to the reconstruction algorithm, a webpage can be transformed into a visual tree, where each node represents a visual block’s visual feature. The similarity comparison of trees involves two aspects: connecting the child nodes of the two trees, i.e., mapping, and comparing the similarity of the two visual blocks. The problem of mapping the visual block relationship can be transformed into the tree edit distance problem, that is, the cost of converting tree A into tree B by adding a node, deleting a node, and changing a node. The lower the cost, the greater the similarity.
3.3 Visual Similarity Calculation
Assuming that a webpage is subjected to visual block extraction, visual feature extraction, visual tree reconstruction, and other operations, then the generated visual tree is defined as
When converting
(1) One-to-one rule:
(2) Horizontal relationship maintenance rule:
(3) Vertical relationship maintenance rule:
Subsequently, the Hamming distance is used to measure the similarity between tree nodes since they are all perceptually hash coded. In two signatures, the Hamming distance represents the number of bits whose positions are the same but with different values. If this number is less than the threshold
Here,
where
In summary, the structural similarity is calculated between webpages by adding and deleting the nodes of the trees, and then the visual similarity is compared between webpages by updating the tree nodes. Finally, the two kind similarities, i.e., structural similarity and visual similarity, are obtained.
Phishing webpages have relatively high similarities with real target webpages. Therefore, in this section, the experiment evaluates the effectiveness of the proposed similarity detection method and discusses the webpages’ similarities.
In the experiment, nine legitimate webpages and 12 phishing webpages were selected, where the phishing webpages are the latest phishing webpages obtained from the PhishTank website. Then, these sites were used to verify whether the similarity measurement method was related to language or region.
(1) Data preprocessing
A webpage’s HTML source code always contains a large quantity of data irrelevant to this task, such as comments left by developers. Besides, many HTML webpages are incomplete, where some elements are missing, such as </div> and </p>. The browser can accept such errors. However, these errors may influence our work, and thus we need to eliminate them.
(2) Visual tree generation
After data preprocessing, the DOM tree of a webpage was obtained. Firstly, to generate the visual tree, visual blocks from the DOM tree were extracted by removing some invisible content in the webpage and performing a preliminary analysis of the DOM tree nodes. Next, the visual block was reconstructed based on the weight information of the separator. Further, we extracted the features of the visual blocks, generated the image representations of each visual block according to their coordinate data, and then extracted the visual features by perceptual hash according to these image representations. Finally, the visual tree was constructed based on visual blocks’ hierarchical information.
(3) Similarity calculation
After obtaining the webpage’s visual tree representation, the visual similarity was calculated between the webpages based on the tree’s edit distance and tree nodes’ Hamming distance. Therefore, the similarity score for each webpage was generated, and a similarity matrix was also constructed.
As shown in Fig. 1, the similarity between different webpages is calculated. Green balls indicate matching webpages, while red balls mean unmatched webpages. We found that a) the average similarity value 0.89 between matched webpages is higher than the average similarity value 0.31 between unmatched webpages; and b) the threshold for judging whether webpages are similar does not exist. For example, for Google webpage, when the threshold is greater than 0.6, a similar webpage can be found; but for Whatsapp webpage, the threshold may be 0.9 or higher. Therefore, this threshold may be found on a single webpage, but it does not exist in a general sense.
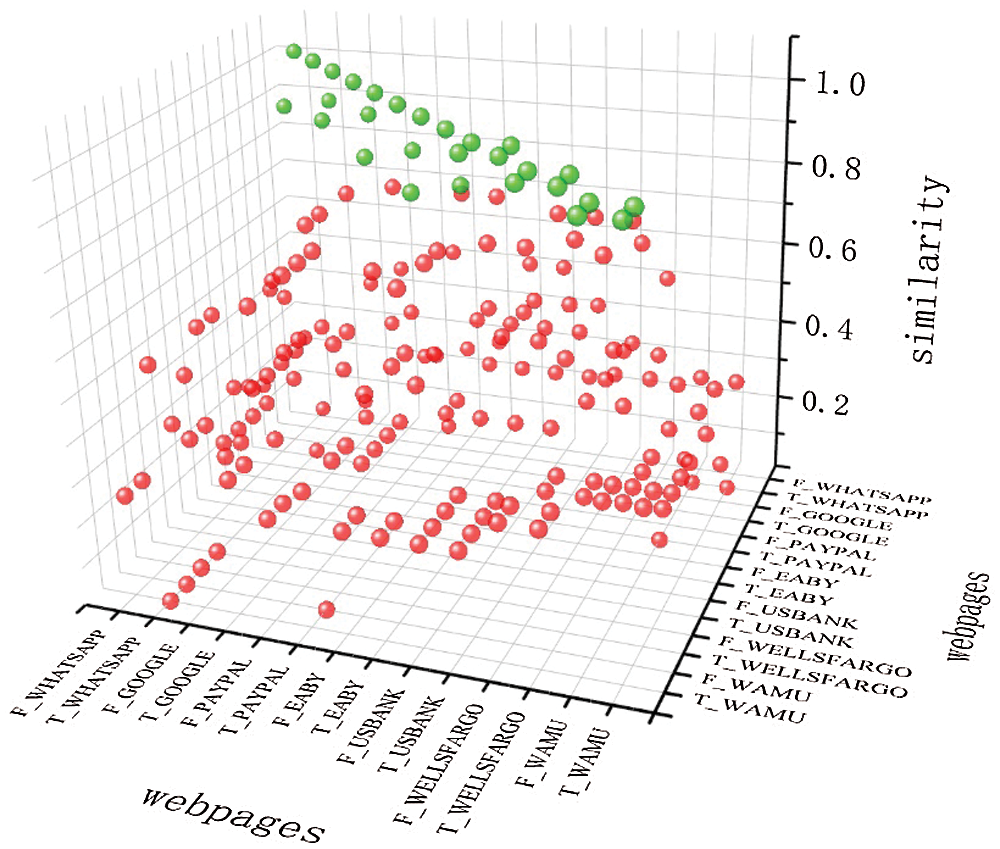
Figure 1: Similarity of different webpages. Reb colors represent the similarity of real webpages and not pishing webpages, and green colors represent the similarity of real webpages and pishing webpages
4.2 Webpage Classification Evaluation
Webpage clusters have a high visual similarity degree. The experiments were conducted to evaluate whether this method can classify different webpage clusters and the webpage classification performance. In our evaluation, a total of 1,200 pages were yielded as experimental data from the top 100 webpages on Alexa China, where their homepage from 2017 to 2019 and the corresponding source codes from March, June, September, and December of each year were collected. Meanwhile, visual block extraction and visual feature extraction were performed, and a visual feature tree was obtained subsequently. Then, the similarity between each webpage was calculated, and a symmetric similarity matrix is generated.
The webpage features were represented by trees rather than vectors, and nodes were related by similarity values instead of distance metrics. These characteristics determined that traditional clustering methods based on vector space representation could not be used, such as K-means clustering. On the contrary, spectral clustering can take full advantage of the similarity matrix because its main idea is to treat all data as points in space and connects them by edges. The farther the two points, the lower the edge weight value; the closer the two points, the higher the edge weight value.
In this experiment, the nodes in the spectral clustering space corresponded to the visual feature tree, and the weights of the nodes represented the similarity between the trees. The purity [29] index of the clustering results and the Calinski–Harabasz [30] indicator were utilized for analysis. The definition of purity is:
Here,
Meanwhile, the Calinski–Harabasz indicator
where
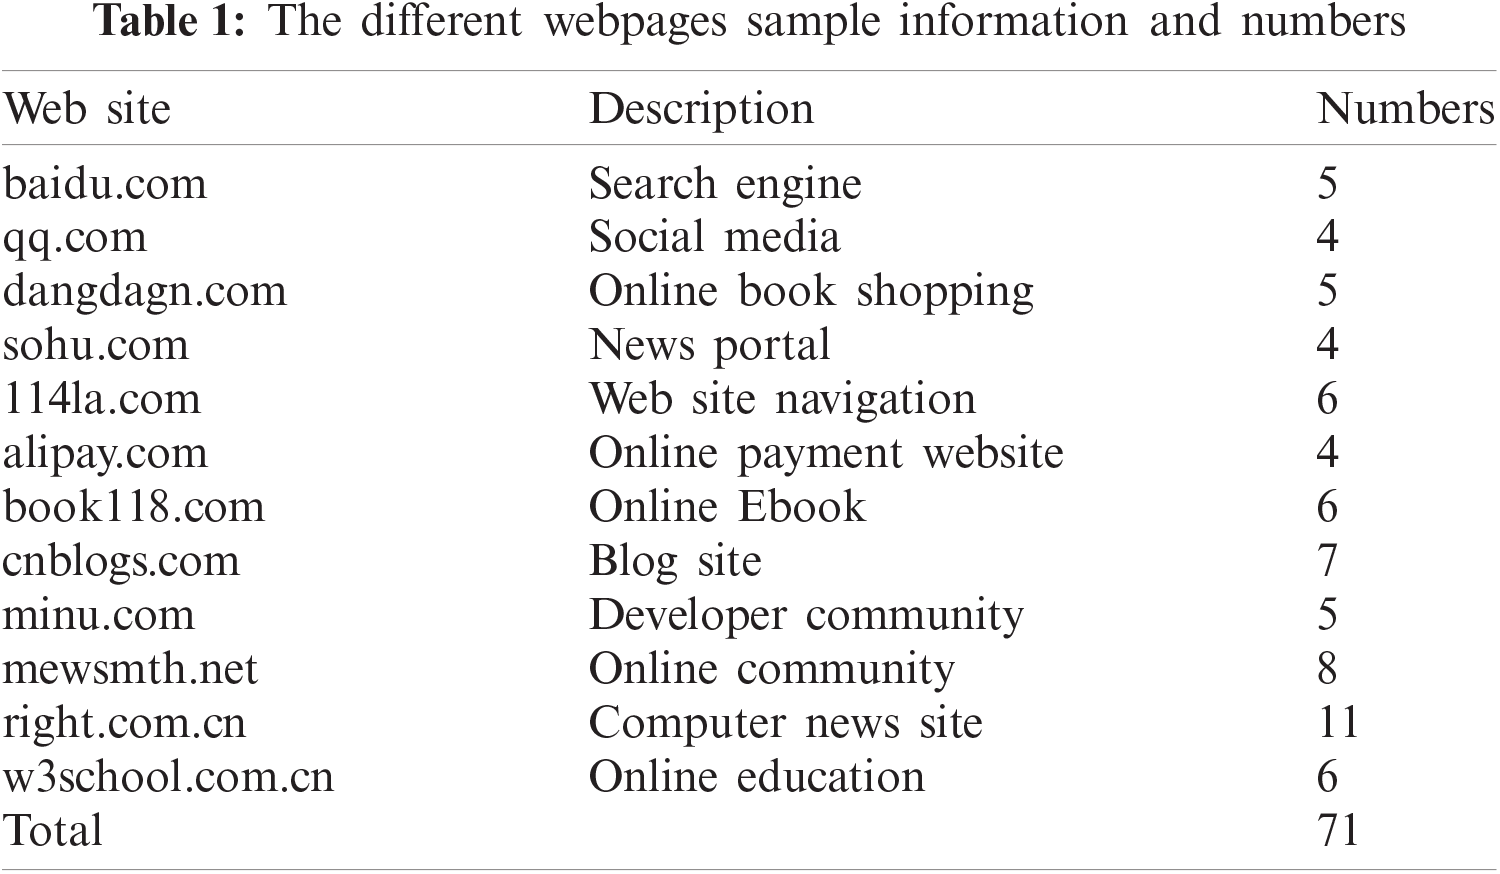
As shown in Tab. 1, we have selected 12 different typical web pages from the top 100 groups of web pages of different period. These webpages are marked from 1 to 71. They include search engines, social media, news portals, technology websites, etc. We first extract the visual block features of webpages, and measure the similarity of these 71 webpages by calculating the Hamming distance of different webpage visual feature trees.
Take “right.com.cn” in the year of 2019 as an example, as shown in Fig. 2, the webpages 51 to 61 webpages were randomly collected from 2017 to 2019. It can be seen that their similarities are extremely high due to the same kind of webpage. We can see that the similarity of webpage 61 to the sample is 1.0 because webpage 61 and the sample webpage is the same one. The similarity to the webpage 51 and 52 is not high, reaching only about 0.7. This is because these two webpages represent different webpage versions with some visual changes in their appearances. However, the visual similarity value in the same class is still greater than the similarity with other class webpages.
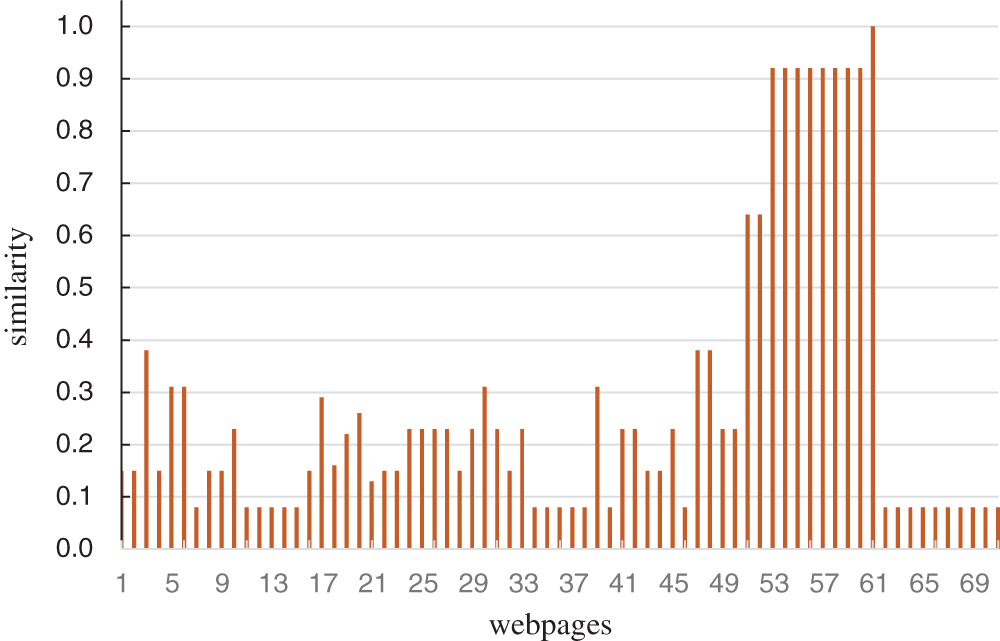
Figure 2: The similarity of “right.com.cn” with other webpages
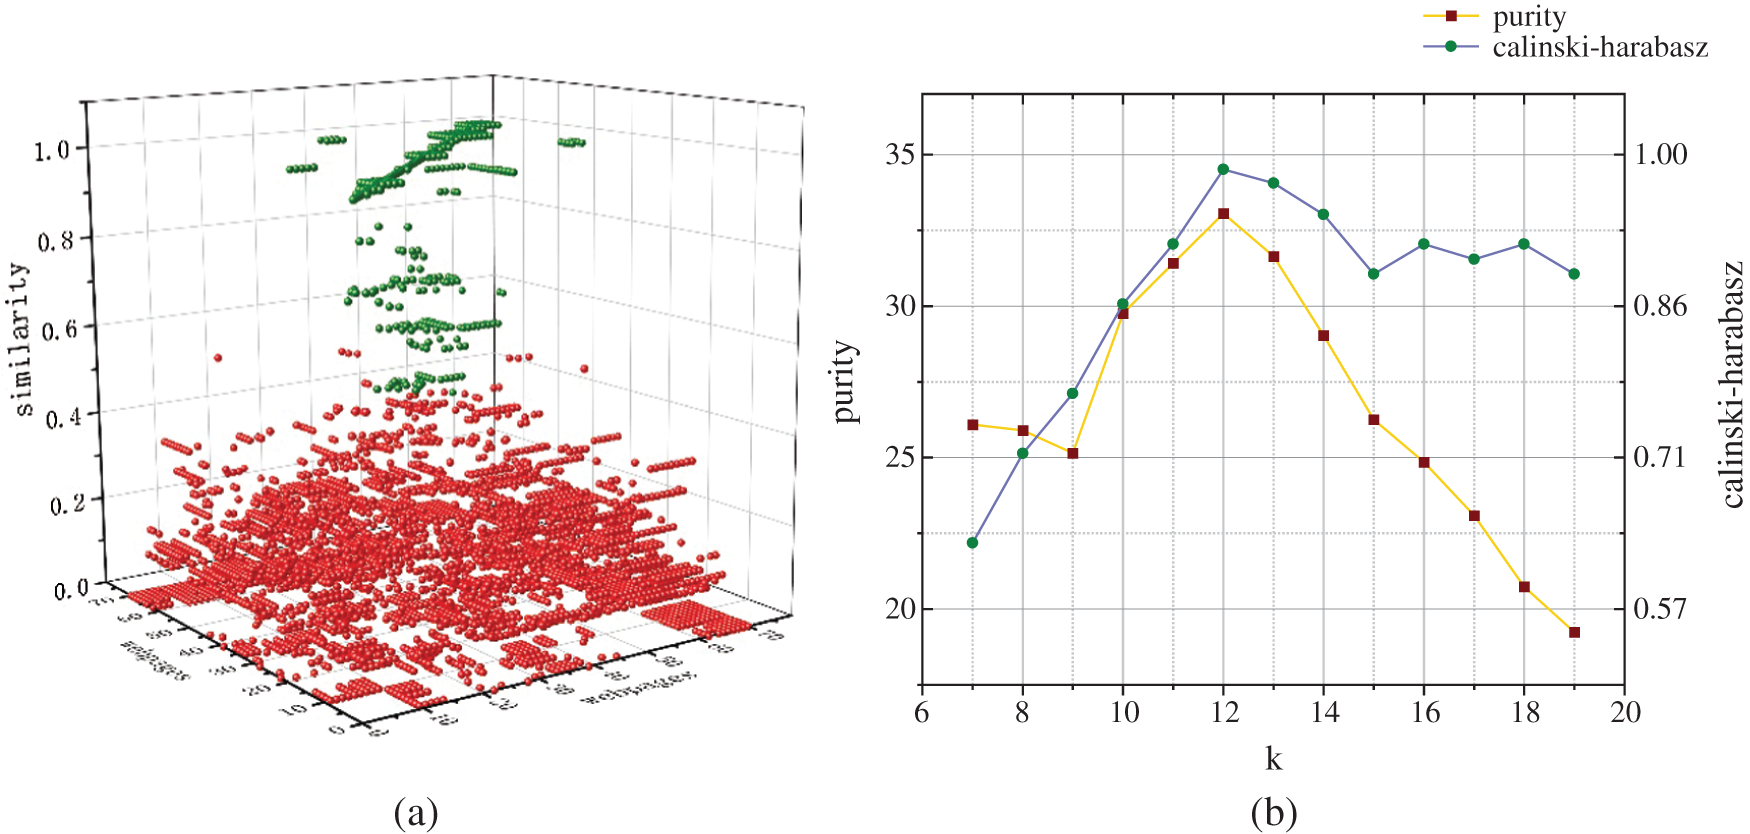
Figure 3: (a) The similarity evaluation between multiple webpages, reb colors represent the similarity of different classes webpage and green colors represent the similarity of the same class webpages; (b) The purity and Calinski–Harabasz indicator effect of the k clusters
In Fig. 3a, the red balls represent the similarity between classes, and the green balls represent the similarity within the class. In general, it is clear that the green balls are above the red balls, i.e., the intra-class similarity is generally greater than the inter-class similarity. In the meanwhile, if we look carefully, there are individual green balls below the red balls, The reason for this observation is that our graph displays an overall similarity. For example, the similarity value of webpage 1 and all webpages is incredibly low (the maximum value is 0.3), but that of webpage 2 and all webpages is very high (the minimum value is 0.8). Interestingly, their intra-class similarity is greater than the inter-class similarity.
To observe the influence in the purity value and Calinski–Harabasz indicator, the number of clusters
We selected eight types of test webpages (as shown in Tab. 2), total of 51 webpage samples. We also collected 1101 other webpage samples. For test webpage, the training set contains similar webpages to the test webpage and irrelevant webpages. Similarity threshold value S (as shown in the Tab. 2), for the webpage to be classified, if the similarity with test webpage is higher than value S, it is classified as a similar webpage. If the similarity is lower than value S, it is regarded as an irrelevant webpage. The test results are shown in Tab. 2.
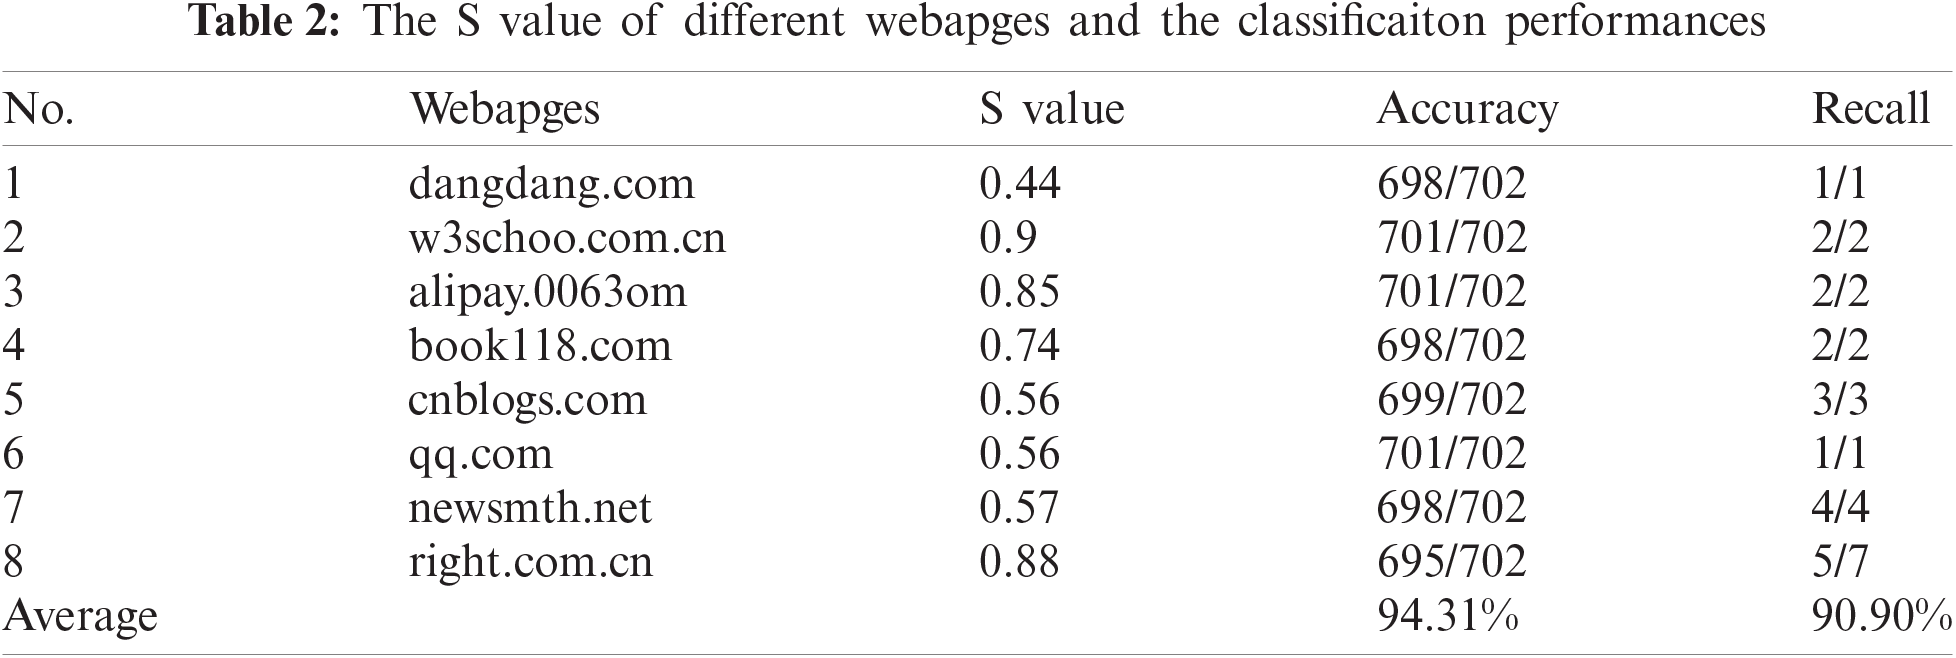
From Tab. 2, we can see that for each test webpage, the values S is different. At the same time, the average accuracy is up to 94%, and the average recall rate is up to 90%. It proves the effectiveness of webpage classification based on visual features.
With the rapid development of Internet technology, the task of webpage recognition has become more and more important. A method was proposed to imitate the way humans understand webpages and identify phishing webpages. The perceptual hashing technology was applied to the extraction of visual block features in webpages, which is extremely robust and conforms to human cognition because the perceptual hashing can tolerate a certain degree of detail changes in pictures. Then, a method for calculating visual similarity was presented as both robust and highly accurate. The minimum edit distance of the tree was utilized to find the best mapping relationship between two visual block sets, and the similarity between visual blocks through the Hamming distance was also calculated. Furthermore, the calculation granularity according to the Hamming distance threshold was controlled. Finally, the experiment results demonstrated that webpage classification based on visual features has excellent performance, with an accuracy rate of 94%.
Acknowledgement: This work is supported by the National Key R&D Program of China (2016QY05X1000) and the National Natural Science Foundation of China (201561402137).
Funding Statement: The authors received no specific funding for this study.
Conflicts of Interest: The authors declare that they have no conflicts of interest to report regarding the present study.
1. China Internet Network Information Center, “The 44th china statistical report on internet development. China, 2019,” 2019. [Online]. Available: https://www.techscience.com/books/mlpg_atluri.html. [Google Scholar]
2. A. K. Jain and B. B. Gupta, “A machine learning-based approach for phishing detection using hyperlinks information,” Journal of Ambient Intelligence and Humanized Computing, vol. 10, no. 5, pp. 2015–2028, 2019. [Google Scholar]
3. C. Yu, J. Lan, J. Xie and Y. Hu, “QoS-aware traffic classification architecture using machine learning and deep packet inspection in SDNs,” Procedia Computer Science, vol. 131, no. 1, pp. 1209–1216, 2018. [Google Scholar]
4. Z. Xu and J. Miller, “Cross-browser differences detection based on an empirical metric for web page visual similarity,” ACM Transactions on Internet Technology, vol. 18, no. 3, pp. 1–23, 2018. [Google Scholar]
5. K. B. Prakash, M. D. Rangaswamy and T. V. Ananthan, “Feature extraction studies in a heterogeneous web world,” International Journal of Applied Engineering Research, vol. 9, no. 22, pp. 16571–16579, 2014. [Google Scholar]
6. A. Onan, “Classifier and feature set ensembles for web page classification,” Journal of Information Science, vol. 42, no. 2, pp. 150–165, 2016. [Google Scholar]
7. H. Zuhair, A. Selamat and M. Salleh, “Selection of robust feature subsets for phish webpage prediction using maximum relevance and minimum redundancy criterion,” Journal of Theoretical and Applied Information Technology, vol. 81, no. 2, pp. 188–201, 2015. [Google Scholar]
8. J. Zhang, X. Cai, L. Qi, C. Shao, Y. Lin et al., “Effects of aeration strategy on the evolution of dissolved organic matter (DOM) and microbial community structure during sludge bio-drying,” Applied Microbiology and Biotechnology, vol. 99, no. 17, pp. 7321–7331, 2015. [Google Scholar]
9. L. C. Chiu, T. S. Chang, J. Y. Chen and N. Y. C. Chang, “Fast SIFT design for real-time visual feature extraction,” IEEE Transactions on Image Processing, vol. 22, no. 8, pp. 3158–3167, 2013. [Google Scholar]
10. Z. Tian, X. Gao, S. Su and J. Qiu, “Vcash: A novel reputation framework for identifying denial of traffic service in Internet of connected vehicles,” IEEE Internet of Things Journal, vol. 7, no. 5, pp. 3901–3909, 2019. [Google Scholar]
11. C. Du, S. Liu, L. Si, Y. Guo and T. Jin, “Using object detection network for malware detection and identification in network traffic packets,” Computers, Materials & Continua, vol. 64, no. 3, pp. 1785–1796, 2020. [Google Scholar]
12. J. Liu, Y. Zeng, J. Shi, Y. Yang, R. Wang et al., “Maldetect: A structure of encrypted malware traffic detection,” Computers, Materials & Continua, vol. 60, no. 2, pp. 721–739, 2019. [Google Scholar]
13. S. Su, Z. Tian, S. Liang, S. Li, S. Du et al., “A reputation management scheme for efficient malicious vehicle identification over 5G networks,” IEEE Wireless Communications, vol. 27, no. 3, pp. 46–52, 2020. [Google Scholar]
14. J. Florin, A. Ehrenberg, M. Ehnfors and C. Björvell, “A comparison between the VIPS model and the ICF for expressing nursing content in the health care record,” International Journal of Medical Informatics, vol. 82, no. 2, pp. 108–117, 2013. [Google Scholar]
15. M. A. Peters, B. Thompson, L. B. Merabet, A. D. Wuand and L. Shams, “Anodal tDCS to V1 blocks visual perceptual learning consolidation,” Neuropsychologia, vol. 51, no. 7, pp. 1234–1239, 2013. [Google Scholar]
16. K. Ding, Z. Yang, Y. Wang and Y. Liu, “An improved perceptual hash algorithm based on u-net for the authentication of high-resolution remote sensing image,” Applied Sciences, vol. 9, no. 15, pp. 2972, 2019. [Google Scholar]
17. F. Özyurt, T. Tuncer, E. Avci, M. Koc and İ. Serhatlioğlu, “A novel liver image classification method using perceptual hash-based convolutional neural network,” Arabian Journal for Science and Engineering, vol. 44, no. 4, pp. 3173–3182, 2019. [Google Scholar]
18. N. Abdelhamid, A. Ayesh and F. Thabtah, “Phishing detection based associative classification data mining,” Expert Systems with Applications, vol. 41, no. 13, pp. 5948–5959, 2014. [Google Scholar]
19. P. A. Barraclough, M. A. Hossain, M. A. Tahir, G. Sexton and N. Aslam, “Intelligent phishing detection and protection scheme for online transactions,” Expert Systems with Applications, vol. 40, no. 11, pp. 4697–4706, 2013. [Google Scholar]
20. N. Heintze, “Scalable document fingerprinting,” USENIX Workshop on Electronic Commerce, vol. 3, no. 1, pp. 18–21, 1996. [Google Scholar]
21. N. Hivakumar and H. Garcia-Molina, “Finding near-replicas of documents on the web,” in Int. Workshop on the World Wide Web and Databases, Valencia, Spain, pp. 204–212, 1998. [Google Scholar]
22. M. J. Wise, “YAP3: Improved detection of similarities in computer program and other texts,” in Proc. of the Twenty-Seventh SIGCSE Technical Symp. on Computer Science Education, Pennsylvania, USA, pp. 130–134, 1996. [Google Scholar]
23. N. Shivakumar and H. Garcia-Molina, “Building a scalable and accurate copy detection mechanism,” in Proc. of the First ACM Int. Conf. on Digital Libraries, ACM, Bethesda Maryland, USA, pp. 160–168, 1996. [Google Scholar]
24. A. Si, H. V. Leong and R. W. H. Lau, “Check: A document plagiarism detection system,” SAC, vol. 97, pp. 70–77, 1997. [Google Scholar]
25. R. A. Wagner and J. F. Michael, “The string-to-string correction problem,” Journal of the ACM, vol. 21, no. 1, pp. 168–173, 1974. [Google Scholar]
26. K. C. Tai, “The tree-to-tree correction problem,” Journal of the ACM, vol. 26, no. 3, pp. 422–433, 1979. [Google Scholar]
27. W. Liu, X. Deng and G. Huan, “An anti-phishing strategy based on visual similarity assessment,” IEEE Internet Computing, vol. 10, no. 2, pp. 58–65, 2006. [Google Scholar]
28. A. Y. Fu, W. Y. Liu and X. Deng, “Detecting phishing web pages with visual similarity assessment based on earth mover’s distance (EMD),” Dependable and Secure Computing, vol. 3, no. 4, pp. 301–311, 2006. [Google Scholar]
29. S. C. Sripada and M. S. Rao, “Comparison of purity and entropy of k-means clustering and fuzzy c means clustering,” Indian Journal of Computer Science and Engineering, vol. 2, no. 3, pp. 343–346, 2011. [Google Scholar]
30. U. Maulik and S. Bandyopadhyay, “Performance evaluation of some clustering algorithms and validity indices,” IEEE Transactions on Pattern Analysis and Machine Intelligence, vol. 24, no. 12, pp. 1650–1654, 2002. [Google Scholar]
 | This work is licensed under a Creative Commons Attribution 4.0 International License, which permits unrestricted use, distribution, and reproduction in any medium, provided the original work is properly cited. |