DOI:10.32604/cmc.2022.022123
| Computers, Materials & Continua DOI:10.32604/cmc.2022.022123 | |
| Article |
Cardiovascular Disease Prediction Among the Malaysian Cohort Participants Using Electrocardiogram
1Faculty of Engineering and Built Environment, Universiti Kebangsaan Malaysia, Bangi, 43600, Malaysia
2Medical Engineering Technology Section, Universiti Kuala Lumpur British Malaysian Institute, Gombak, 53100, Malaysia
3Institut Islam Hadhari, Universiti Kebangsaan Malaysia, Bangi, 43600, Malaysia
4UKM Medical Molecular Biology Institute (UMBI), Kuala Lumpur, 56000, Malaysia
5Faculty of Health Sciences, Universiti Kebangsaan Malaysia, Bangi, 43600, Malaysia
*Corresponding Author: Nazrul Anuar Nayan. Email: nazrul@ukm.edu.my
Received: 28 July 2021; Accepted: 06 September 2021
Abstract: A comprehensive study was conducted to differentiate cardiovascular disease (CVD) subjects from non-CVD subjects using short recording electrocardiogram (ECG) of 244 Malaysian adults in The Malaysian Cohort project. An automated peak detection algorithm to detect nine fiducial points of electrocardiogram (ECG) was developed. Forty-eight features were extracted in both time and frequency domains, including statistical features obtained from heart rate variability and Poincare plot analysis. These include five new features derived from spectrum counts of five different frequency ranges. Feature selection was then made based on p-value and correlation matrix. Selected features were used as input for five classifiers of artificial neural network (ANN), k-nearest neighbors (kNN), support vector machine (SVM), discriminant analysis (DA), and decision tree (DT). Results showed that six features related to T wave were statistically significant in distinguishing CVD and non-CVD groups. ANN had performed the best with 94.44% specificity and 86.3% accuracy, followed by kNN with 80.56% specificity, 86.49% sensitivity and 83.56% accuracy. The novelties of this study were in providing alternative solutions to detect P-onset, P-offset, T-offset as well as QRS-onset points using discrete wavelet transform method. Additionally, two out of the five newly proposed spectral features were significant in differentiating both groups, at frequency ranges of 1–10 Hz and 5–10 Hz. The prediction outcomes were also comparable to previous related studies and significantly important in using ECG to predict cardiac-related events among CVD and non-CVD subjects in the Malaysian population.
Keywords: Cardiovascular disease; ECG fiducial point detection; electrocardiogram; feature extraction; machine learning
Cardiovascular diseases (CVDs) are the main cause of death, taking an estimated 17.9 million lives globally each year, and one third of these deaths occur prematurely in people under 70 years of age [1]. In Malaysia alone, CVDs still remain as the principal cause of death, where 16,374 medical certified deaths were recorded in 2019 due to ischemic heart disease (IHD) [2]. IHD is also reported to be the number one killer for people aged 41 years and above (17%).
According to the National Cardiovascular Disease–Acute Coronary Syndrome Registry, Malaysians are developing heart disease at younger age compared with neighboring countries [3]. About 43.2% of Malaysian adults (≥18 years) have at least two CVD risk factors (obesity, smoking, hypercholesterolemia, hypertension, and diabetes mellitus). On the basis of the Framingham Risk Score (applicable for the Malaysian population [4]), 47% of Malaysian adults (≥30 years) have either intermediate (26.7%) or high risk (20.3%) of having CVDs.
The Ministry of Health of Malaysia and the World Health Organization revealed that non-communicable diseases such as CVDs, diabetes, and cancer cost the economy upwards of USD2.15 billion due to workplace nonattendance and early death among the Malaysian working population [5]. The productivity losses are equivalent to 0.65% of the Malaysian gross domestic product (GDP). This has caused serious health burden with estimated cost to be around USD24.33 billion (7.35% of the GDP).
Early detection and continuous monitoring of CVD could prevent or delay it from exacerbating to improve a person's productivity and quality of life, and consequently reduce the country's burden of disease cost. Researchers are actively developing cost-effective diagnosis methods, including point-of-care testing, for various types of CVDs such as coronary artery disease (CAD) [6,7], arrhythmia [8–14], myocardial ischemia (MI) [15–19], and sudden cardiac death (SCD) [20,21], which mostly utilize noninvasive methods of ECG.
Acknowledging the significance of non-invasive ECG analysis in CVD prediction, ECG data were collected at baseline from 122 subjects with CVD mortality and 122 subjects with non-CVD-related mortality. The aim was to differentiate the ECG morphology at baseline from each group using lead II ECG waveform as an early CVD prediction tool for the Malaysian population. To the best of our knowledge, this is the largest digitally recorded ECG dataset available in the country to be analyzed and reported.
The main contributions of this study were in developing the automatic ECG fiducial points detection model and proposing additional ECG features to be utilized in time and frequency domains. A total of 48 ECG features were extracted and a few mostly significant features were selected to be used as input of the CVD prediction models using five machine learning techniques.
Initial diagnosis of CVD is complex and often involves combined assessments of symptoms, risk factors, laboratory test using multiple biomarkers [22], electrocardiogram (ECG) and echocardiogram. An ECG test is an essential method to diagnose CVD after the emergence of symptoms since it is non-invasive, where electrodes are used to capture and amplify the tiny electrical activities detected on the skin [23]. ECG metrics provide detailed information on heart rhythms and conduction patterns [24]. An ECG test is commonly performed to identify irregular heart rhythm; P-wave morphology including PR interval; wide or narrow QRS complex; changes in ST segment, QT interval, or corrected-QT (QTc) interval; and waveform changes either at baseline or compared with previous recording [25].
Analysis on the 12-lead ECG has been successfully explored [26] in detecting myocardial ischemia and distinguishing the affected region of myocardial damage using kNN classifier [27]. Deng et al. also used 12-lead ECG to create three-dimension pattern of cardiac dynamics and had achieved 92.5% accuracy in differentiating CVD and Normal subjects using artificial neural network (ANN), utilizing Physikalisch-Technische Bundesanstalt (PTB) and Fuwai datasets [28].
Single lead ECG analysis is also common in CVD prediction due to its simpler electrode's configuration. Lead II is frequently chosen to assess heart rhythm correctly and it also gives higher QRS complex amplitude compared with lead III [24]. Statistical, morphological, wavelet, and other ECG features have been used to classify various types of heart problems [29]. For example, Ghodake et al. had used ECG to extract Normalized Higher Order Statistics (NHOS) features from wavelet coefficient obtained in QRS complex and ST segment. They obtained 94.47% accuracy in differentiating CVD and Normal ECG using ANN on PTB database [30].
There were also studies that were conducted by combining ECG features to CVD risk factors to predict CVD. Mohan et al. [31] and Ahmad et al. [32] had merged patient demographic data (sex and age), physio-clinical data (type of chest pain, blood pressure, cholesterol level, fasting blood sugar) and ECG properties (heart rate, ST-segment parameters) from public datasets (Cleveland, Statlog and Hungary) to classify patients with and without heart diseases. Both studies demonstrated good prediction accuracy up to 91.30% using fuzzy-based machine learning. However, too many measurements were involved, including minimally invasive biomarker measurements.
ECG waveforms were firstly filtered to remove noise and motion artefacts. The quality of the waveforms was then examined using signal quality indexing (SQI) method. Afterward, nine ECG fiducial points and their isoelectric line were detected using previously employed algorithms with some modifications. Features were extracted by manipulating these points. All features were ranked on the basis of p-value score and correlation coefficient value. The top features were selected to be analyzed using five commonly used supervised machine learning (ML) techniques for heart disease classification [33,34]. They are artificial neural network (ANN), k-nearest neighbor (kNN), support vector machine (SVM), discriminant analysis (DA), and decision tree (DT) classifiers. The overall processes were explained in five main parts, as shown in Fig. 1.
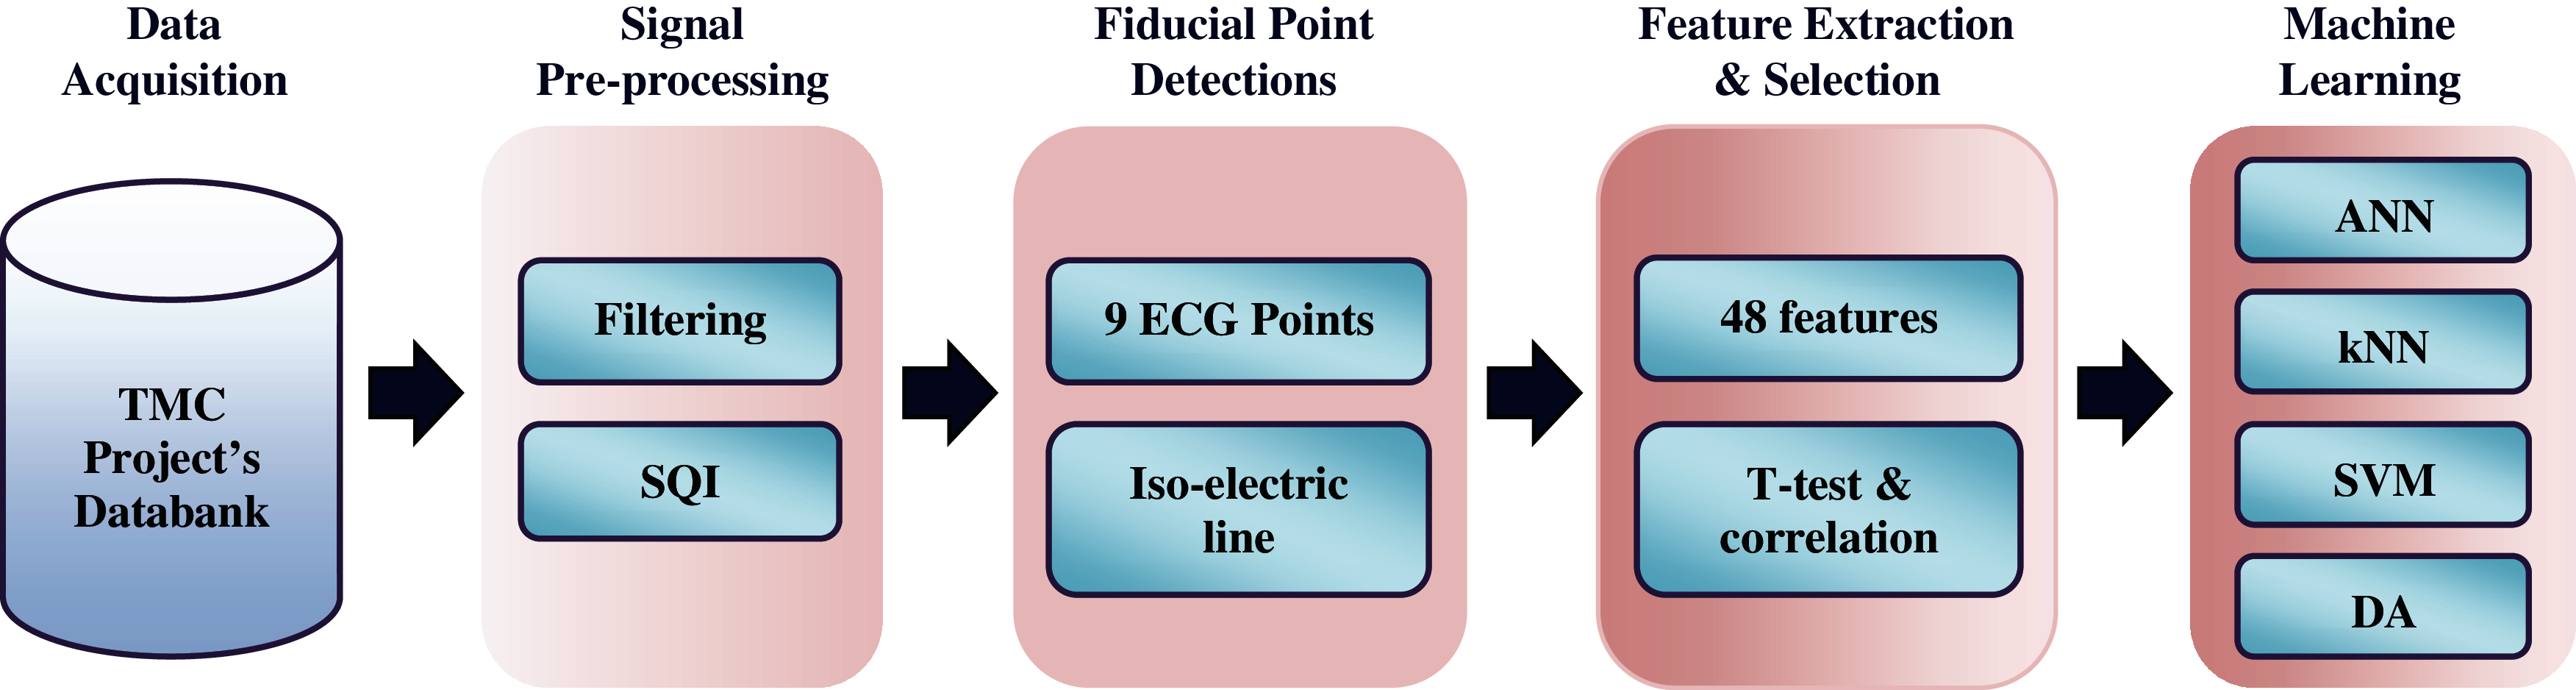
Figure 1: Methodology of the study
This is a nested case–control study that utilized the data from The Malaysian Cohort (TMC) project that was initiated in 2006 and recruited 106,527 multi-ethnic participants aged between 35 and 70 years old from all over Malaysia. The details of the research had been described in [35].
At the beginning, a total of 370 participants that were diagnosed with CVD and non-CVD-related disease had been identified. They were categorized into the case and control groups. Case subjects were defined as those who died due to cardiogenic shock, cardiac arrest, and heart failure, which were secondary to acute myocardial infarction (AMI) or acute coronary syndrome (ACS), after they had voluntarily joined the study. By contrast, control subjects were those who died due to other diseases that were not related to CVD, such as pneumonia or cancers. The mortality data was obtained from the National Registry of Malaysia.
Each subject had a 12-lead recorded ECG data at baseline recruitment. The ECGs were recorded using a Schiller Electrocardiograph machine with sampling frequency (fs) of 500 Hz. The duration for each recorded signal was between 10 s and 30 s. The quality of the ECG signals was examined. Only 244 subjects with good quality ECG were selected for the analysis.
The lead II ECG waveform from each subject was extracted from the 12-lead raw data files, which were available in .xml format. The signal was filtered using third-order Butterworth bandpass filter with cut-off frequencies of 1–45 Hz to remove high-frequency noise and power line frequency, as well as respiration and baseline wander noise at lower frequencies. Example of a pre-processed ECG (taken from one of the control subjects) is shown in Fig. 2.
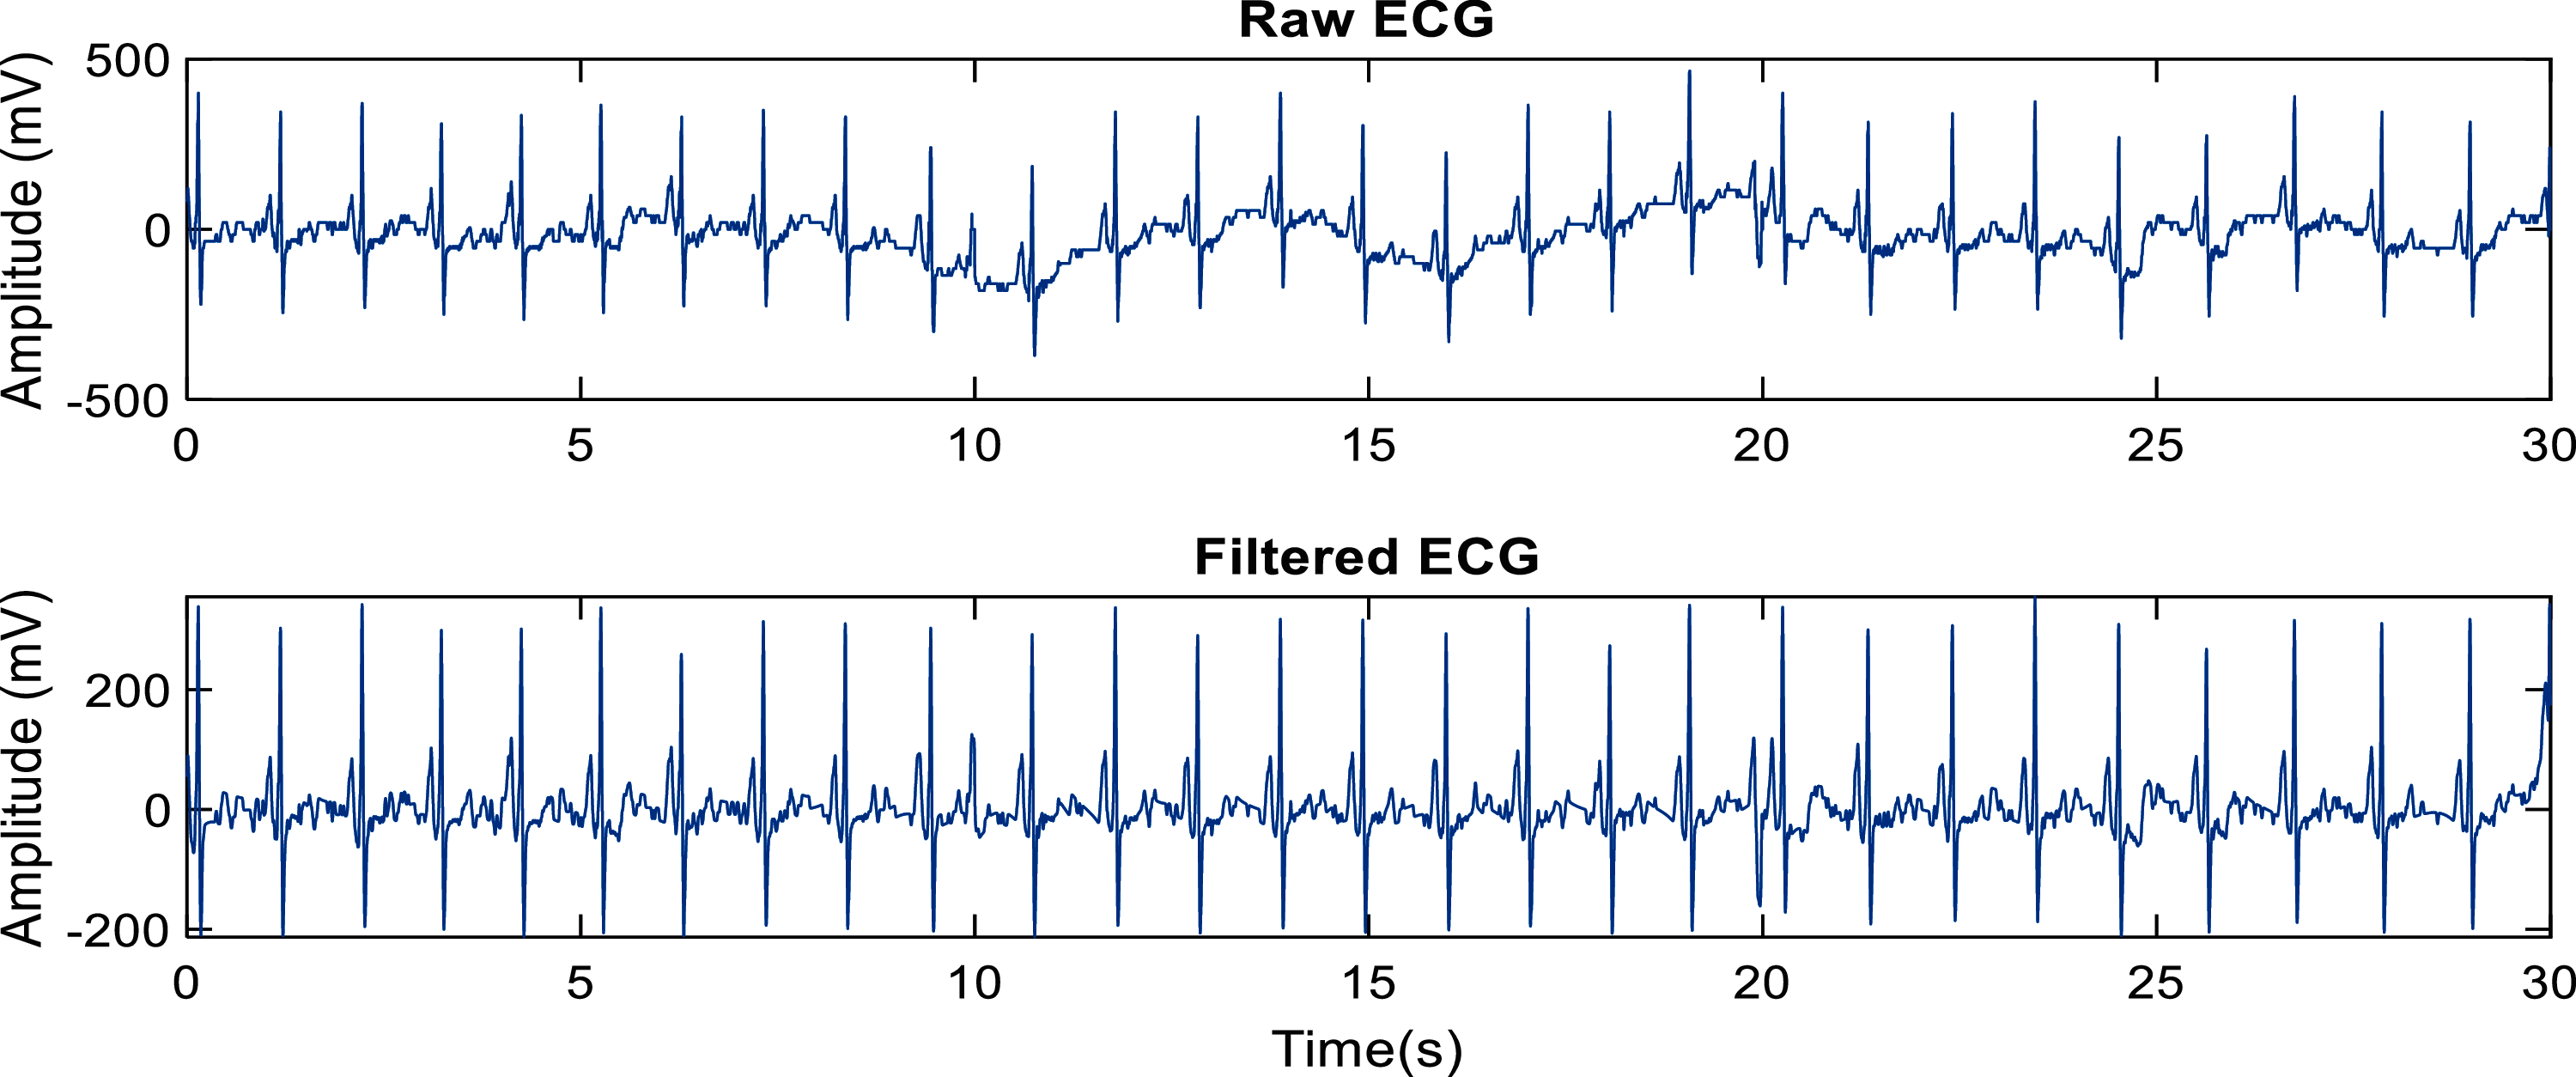
Figure 2: Example of a pre-processed signal
The filtered signal was evaluated using SQI method [36,37]. Four R-peak detection algorithms (Behar [38], Zhang [39], Pan-Tompkins, and Clifford [38]) were applied on each ECG. Through observation, the Pan-Tompkins and Zhang methods provided the best result for our datasets. The SQI scores were then determined by comparing the location of the detected R-peaks between the two peak detectors. An index score of 1 was given for equal R-peak location, otherwise less than 1. The scoring was made on a 10 s window, and the window was shifted 1 s until the end of the signal. A signal with an index score of more than 0.9 was considered a good quality signal; otherwise, it was excluded from the analysis.
3.3 ECG Fiducial Points Detection
A complete automated algorithm to detect nine fiducial points of ECG and their isoelectric lines was developed by adopting previously well-developed algorithms. The fiducial point detections were discussed in five steps in sequence starting from R-peak to QRS-onset. QRS-offset, J-point, and T-onset detections were not included because variations were observed in the ECG curve due to changes on ST-segment that occurred in certain subjects from the case group.
The discrete wavelet transform (DWT) method was used to detect the R-peak because it can also be effectively used as a filter to remove noise and motion artefacts [40]. Wavelet transform allows non-stationary signal of ECG to be analyzed in multiple frequency bands. ECG signal, x(n) is decomposed into smaller sub-samples to obtain details and approximation coefficients, using a mother wavelet. At each scale, ECG passed through a low pass filter with impulse response of p(n) and a high pass filter with impulse response s(n) before they were sub-sampled by factor of 2 to obtain approximation and detailed coefficient, respectively. The filter outputs are given by Eqs. (1) and (2). DWT decomposition processes is illustrated as in Fig. 3.
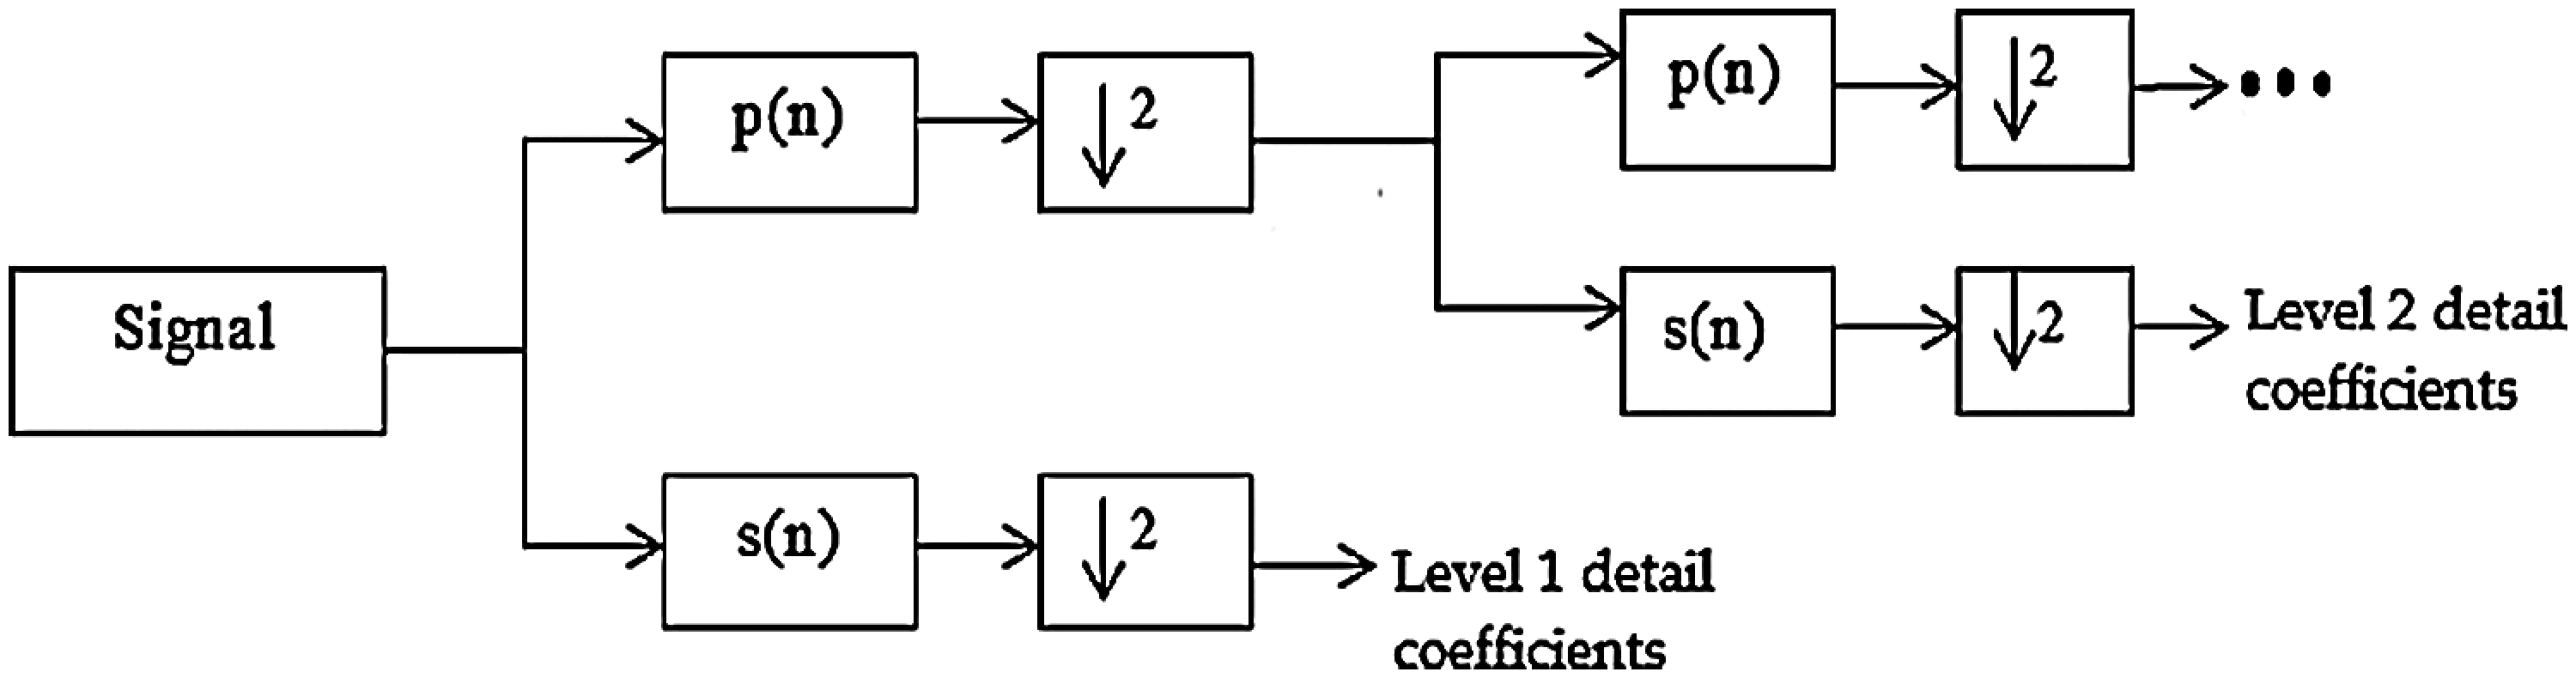
Figure 3: DWT decomposition [41]
In this study, ECG signal was decomposed and reconstructed using ‘coif5’ wavelet. MATLAB functions, which are maximal overlap discrete wavelet transform (MODWT) and multiresolution analysis based on MODWT (MODWTMRA) were used for this purpose. The MODWT partitions a signal's energy across detail coefficients and scaling coefficients while the MODWTMRA projects a signal onto wavelet subspaces and a scaling subspace. To highlight R-peak, ECG signal was reconstructed at fifth scale. The sub-band covered the frequency components between 7.813 Hz and 15.625 Hz. The initial amplitude threshold or reference threshold (THDref) value was set at 30% of the maximum signal amplitude. The peak detected above the threshold was considered R-peak, with minimum distance between peaks set at 20 ms [42].
On the basis of the number of detected peaks, the heart rate (HR) was calculated to determine whether it falls between acceptable range of 40 to 180 bpm. The threshold was slightly increased if too many peaks were detected and slightly decreased if less peaks were detected. Successive R-to-R interval,

Figure 4: R-peak detection processes. (a) Rpeak output (b) Flowchart of R-peak detection
Q-point and S-point were located once R-peak was determined. The minimum trough before R-peak was identified as Q-point, while the minimum trough after R-peak was identified as S-point. The maximum ranges from R-peak for both Q-point and S-point was set at 80 ms because the median of QRS duration was centered around 150 ms [43].
The detection of P-peak and T-peak was based on the method proposed by Elgendi et al. [44]. ECG was filtered using first-order Butterworth bandpass filter with cut-off frequencies of 1 to 10 Hz as P and T waves lie within this range. The ECG signal was then smoothened using 5-point moving average filter to highlight the three main waves of ECG (P, QRS complex, and T waves). All positive peaks within the smoothed signal were determined using MATLAB “findpeaks” function without any threshold.
To locate P-peak and T-peak, their ranges (i.e., blocks of interest) need to be defined. The minimum and maximum locations of both P and T peaks were determined using Eqs. (4)–(7) on the basis of the current R-peak location,

Figure 5: P-peak and T-peak detection on 1–10 Hz filtered ECG
3.3.4 Iso-electric Line, P-Onset, P-Offset, and T-Offset
The onset and offset of P-peak were determined using the isoelectric line or baseline of the signal. The intersections between the isoelectric line with the ECG signal, before and after P-peaks, were the P-onset and P-offset, respectively. T-offset was determined using the same method; however, T-onset detection was excluded because its definition was not clear due to elevation, depression, or inverted wave that can occur in ST-T segments.
The wavelet method was used to obtain the isoelectric line. The wavelet signal from scale−8 to scale−11 was reconstructed using the “coif5” wavelet to generate a line with frequency components below 1 Hz (0.12–0.98 Hz). The generated curve was similar to the baseline of the signal, but normally with some offset (initial baseline). The offset or baseline level was reduced to the minimum amplitude of Q- or S-peak (reduced baseline). Then, it gradually increased to find the first P-onset, with the first intersection within the range of 65 ms before P-peak. The 65 ms range was chosen by assuming that the P wave is centered at its normal duration of 110 ± 20 ms [44]. Once the first intersection was found, the final baseline was marked as the estimated isoelectric line. The intersection between the onset or offset point with the estimated isoelectric line was found in each heartbeat, and if there was none, the final baseline was gradually increased. Adjustment of the baseline is shown Fig. 6a, while the detected peaks are shown in Fig. 6b.

Figure 6: Onset and offset detection of P and T waves. (a) Estimation of iso-electric line (b) Intersec-tion between estimated iso-electric and ECG curves
QRS-onset marks the end of PR-segment and was important in determining PR-interval, QT or QTc interval, and QRS complex duration. QRS-onset was difficult to be determined as depression after P-peaks was common in most of our ECG dataset. Theoretically, the first zero value of ECG first derivative
An alternative method to find the QRS-onset was proposed in this study. A straight line from P-offset to Q-point was drawn on each detected R location. The straight line and ECG curve within the range were rotated or modified to the horizontal level using the empirical formula as in Eq. (8), where “m” is the slope of the straight line and “y1” is the amplitude of P-offset. This method is clearly presented in Fig. 7.

Figure 7: A few variations in ECG curve (between P-offset and Q-point), its modified samples, poten-tial QRS-onset peak (marked with ‘×’), and final QRS-onset peak
3.4 Feature Extraction and Selection
A total of 48 features were extracted in both time and frequency domains. These features were summarized in Tab. 1 and categorized according to their types, labels, and how they were measured. Most of the formula to extract the features are embedded in Measurement column of Tab. 1 using Eqs. (9)–(24).
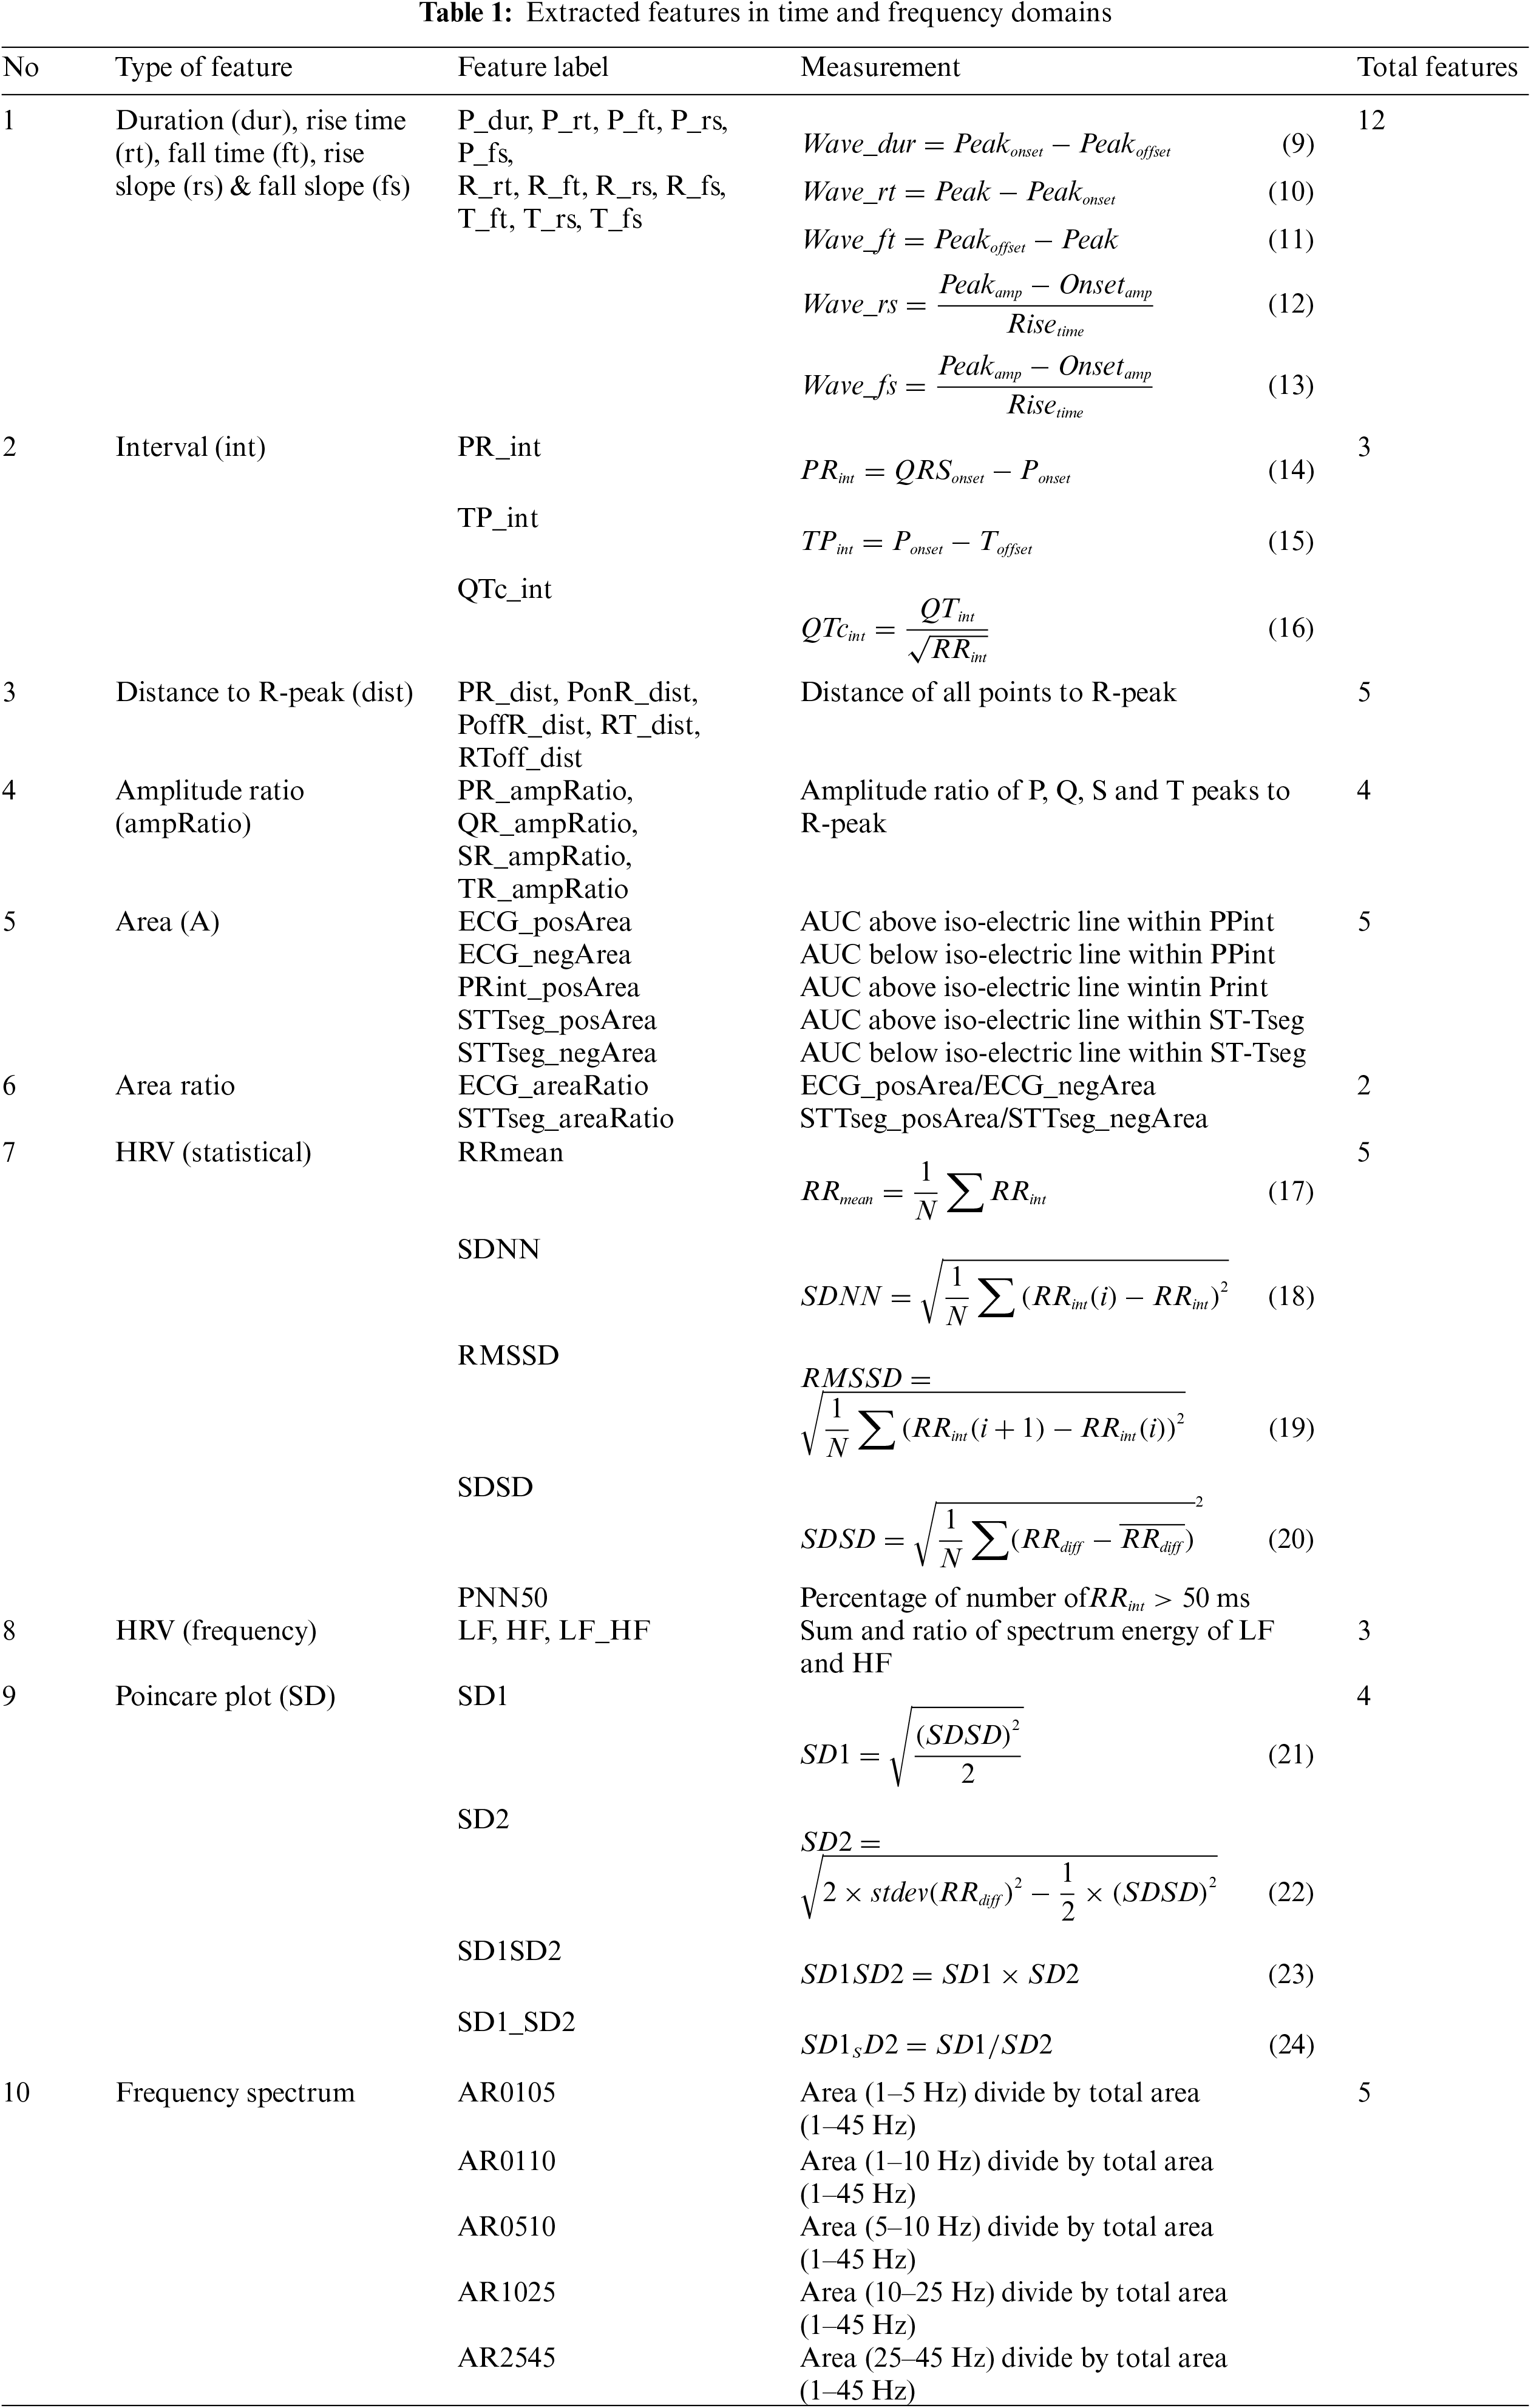
Twelve of the features were obtained by calculating the waves's duration, rise time, fall time, rise slope, and fall slope of P, Q, and T waves using Eqs. (9)–(13). Three main intervals of PR, QTc, and TP were also obtained using Eqs. (14)–(16). Bazett's formula was used to calculate the QTc interval [45]. The distances between each fiducial point and R-peak were also measured to be used as features. The amplitude ratios of P-peak, Q-point, S-peak, and T-peak to R-peak were included as well. The area under the curve (AUC) was examined to compare the positive and negative wave patterns especially in STT-segment. This observation was made to replace the analysis of elevation, depression, or inverted T-waves in ST-T segment given that J-point was not determined by the developed algorithm. The AUCs were calculated using the trapezium method, which is available in MATLAB software as “trapz” function.
Each measurement listed in Tab. 1 was determined on each heart interval, P-onset to P-onset interval,
Eight other features were extracted from HR variability (HRV) analysis and their spectrum energy, calculated using Eqs. (17)–(20), where
The spectrum energy of the filtered ECG was analyzed in extracting more features using power spectrum density as calculated in Eqs. (25) and (26). Observation was made to identify the differences in terms of amplitude and its pattern. The average spectrums of control and case data were enveloped and normalized for better visualization, see Fig. 8a. Clear differences were observed on the relative amplitude with slightly different wave pattern at lower frequency ranges. However, the differences gradually decreased as the frequency increased. Hence, five spectrum frequency ranges were proposed to better analyze the differences: (1–5 Hz), (1–10 Hz), (5–10 Hz), (10–25 Hz), and (25–45 Hz). These ranges were suggested on the basis of the typical ECG frequency spectrum's distribution shown in Fig. 8b [46]. Spectral area under each range over the total area (1–45 Hz) was determined as five new features.
Once all features were extracted, independent sample t-test was conducted to find significant differences between means of both groups. Correlation coefficient (r) of each feature to other features and its group were also determined to identify linear relationships between the two observed variables. Features with high correlation value and low p-value were sorted and top ranked features were selected to be used as input of ML classifiers.

Figure 8: Relative power of ECG spectrum distribution. (a) Case and control datasets (b) Typical spectrum for ECG [46]
Five supervised ML techniques were used in this study to predict CVD using several selected features. These classifiers were trained and tested using 244 data, with 70:30 data division ratio and five-fold cross-validation method. The 30% test rate was acceptable as recommended by Ucar et al. in utilizing ML methods on biomedical datasets [47]. Different numbers of inputs were fed to each ML model to obtain the best classification performance, starting with the top rank feature, followed by two top features, until the number of selected features was achieved. The performance of each trained model was evaluated in terms of specificity (Sp), sensitivity (Sn), and accuracy (Acc).
A common three-layer multi-layer perceptron network was used for ANN with two hidden layers and one output layer [48]. Each network was trained with different numbers of hidden neurons (1–20 nodes at each layer) using ‘Levenberg-Marquardt’ training algorithm, with ‘logsig’ transfer function at hidden layers and ‘purelin’ transfer function at the output layer. Maximum epoch is set to 1000 while training goal (mean squared error) is set at zero. Other parameters were set as default setting in MATLAB, including constant learning rate of 0.01. The output was rounded and compared with its label or target.
The kNN classifier was used to identify similarities among training inputs in each group. The test data were categorized by measuring the minimum distance between the test and training data. Euclidean distance measurement method was used with different numbers of neighbors, set from 1 to 100. SVM on the other hand creates optimal decision boundaries (hyperplane) to distinguish each group of data. This was done by maximizing the margin between the decision boundaries for both groups. The box constraint parameter was set to “1” to disallow too many misclassifications. The only adjusted variable for this classifier was the kernel function. Four kernel functions were used: linear, radial basis function, third-order polynomial, and fourth-order polynomial functions.
The DA classifier was used because it is fast, accurate, and easy to interpret. The algorithm offers predictor variables (based on Gaussian distributions) that provide accurate discrimination between classes. Linear and quadratic types of DA were used in this study to create linear and non-linear boundaries between classes. Decision tree classifier was used to predict nominal responses to training data, either ‘true’ or ‘false’. Decision is made from the beginning node (root) down to a leaf node, where responses are available. In this study, Gini's diversity index was used as the split criterion, with a different number of splits (leaves nodes), set from 1 to 100.
A complete automated analysis was conducted to differentiate the ECG properties of CVD mortality and non-CVD-related mortality of 244 selected subjects in the Malaysian population. Subjects were selected on the basis of the quality of their ECG (SQI > 0.9). The average SQI score of the selected subjects was 0.9918, with a minimum value of 0.9411. These subjects aged from 36 to 64 years with a mean of 54.75 ± 5.28 years. Most of the subjects were male (200%, 81.97%). Majority of them were Malays (129%, 52.87%), followed by Indians (63%, 25.82%), Chinese (33%, 13.52%), and other ethnicities (19%, 7.79%). They died within 6 years after recruitment with a mean of 2.62 ± 1.59 years for the control group and 2.7 ± 1.57 years for the case group. Both groups shared similar HR range, 48–106 bpm (mean: 69.37 ± 11.69) for the control group and 48–105 bpm (mean: 71.24 ± 11.91) for the case group.
The most challenging part of the study was to develop the algorithm for ECG fiducial point detection. A novel method to detect the onset and offset points of P and T waves was proposed in this study through intersection between the ECG curve and the estimated isoelectric line. The isoelectric line was generated using the DWT method by reconstructing the signal at low-frequency bands below 1 Hz. An alternative method to detect QRS-onset point was suggested by detecting the maximum peak of the modified samples from P-offset location to Q-point location. The developed peak detection algorithms can be further improved by detecting QRS-offset, J-point, and T-onset, which allows the determination of QRS, ST segment, and ST-T segment durations. Example of the complete fiducial point detection output is shown in Fig. 9.

Figure 9: Automated detection of nine ECG fiducial points
Another focus of this study was to extract as many significant features as possible, which were mostly obtained from the detected fiducial points. Twelve out of the forty-eight features were statistically significant (p<0.05). However, 19 features (p<0.1) were selected to optimize the classification performance. The relationship among the selected features to their respective groups or outcomes are best visualized using the correlation matrix's heatmap, as shown in Fig. 10. The correlation values (r) near to 1 suggested that the two observed variables are positively correlated, while the correlation values near to −1 suggested that the two observed variables are negatively correlated. Values near to 0 show that the two observed variables have extremely weak relationship, where changes in the first variable could affect the second variable in unpredictable ways (positively or negatively).

Figure 10: Correlation matrix of 19 selected features
The selected features were sorted according to their p-value and absolute value of the correlation coefficients, |r|. This is shown in Fig. 11, where the leftmost bar is the most important feature and vice versa. P-value of each feature was given on top of each bar. P-value and |r| was inversely proportional to each other, where higher |r| was associated with lower p-value.

Figure 11: Feature ranking based on correlation coefficient and p-value
Seven out of the nineteen selected features were related to T-wave. Six of them were statistically significant, and five of the six features were in the top rank (T_fs, T_rs, STTseg_posArea, QTc_int, and T_ft). This finding showed that significant differences were present in T-wave morphology in CVD mortality subjects compared with non-CVD-related mortality subjects. This is due to the fact that the case subjects had underlying cardiac disease that was asymptomatic but ended with the succumbing to AMI or ACS.Analysis on the frequency domain showed that four out of the five proposed power spectrum features were among the top 19 selected features. The area ratio of the relative power in (5–10 Hz) and (1–10 Hz) over the total area (1–45 Hz) was statistically significant (p < 0.012) because the P wave, QRS complex, and T wave spectrums were distributed in this area. Meanwhile, the HRV and Poincare plot features were mostly insignificant due to short recording of the ECG signals (10–30 s).
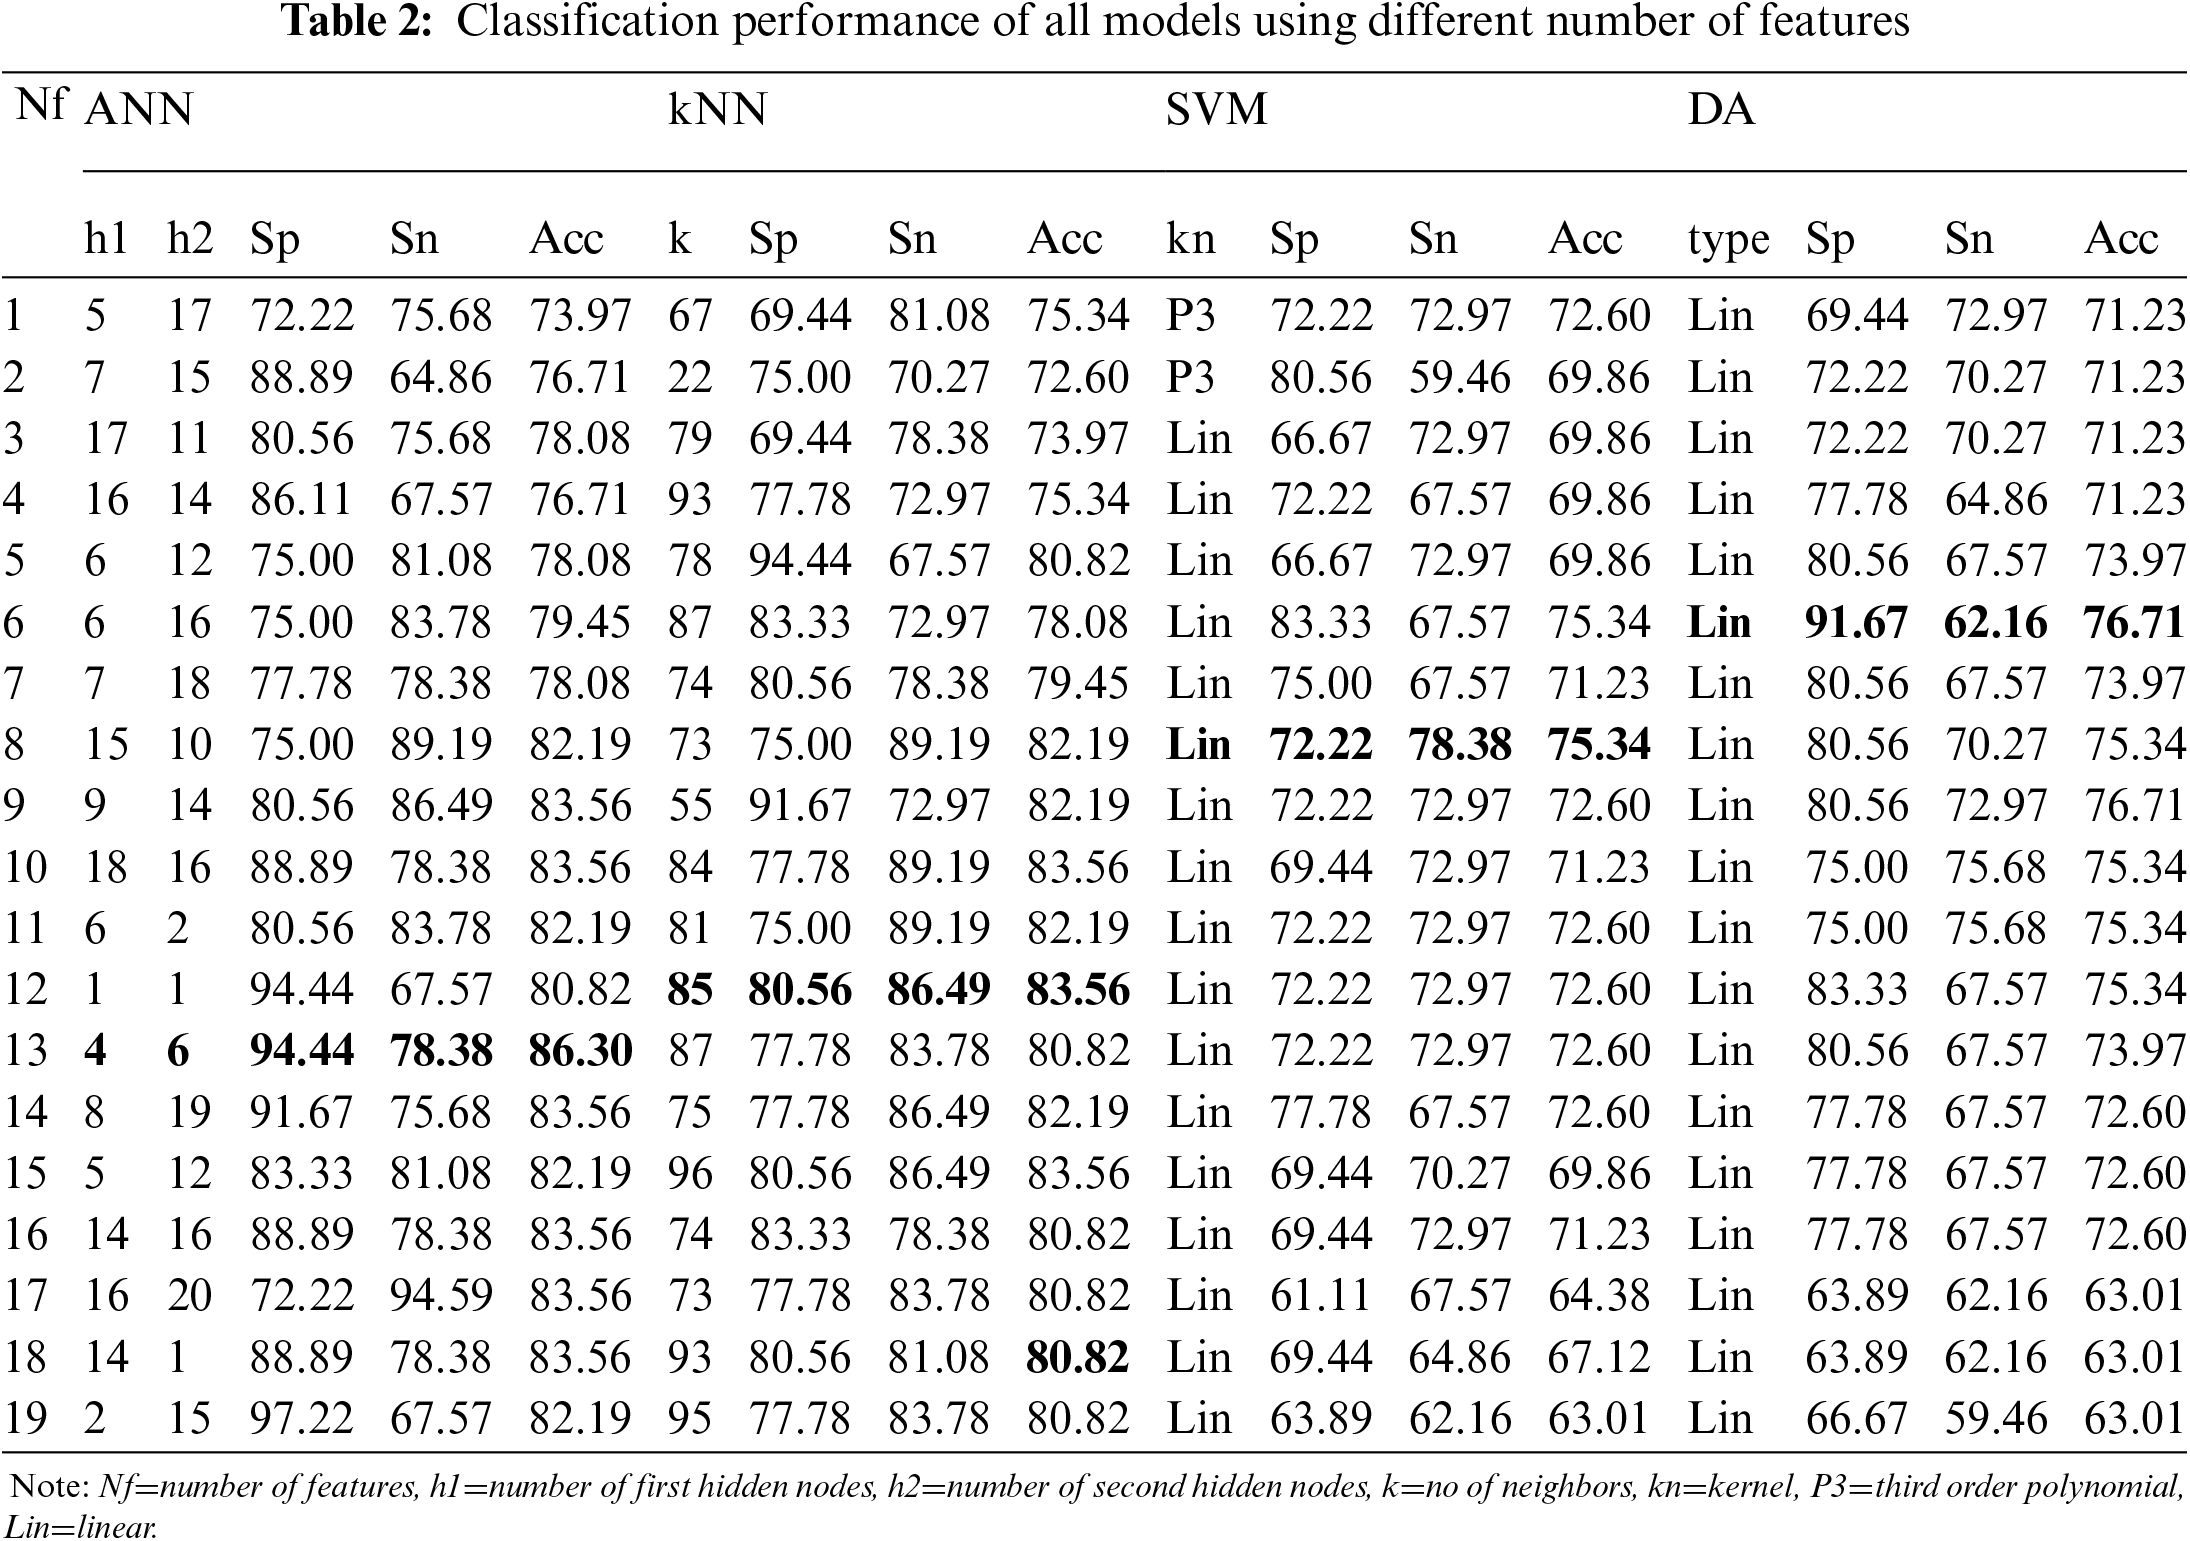
ML models were trained with different input numbers, from 1 feature to 19 features to produce output of ‘0’ or ‘1’ that indicates control and case groups, respectively. The best performance (in terms of Sp, Sn and Acc) of trained model at each input number is tabulated as in Tab. 2.
The highest classification Acc was achieved using ANN model (4 and 6 nodes at first and second hidden layer), utilizing 13 input features with Sp of 94.44% and Acc of 86.30%. kNN classifier only able to accurately classify the group with 80.56% Sp, 86.49% Sn, and 83.56% Acc using 12 features and 85 neighbors. The SVM and DA classifiers were only able to classify the case and control groups with Acc less than 80%. DT classifier had the least performance with 75% Sp, 59.46% Sn and 67.12% Acc at its best using 2 features and 1 split number. Hence, the result was excluded for comparison.
Increment in feature numbers affected the classification performance. This is shown in Fig. 12, where the average Acc for all classifiers gradually increased from around 71% when using single feature to 78% when using 10 features, before decreasing to 69% at 19 features. The optimal classification result was obtained at 8 to 13 features.
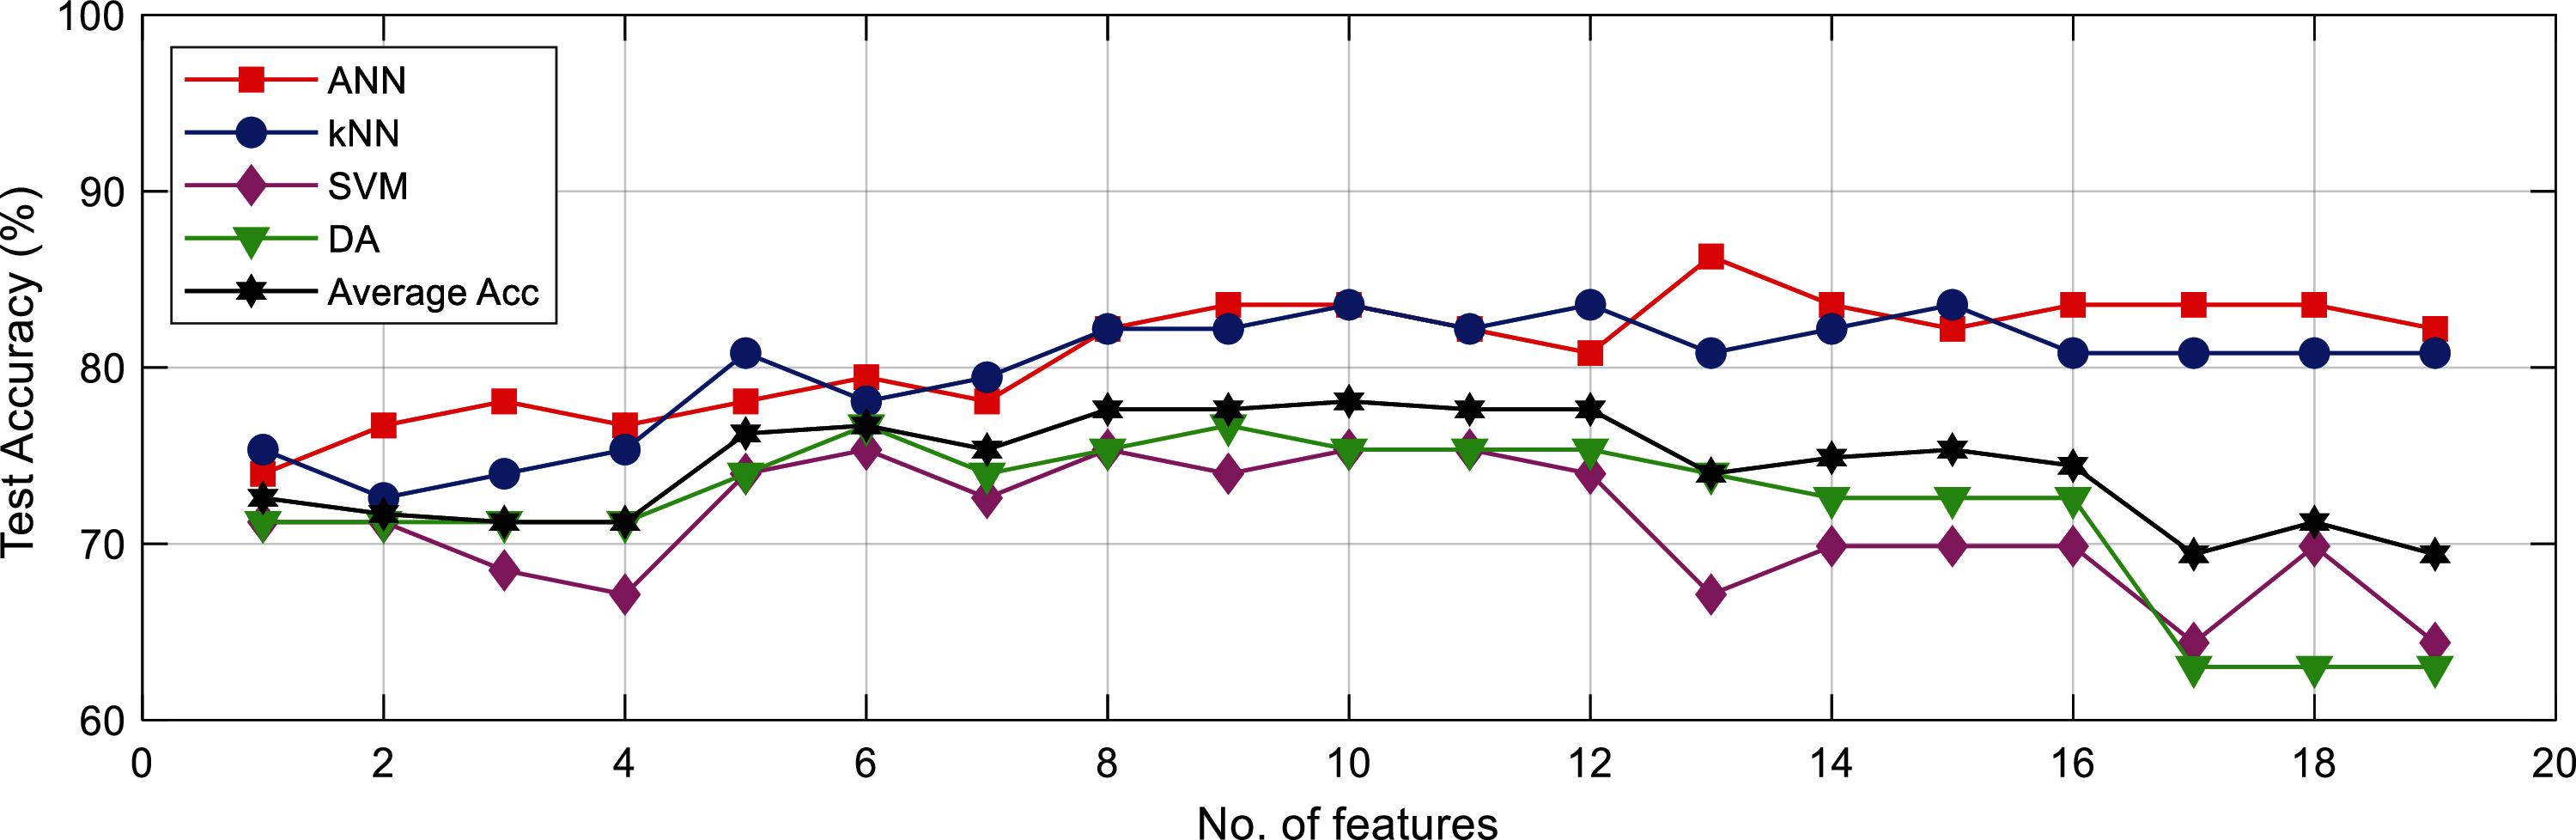
Figure 12: Accuracy for all classifiers with different number of input feature
Direct comparison with previous studies on CVD prediction cannot be made due to differences in modalities (sensors used), hospital settings and type of disease classified. However, four most related studies were identified, as discussed in the second section of related work. They were differentiating CVD or heart disease (HD) in general, not by the type of disease such as CAD, MI, SCD, or arrhythmia classification. The comparison table is given in Tab. 3.
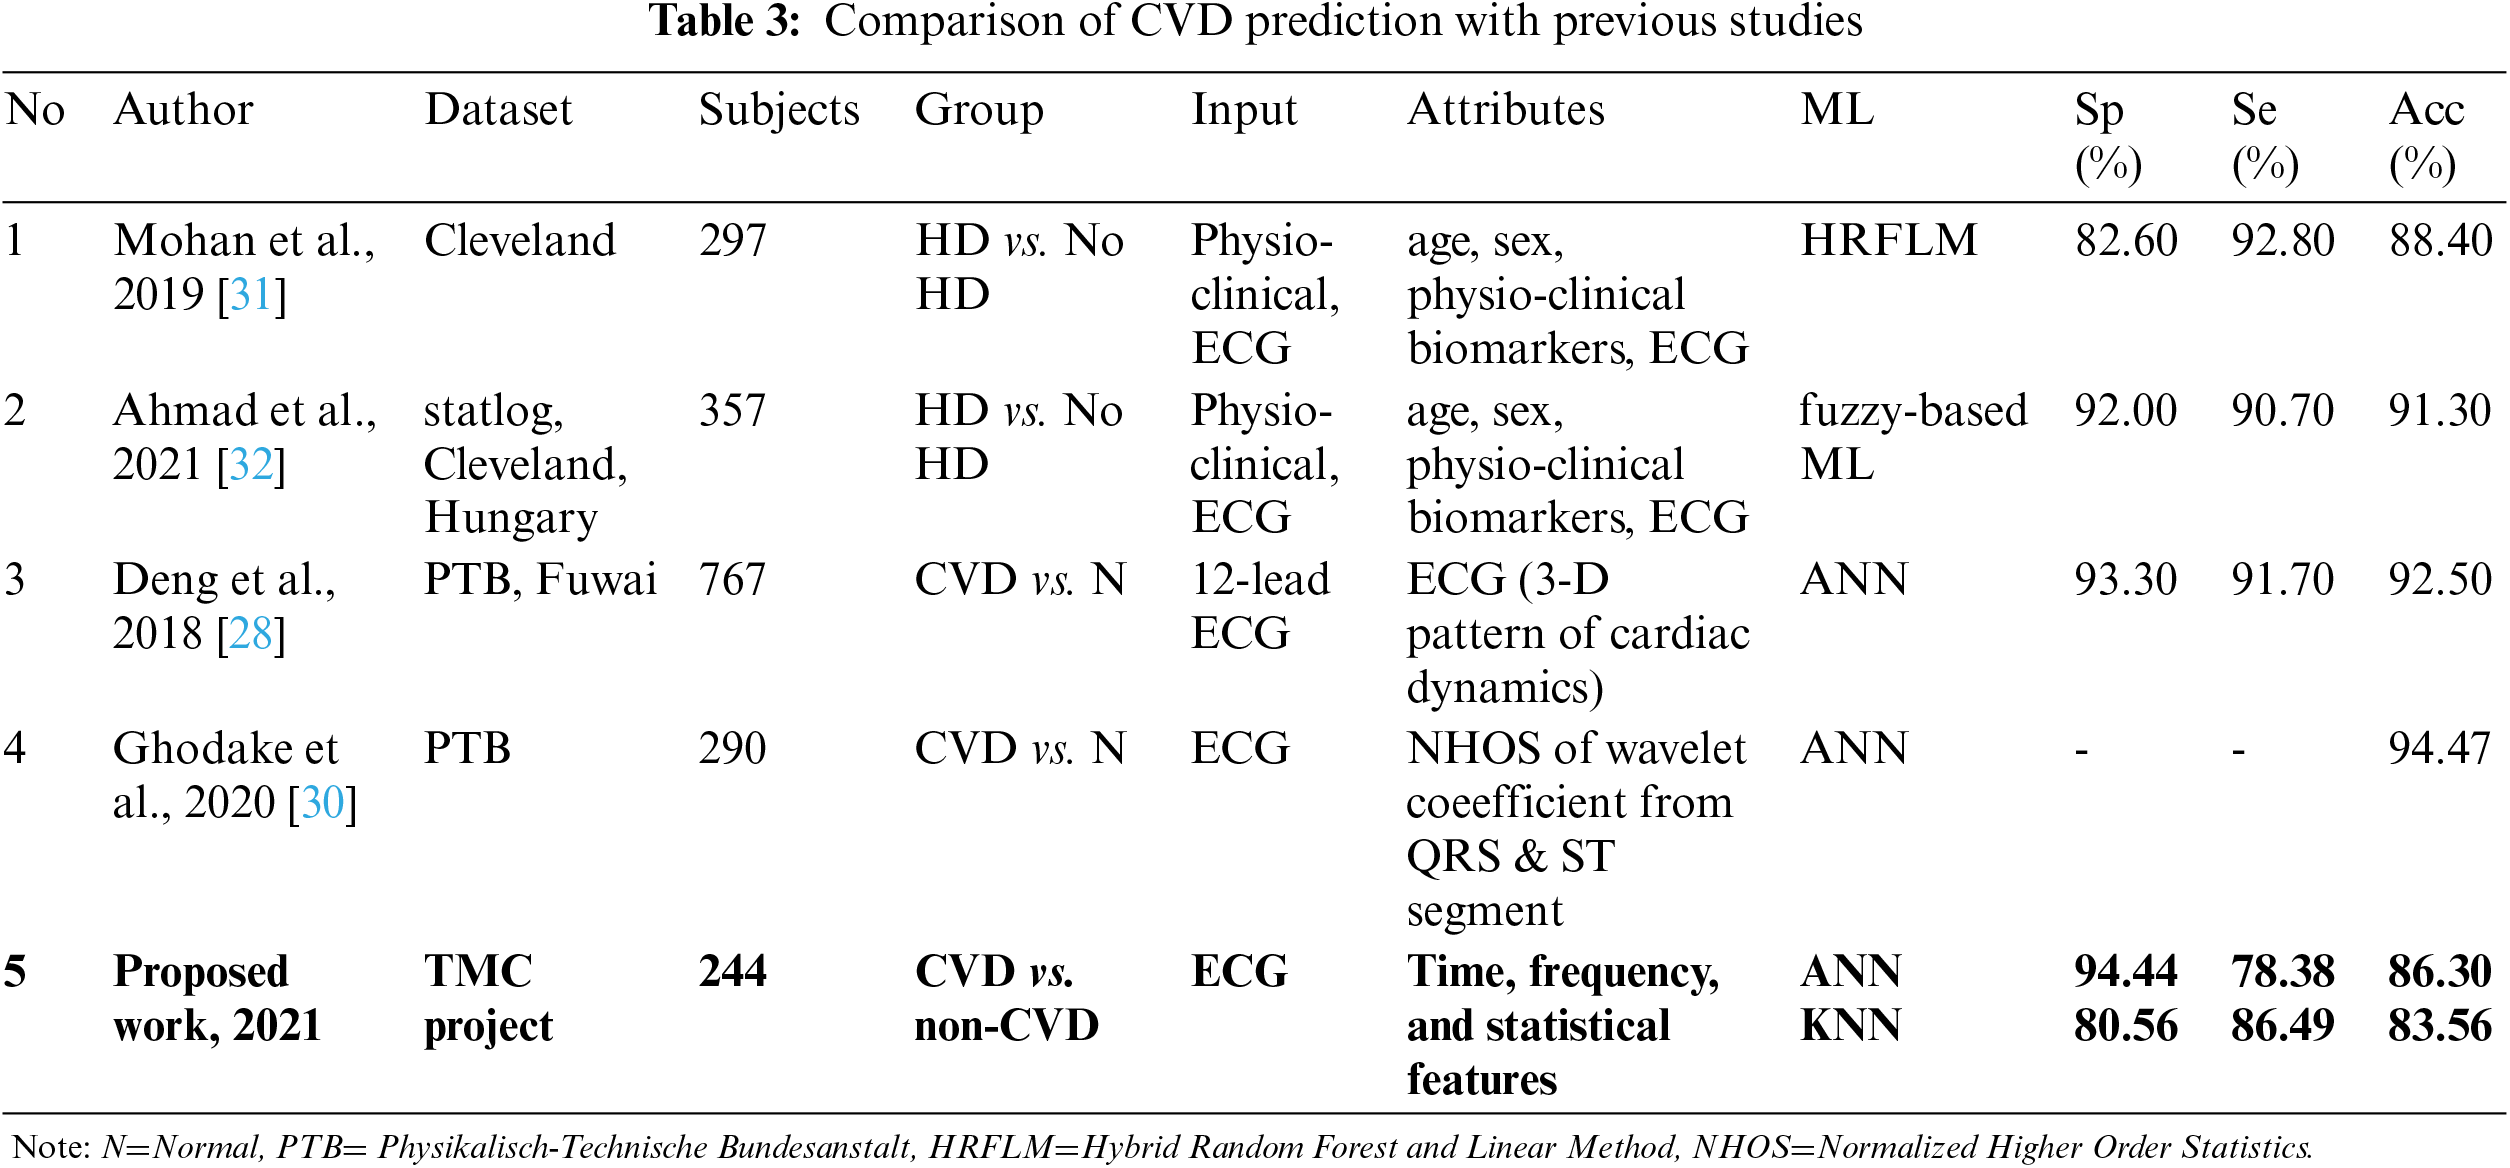
The proposed work had achieved better specificity of 94.44% and comparable accuracy of 86.3% by using solely non-invasive short ECG recordings, without inputs from patient demographic data and biomarkers as in [31] and [32]. Deng et al. and Ghodake et al. had utilized ECG to extract different features of cardiac dynamics and wavelet coefficient, respectively. Their performances were slightly better since they were differentiating CVD with healthy subjects, not with patient who have non-related CVD diseases as in the proposed work.
To summarize, a complete automated CVD prediction system for Malaysian adults using ECG had been successfully developed in this study. The main contributions include the alternative solution for ECG fiducial point detection, as well as proposing two significant spectral features. The study is limited to short recording of ECG that make certain features regarding HRV were not significant. Besides, QRS-offset and J-point of ECG could not be detected by the system. For future work, longer recordings of ECG will be used with complete fiducial points detection to obtain more significant features. Furthermore, in order to improve CVD prediction performance, deep learning technique will be implemented.
The study proved that ECG data alone can be used in the early detection and risk prediction of asymptomatic individuals with regard to developing CVD mortality. ANN had performed considerably well with specificity of 94.44% and accuracy of 86.30% as compared to previous studies. T wave-related features including T-risetime, T-falltime, T-fallslope, QTc interval, and positive area on STT-segment were significant in distinguishing CVD and non-related CVD groups. The spectrum information in 1–10 Hz and 5–10 Hz frequency ranges was found statistically significant as well. Alternative methods to locate the onset and offset points of P and T waves and QRS-onset point had been proposed in this study. As for conclusion, a solid system to detect ECG fiducial points and predict CVD among unhealthy individuals was developed in this study for the Malaysian population. This prediction system is significantly important for better CVD secondary prevention, subsequently increasing the life expectancy and improving the life quality of patients.
Acknowledgement: The authors thank all volunteered participants for their collaboration and contribution for the data recordings. The authors also thank Universiti Kebangsaan Malaysia for additional funding, including infrastructure and utilities.
Funding Statement: This study was supported by the Ministry of Education Malaysia's Fundamental Research Grant Scheme FRGS/1/2019/TK04/UKM/02/4. TMC research was funded by a top-down grant from the Ministry of Education Malaysia (Grant Number PDE48).
Conflicts of Interest: The authors declare that they have no conflict of interest to report regarding the present study.
1. World Health Organization (WHO“Cardiovascular diseases key facts,” WHO Fact Sheets, 2021. [Online]. Available: https://www.who.int/news-room/fact-sheets/detail/cardiovascular-diseases-(cvds). [Google Scholar]
2. Department of Statistics Malaysia “Statistics on Causes of Death in Malaysia, 2020,” DOSM Press Release, 2021. [Online]. Available: https://www.dosm.gov.my/v1/index.php?r=column/cthemeByCat&cat=401&bul_id=QTU5T0dKQ1g4MHYxd3ZpMzhEMzdRdz09&menu_id=L0pheU43NWJwRWVSZklWdzQ4TlhUUT09. [Google Scholar]
3. National Heart Association of Malaysia (NHAM“Primary & secondary prevention of cardiovascular disease,” https://Malaysianheart.org, 2017. [Online]. Available: https://www.malaysianheart.org/files/597736485dd17.pdf. [Google Scholar]
4. S. Selvarajah, G. Kaur, J. Haniff, K. C. Cheong, T. G. Hiong et al., “Comparison of the framingham risk score, SCORE and who/ISH cardiovascular risk prediction models in an asian population,” International Journal of Cardiology, vol. 176, no. 1, pp. 211–218, 2014. [Google Scholar]
5. Ministry of Health Malaysia (MOH“The impact of noncommunicable diseases and their risk factors on Malaysia's gross domestic product,” https://Moh.gov.my, 2021. [Online]. Available: https://www.moh.gov.my/index.php/database_stores/attach_download/554/64. [Google Scholar]
6. B. Harbaoui, P. Y. Courand, A. Cividjian and P. Lantelme, “Development of coronary pulse wave velocity: New pathophysiological insight into coronary artery disease,” Journal of the American Heart Association, vol. 6, no. 2, pp. 1–11, 2017. [Google Scholar]
7. H. Li, X. Wang, C. Liu, Y. Wang, P. Li et al., “Dual-input neural network integrating feature extraction and deep learning for coronary artery disease detection using electrocardiogram and phonocardiogram,” IEEE Access, vol. 7, pp. 146457–146469, 2019. [Google Scholar]
8. X. Fan, Q. Yao, Y. Cai, F. Miao, F. Sun et al., “Multiscaled fusion of deep convolutional neural networks for screening atrial fibrillation from single lead short ECG recordings,” IEEE Journal of Biomedical and Health Informatics, vol. 22, no. 6, pp. 1744–1753, 2018. [Google Scholar]
9. O. Yildirim, U. B. Baloglu, R. S. Tan, E. J. Ciaccio and U. R. Acharya, “A new approach for arrhythmia classification using deep coded features and LSTM networks,”Computer Methods and Programs in Biomedicine, vol. 176, pp. 426–443, 2019. [Google Scholar]
10. L. B. Marinho, N. de M. M. Nascimento, J. W. M. Souza, M. V. Gurgel, P. P. Rebouças Filho et al., “A novel electrocardiogram feature extraction approach for cardiac arrhythmia classification,” Future Generation Computer Systems, vol. 97, pp. 564–577, 2019. [Google Scholar]
11. M. A. Khan and Y. Kim, “Cardiac arrhythmia disease classification using LSTM deep learning approach,” Computers, Materials & Continua, vol. 67, no. 1, pp. 427–443, 2021. [Google Scholar]
12. G. Sannino and G. De Pietro, “A deep learning approach for ECG-based heartbeat classification for arrhythmia detection,” Future Generation Computer, vol. 86, pp. 446–455, 2018. [Google Scholar]
13. S. L. Oh, E. Y. K. Ng, R. S. Tan and U. R. Acharya, “Automated diagnosis of arrhythmia using combination of CNN and LSTM techniques with variable length heart beats,” Computers in Biology and Medicine, vol. 102, pp. 278–287, 2018. [Google Scholar]
14. Y. J. Kim, J. Heo, K. S. Park and S. Kim, “Proposition of novel classification approach and features for improved real-time arrhythmia monitoring,” Computers in Biology and Medicine, vol. 75, pp. 190–202, 2016. [Google Scholar]
15. I. Goldenberg, R. Goldkorn, N. Shlomo, M. Einhorn, J. Levitan et al.,“Heart rate variability for risk assessment of myocardial ischemia in patients without known coronary artery disease: The HRV-detect (heart rate variability for the detection of myocardial ischemia) study,” Journal of the American Heart Association, vol. 8, no. 24, pp. 1–10, 2019. [Google Scholar]
16. R. K. Tripathy, A. Bhattacharyya and R. B. Pachori, “A novel approach for detection of myocardial infarction from ECG signals of multiple electrodes,” IEEE Sensors Journal, vol. 19, no. 12, pp. 4509–4517, 2019. [Google Scholar]
17. A. K. Dohare, V. Kumar and R. Kumar, “Detection of myocardial infarction in 12 lead ECG using support vector machine,” Applied Soft Computing Journal, vol. 64, pp. 138–147, 2018. [Google Scholar]
18. N. Mahri, K. Gan, R. Meswari, M. H. Jaafar, M. Alauddin et al., “Utilization of second derivative photoplethysmographic features for myocardial infarction classification,” Journal of Medical Engineering & Technology, vol. 41, no. 4, pp. 298–308, 2017. [Google Scholar]
19. K. Feng, X. Pi, H. Liu and K. Sun, “Myocardial infarction classification based on convolutional neural network and recurrent neural network,” Applied Sciences, vol. 9, no. 9, pp. 1–12, 2019. [Google Scholar]
20. E. Ebrahimzadeh, A. Foroutan, M. Shams, R. Baradaran, L. Rajabion et al., “An optimal strategy for prediction of sudden cardiac death through a pioneering feature-selection approach from HRV signal,” Computer Methods and Programs in Biomedicine, vol. 169, pp. 19–36, 2019. [Google Scholar]
21. V. Houshyarifar and M. C. Amirani, “Early detection of sudden cardiac death using poincaré plots and recurrence plot-based features from HRV signals,” Turkish Journal of Electrical Engineering & Computer Sciences, vol. 25, pp. 1541–1553, 2017. [Google Scholar]
22. M. M. Honikel, C. E. Lin, D. Trobst and J. T. La Belle, “Facilitatiing earlier diagnosis of cardiovascular disease through point of care biosensors: A review,” Critical Reviews in Biomedical Engineering, vol. 46, no. 1, pp. 53–82, 2018. [Google Scholar]
23. K. N. Minhad, S. H. M. D. Ali and M. B. I. Reaz, “A design framework for human emotion recognition using electrocardiogram and skin conductance response signals,” Journal of Engineering Science and Technology, vol. 12, no. 11, pp. 3102–3119, 2017. [Google Scholar]
24. N. A. Nayan, H. A. Hamid, M. Z. Suboh, N. Abdullah, R. Jaafar et al., “Cardiovascular disease prediction from electrocardiogram by using machine learning,” International Journal of Online and Biomedical Engineering, vol. 16, no. 7, pp. 34, 2020. [Google Scholar]
25. D. Kozłowski, “Method in the chaos – a step-by-step approach to ECG interpretation,” European Journal of Translational and Clinical Medicine, vol. 1, no. 1, pp. 76–92, 2018. [Google Scholar]
26. A. B. de Luna, M. Fiol-Sala and E. M. Antman, In the 12 Lead ECG in ST Elevation Myocardial Infarction: A Practical Approach for Clinicians. Massachusetts, USA: Blackwell Publishing, 2007. [Online]. Available: https://onlinelibrary.wiley.com/doi/abs/10.1002/9780470750964.fmatter. [Google Scholar]
27. U. R. Acharya, H. Fujita, V. K. Sudarshan, S. L. Oh, M. Adam et al.., “Automated detection and localization of myocardial infarction using electrocardiogram: A comparative study of different leads,” Knowledge-Based System, vol. 99, no. 2016, pp. 146–156, 2016. [Google Scholar]
28. M. Deng, C. Wang, M. Tang and T. Zheng, “Extracting cardiac dynamics within ECG signal for human identification and cardiovascular diseases classification,” Neural Networks, vol. 100, pp. 70–83, 2018. [Google Scholar]
29. J. S. Karnewar, D. V. K. Shandilya and M. D. Tambakhe, “A study on ECG signal analysis and ECG databases,” International Journal of Research in Advent Technology, vol. 7, no. 4, pp. 188–195, 2019. [Google Scholar]
30. S. Ghodake, S. Ghumbre and S. Deshmukh, “Optimized cardiovascular disease detection and features extraction algorithms from ECG data,” International Journal of Advanced Computer Science and Applications, vol. 11, no. 8, pp. 200–206, 2020. [Google Scholar]
31. S. Mohan, C. Thirumalai and G. Srivastava, “Effective heart disease prediction using hybrid machine learning techniques,” IEEE Access, vol. 7, pp. 81542–81554, 2019. [Google Scholar]
32. M. Ahmad, M. Alfayad, S. Aftab, M. Adnan Khan, A. Fatima et al., “Data and machine learning fusion architecture for cardiovascular disease prediction,” Computers, Materials & Continua, vol. 69, no. 2, pp. 2717–2731, 2021. [Google Scholar]
33. M. Z. Suboh, R. Jaafar, N. A. Nayan and N. H. Harun, “ECG-Based detection and prediction models of sudden cardiac death: Current performances and new perspectives on signal processing techniques,” International Journal of Online and Biomedical Engineering, vol. 15, no. 15, pp. 110–126, 2019. [Google Scholar]
34. M. Sharma, G. Singh and R. Singh, “Stark assessment of lifestyle based human disorders using data mining based learning techniques,” Innovation and Research in Biomedical Engineering, vol. 38, no. 6, pp. 305–324, 2017. [Google Scholar]
35. R. Jamal, S. Z. Syed Zakaria, M. A. Kamaruddin, N. Abd Jalal, N. Ismail et al., “Cohort profile: The Malaysian cohort (TMC) project: A prospective study of non-communicable diseases in a multi-ethnic population,” International Journal of Epidemiology, vol. 44, no. 2, pp. 423–431, 2015. [Google Scholar]
36. N. A. Nayan and H. A. Hamid, “Evaluation of patient electrocardiogram datasets using signal quality indexing,” Bulletin of Electrical Engineering and Informatics, vol. 8, no. 2, pp. 521–528, 2019. [Google Scholar]
37. N. A. Nayan, R. Jaafar and N. S. Risman, “Development of respiratory rate estimation technique using electrocardiogram and photoplethysmogram for continuous health monitoring,” Bulletin of Electrical Engineering and Informatics, vol. 7, no. 3, pp. 487–494, 2018. [Google Scholar]
38. J. Behar, J. Oster, Q. Li and G. D. Clifford, “ECG signal quality during arrhythmia and its application to false alarm reduction,” IEEE Transactions on Biomedical Engineering, vol. 60, no. 6, pp. 1660–1666, 2013. [Google Scholar]
39. Q. Zhang, A. I. Manriquez, C. Médigue, Y. Papelier and M. Sorine, “An algorithm for robust and efficient location of T-wave ends in electrocardiograms,” IEEE Transactions on Biomedical Engineering, vol. 53, no. 12, pp. 2544–2552, 2006. [Google Scholar]
40. D. Zhang, S. Wang, F. Li, J. Wang, A. K. Sangaiah et al., “An ECG signal de-noising approach based on wavelet energy and sub-band smoothing filter,” Applied Sciences, vol. 9, no. 22, pp. 4968, 2019. [Google Scholar]
41. C. Sridhar, U. R. Acharya, H. Fujita and G. M. Bairy, “Automated diagnosis of coronary artery disease using nonlinear features extracted from ECG signals,” in 2016 IEEE Int. Conf. on Systems, Man, and Cybernetics (SMCBudapest, Hungary, pp. 545–549, 2016. [Google Scholar]
42. Z. Zidelmal, A. Amirou, D. Ould-Abdeslam, A. Moukadem and A. Dieterlen, “QRS detection using s-transform and shannon energy,” Computer Methods and Programs in Biomedicine, vol. 116, no. 1, pp. 1–9, 2014. [Google Scholar]
43. J. E. Poole, J. P. Singh and U. Birgersdotter-Green, “QRS duration or QRS morphology what really matters in cardiac resynchronization therapy?,” Journal of the American College of Cardiology, vol. 67, no. 9, pp. 1104–1117, 2016. [Google Scholar]
44. M. Elgendi, M. Meo and D. Abbott, “A proof-of-concept study: Simple and effective detection of p and t waves in arrhythmic ECG signals,” Bioengineering, vol. 3, no. 4, pp. 1–14, 2016. [Google Scholar]
45. F. J. Gimeno-Blanes, M. Blanco-Velasco, Ó. Barquero-Pérez, A. García-Alberola and J. L. Rojo-Álvarez, “Sudden cardiac risk stratification with electrocardiographic indices - a review on computational processing, technology transfer, and scientific evidence,” Frontiers in Physiology, vol. 7, no. 82, pp. 1–17, 2016. [Google Scholar]
46. M. Z. Suboh, R. Jaafar, N. A. Nayan and N. H. Harun, “Shannon energy application for detection of ECG R-peak using bandpass filter and stockwell transform methods,” Advances in Electrical and Computer Engineering, vol. 20, no. 3, pp. 41–48, 2020. [Google Scholar]
47. M. K. Uçar, M. Nour, H. Sindi and K. Polat, “The effect of training and testing process on machine learning in biomedical datasets,” Mathematical Problems in Engineering, vol. 2020, pp. 1–17, 2020. [Google Scholar]
48. C. C. Peng, Y. C. Lai, C. W. Huang, J. G. Wang, S. H. Wang et al., “Cardiovascular diseases prediction using artificial neural networks: A survey,” in 2nd IEEE Eurasia Conf. on. Biomedical Engineering, Healthcare and Sustainability 2020, Tainan, Taiwan, pp. 141–144, 2020. [Google Scholar]
 | This work is licensed under a Creative Commons Attribution 4.0 International License, which permits unrestricted use, distribution, and reproduction in any medium, provided the original work is properly cited. |