DOI:10.32604/cmc.2022.022091
| Computers, Materials & Continua DOI:10.32604/cmc.2022.022091 | |
| Article |
Design of Automatic Batch Calibration and Correction System for IMU
1School of Mechanical Engineering, Nanjing University of Science and Technology, Nanjing, 210000, China
2Department of Electrical and Electronic Engineering, Colorado State University, Colorado, United States
*Corresponding Author: Zhiqiang Wu. Email: wuzhiqiang@njust.edu.cn
Received: 27 July 2021; Accepted: 09 September 2021
Abstract: Thanks to its light weight, low power consumption, and low price, the inertial measurement units (IMUs) have been widely used in civil and military applications such as autopilot, robotics, and tactical weapons. The calibration is an essential procedure before the IMU is put in use, which is generally used to estimate the error parameters such as the bias, installation error, scale factor of the IMU. Currently, the manual one-by-one calibration is still the mostly used manner, which is low in efficiency, time-consuming, and easy to introduce mis-operation. Aiming at this issue, this paper designs an automatic batch calibration method for a set of IMUs. The designed automatic calibration master controller can control the turntable and the data acquisition system at the same time. Each data acquisition front-end can complete data acquisition of eight IMUs one time. And various scenarios of experimental tests have been carried out to validate the proposed design, such as the multi-position tests, the rate tests and swaying tests. The results illustrate the reliability of each function module and the feasibility automatic batch calibration. Compared with the traditional calibration method, the proposed design can reduce errors caused by the manual calibration and greatly improve the efficiency of IMU calibration.
Keywords: MEMS; inertial measurement unit; batch calibration; automatic calibration
Micro electro mechanical system (MEMS) inertial sensors play an increasing important role in nowadays technology development. MEMS inertial sensors mainly include MEMS accelerometers, MEMS gyroscopes, and MEMS magnetometers. The inertial measurement unit (IMU) composed of MEMS inertial sensors are superior in light weight, low power consumption, good durability, and low price [1], and it can provide the position, speed and attitude information of the carrier [2], that makes it very popular in civilian electronic toys, smart machinery, medical equipment, automotive electronics, mobile phones, as well as military weapons [3]. However, the MEMS IMU has low long-time accuracy and many sources of errors [4], which is required to be carefully calibrated before it is put into use.
There are various calibration methods for the IMUs. Accelerometer test calibration can be divided into different types according to the generation of the standard acceleration signal (excitation signal), such as gravity field test [5], shaking table test [6], impact test [7], centrifuge test [8]. For gyroscopes, it can be characterized by the rate calibration with provided precious angular rate and the angular rate integration calibration [9]. In terms of the calibration environment, it can be divided into the multi-angular calibration based on the laboratory turntable [10] and the field multi-position calibration. The calibration method based on the high-precision turntable have good accuracy, but the calibration process is rather complicated; field calibration can reduce the workload and agree with the needs of practical applications, but the calibration manner and accuracy are limited. Regardless of the calibration method, the calibration of MEMS inertial sensors still relies on manual operation [11]. This method is tedious, time-consuming and error-prone. Therefore, the need for automatic batch calibration for the MEMS IMU is imminent. Scholars of the inertial field have conducted various studies in terms of automatic calibration and batch calibration of MEMS inertial sensors. For example, Han [12] has developed an automatic system for accelerometer gravity field tests, and Long [13] has investigated an automatic system for the decoupling of the temperature coefficients and coefficients of the gravitational field static model of the accelerometer. Xue [14] designed a batch calibration platform for accelerometers, etc. Xing [15] has designed an automatic calibration system based on the database for the MEMS IMU, which is able to control the turntable, thermostats, vibration bench, and level platform. Chen [16] also designed an object-oriented automatic system based on the turntable, which controls the three-axis position turntable and automatically collects the test data of the IMU. However, both the systems just calibrate one set of MEMS IMU at a time, which is not efficient for a number of IMUs [17].
In order to meet the needs of automatic calibration and batch calibration of MEMS IMUs at the same time, this paper proposes an automatic batch calibration system for MEMS IMUs. Based on the high-precision three-axis turntables, the “front-end and main control” communication layout has been employed to control a number of turntables with a batch of IMUs on each, so that it could realize the batch calibration of the small inertial components in fully automatic mode. The organization of this paper is as follows. Section 2 reviews the error model of the MEMS IMU. Section 3 presents the IMU automatic batch calibration system with a detailed explanation of the automatic functions. Section 4 analyzes the experimental results. Section 5 concludes the paper.
For an ideal IMU, the triad of the 3 axes of the accelerometer and the 3 axes of the~gyroscope defines a single, shared, orthogonal 3D frame [18–20]. Each accelerometer senses the acceleration along one distinct axis, while the gyroscope measures the angular rate around the axis. However, the performance of IMU is practically affected by various errors [21], such as bias, scaling factors, and axial cross-coupling errors [22]. In this study, the scale factors, bias, and installation errors are focused to be calibrated.
Bias is the sensor output observed even in the absence of an applied physical input [23,24]. This term often varies slowly with time and hence is also called drift or g-independent bias for the gyroscope [25]. The stationary part of the bias is also named as the offset which can be calibrated, as shown in Fig. 1a. Scaling factor is the ratio between the change of measurement and the change of the actual input, as shown in Fig. 1b. Scaling factor can be regarded as the slope of the straight line that projects the input data to the output readings.
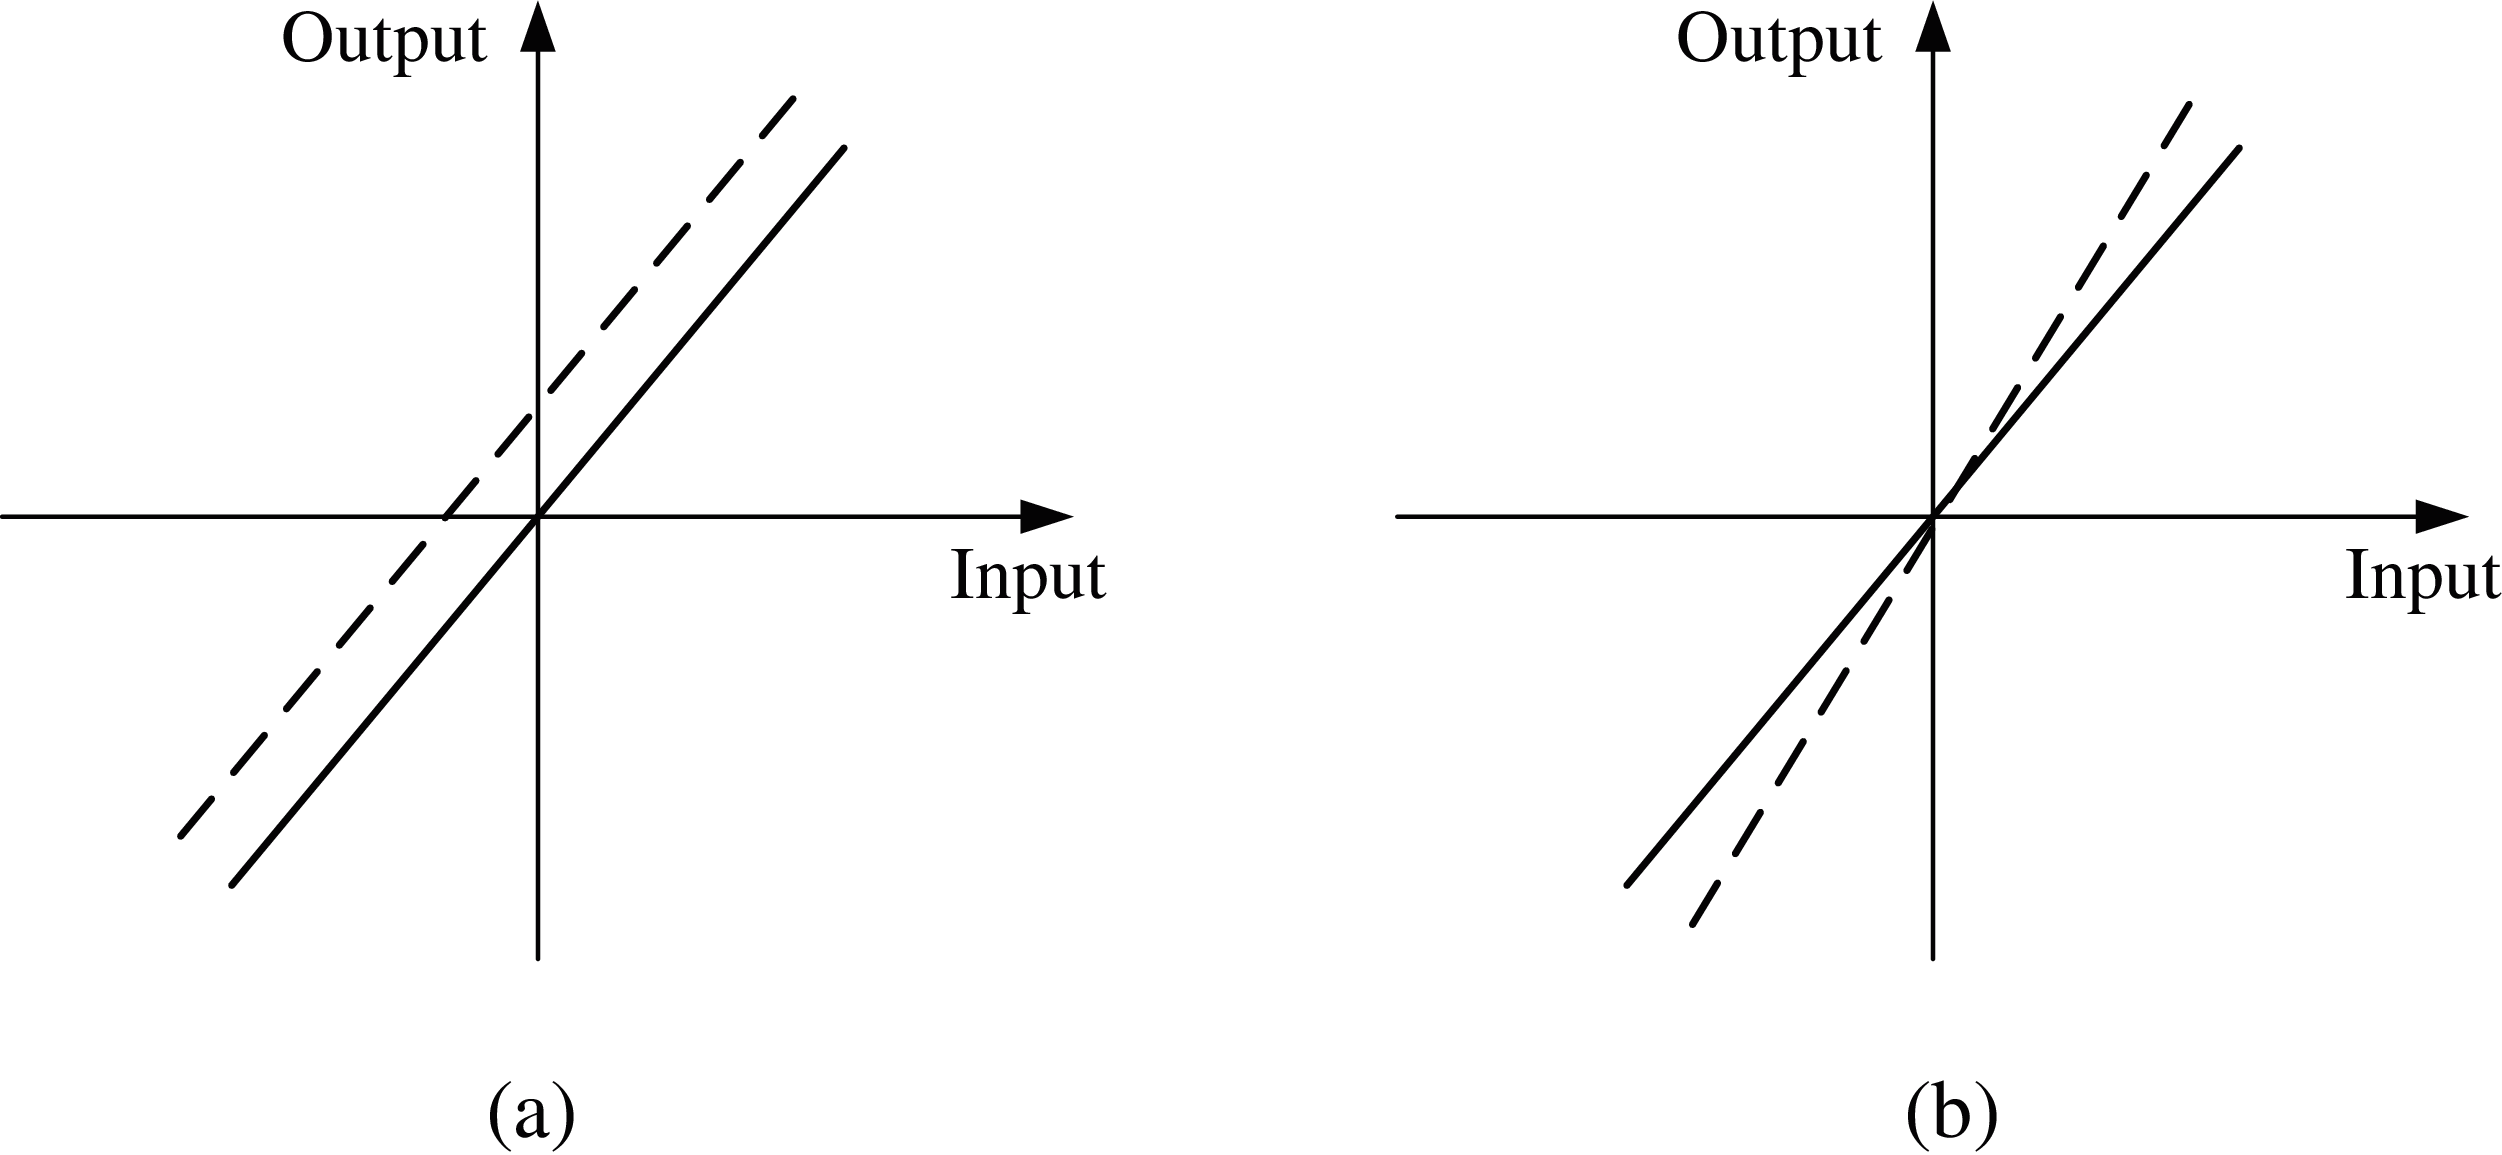
Figure 1: Graphic representation of bias offset and scaling factor. (a) Bias offset, (b) Scaling factor
Cross-coupling errors are generally caused by misalignments between the axes of sensor triad, which are supposed to be placed orthogonal to each other and in alignment with the sensor orthogonal case frame [26–28]. This phenomenon is visually explained in Fig. 2. The factual axes of IMU are represented by using non-orthogonal frame [XSr, YSr, ZSr], while the ideal orthogonal coordinate frame is O-XSrYSrZSr. Where, both X axes are coincident. Thus, the small angular errors φyx, φzx, and φzyhave to be estimated so that the nonorthogonal tri-axial measurements can be correctly projected to the orthogonal output readings with respect to the sensor frame.
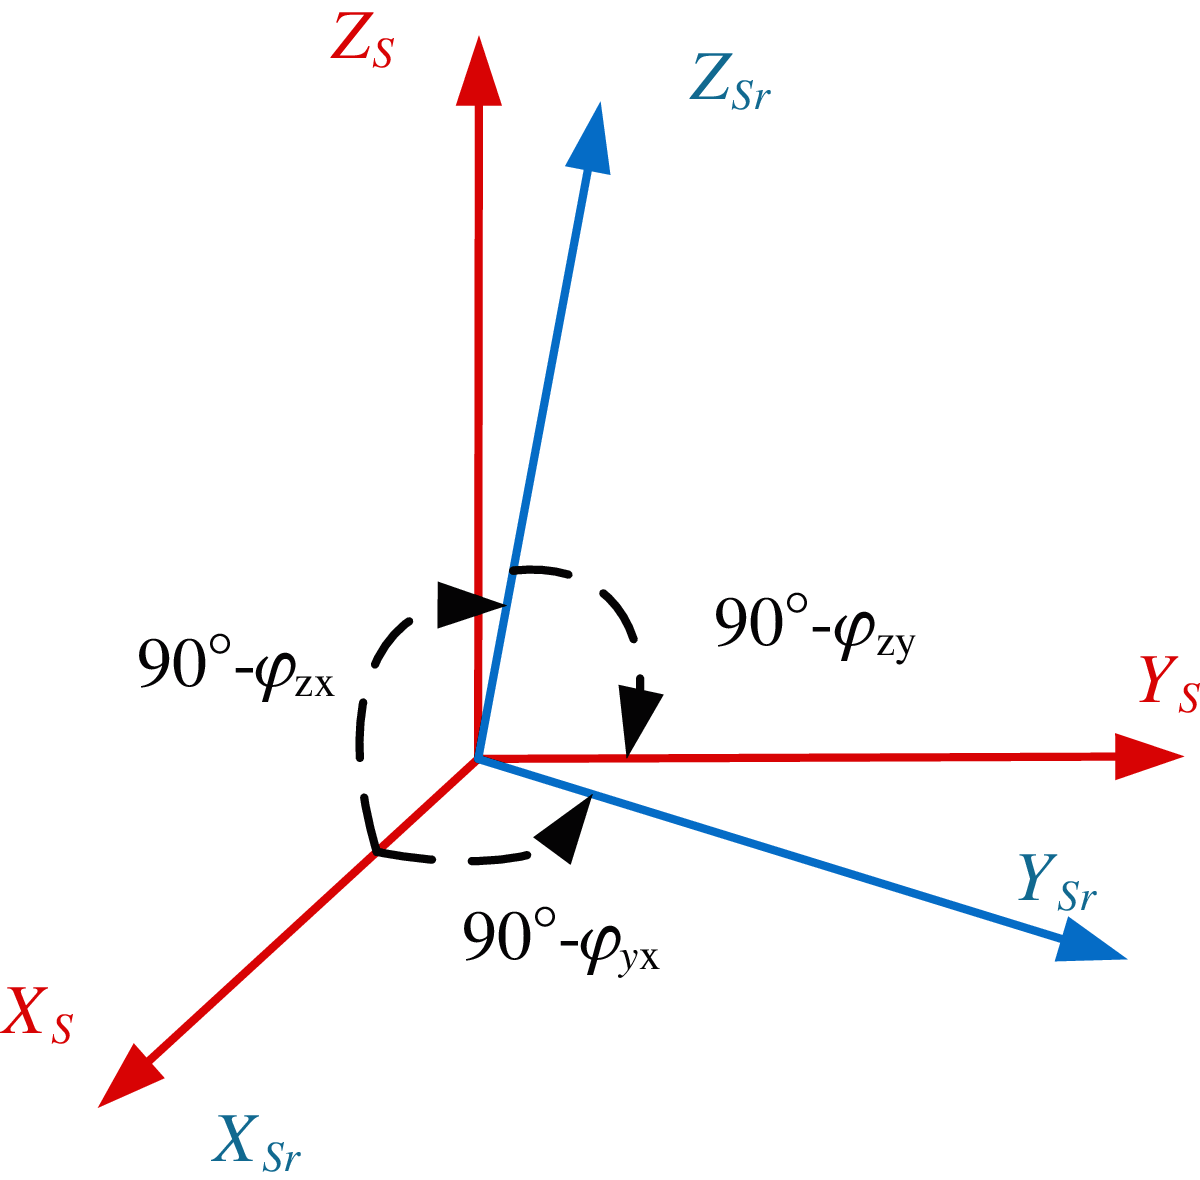
Figure 2: Non-orthogonality coordinates
The potential errors could be collectively represented by a mathematical model for calibration. In this article, the error model has been established as the gyroscope error model and acceleration error model. MEMS accelerometer errors mainly include bias, scale factor error and nonorthogonal installation error. The established MEMS accelerometer error model in terms of those factors is shown in Eq. (1).
ft b = [ftx b fty b ftz b]T are the output of the accelerometer;
fl b = [flx b fly b flz b]T are the input of the accelerometer;
Kija(i, j = x, j, z, i≠j) are the installation errors of the accelerometer;
Si a(i = x, y , z) are the scale factors;
bib(i = x, y , z) are the accelerometers’ bias.
MEMS gyroscope errors are mainly manifested as bias or drift, scale factor error, nonorthogonal installation error, and the acceleration proportional error. Because the accelerometer proportional errors have little effect on the output of the MEMS gyroscope within the test range, they can be ignored. For the relevant coefficients, only rate calibration is performed. Simplified MEMS gyroscope error model is available in Eq. (2).
ωtb = [ωtxb ωtyb ωtzb]Tare the output angular rates of the gyroscopes;
ωlb =[ωlxb ωlyb ωlzb]T are the input of the gyroscopes;
Ki g(i, j = x, j, z, i≠ j) are the installation errors of the gyroscopes;
Si g(i = x, y, z) are the scale factors;
bi g(i = x, y, z) are the gyros’ bias.
3 Automatic Calibration System Design
The proposed automatic batch calibration system is composed of a master controller and multiple data acquisition front-ends.
In consideration of the various communication modes in the proposed system, the RS485 is adopted for the communication between the master control unit and the turntable thanks to its multicast ability, good sensitivity of transceiver and common-mode anti-interference. USB transmission has large capacity and fast rate, so that USB HUB is used to transmit data between the master controller and batch calibration front-ends. For the data acquisition, it is open for optional communication modes (RS422/RS232/TTL) to collect the output data of IMU. The overall framework of the system is shown in Fig. 3.
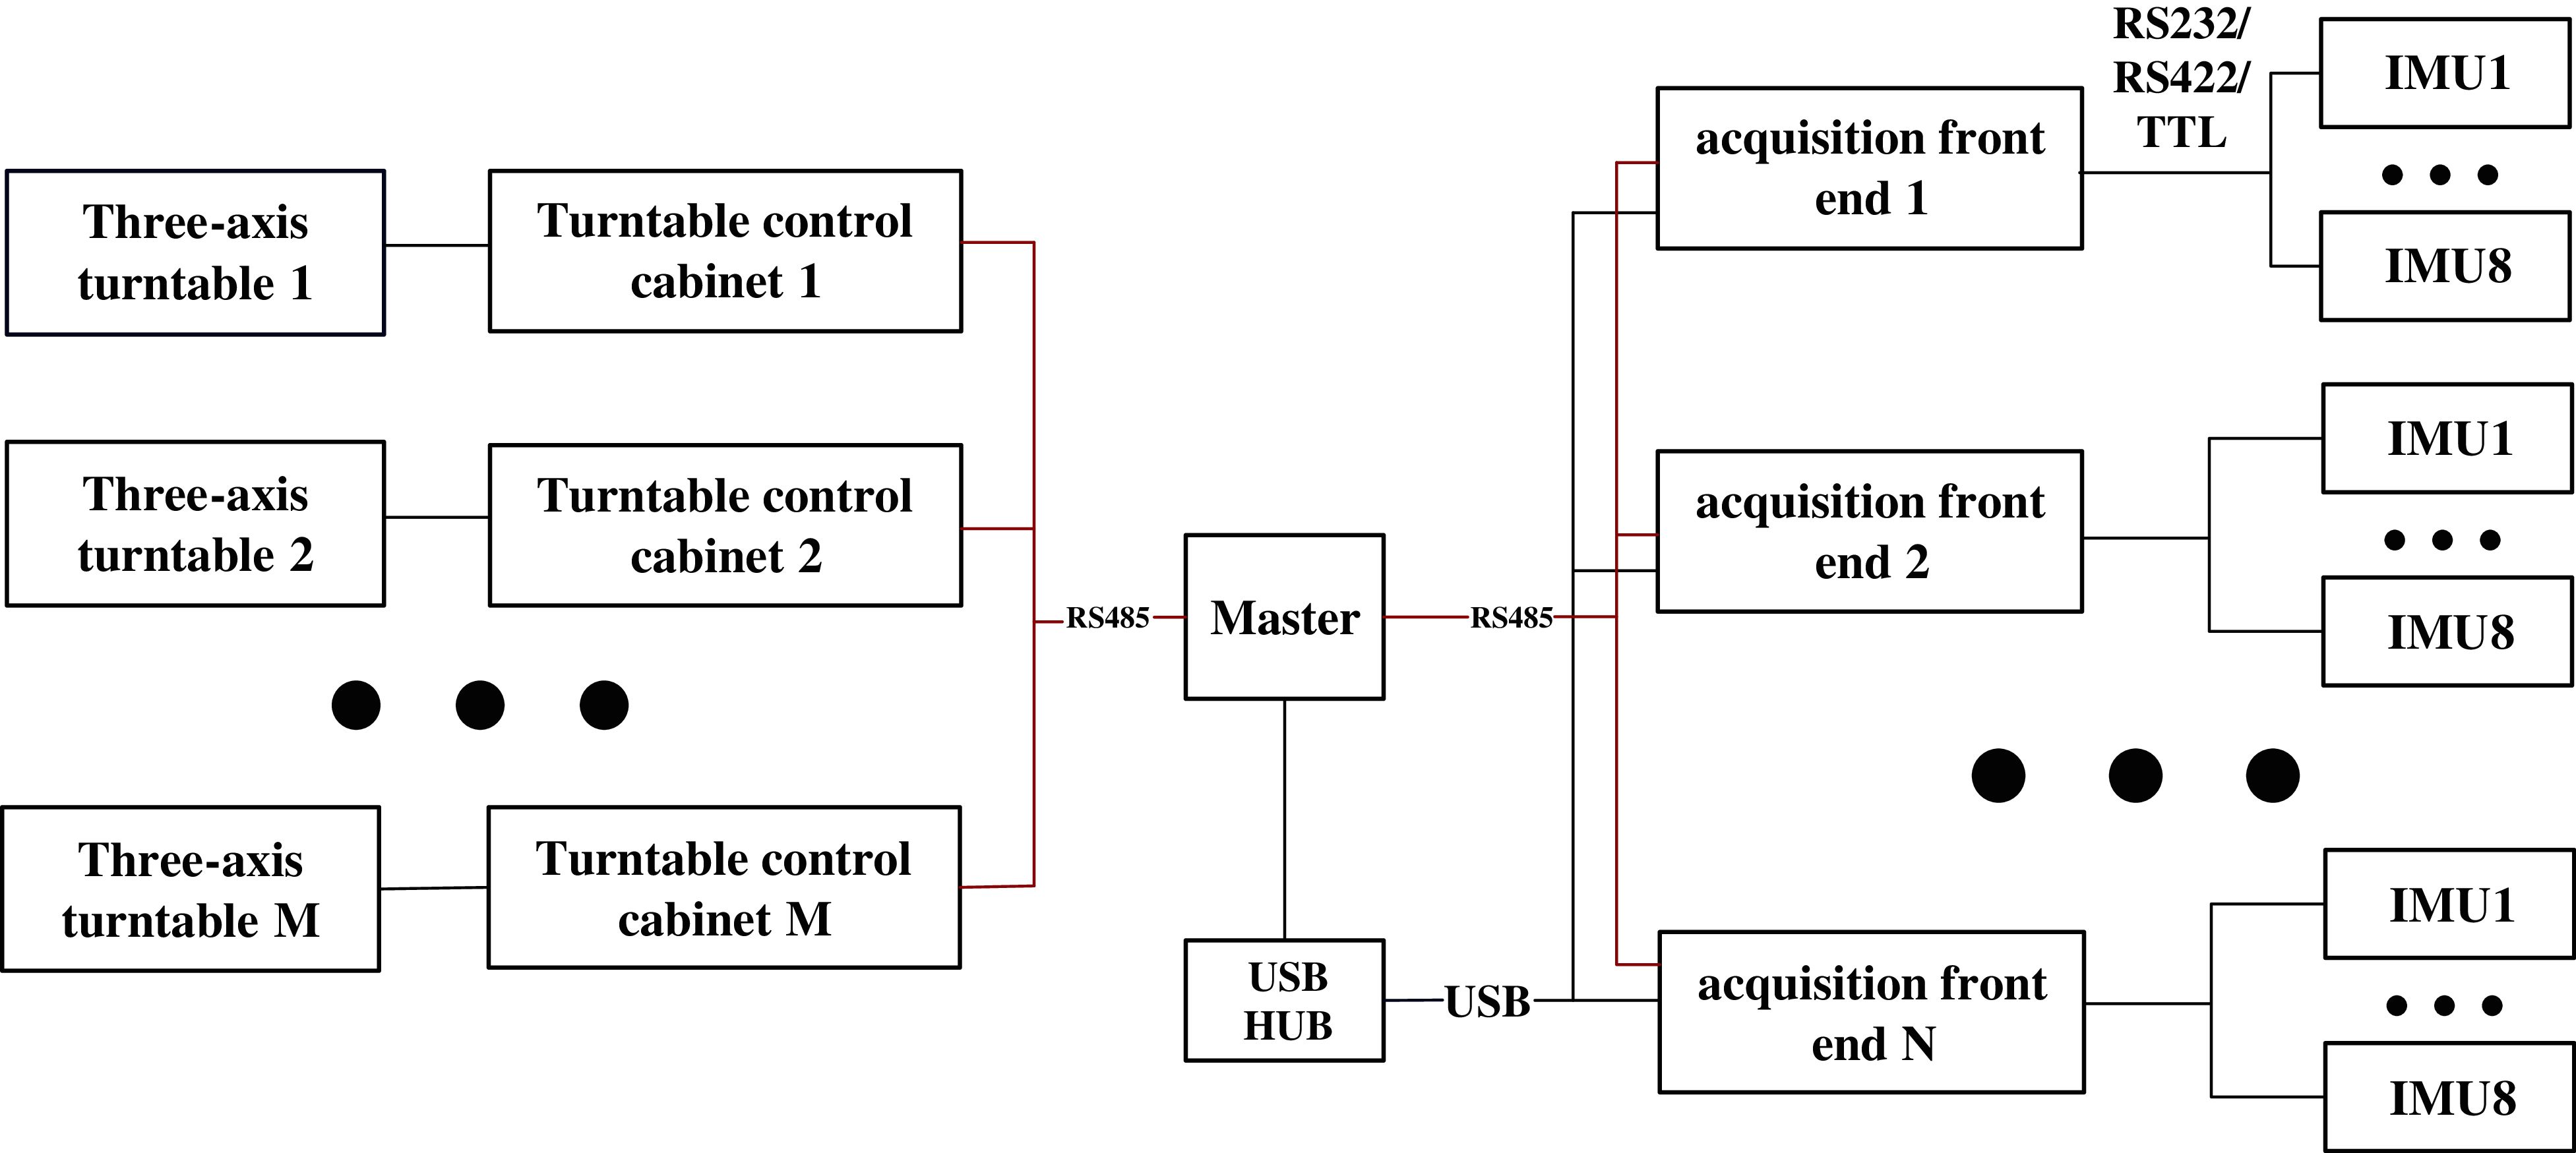
Figure 3: The overall framework of the automatic batch calibration system
On the one hand, the master computer of the automatic batch calibration system could remotely control multiple turntables through the RS485 bus (RS232 in the case of a single turntable) and monitor their status at the same time. On the other hand, when the three-axis turntable reaches the speeds or positions specified in the calibration process, the master computer controls the system through the RS485 bus to perform the batch data collection and storage of the multiple IMUs.
The automatic master control unit is loaded with a set of automatic batch calibration software with LabView. The program flowchart of the software is shown in Fig. 4:
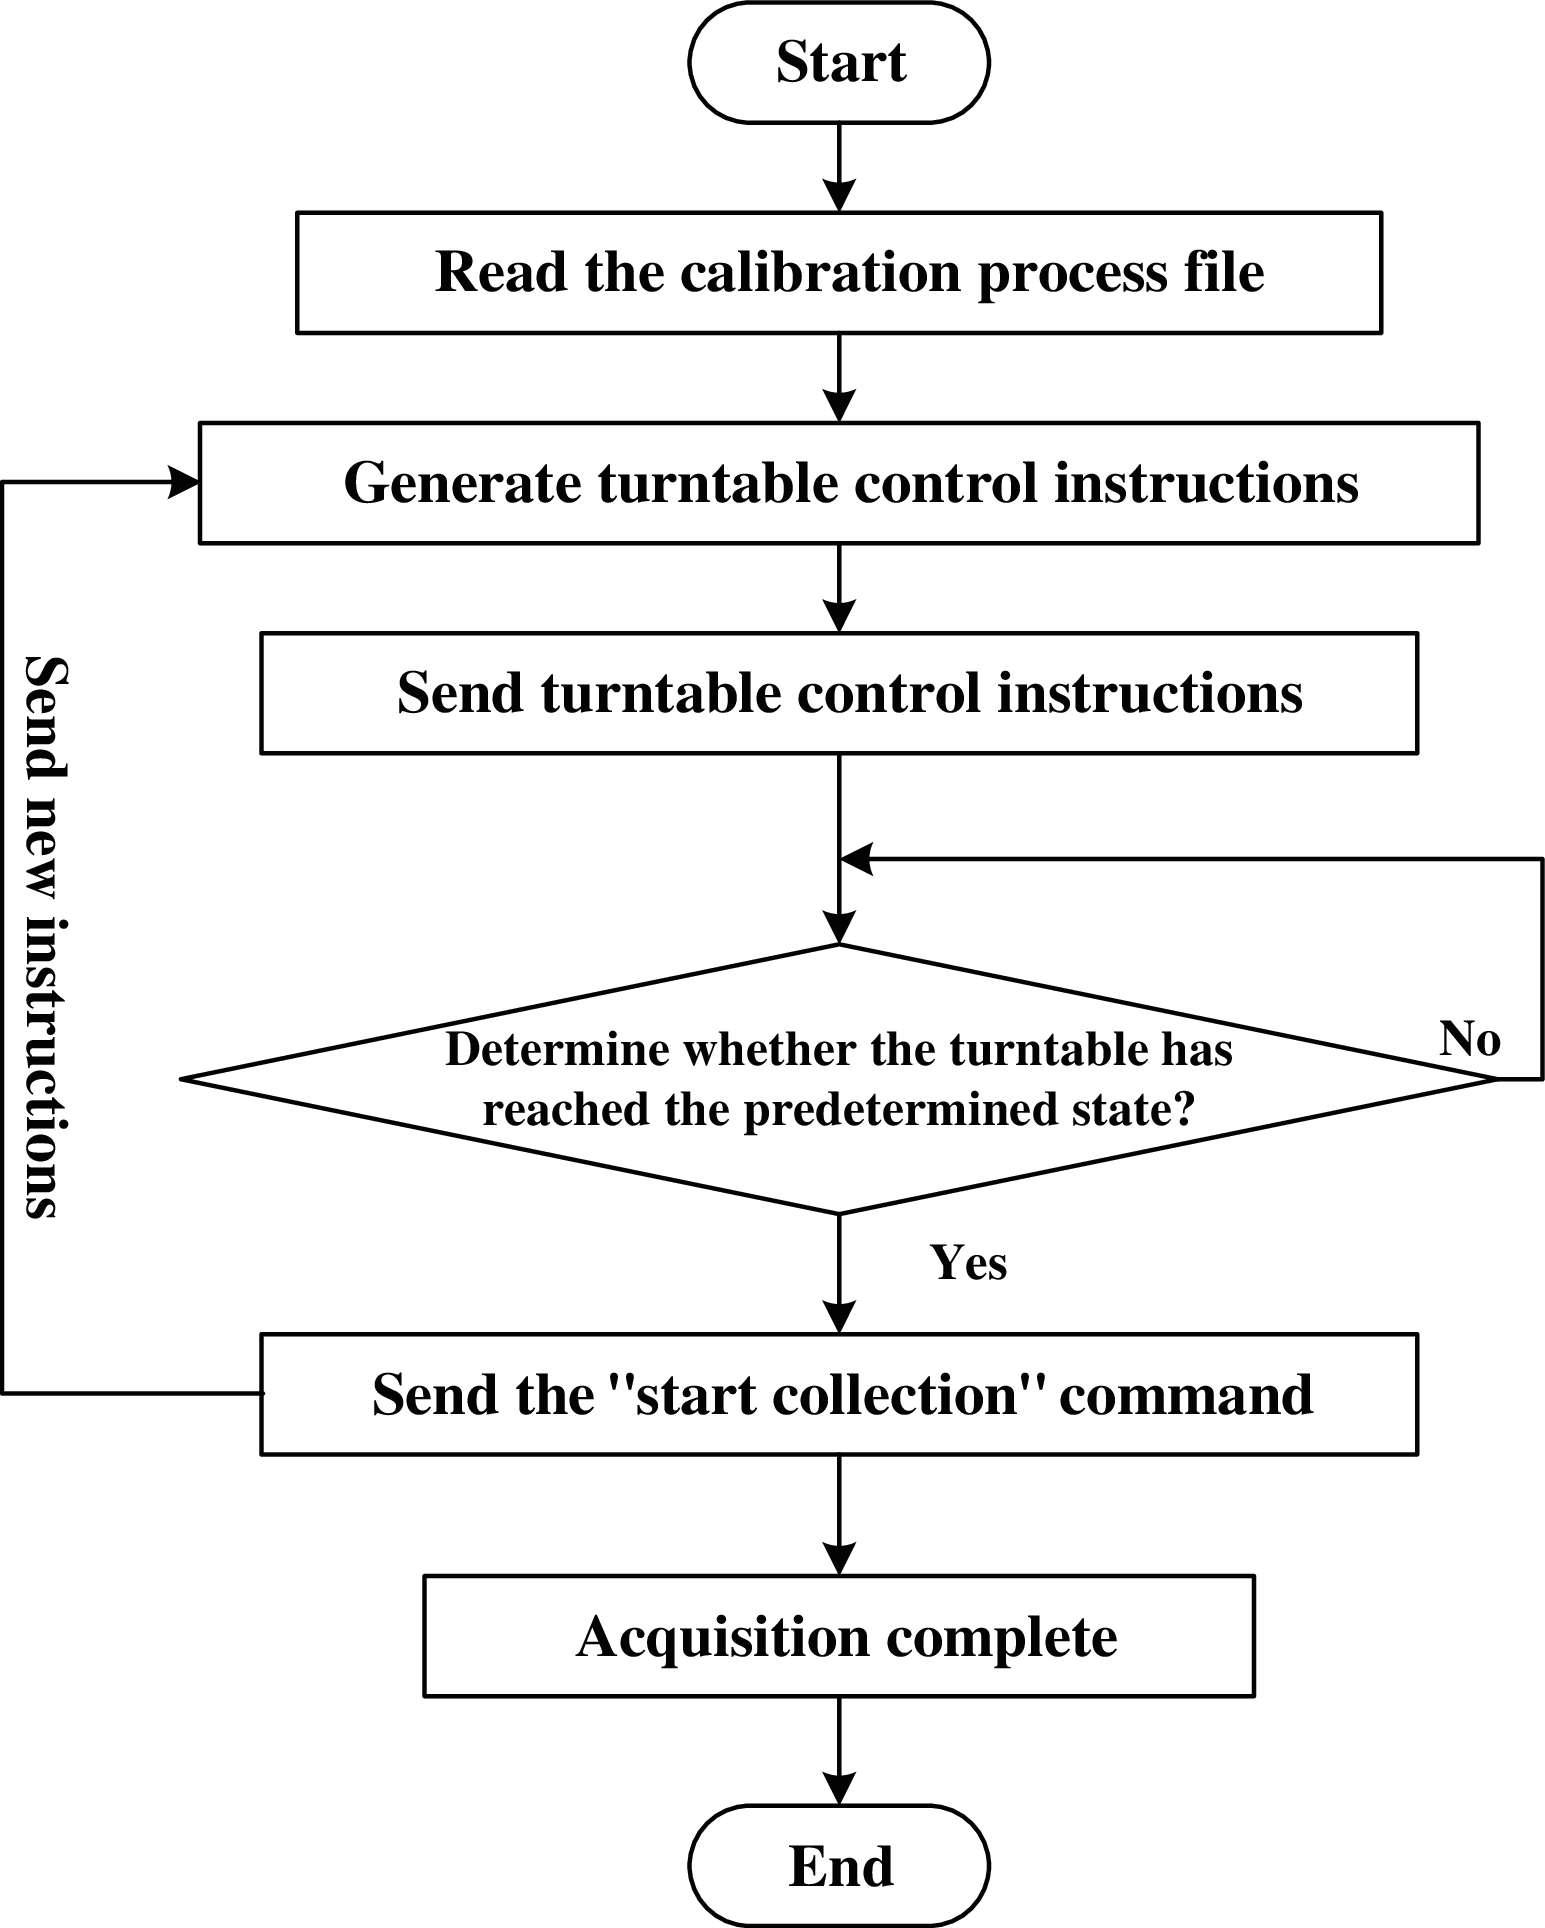
Figure 4: Program flow chart of automatic batch calibration control software
As it is seen, the software has the following functions:
(1) The friendly human-computer interface, which is capable of designing calibration procedures, saving and reading calibration files.
(2) The remote control function. Based on the control instruction set of the turntable, it can automatically generate the control instructions of the turntable according to the designed calibration procedures;
(3) Communication function. The master control unit sends turntable commands through a serial port (named as COM1) to implement the remotely control of the turntable, including angular rate control and angle control, and real-timely read information, namely, the angular speed and angle of each shaft of the turntable through COM1.
(4) Data acquisition and storage. When it detected that the angular velocity and angle information of the turntable meets the design requirements, the command data acquisition will be broadcast to the front-end of the batch calibration collection through another serial port (named as COM2);
(5) Monitoring function. Monitoring COM2, if the “data acquisition is completed” the feedback of the front-ends are detected, it would automatically send the turntable updated control commands through the COM1 port. In-line equations/expressions are embedded into the paragraphs of the text. For example, E = mc2. In-line equations or expressions should not be numbered and should use the same/similar font and size as the main text.
3.2 Automatic Construction of Calibration Model
There is an elaborate software of the parameter construction loaded in the master control unit. The implementation process is shown in Fig. 5.
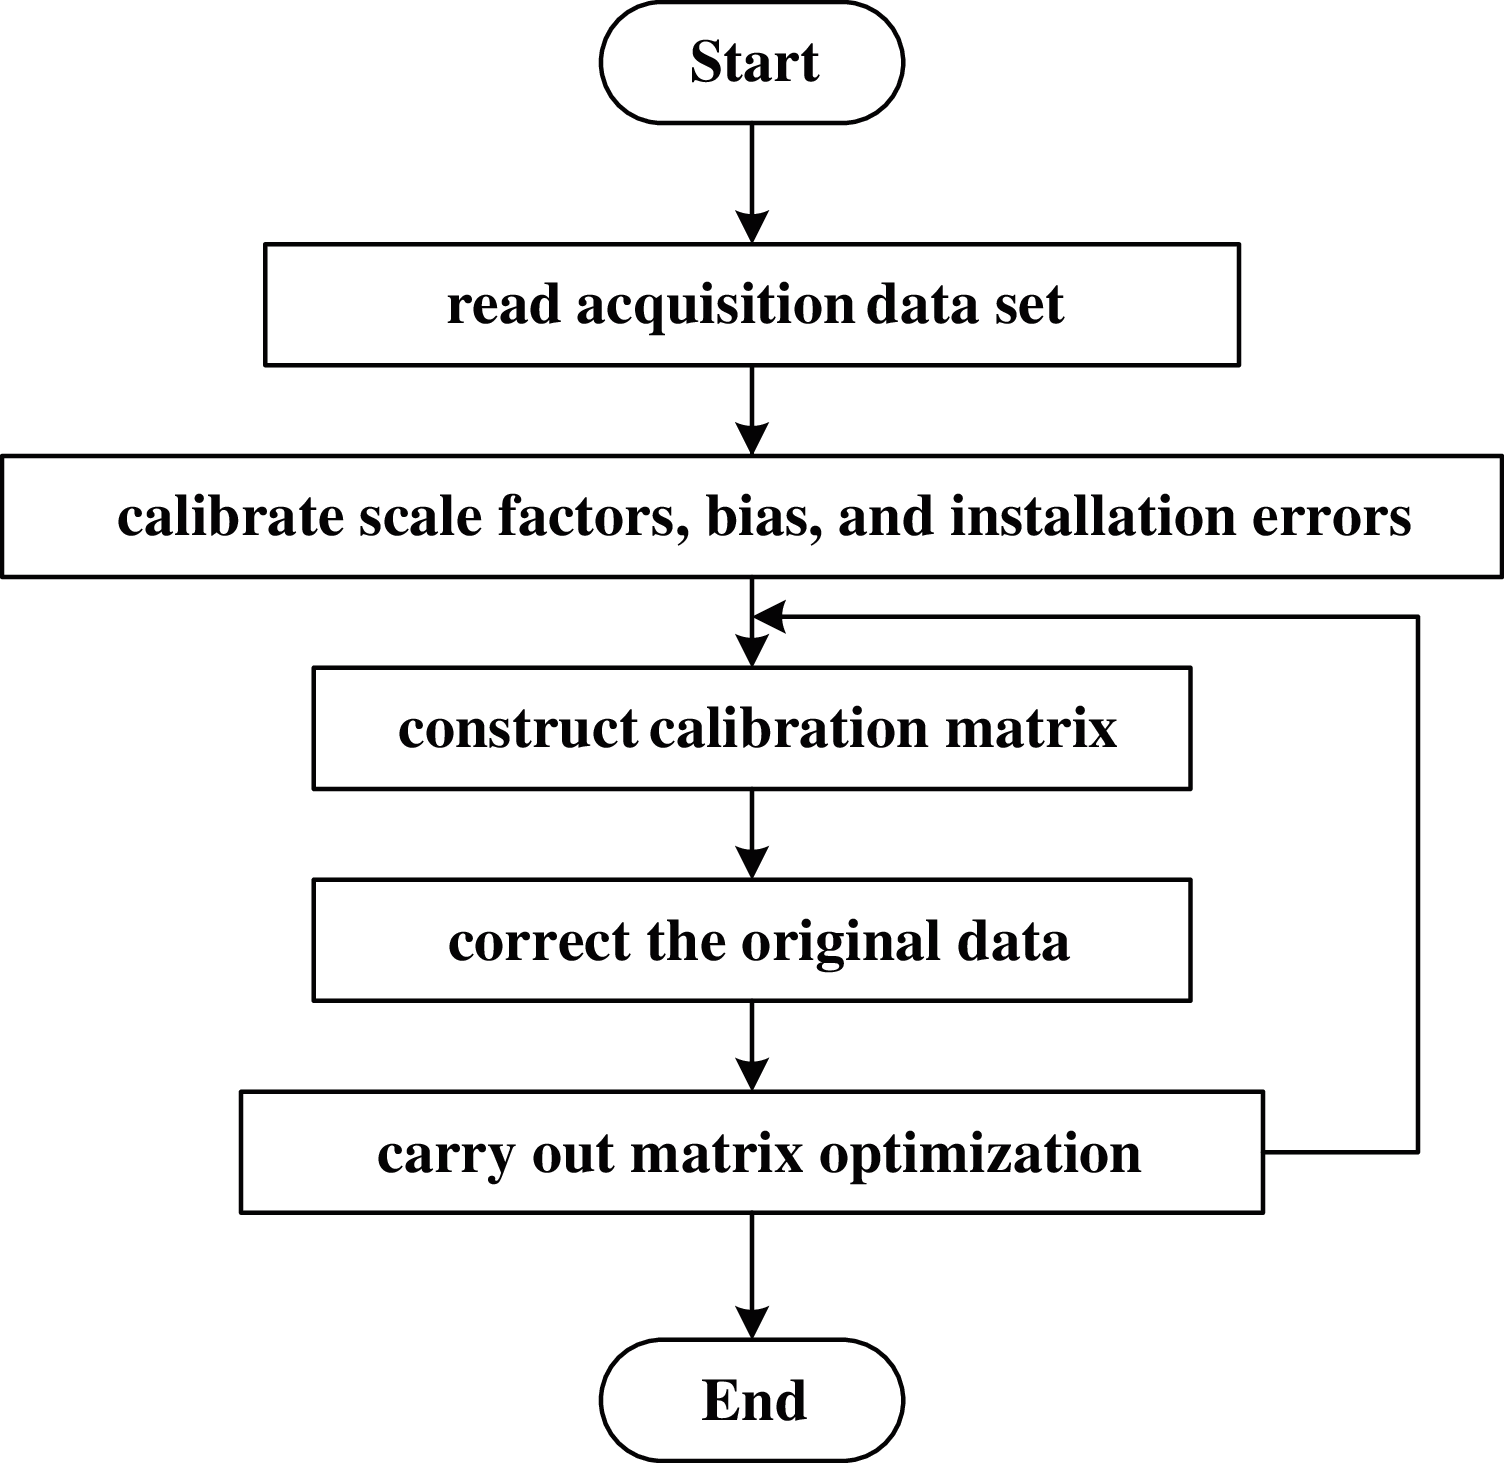
Figure 5: The flowchart of automatic construction of calibration model
As shown in Fig. 5, the automatic modeling software has the following functions:
(1) After the calibration data acquisition is completed, the data set stored in the front-end units would be sent back through USB;
(2) By using the obtained data set, the scale factor errors, bias and installation errors were calibrated according to the Eqs. (1) and (2), as well as the standard rate experiments and position experiments, so that the calibration matrix was automatically established;
(3) The output of the MEMS IMU would be corrected by the calibration matrix, and the corrected results are transformed through FFT to analyze the IMU output in the frequency domain;
(4) The optimization of the calibration matrix is performed according to the frequency domain information of the calibrated data.
The acquisition unit adopts a compact embedded solution, which can be assembled into a turntable along with the IMU. There are several functional steps of the data acquisition unit, given below:
Step 1: Each set of IMUs is enabled with a required power supply;
Step 2: The sensor data of the IMU can be received through TTL/RS232/RS422 with a data analysis function;
Step 3: As many as eight sets of IMUs can be controlled to sample data at the same time, so as to realize the simultaneous data acquisition from multiple IMUs;
Step 4: The integrated EMMC memory capable of real-time storage of IMU data has been adopted; and the stored IMU data files are numbered correspondingly;
Step 5: the front-ends communicate with the master computer through RS485 to control the synchronization of IMU data acquisition and the state of the turntable's actions;
Step 6: The data files in the EMMC memory are read via USB.
In order to test the proposed method, a serial of carefully designed experiments were carried out to illustrate the operation process and demonstrate the effectiveness of the automatic batch calibration system. The multi-position experiments were designed for the calibration of the gyros’ parameters; the rate experiments were designed for the calibration of the accelerometers’ parameters; and a sway experiment was designed for the comprehensive test and re-correcting the installation error factor; after all, a validation test was further implemented to demonstrate the effectiveness of the calibration.
This design experiment takes four MEMS IMUs for testing, and each set of the IMU is composed of a three-axis accelerometers and three-axis gyroscopes. The gyroscope model used is ADXRS450 and the accelerometer model is MS9010. In the experiment, the automatic batch calibration control unit controls the three-axis turntable and collects the data of IMUs at the same time. The IMU automatic calibration experiments mainly include three parts, namely, the rate experiments, position experiments and swing experiment. The installation of the IMU system is shown in Fig. 6.
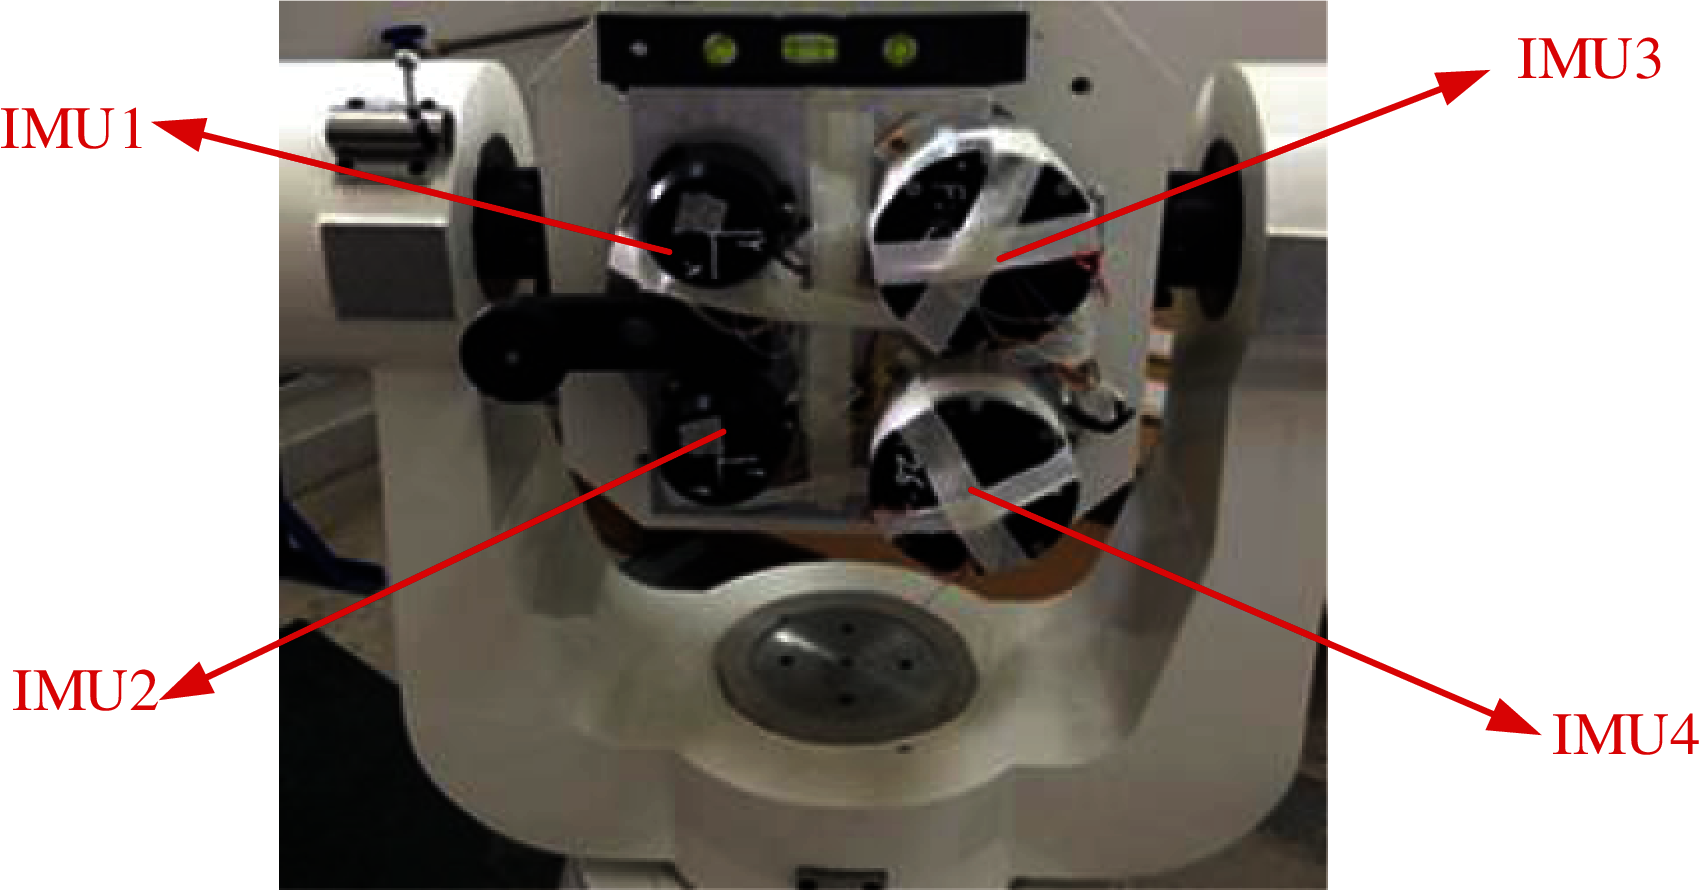
Figure 6: Installation diagram of IMU calibration experiment system Note: IMU1 (Up left), IMU2 (Down left), IMU3 (Up right), IMU4 (down right)
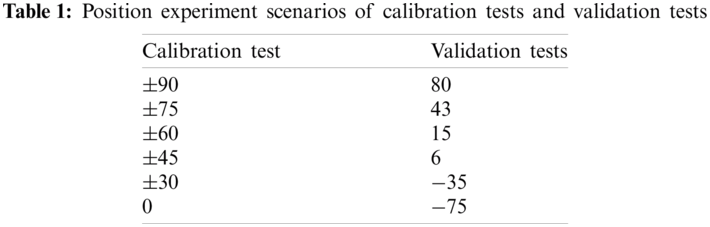
Static multi-position experiments: after the installation of the IMU on the three-axis turntable it is controlled to turn to the initial position and enable the position experiments automatically. In which, the initial position is defined as the direction of the X-axis accelerometer pointing to the east. The series of the position experiments was following the settlement according to Tab. 1. And the above operation process would be repeated for the other two axes (Y-axis and Z-axis) to complete the whole position experiments.
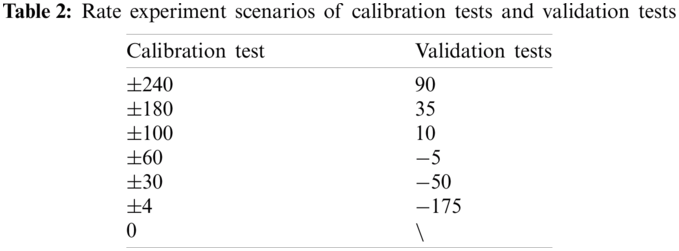
After the static multi-position experiments, the calibration master computer controlled the turntables to go back to the initial position for preparation for the rate experiments. In which, the potential calibration axis of the gyroscopes was settled vertically to a point upwards, and the turntable turned at certain rates according to Tab. 2. And the above operation process would be repeated for the other two axes (Y-axis and Z-axis) to complete the whole rate experiments.
After position experiment and the rate experiment, the sway experiment was carried out. The turntable was set to sway with a frequency of 1 Hz and an amplitude of 5°on all the three axes, and the output of the gyroscopes and accelerometers of the IMU were stored.
With the IMU outputs of the static multi-position and rate experiments, the system automatically established the calibration model of each IMU and writes the obtained parameter calibration matrix into the IMU controller to perform a correction of the IMU. Then a validation test was designed to verify the effectiveness of the calibration experiments, whose details were given in steps below.
Step 1: Install the IMU on the turntable with the same requirements of the static multi-position experiment and rate experiment;
Step 2: As soon as the turntable got back to the initial position, and put each axis of the IMU upwards in turn, and set the rotation speed of the external axis according to Tab. 2, and record the gyro's output in turn;
Step3: Similarly, set the static multi-position according to Tab. 1, and record the accelerometer's output of the IMU in turn.
Step 4: Afterward, manipulating the turntable to perform a sinusoidal sway experiment with a frequency of 1 Hz and an amplitude of 3°, and recording the output within the IMUs.
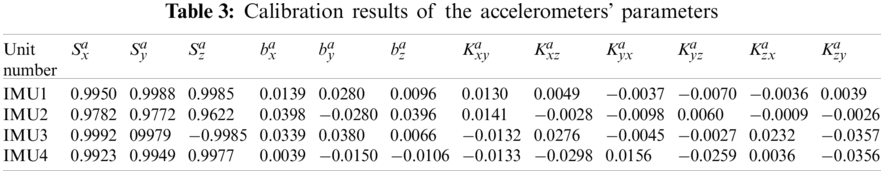
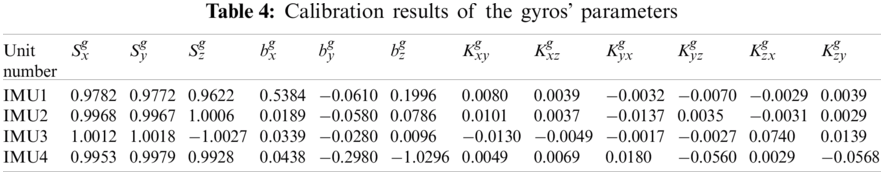
Using the data of the position experiment and the rate experiment, the calibration parameters of the IMU were obtained, as shown in Tabs. 3 and 4.
Taking IMU1 for illustration, the error analysis of the gyro outputs has been evaluated after calibration. According to the results of multiple groups of calibration tests, the repeatability of the gyroscope is 0.05°/s. Considering the calibration error and the system noise, 0.1°/s is set as the error threshold of the calibration results. That is to say, if the average error of the axial gyro output is less than 0.1°/s, the calibration is generally considered effective. Under different rotation speeds, the average value of the gyro's output is shown in Tab. 5, and the errors of the three axes are shown in Fig. 7.
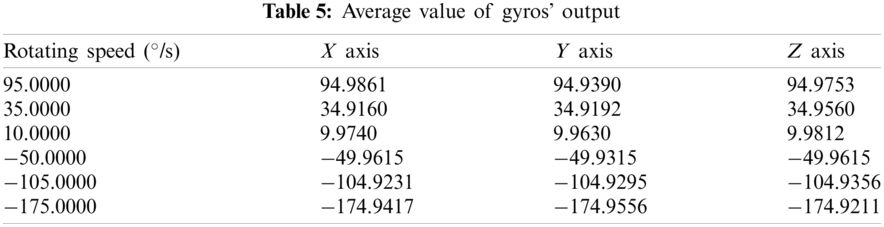
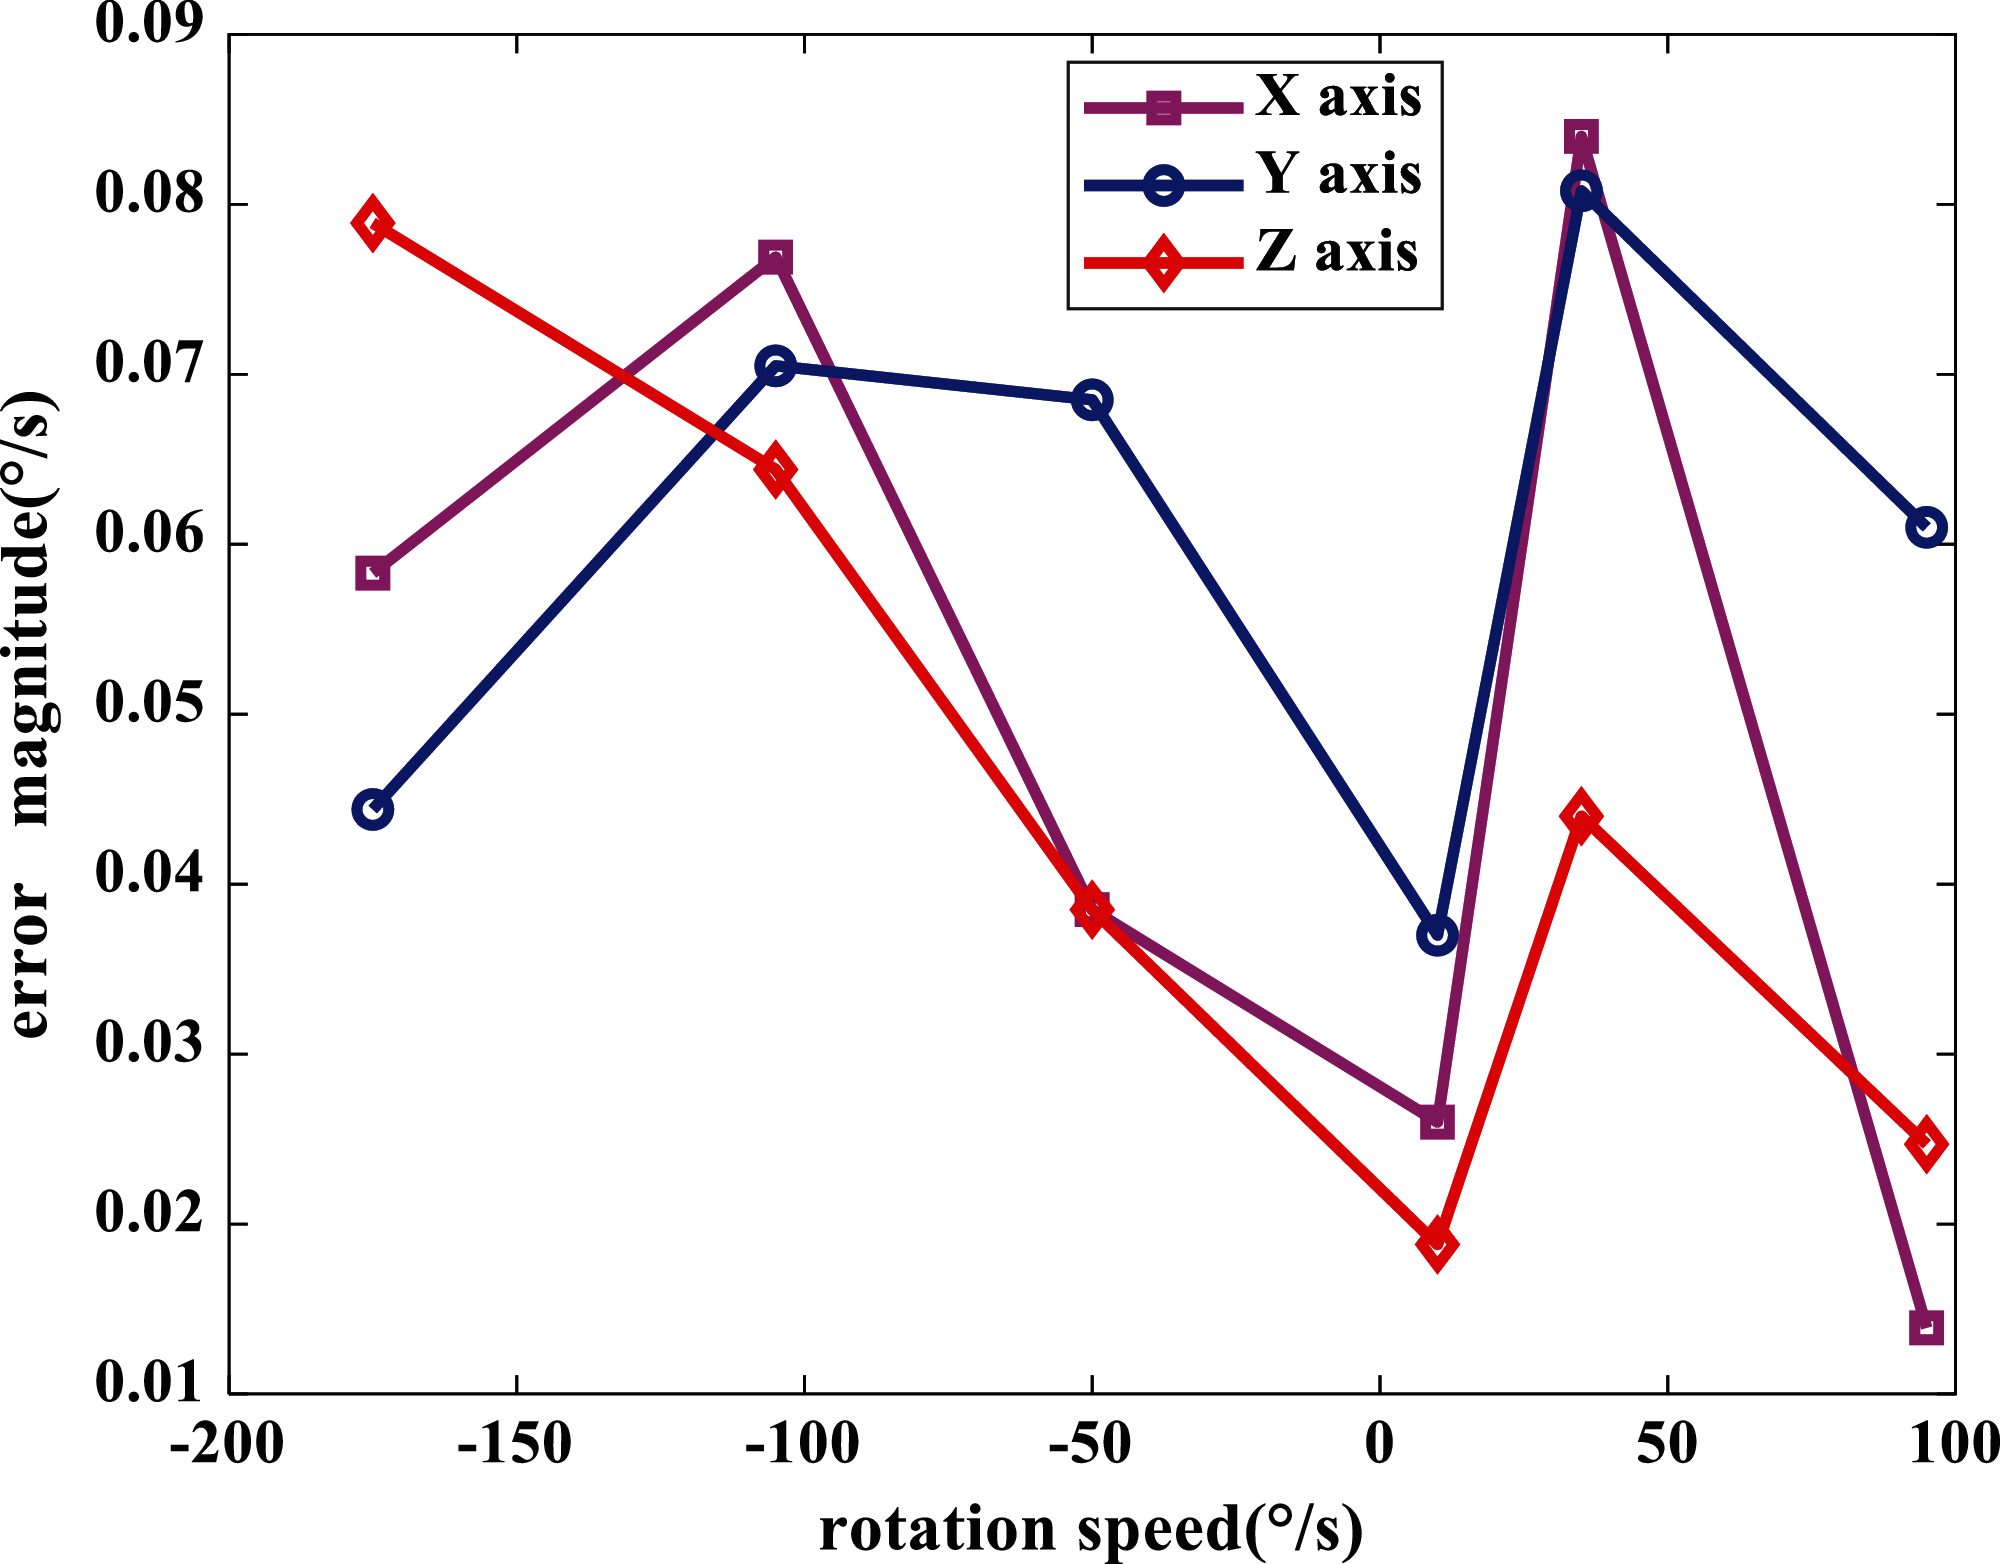
Figure 7: Error evaluation of gyros with different rotation speed
The results of the rate experiment were analyzed as shown in Fig. 7, within different testing rotation speed, none of the gyros’ errors exceeded 0.1°/s, the maximum error of X-axis is 0.0840°/s, in the case of Y-axis and Z-axis are 0.0808°/s and 0.0789°/s, It shows the accuracy of the calibration results and the reliability of the automatic calibration system.
Additionally taking IMU1 as an example to illustrate the function of the sway experiments, the Fourier transform was applied to the tri-axial gyro outputs before and after calibration, to analyze the data characteristics in the frequency domain. Fig. 8 shows the amplitude-frequency curves of tri-axial gyros’ outputs when rotating around the X-axis. Fig. 8a shows the amplitude-frequency curves before calibration, and Fig. 8b shows those after calibration.
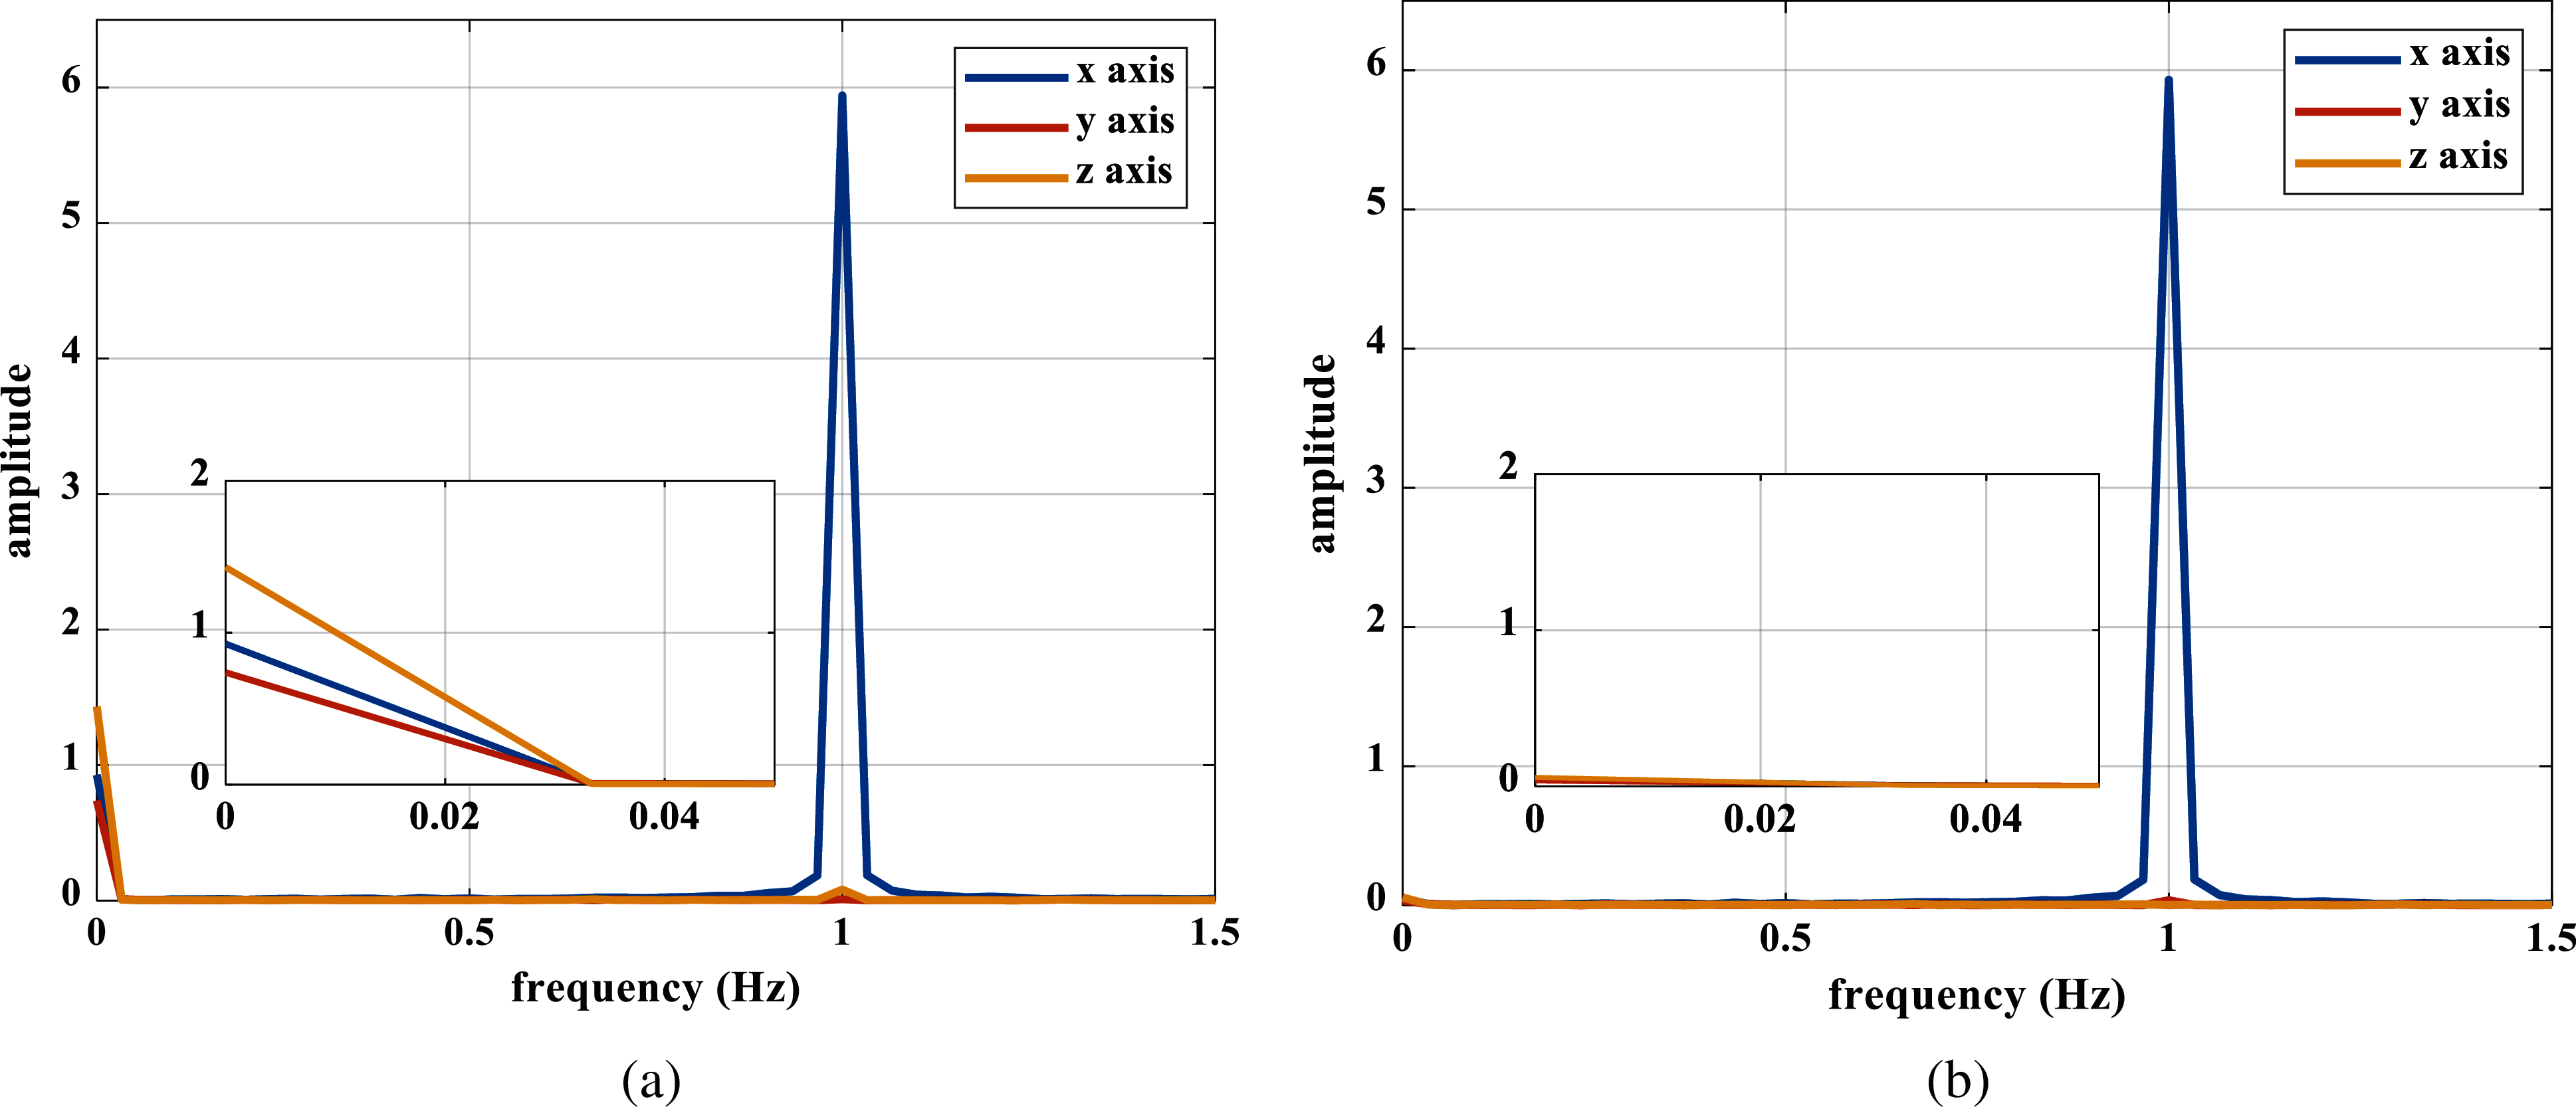
Figure 8: (a): The amplitude-frequency response of the tri-axis gyros when the turntable rotates around X-axis before calibration, (b) The amplitude-frequency response of the tri-axis gyros when the turntable rotating around X-axis before calibration, and after calibration
It can be seen from Fig. 8 that there are interferences in low-frequency predominant frequency in both Y-axis and Z-axis outputs before calibration; while the interferences are greatly decreased after calibration. The improvement indicates that the optimization of the calibration matrix could further correct the installation errors.
4.3 Comparison of Test Duration
In this section, the durations of calibration in the manual way and with the proposed automatic way are compared. In the case of manual calibration, it takes 55 min for one IMU to perform a single axial static multi-position experiment; 50 min for a single axial rate experiment; 10 min to complete a single axial sway experiment, with the time consumption of the manual operation, about 45 min for one axis, which makes a total experiment time of 160 min for single axial of one IMU. With our designed automatic batch calibration scheme, it not only saves the manual operation time, but also could simultaneously calibrate the number of IMUs in all experimental scenarios that greatly shortens the calibration duration and reduces the possibility of manual wrong operation.
In order to solve the problems of low efficiency, time-consuming, misoperation of the traditional manual calibration of MEMS IMU system, an automatic batch calibration system was designed so that the three-axis turntable and data acquisition front-ends are controlled by the calibration master computer. And it monitors the status of the three-axis turntable in real time. If either three-axis turntable or data acquisition is abnormal, the experiment would be automatically terminated. Then, it is tested to design experiments. The tests results show that the bias, scale factor, installation error could be well calibrated to correct the IMU's output, which verifies the reliability and superiority of the proposed system. It is worth to mention that, although only four IMUs have been calibrated in our illustrative experiments, it actually could calibrate more sets of IMUs with slight modification of the control unit and the front-ends, which could provide a reference for industrial batch calibration of IMUs in the future.
Funding Statement: This work was supported by the National Natural Science Foundation of China (No. 61803203).
Conflicts of Interest: The authors declare that they have no conflicts of interest to report regarding the present study.
1. X. D. Wu, “Application and development of MEMS devices in the aerospace field,” Micro-nano Electronics Technology, vol. 49, no. 8, pp. 545–546, 2012. [Google Scholar]
2. Z. Shang, Y. Zhu and X. C. Ma, “A calibration system and method for mems-mimu,” CN 104697549 A[P]. 2015. [Google Scholar]
3. S. H. Wang, “Current status and application of MEMS sensors,” Micro-nanoelectronics Technology, vol. 48, no. 8, pp. 516–522, 2011. [Google Scholar]
4. X. G. Li, “Research on two-axis stable platform based on MEMS inertial device,” M.S. dissertation, North University of China, China, 2014. [Google Scholar]
5. K. Wang, C. M. Dong and S. Q. Ren, “Comparison between the equal-force method and the equal-angle position method to test the accelerometer error model coefficients,” Measurement Technology, vol. 35, no. S1, pp. 67–69, 2015. [Google Scholar]
6. Q. Sun and M. Yu, “Research and realization of phase vibration calibration system by comparison method,” Acta Metrology, vol. 26, no. 2, pp. 142–145, 2005. [Google Scholar]
7. W. Yan, J. Fan, X. Peng, Z. Jing and Z. Zhang, “Shock calibration of the high-g triaxial accelerometer,” in Instrumentation & Measurement Technology Conf., Victoria, BC, Canada, 2008. [Google Scholar]
8. M. b. Yu and T. J. Cai, “A method of rotating accelerometer gravity gradiometer for centrifugal gradient detection,” Journal of Physics: Conference Series, vol. 1016, no. 1, pp. 1742–6596, 2018. [Google Scholar]
9. W. P. Hou and M. Sun, “Design of miniaturized MEMS gyroscope calibration platform,” Special Equipment for the Electronics Industry, vol. 44, no. 2, pp. 4–6, 2015. [Google Scholar]
10. G. Artese and A. Trecroci, “Calibration of a low cost MEMS INS sensor for an integrated navigation system,” in the 21st ISPRS, vol. xxxIV-5/W10, pp. 877–882, 2008. [Google Scholar]
11. D. B. Ahmed, E. M. Diaz and J. J. G. Domínguez, “Automatic calibration of the step length model of a pocket INS by means of a foot inertial sensor,” Sensors, vol. 20, no 7, 2020. [Google Scholar]
12. J. H. Han, X. Z. Huang, Y. C. Gu, G. H. Che, X. T. Feng et al., “Design and realization of accelerometer automatic test system,” Journal of Chinese Inertial Technology, vol. 10, no 2, pp. 58–63, 2002. [Google Scholar]
13. Z. H. Long, X. T. Xing, Z. J. He and C. H. He, “Measurement uncertainty of linear accelerometer model equation coefficients,” Measurement Technology, vol. 23, no. 3, pp. 30–31, 2003. [Google Scholar]
14. Y. Xue, “Research on the technology of accelerometer batch test platform,” M.S. dissertation, North University of China, China, 2014. [Google Scholar]
15. C. Xing, E. Zhang, B. Zhou and Y. Deng, “Database-based IMU automatic calibration system design machine,” Measurement and Control Technology, vol. 33, no. 6, pp. 154–156, 2014. [Google Scholar]
16. Y. Chen, J. H. Yang, C. M. Yang and P. X. Yang, “An automatic test system for turntable based on MFC,” Measurement and Control Technology, vol. 34, no. 5, pp. 104–106, 2015. [Google Scholar]
17. J. Yin, “Research on automatic batch test and calibration system for MEMS inertial sensors,” M.S. dissertation, Nanjing University of Science and Technology, Nanjing, Jiangsu, China, 2017. [Google Scholar]
18. J. Juan, M. Christine, S. Kabban and J. Raquet, “A regression-based methodology to improve estimation of inertial sensor errors using allan variance data,” Navigation, vol. 66, no. 1, pp. 251–263, 2019. [Google Scholar]
19. Qasim and S. Asad, “Formal modelling of real-time self-adaptive multi-agent systems,” Intelligent Automation & Soft Computing, vol. 25, no. 1, pp. 49–63, 2019. [Google Scholar]
20. Li and D. Xiong, “Research on the dynamic compensation system of the cathode electrode wear for a short electric arc machine tool,” Intelligent Automation & Soft Computing, vol. 26, no. 5, pp. 1007–1021, 2020. [Google Scholar]
21. J. Lv, A. A. Ravankar, Y. Kobayashi and T. Emaru, “A method of low-cost IMU calibration and alignment,” in 2016 IEEE/SICE Int. Symp. on System Integration (SIISapporo, Japan, 2016. [Google Scholar]
22. D. Tedaldi, A. Pretto and E. Menegatti, “A robust and easy to implement method for IMU calibration without external equipments,” in ICRA, Hongkong, China, pp. 3042–3049, 2014. [Google Scholar]
23. G. A. Aydemir and A. Saranl, “Characterization and calibration of MEMS inertial sensors for state and parameter estimation applications,” Measurement, vol. 45, no. 5, pp. 1210–1225, 2019. [Google Scholar]
24. Li, D. H. Shen, C. Dai, X. P. Zhu, X. H. Luo, J. et al., “Research on data fusion of adaptive weighted multi-source sensor,” Computers, Materials & Continua, vol. 61, no. 3, pp. 1217–1231, 2019. [Google Scholar]
25. D. Titterton and J. Weston, “Strapdown inertial navigation technology-2nd edition-[Book review],” IEEE Aerospace and Electronic Systems Magazine, vol. 20, no. 7, pp. 33–34, 2019. [Google Scholar]
26. A. Amirsadri, J. Kim, L. Petersson and J. Trumpf, “Practical considerations in precise calibration of a low-cost MEMS IMU for road-mapping applications,” in American Control Conf., Montreal, QC, Canada, 2012. [Google Scholar]
27. F. Xiao, W. Liu, Z. T. Li, L. Chen and R. C. Wang, “Noise-tolerant wireless sensor networks localization via multi-norms regularized matrix completion,” IEEE Transactions on Vehicular Technology, vol. 63, no. 3, pp. 2409–2419, 2018. [Google Scholar]
28. Z. T. Li, J. X. Xie, G. M. Zhu, X. Peng, Y. J. Choi et al., “Block-based projection matrix design for compressed sensing,” Chinese Journal of Electronics, vol. 25, no. 3, pp. 551–555, 2016. [Google Scholar]
 | This work is licensed under a Creative Commons Attribution 4.0 International License, which permits unrestricted use, distribution, and reproduction in any medium, provided the original work is properly cited. |