DOI:10.32604/cmc.2022.021884
| Computers, Materials & Continua DOI:10.32604/cmc.2022.021884 | |
| Article |
An Intelligent Fine-Tuned Forecasting Technique for Covid-19 Prediction Using Neuralprophet Model
1Information Technology Department, Seth Jai Parkash Mukand Lal Institute of Engineering and Technology, Radaur, Haryana, India
2Computer Science & Engineering Department, Seth Jai Parkash Mukand Lal Institute of Engineering and Technology, Radaur, Haryana, India
3Computer Engineering Department, National Institute of Technology, Kurukshetra, Haryana, India
4Computer Science & Engineering Department, Lovely Professional University, Jalandhar, Punjab, India
5Department of Information Technology, College of Computers and Information Technology, Taif University, P. O. Box 11099, Taif 21944, Saudi Arabia
6Department of Computer Science, College of Computers and Information Technology, Taif University, P. O. Box 11099, Taif 21944, Saudi Arabia
7Chitkara University Institute of Engineering and Technology, Chitkara University, Punjab, India
*Corresponding Author: Nitin Goyal. Email: dr.nitingoyal30@gmail.com
Received: 17 July 2021; Accepted: 18 August 2021
Abstract: COVID-19, being the virus of fear and anxiety, is one of the most recent and emergent of various respiratory disorders. It is similar to the MERS-COV and SARS-COV, the viruses that affected a large population of different countries in the year 2012 and 2002, respectively. Various standard models have been used for COVID-19 epidemic prediction but they suffered from low accuracy due to lesser data availability and a high level of uncertainty. The proposed approach used a machine learning-based time-series Facebook NeuralProphet model for prediction of the number of death as well as confirmed cases and compared it with Poisson Distribution, and Random Forest Model. The analysis upon dataset has been performed considering the time duration from January 1st 2020 to16th July 2021. The model has been developed to obtain the forecast values till September 2021. This study aimed to determine the pandemic prediction of COVID-19 in the second wave of coronavirus in India using the latest Time-Series model to observe and predict the coronavirus pandemic situation across the country. In India, the cases are rapidly increasing day-by-day since mid of Feb 2021. The prediction of death rate using the proposed model has a good ability to forecast the COVID-19 dataset essentially in the second wave. To empower the prediction for future validation, the proposed model works effectively.
Keywords: Covid-19; machine learning; neuralprophet model; poisson distribution; prediction; random forest model
The coronavirus is also known as novel coronavirus, 2019, or just the coronavirus. Initially, it was identified in China Wuhan Province in December 2019. The various respiratory illnesses caused by the coronavirus are being referred to as COVID-19 which has been caused by a new strain of coronavirus called SAR-COV2 [1]. The outbreak of coronavirus has been declared a pandemic (a disease that can spread worldwide at a very fast pace) [2]. Its social transmission was reported and henceforth, it became the major concern for all the COVID-19 infected countries. Moreover, COVID-19 is a respiratory disease, it starts with the lungs and ends here, however, in critical cases it could be fatal for the human body. As per the study, people with severe to critical symptoms further develop Acute Respiratory Distress Syndrome (ARDS). This further causes flood of immune cells towards the lungs leading to severe infection. During this course, the immune cells kill all the cells in their paths including the body cells. This ARDS further leads to respiratory failure and the patient has to be admitted to ICU for further treatment. The SARS Cov-2 virus led to billions of death cases as well as enormous infection cases all over the world [3]. The research studies led to the conclusion that the coronavirus is the outcome of the natural evolution process despite being a product of laboratory engineering, researchers are still trying hard to find the real origin of coronavirus. Many researchers studied various trends of COVID-19 and their impacts [4]. The proposed NeuralProphet model has a fast modeling process when compared to the various existing time-series models. Moreover, it can handle the missing data in a better way. The considered model also used a neural network for modeling and simulating the time-series auto-correlation and henceforth, leads to improvised accuracy and effective results. The number of COVID-19 cases reached to very low count by the end of 2020. However, immediately after that, the second wave of Coronavirus occurred with a new strain of the virus. In India, the second-wave coronavirus is known as ‘conjunctiva’. The second wave is similar to what was experienced in the spring of 2020, but now the new variants of the virus are discovered as it changes its forms very rapidly and new symptoms are diagnosed in the patients.
Motivation and Contribution
The prime objective of this paper is to predict and forecast the COVID-19 cases in India, specifically, daily new cases, daily death cases, cumulative new cases, as well as cumulative death cases using the latest Facebook NeuralProphet model which is based upon time series forecasting because the COVID-19 prediction problem comprises the time component and it is difficult to handle and solve such problems using simple machine learning model. The model essentially relies upon the approach named hyperparameters tuning approach that further enhances the accuracy levels of the attained results. The proposed scheme digs and predicts the trend analysis of COVID-19 cases that have been further compared with the Random Forest model and Poisson Distribution model. The proposed approach tends to generate the forecasting and predictions for the aforementioned cases and when compared with the two models, the proposed model outperformed both of them in terms of attaining the accuracy in forecasted, reliability, and predicted results.
The remainder of the paper is organized into four sections. Section 2 describes the related works and Section 3 illustrates the methodology implemented in the paper. The experimental analysis of the proposed work has been explained in Section 4 and finally concluding remarks are discussed in Section 5.
For respirational measurement, Massaroni et al. [5] presented a complete analysis of contact-based sensing schemes. For this analysis, numerous contact-based sensing techniques as well as breathing sounds, air-flow movement, chest movement and to sense respiratory patter cardiac action all are compared [6]. To raise the efficacy of the model, this concern has to be taken into consideration failing which the accuracy of the results would fall dramatically. Hyun et al. [7] used Kmeans algorithm of unsupervised machine learning technique for collecting the patients’ data from ICUs. Nine lab tests were performed on ICU patients and an independent test was conducted on collected data. Based on Depending on the clinical outcomes nine characteristics were grouped into three clusters. For each patient group in a single unit, a treatment technique was developed in which a data set was studied. Volpert et al. [8] presented a mathematical model for the prediction of the quarantine process. The scheme beholds the rate of infection progress while assuming that all the coronavirus infected patients are kept isolated after the completion of the incubation period too such that the infection does not get transmitted from an infected to a healthy person. However, the situation cannot be dealt out merely by introducing quarantine, and hence, more vigorous measures would be required to incorporate as the number of cases increases with every passing day. For message findings, a hybrid approach was presented by Farzad et al. [9] were from the dataset positive samples are predicted by isolation forest algorithm. For anomaly detection, model training and feature extraction autoencoder networks were applied. The developed technique is a typical case of unsupervised learning when training of positive samples using isolation forest helps in increasing the correctness of the model. Hauskrecht et al. [10] proposed a patient's health detection model which is based upon a supervised vector machine learning algorithm having high accuracy for outliner detection. But the model is unable to work in a complex environment which is desirable in the medical field [11] for coronavirus-affected patients. The problem with the proposed scheme yet again was the non-availability of sufficient data that hampered the predicted values in terms of accuracy. Liu et al. [12] proposed a model based on a differential equation for the prediction of infected cases. The observation also found that the infected cases might have dropped extensively if the restriction mechanism was implemented one week earlier. Moreover, had the measures kept less restricted for the public movement, the cases would have raised exponentially. Nevertheless, if some other measures too were incorporated into the study, the results might have proved to be more effective and considerable. Chawla et al. [13] stated that social distancing, staying home and lockdown measures decrease the spreading of coronavirus disease. The lockdown is the most important measure in the absence of vaccination and technology can be an important tool to handle COVID-19 spread as well in treatment. The authors proposed a time series-based ARIMA model to predict the COVID-19 global spread rate. Tuli et al. [14] designed a weighting-based general framework using a machine learning-based mathematical model that was iterative. It was applied to perform the predictions and forecasting of the future scenario and, the proposed scheme managed to attain high accuracy levels too and hence was proven helpful for tracing the COVID-19 status and therefore, making the decision-process more effective. The research work was proposed by Chimmula et al. [15] based upon Long Short-Time Memory (LSTM) model. It was yet again an effort to predict the covid cases; however, the study also focused on finding the transmission rate of infection in various countries namely the UK, Canada, and Italy. The work tends to make time-series predictions specifically for Canada. Evaluation of numerous features was done to forecast the cases count and the authors also tried to make efforts to know the estimated time when the cases would start to lower down and eventually, would come to stop for the Canada outbreak and across the world too by making accurate predictions as far as possible. To know the trends in Mexico City, Melin et al. [16] Incorporated various ensembles along with aggregating the neural network tools with fuzzy responses. The fuzzy concept primarily aims to handle the uncertainty that may arise while forecasting the values; ergo, the time-series dataset of Mexico when operated upon by amalgamating ensembles with fuzzy logic yielded highly accurate predictions while lowering the error rate. The artificial intelligence-based tools can help achieve better-predicted values as well as tracing the trends of covid cases; ergo, Batista et al. [17] proposed a machine learning model for covid-19 prediction. The authors only concentrated on patients admitted to the intensive care unit. To train the model various machine learning algorithms i.e., random forest, logistic regression, support vector machine, neural network, and gradient boosting trees have been applied. The results showed that the support vector machine algorithm outperforms other models in terms of accuracy. The predictions and trend forecasting were also envisioned using ARIMA models by Ceylan [18]. The proposed scheme was designed in such a way that it helped in making better decisions in terms of taking precautionary measures as well as led to improvised policy formulation for the Covid outbreak. The genetic-programming-based prediction model was developed by Salgotra et al. [19] for making predictions on the covid outbreak. To improve the efficacy of the proposed scheme, the explicit formulae, as well as numerous statistical parameters, were incorporated into it. Based upon the research so performed, it could be concluded that the GP models relying on simple linkage functions attained quite reliable time-series based predictions. The various Machine Learning Models [20] are considered for predicting the covid cases and it was concluded from the work that machine learning models are the reliable way to forecast and predict the time series dataset and also well as for prediction purposes. There always exist alternatives to everything and so is in this case as well. To make forecasting and detection of COVID-19 cases, an alternate approach named model-based clustering approach may be used that further comprises statistical mixture models and in fact, are proven to yield effective results. Moreover, finite mixture models also yielded remarkably effective and significant analysis in the medicine domain and various machine learning applications [21].
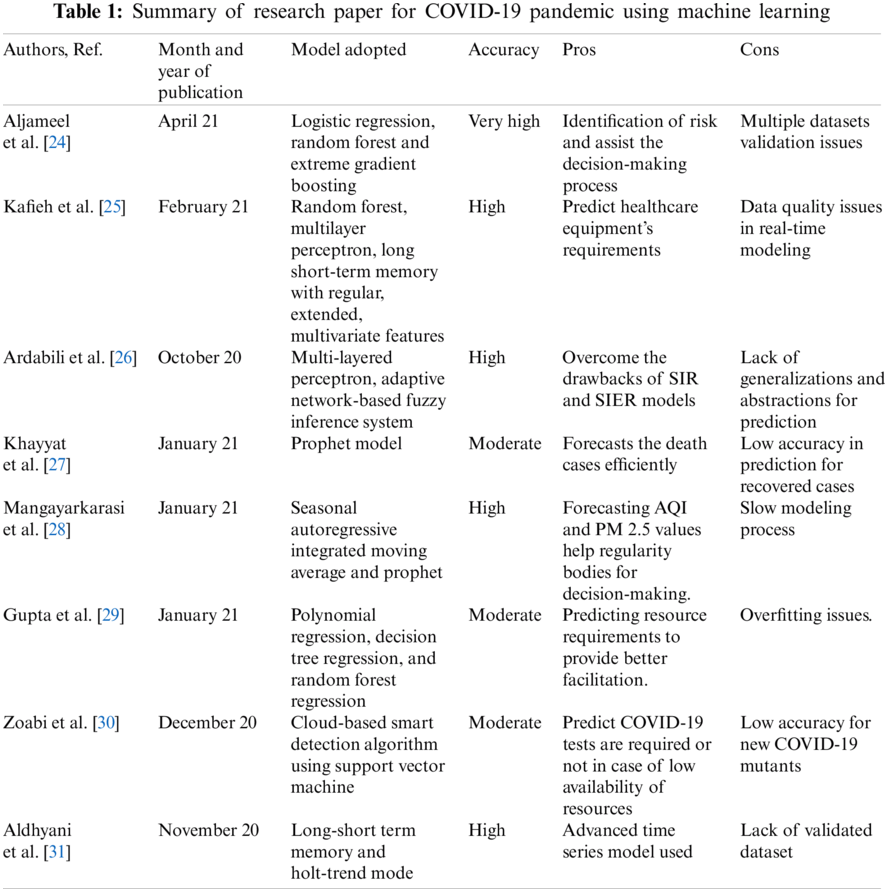
Furthermore, numerous flexible predictive mixture models [22,23] lead to a huge success when implemented and applied in the medical imaging domain such as for chest x-rays or CT-scans, such models helped retrieve complex patterns and hence, may be utilized in predicting the presence of various infections too including coronavirus. Therefore, it is evident based upon all these research works and studies Tab. 1 that the researchers and experts are tending to focus on the underlying reasons and aiming to provide some remedies to fight the pandemic in a better way either by curing and preventing or by resisting it.
To predict the second wave variety of phases and tools are involved. The initial and critical step is to collect authenticated data to make accurate predictions as far as possible. Once the data is available, the next step is to scrutinize depending upon the needs since the entire data cannot always be utilized and hence, it must be filtered, cleaned to prepare it for further forecasting process [31]. The predictions are made using the NeuralProphet model and must be visualized graphically to analyse the attained results. Eventually, the obtained results from the considered model are compared with two models namely, Poisson Distribution and Random Forest model. The entire process is diagrammatically presented in Fig. 1. Though it may be analysed that the numerous researchers tried to hit the domain in every possible way to fight COVID-19; however, the proposed approach is more oriented towards predicting the future scenario in terms of calculating the death cases and confirmed cases in the future time. This has been done using the NeuralProphet model for predicting the statistical results. The detailed comparison is performed with Random Forest, Poisson Distribution model.
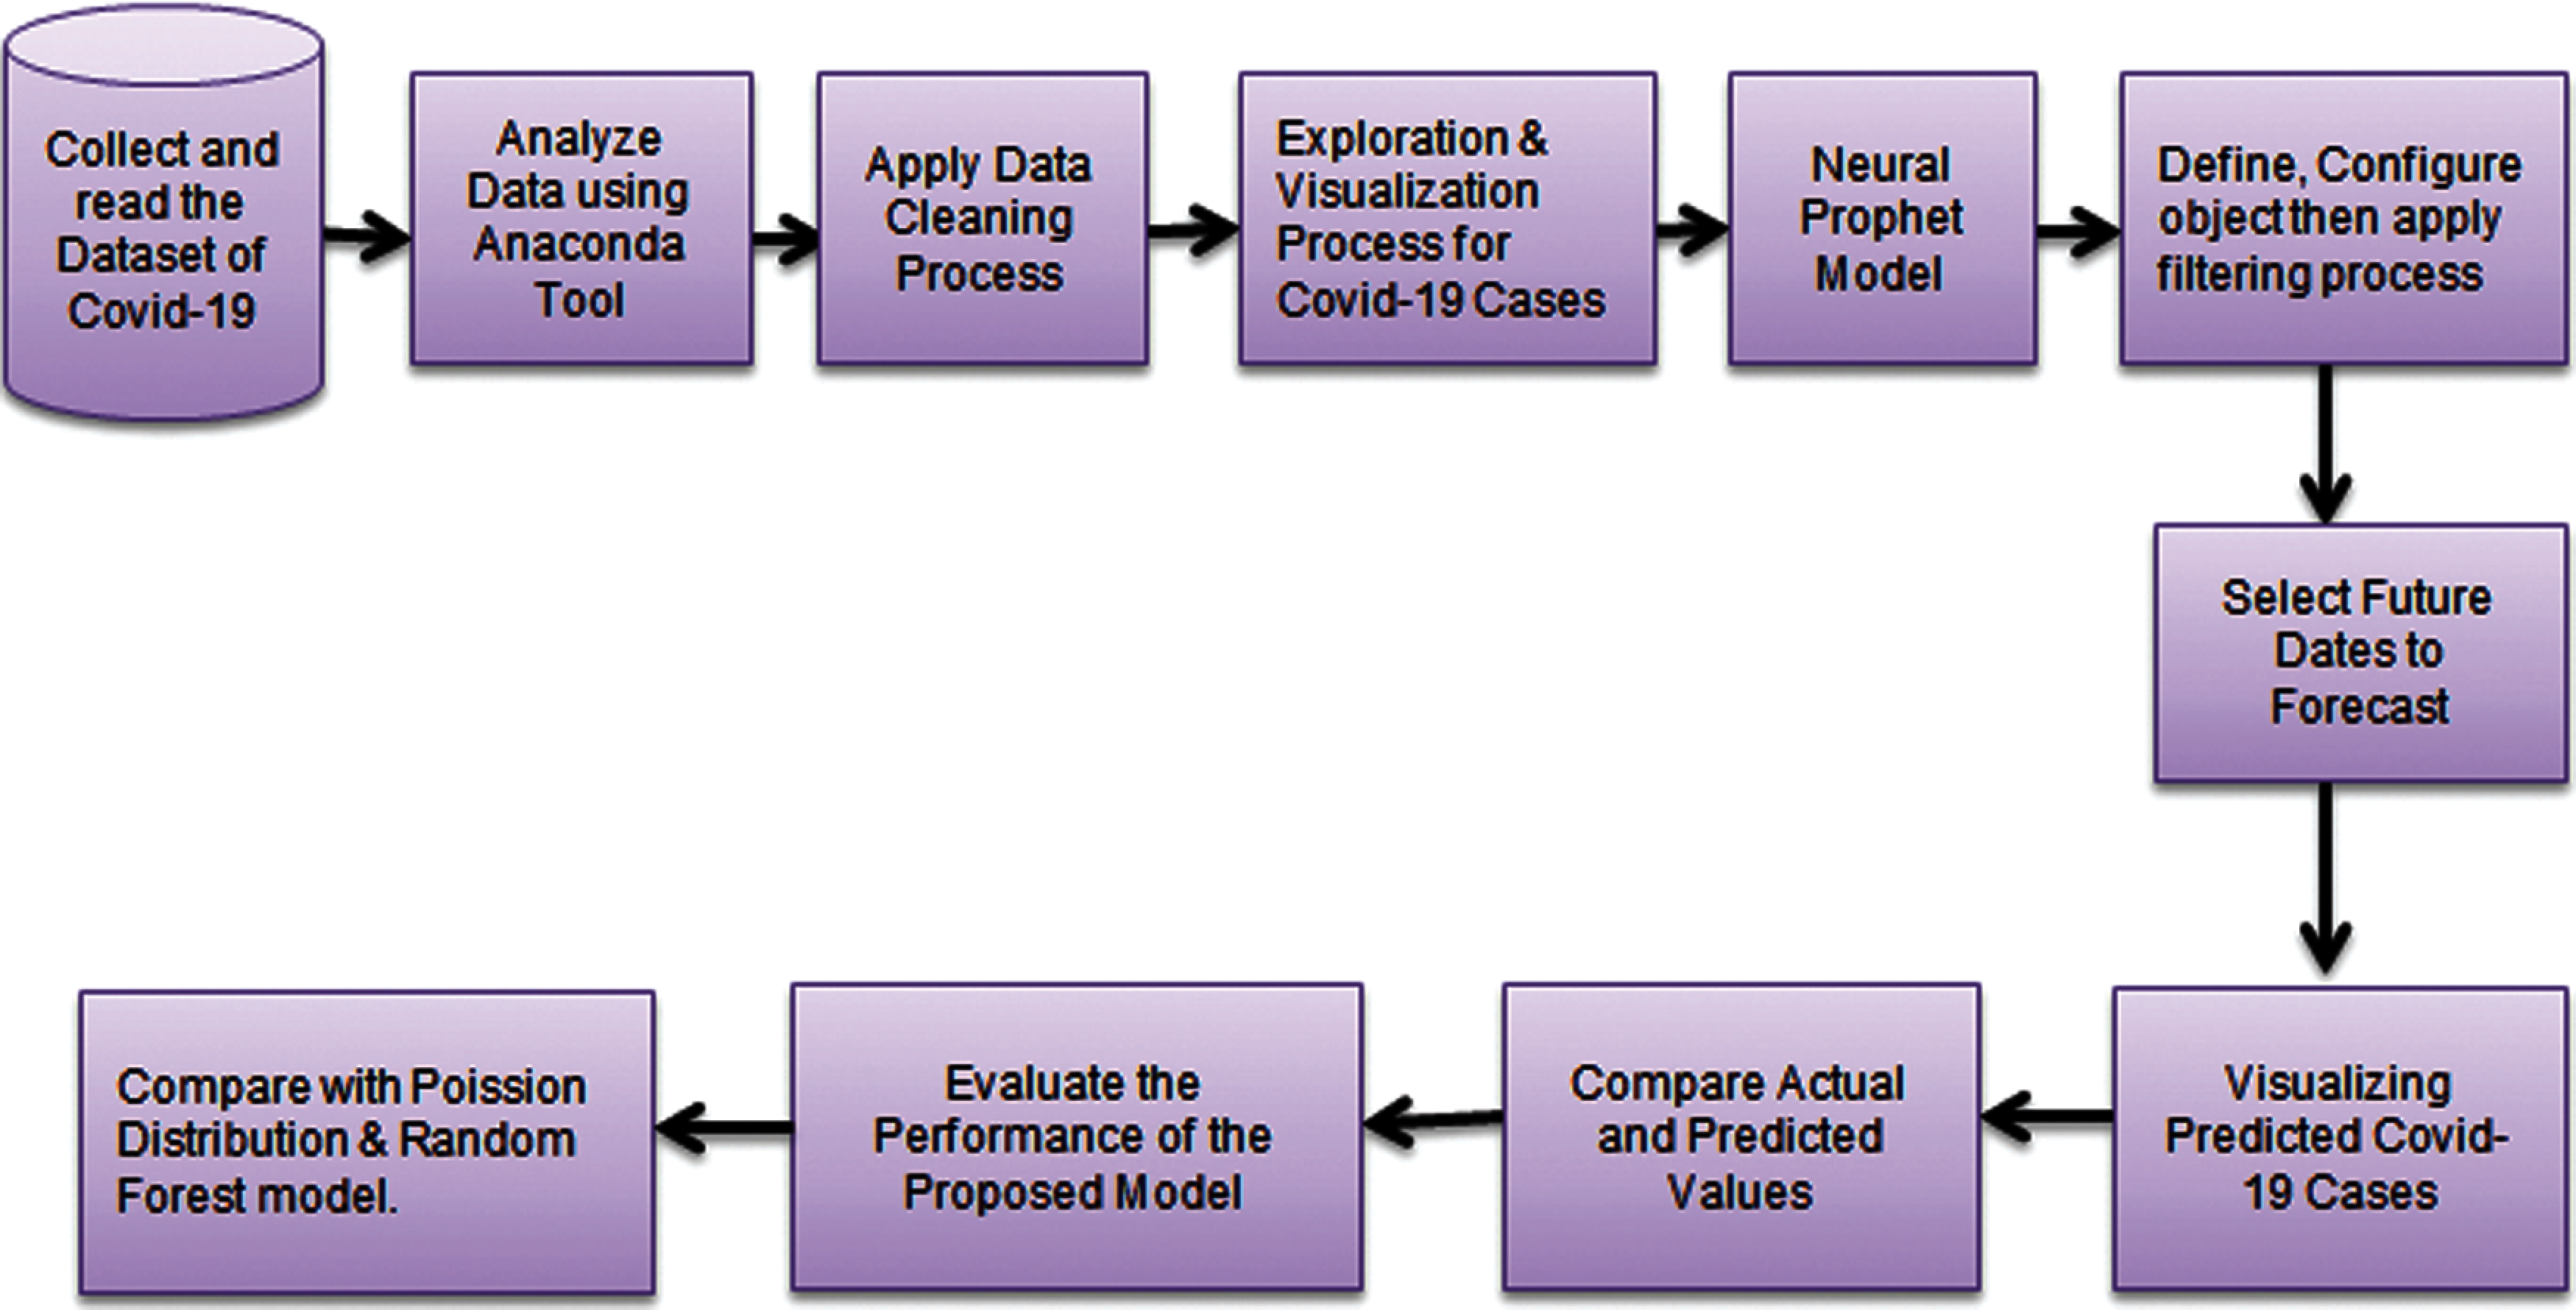
Figure 1: Prediction process of covid-19 cases
Random Forest is a machine learning algorithm that is used to solve problems based upon regression and classification. The Random Forest model has some pre-requisites so that it can perform well: first is rather than the random guess of its feature, the model predicts better results if some actual signals or threshold values should be set on a prior basis. Second is the predictions of individual decision tree should have a very low correlation. Ergo, if the results so obtained by the multiple predictors could be amalgamated, it would yield better-predicted values in comparison to the best individual predictor. An aggregation of more than one predictor to form a group is referred to as an ensemble and the learning process based upon this ensemble is known as Ensemble learning.
3.2 Poisson Distribution Model
The Poisson Distribution may be defined as the discredited distribution that tends to compute the probability of the occurrence of the specific event in specified time duration. It takes only integer values and does not take fractional or decimal values. These values are not in a continuous range. This model is generally used to analyze the independent events that occur with a consistent speed but within a defined time period.
where:
Assumptions
• A variable k indicates the count of occurrence of an event whose value can be 0, 1, 2… and so on.
• The event occurrences are entirely independent of each-other, that means, any event say event x if occurred would not ensure that event y would also take place as a consequence. The two events would not invoke any kind of probability of each-other's occurrences.
• The average ratio of event occurrence is completely independent of any specific occurrence. However, for the sake of simplicity, its value is generally kept constant or fixed but it could also vary with time in real life practices.
• Any two events cannot take place at exact same time instance rather considering every subsequent small time interval, exactly one event occurs or does not occur at all.
One of the popular forecasting tools named the Prophet model which was developed by Facebook forms the foundation of the NeuralProphet model. NeuralProphet is essentially a decomposable and moldering time-series model that further comprises numerous components namely, special events, seasonality, auto-regression, trend, lagged regressors and future regressors. The lagged regressor comprises the external variables having values confined to the observed time period only whereas the future regressor consists of external variables that store known and prospective future values considering the forecast period. The functionality of future regressors may be considered equivalent to the special events. Moreover, it is essential and prime requirement to pass the future values of the regressors for performing the forecasting of the values. Moreover, the component trend can be configured in two ways, either linear or piece-wise linear while updating the change points. To model the component named seasonality, Fourier terms may be utilized efficiently and hence, multiple seasonality to incur highly frequent data can be handled. An AR-Net short for Auto-Regressive Feed-Forward Neural Network can be used to model auto-regression for time-series. However, a separate feed-forward neural network works well in order to model lagged regressors. The remaining two components, special events and future regressors are configured and modeled in terms of co-variants of the model having dedicated co-efficient. It is vigorous to the data that is missing and changes with respect to the trend and handles outliers well. NeuralProphet consists of the sum of the three-time functions with the error term, that is, growth g(t), seasonality s(t), holidays h(t), along with the error rate
The modeling process of NeuralProphet can be made faster in comparison to the prophet by embedding PyTorch's Gradient Descent optimization engine. This model works automatically as it detects the change point or can be customized too. Change points in data are the direction of the data shifts. For example, in the second wave of COVID-19 cases, the new cases started to fall down as the vaccination of COVID-19 reached the market and hence, the data deviated from its direction. On the other side, the increase in cases of COVID-19 occurred due to the new strain of the corona virus.
Once the desired dataset has been retrieved, it has to be divided into some proportions for training and testing purposes. Most of the time 70% of data is utilized to train the proposed model and the remaining data component is utilized to test and predict future outcomes. Ergo, in this training step, the proposed model has been fit onto the data samples of some fixed size, spanning approximately 70% dataset, eventually, the final evaluation of the model goes through in this phase only and hence, is crucial for the model generalization. The free parameters have been set for extensive experimentation using the NeuralProphet model, namely the forecasting time period has been set for seventy days. It gave us a training accuracy of 97.21% using the proposed model.
The dataset considered has been obtained from Kaggle and the dataset consists of time series summary tables. The proposed framework used hyperparameter tuning in which the uncertainty interval parameter is fixed to 80 and 3000 simulations for uncertainty intervals that are taken into consideration. There exist n number of hyper-parameters in the NeuralProphet model and their values may be supplied explicitly by the user. However, in case of unavailability of explicit values for the hyper-parameters, their default values may be considered. The default value of changepoints_range is 0.8, seasonality mode is additive, and the third hyper-parameter, growth parameter has linear default value. The additive seasonality mode has been selected along with the strength of seasonality set to 20. The changepoint period (Ratio) being set to 0.80 while considering 25 potential change points. The flexibility of change points is set to 0.05. Order 3 and 10 have been used, respectively, for weekly seasonality and annual seasonality along with the holiday effects being added merely as the dummy variables.
The CSV format is used in the present work having four attributes for new cases, cumulative new cases and new death cases, cumulative death cases of COVID-2019 The prediction function used to predict daily new and death cases as well as cumulative new and death cases, of COVID-19, is based upon time-series forecasting technique. The forecasting approach forecasts the cases for July, Aug and last week of September 2021. The models namely, NeuralProphet model, Random Forest model and Poisson Distribution model are considered for forecasting. Since the results essentially rely on these models; ergo, their basic working, primitives and significance are described below:
In the proposed approach, the results have been obtained using the NeuralProphet model as mentioned above. Moreover, to ensure the integrity and correctness of the obtained results, the comparison of the proposed scheme has been done with the existing results that were obtained using various models. Ergo, for such reasons, the results obtained in the proposed approach have been compared with the Poisson Distribution and Random Forest model. The predictions are done for the new cases as well as the death cases for the specified duration; therefore, the obtained results are divided into two sections: (i) Comparative analysis of daily new and cumulative cases and (ii) Comparative analysis of daily death and cumulative death cases.
5.1 Comparative Analysis of Confirmed Cases
Since the data is required for performing comparisons, therefore, the daily new cases and cumulative new cases considered and their associated statistical details are shown in Fig. 2; this statistical description has been further used for analysis and predictions. Figs. 3–10 depicts the daily new and cumulative cases predicted using the NeuralProphet model along with all the considered models. When the graphs are analyses minutely, it may be observed that when the predictions were made using the considered models for comparison, the predictions are approximately symmetrical in all the cases, that is the number of cases is initially high and are eventually decreasing; however, when it is compared with the real-life scenario, it is not the situation. The cases may vary, they may grow at any time and similarly can show downfall at any random time. When the obtained predictions were compared with the cases count month-wise, it may be observed that the forecasted values are predicting the real situation quite aptly. Therefore, it may be concluded that the predicted results are depicting the situation quite well and in fact, one can rely upon the predicted values to know the future scenario. The model attained the predicted time series for each case separately from 31st January 2020 till 16th July 2021. Therefore, the comparison has been done for the actual values with the predicted values obtained using the time-series-based facebook NeuralProphet model.
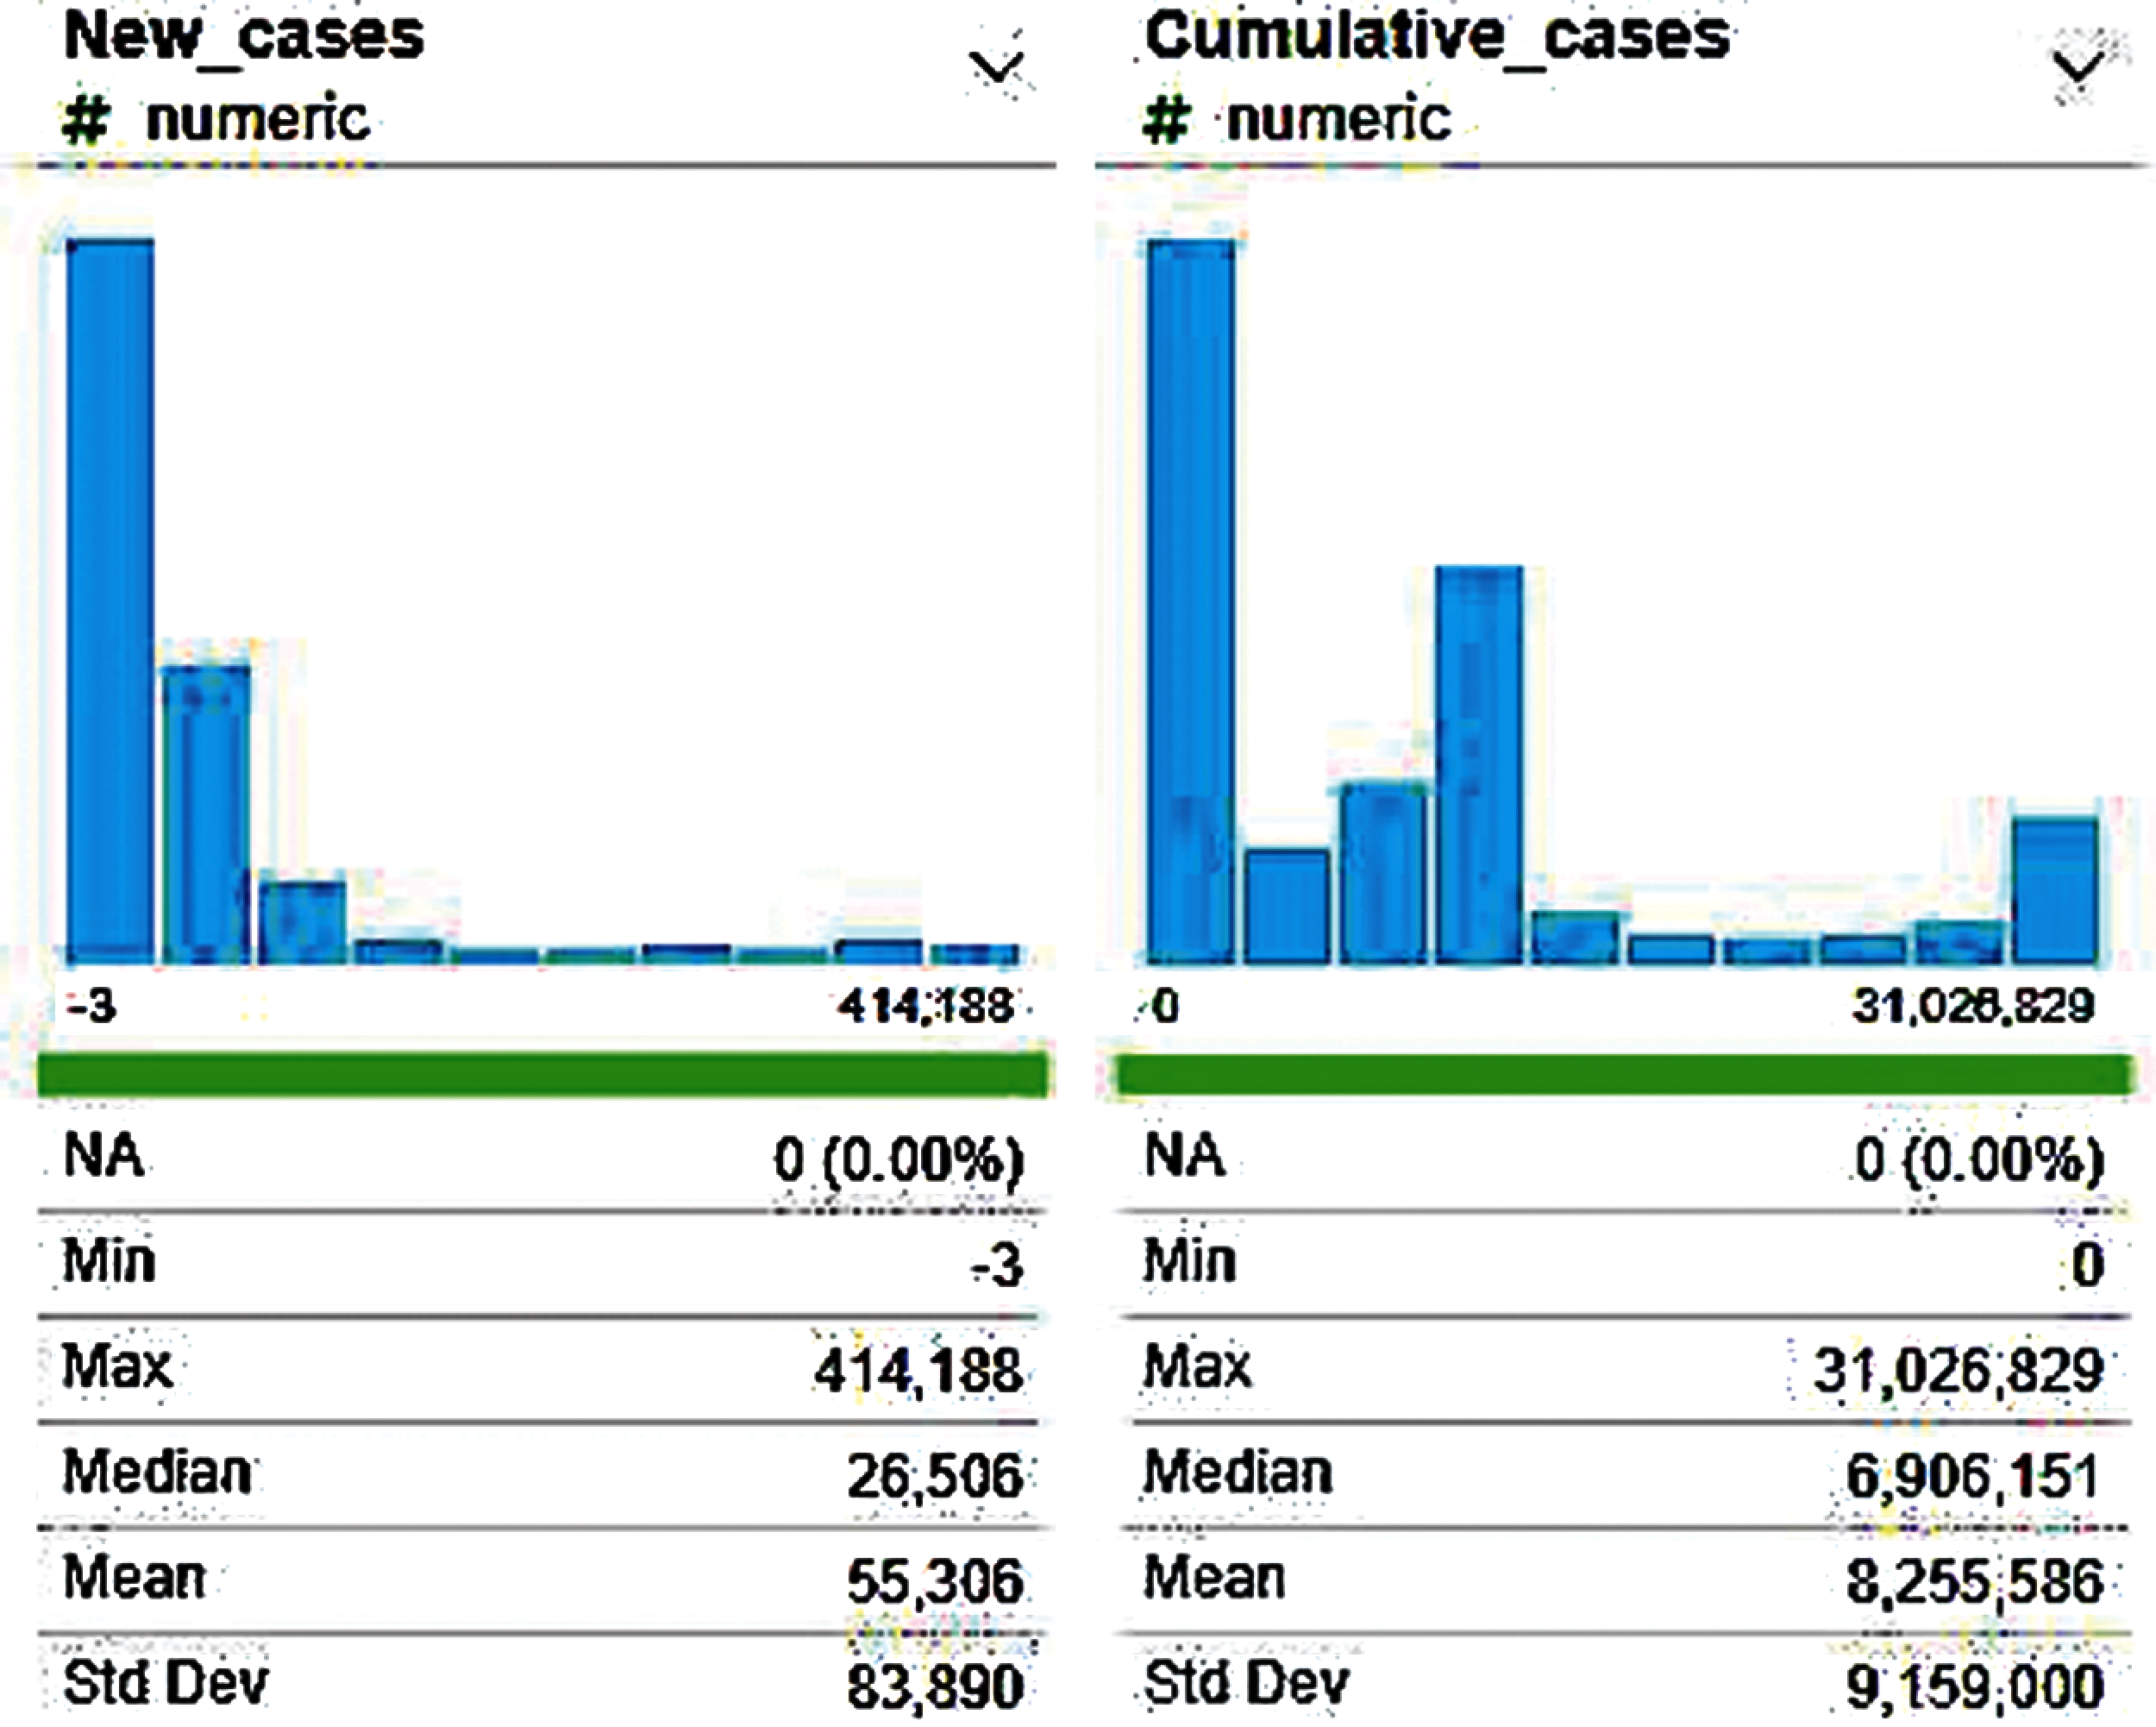
Figure 2: Daily new and cumulative new cases analysis
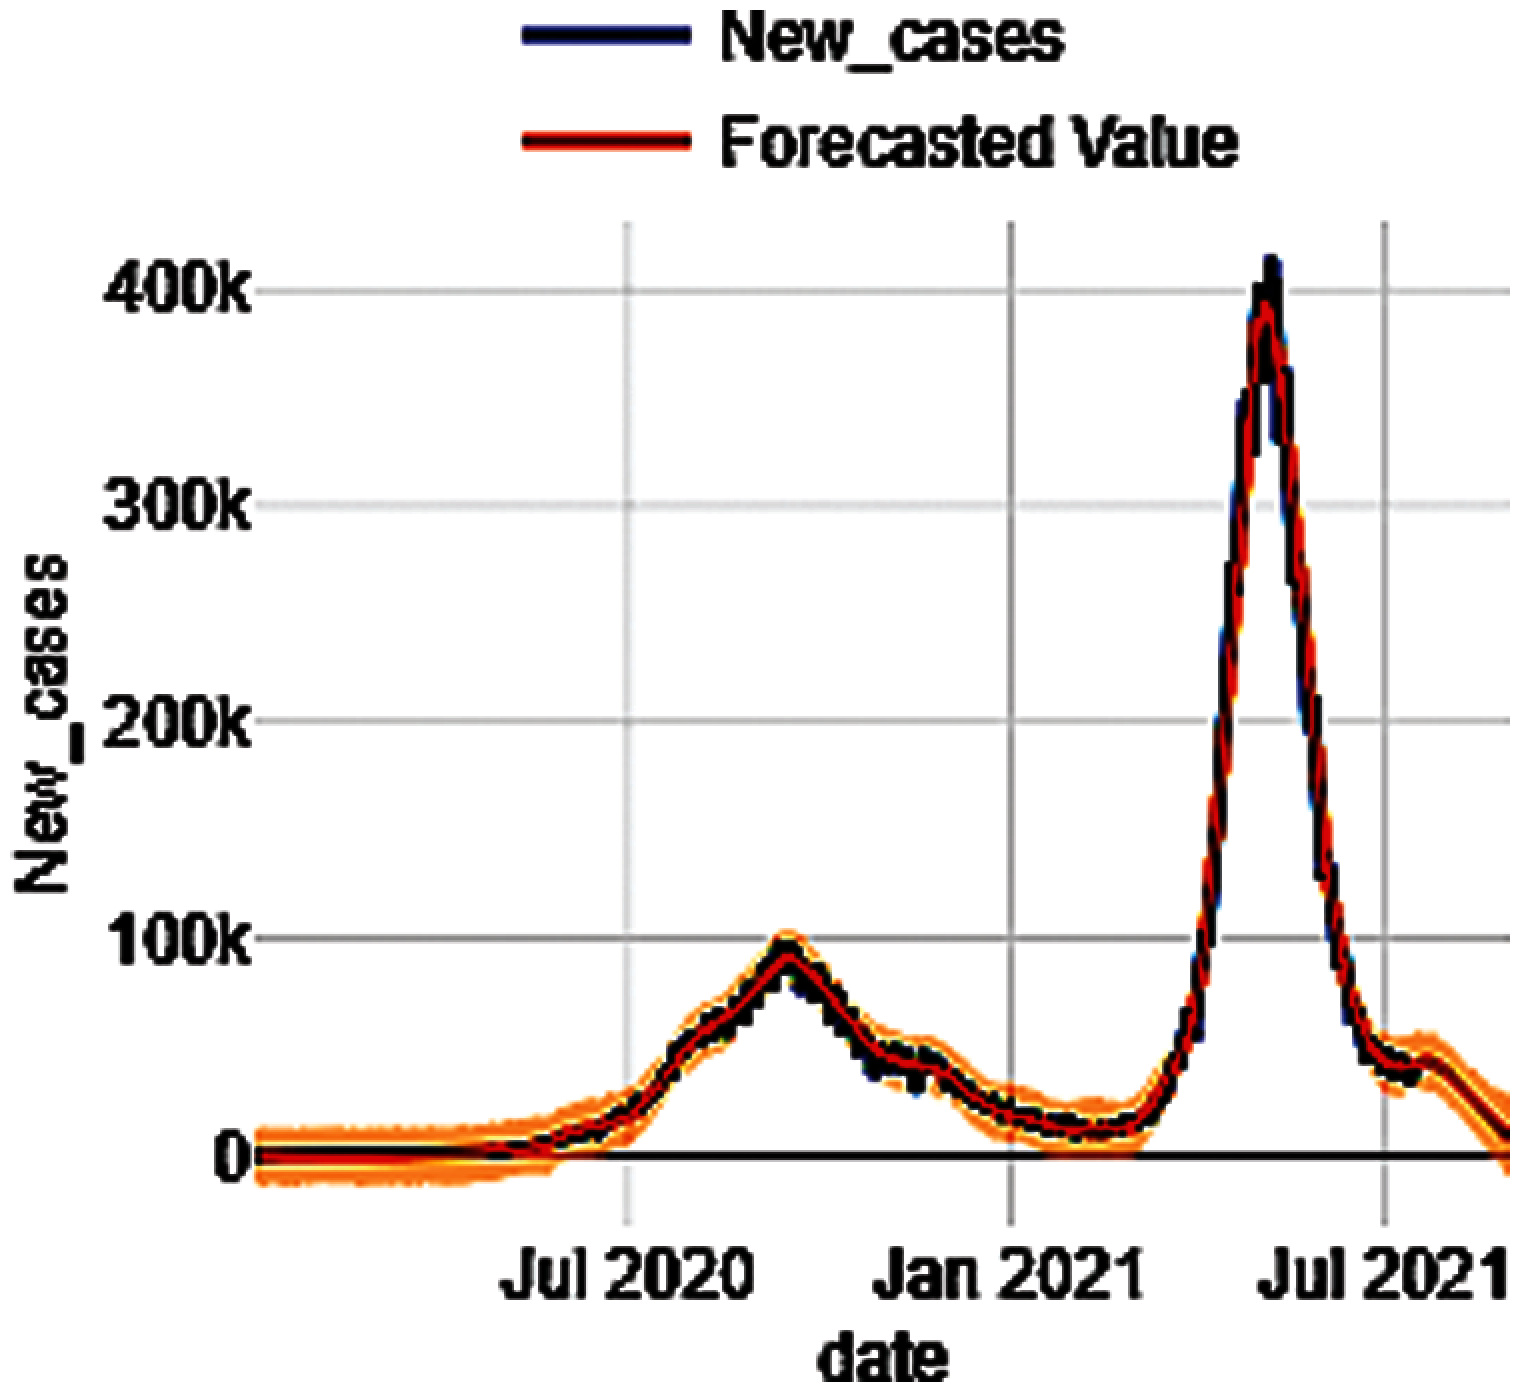
Figure 3: New cases prediction using neuralprophet
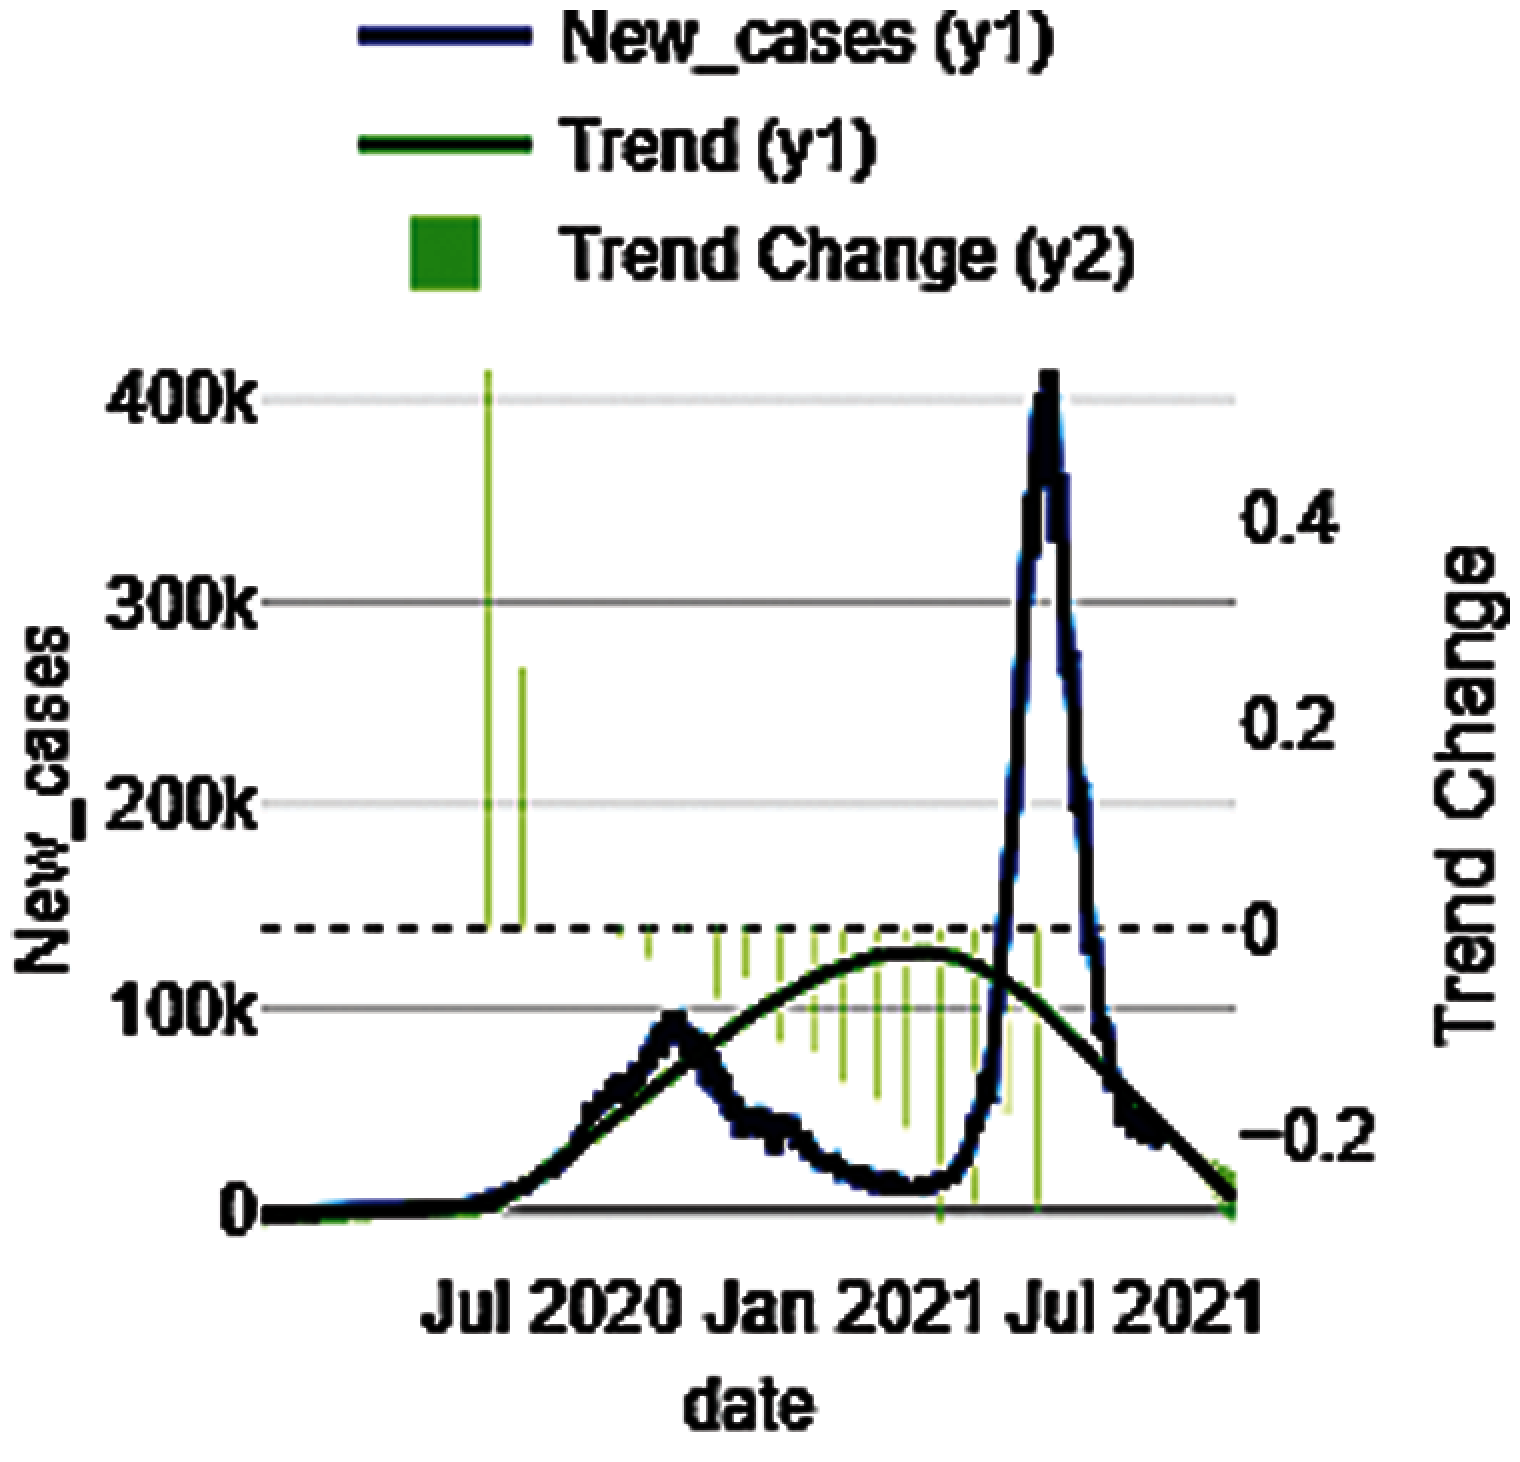
Figure 4: Daily cases trend analysis using neuralprophet
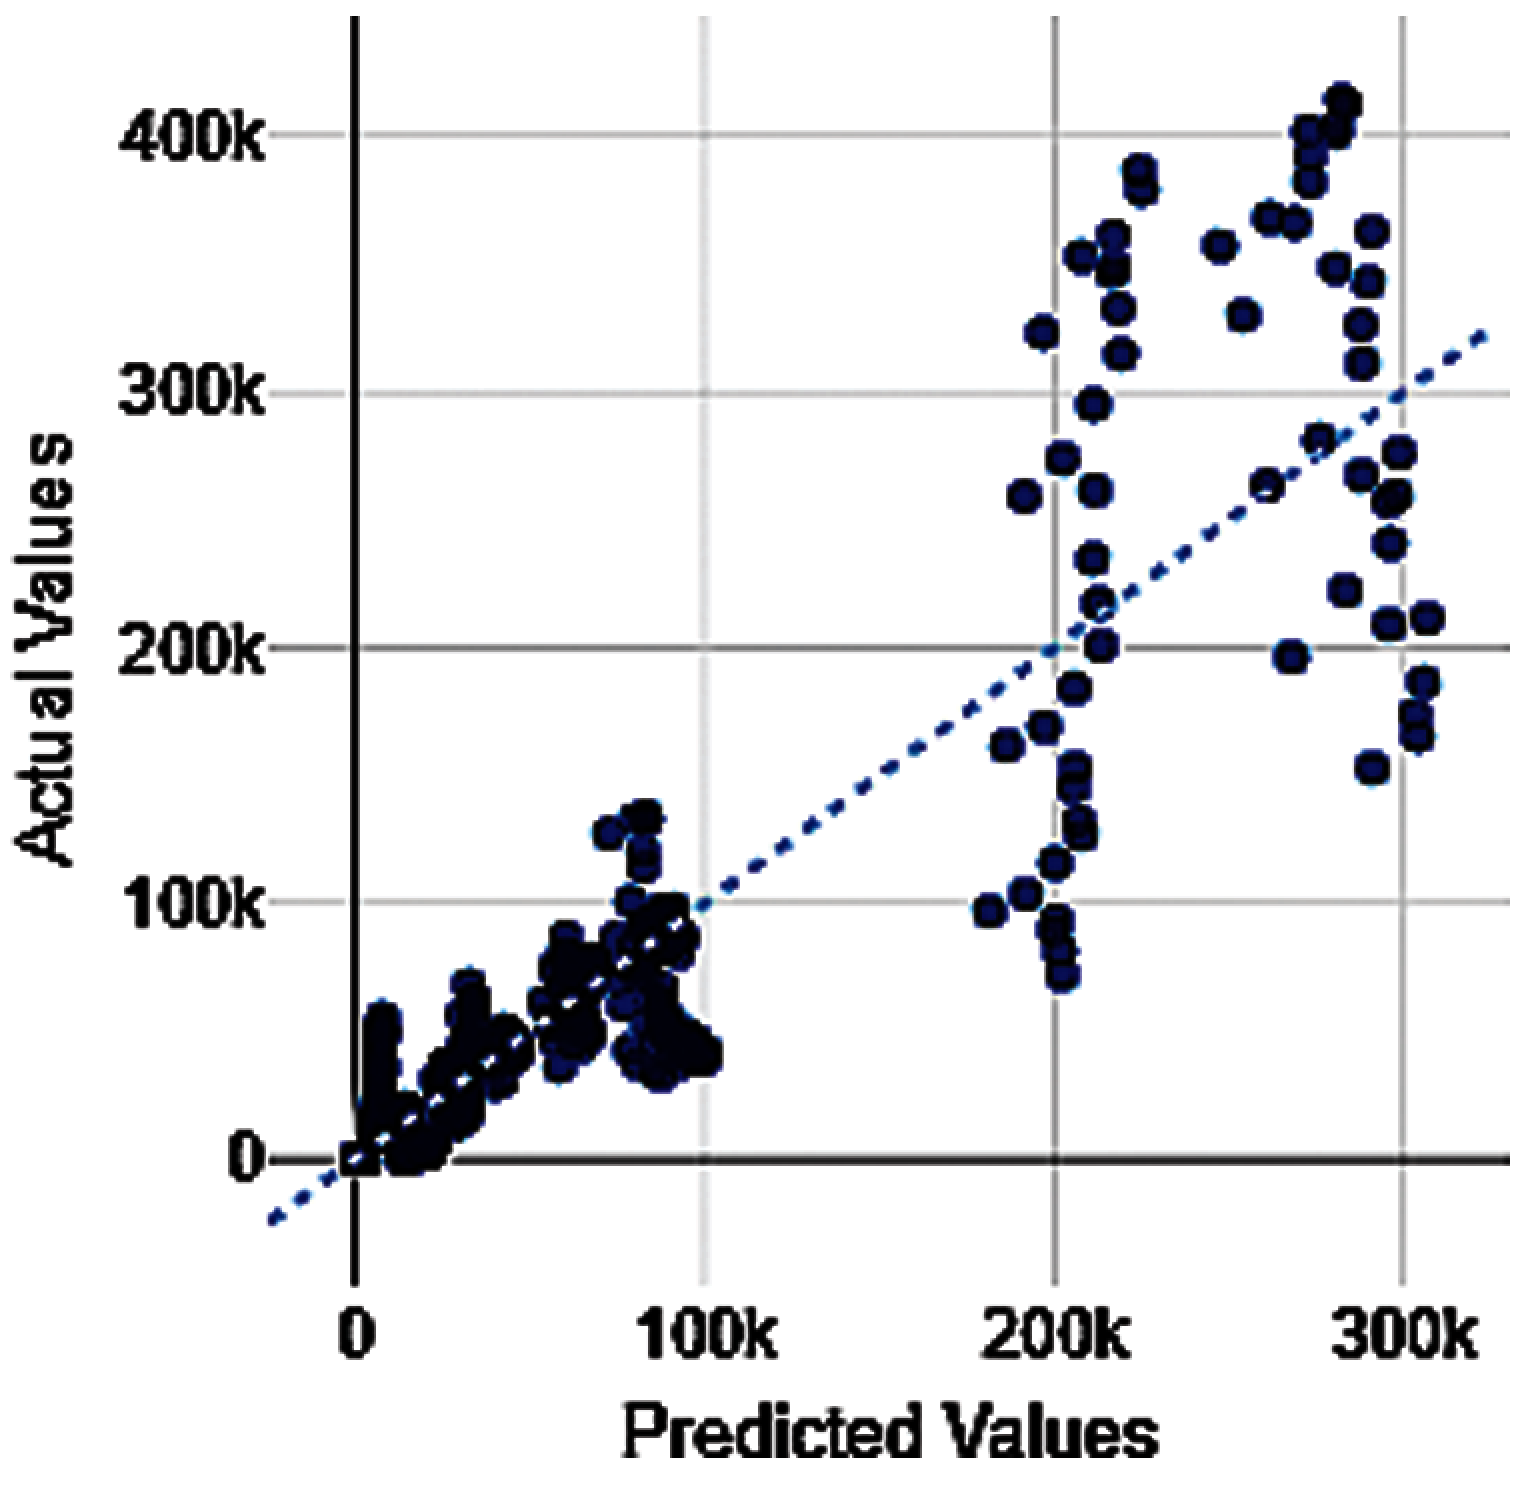
Figure 5: New cases prediction using poisson distribution
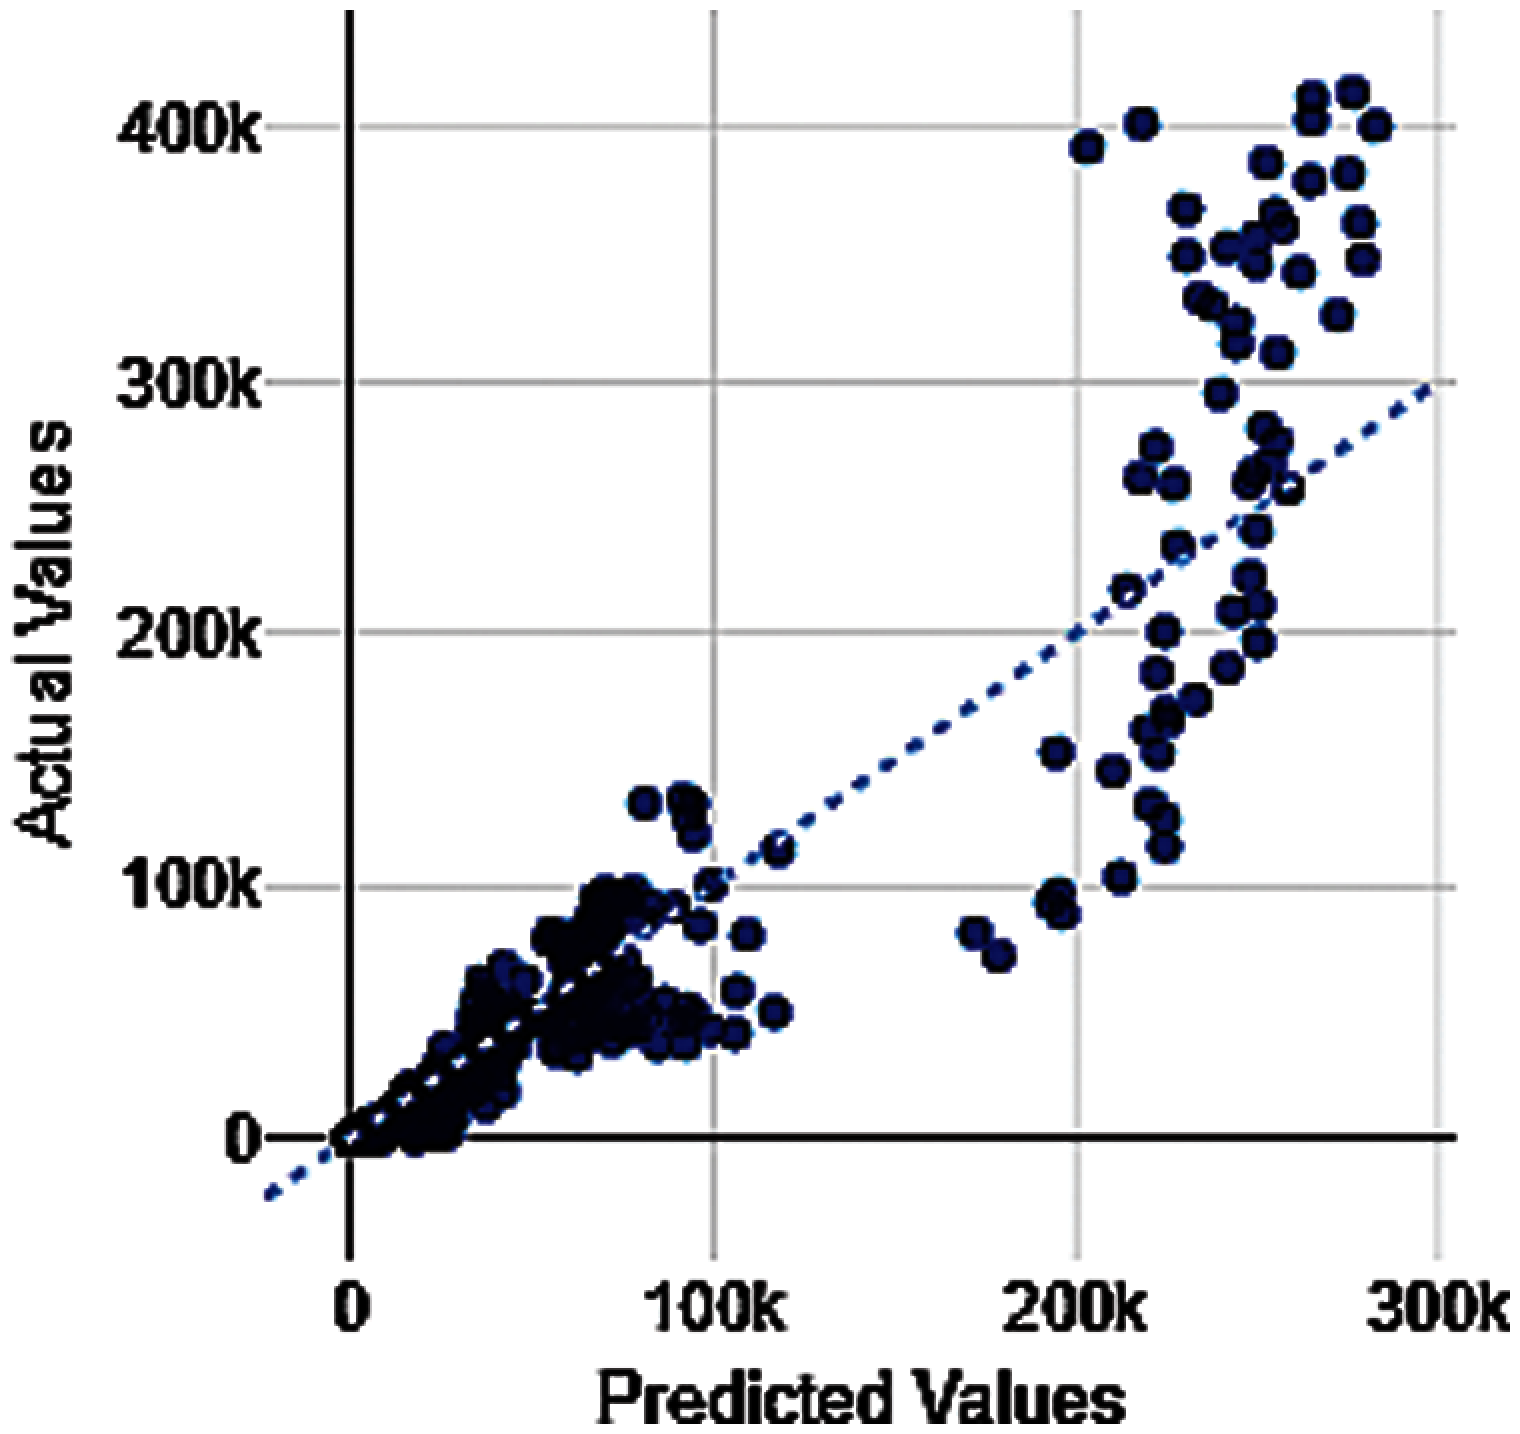
Figure 6: New case prediction using random forest
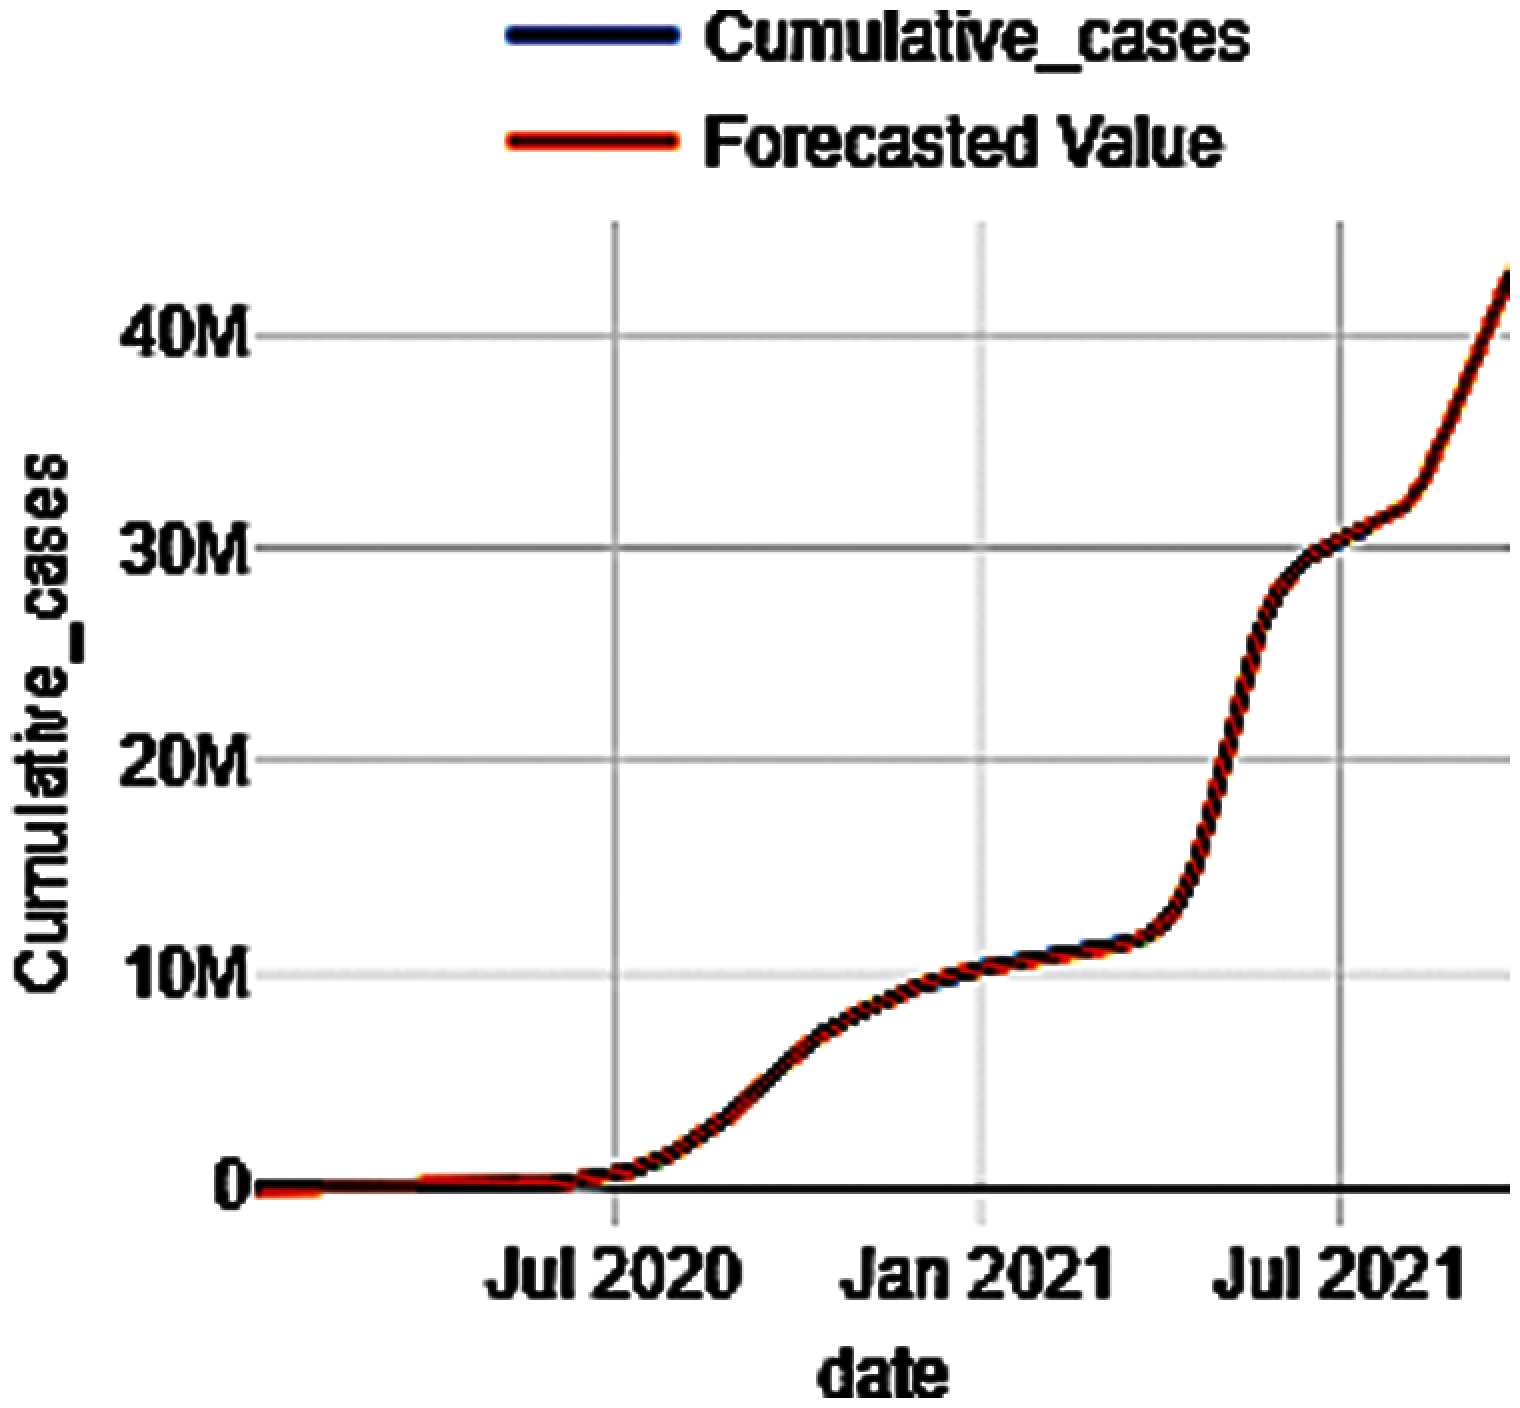
Figure 7: Cumulative new cases prediction using neuralprophet
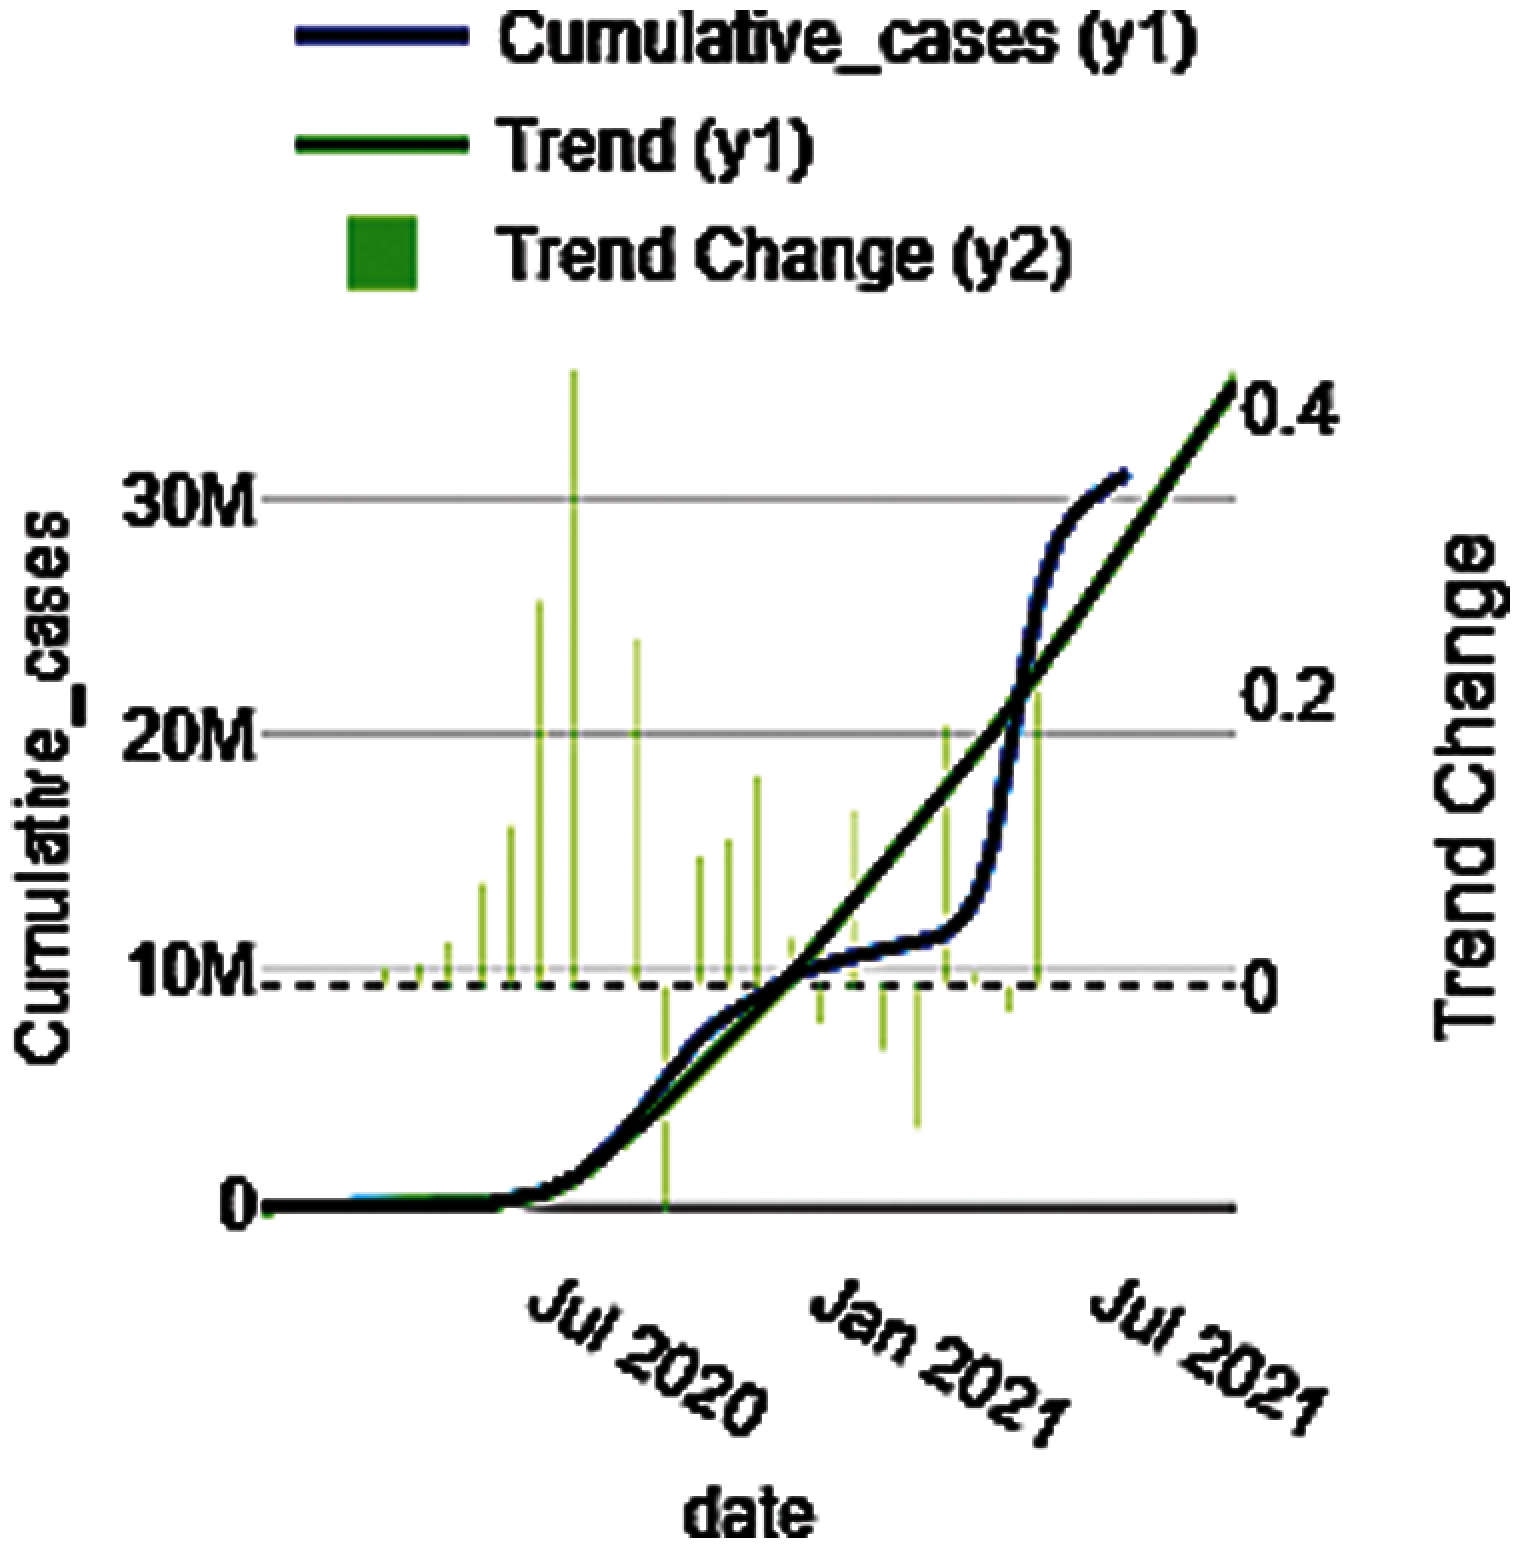
Figure 8: Cumulative new cases trends analysis using neuralprophet
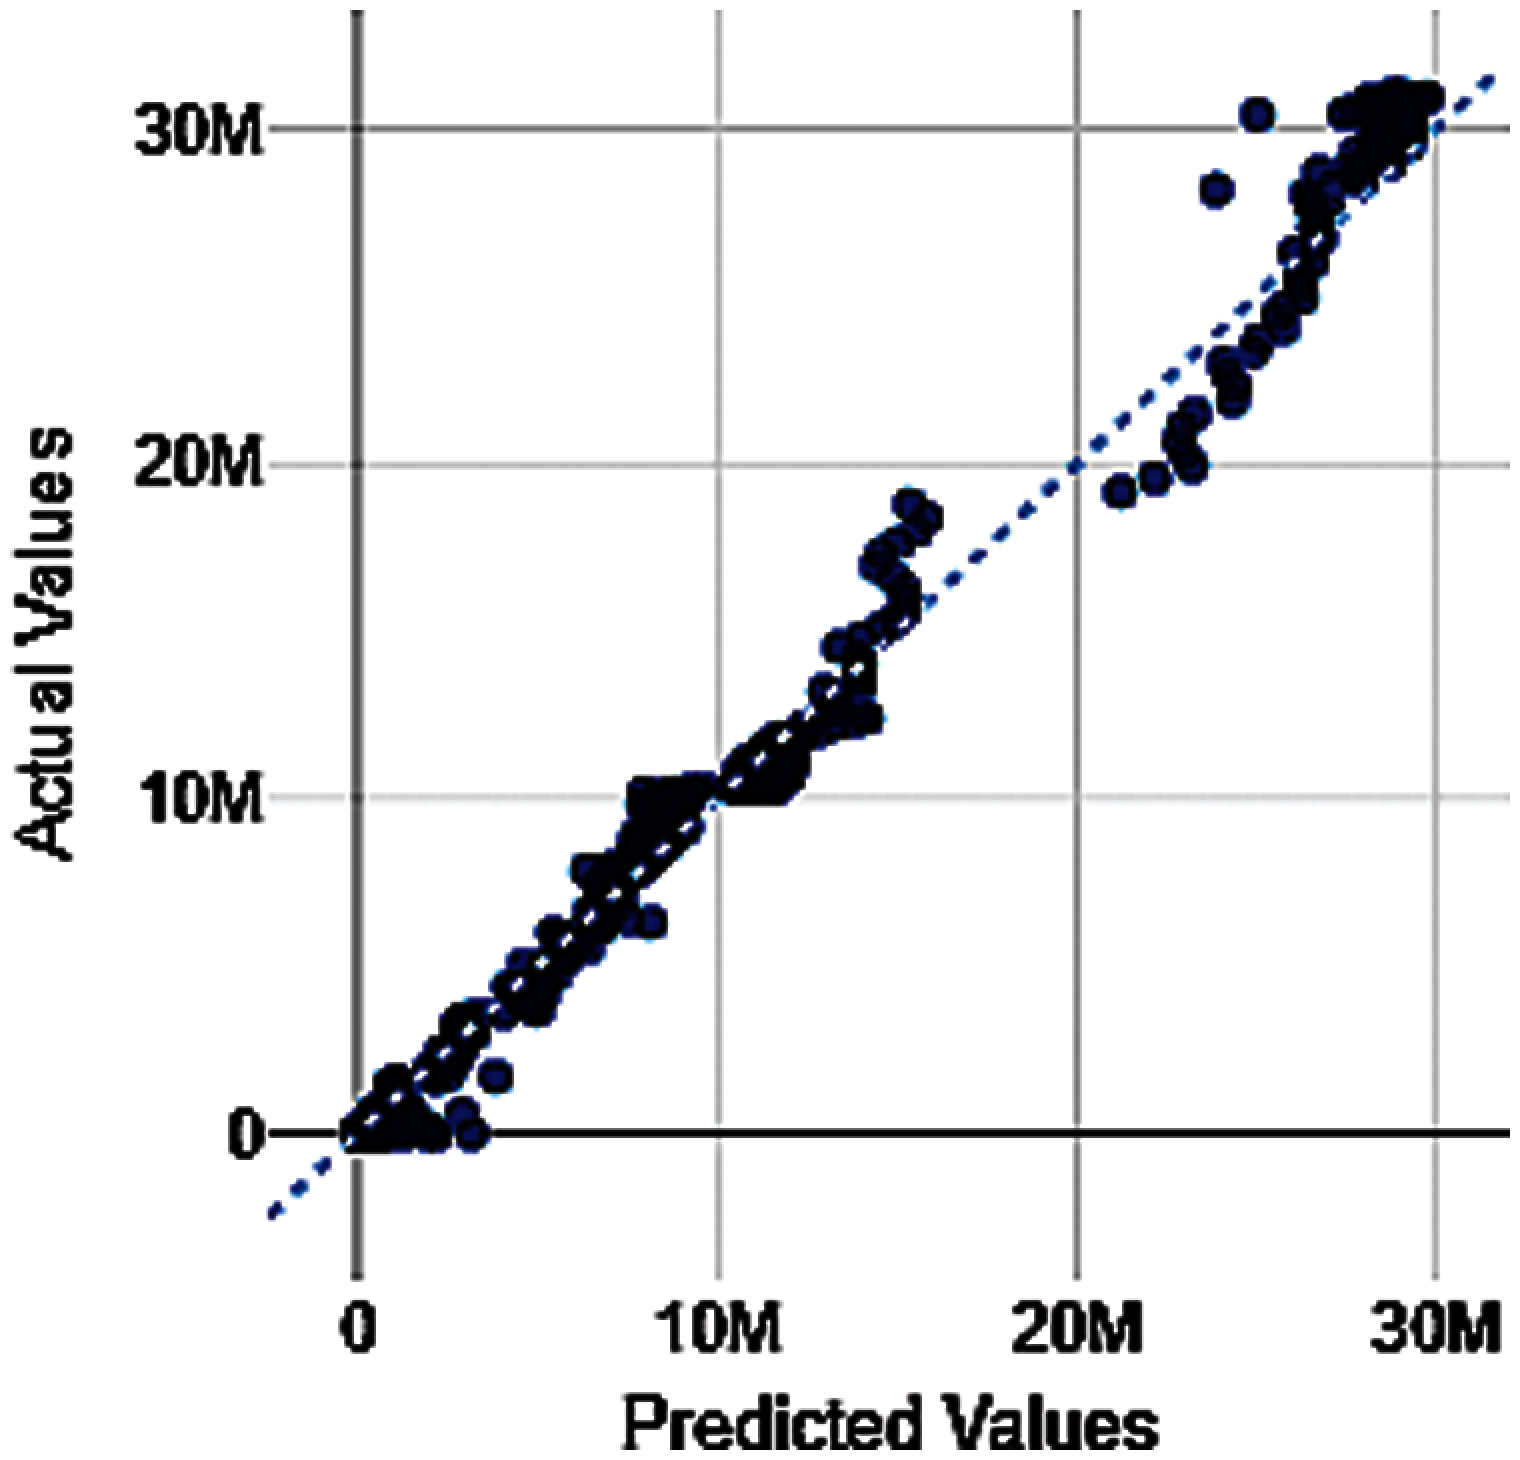
Figure 9: Cumulative new cases prediction using random forest
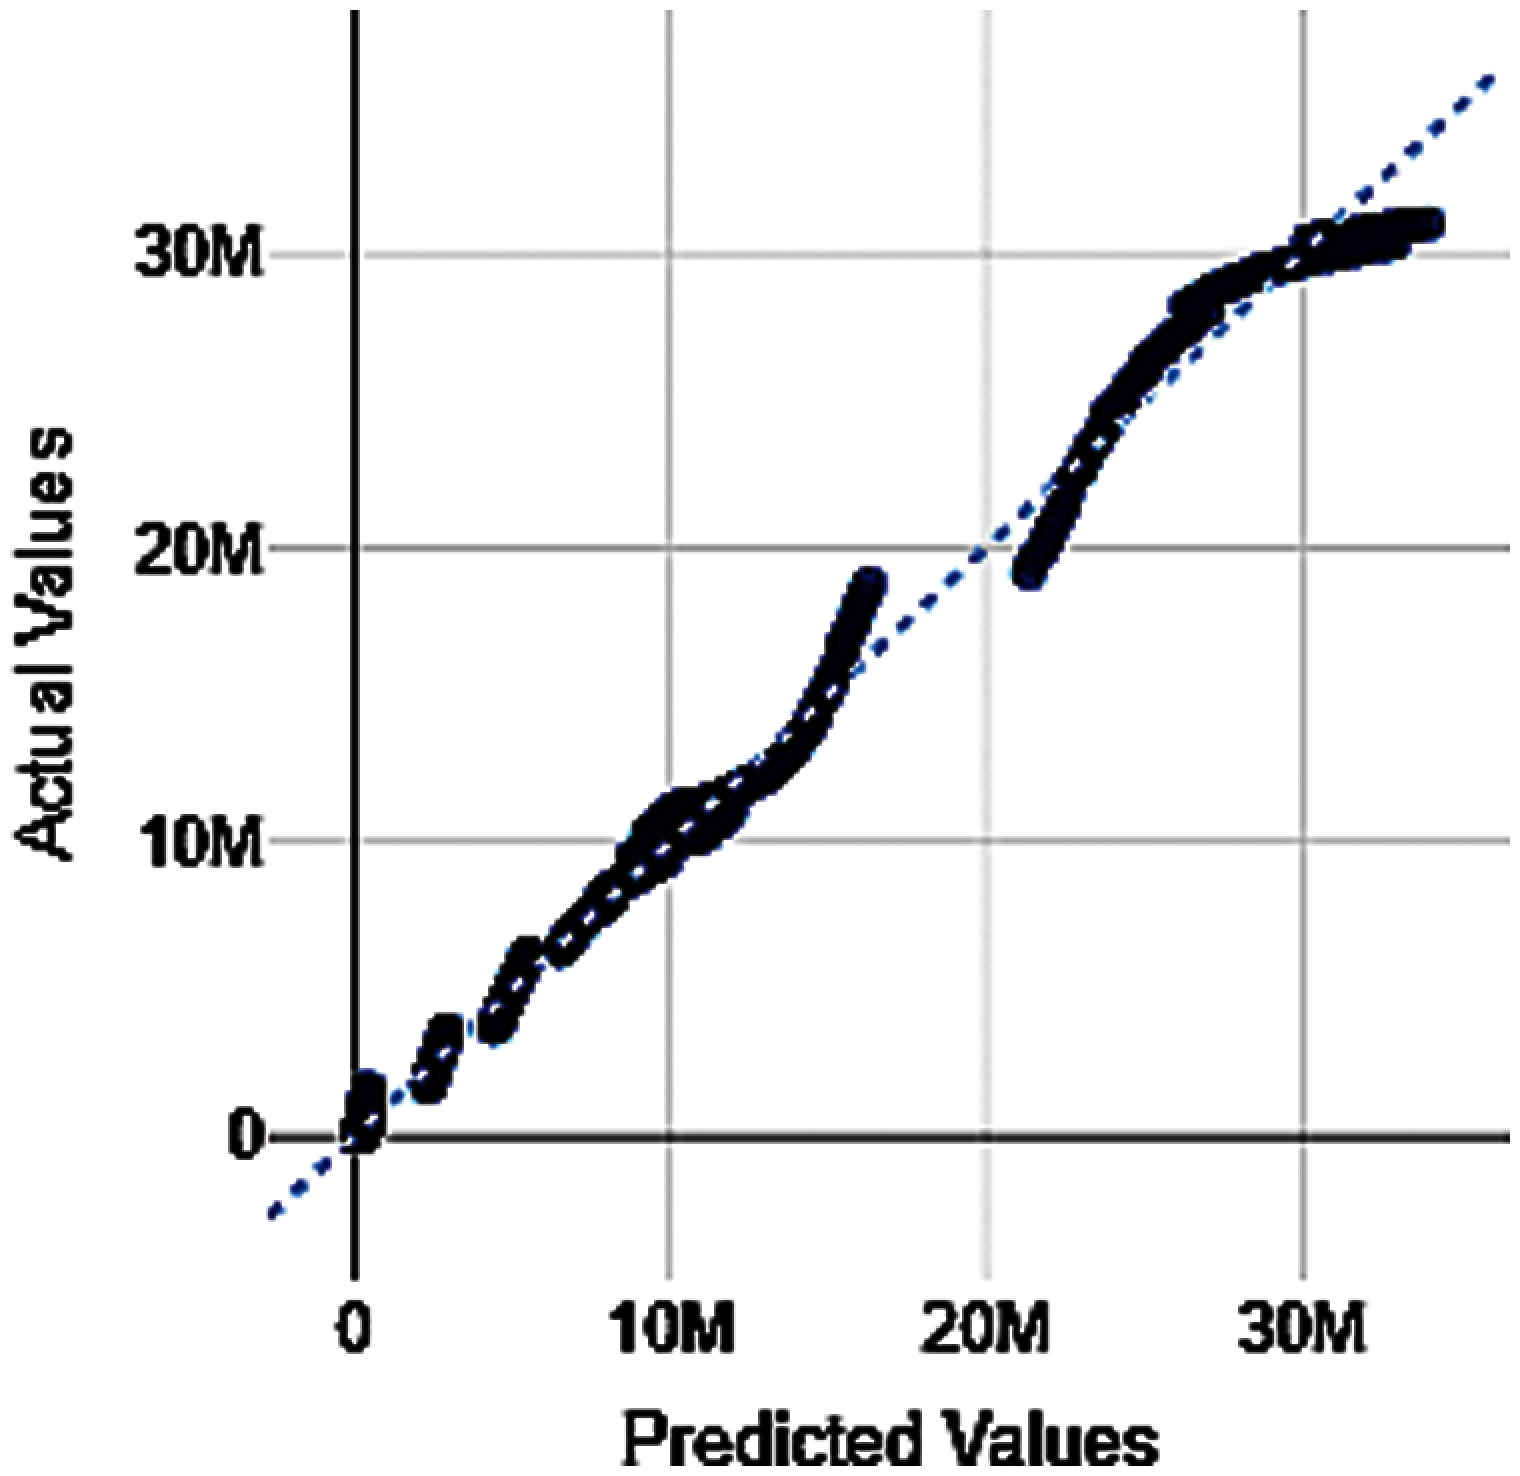
Figure 10: Cumulative new cases prediction using poisson distribution
Fig. 3 shows that from end of May 2021 there will be a decrease in the number of daily cases and Fig. 4 shows the trend analysis of new cases. NeuralProphet plotted the observed values of the time series (the blue line) and the forecasted values (orange line) from January 2021 until last week of September 2021. The results show that the predicted value of daily new cases of Poisson Distribution and Random Forest model indicated in Figs. 5 and 6 respectively, are showing more deviation in comparison to the NeuralProphet model.
Fig. 7 shows the cumulative new case prediction using the proposed model that leads to the conclusion that in the last week of May, the second wave effect would start to decrease. Fig. 8 shows the trend analysis of cumulative new cases. It is visible from the results that the NeuralProphet model is much better in terms of prediction as compared to Random Forest and Poisson Distribution model as depicted in Figs. 9 and 10, respectively.
Based upon both the comparative analysis so performed while considering daily and cumulative cases and it may be summarized that the predicted values using the NeuralProphet model are highly accurate when compared to remaining considered models.
5.2 Comparative Analysis of Death Cases
Similar to predicting the confirmed new cases, the next concern of the proposed approach was to predict the death cases as well. For forecasting the values, the daily death cases and cumulative death cases considered and their associated statistical details are shown in Fig. 11; this statistical description has been further used for analysis and predictions. The results are depicted in Figs. 12–19 while comparing the death case count obtained from considered models with the NeuralProphet model. Moreover, in a real-life scenario, the values cannot show any symmetrical pattern, it can show the number of fluctuations throughout the time span and is wisely indicated in Fig. 12 using the NeuralProphet model. Fig. 12 shows that at the end of May 2021 there will be a decrease in the number of daily death cases; NeuralProphet plotted the observed values of our time series (the blue line) and the forecasted values (orange line) from January 2021 until last week of September 2021. The corresponding trend analysis has been depicted in Fig. 13.
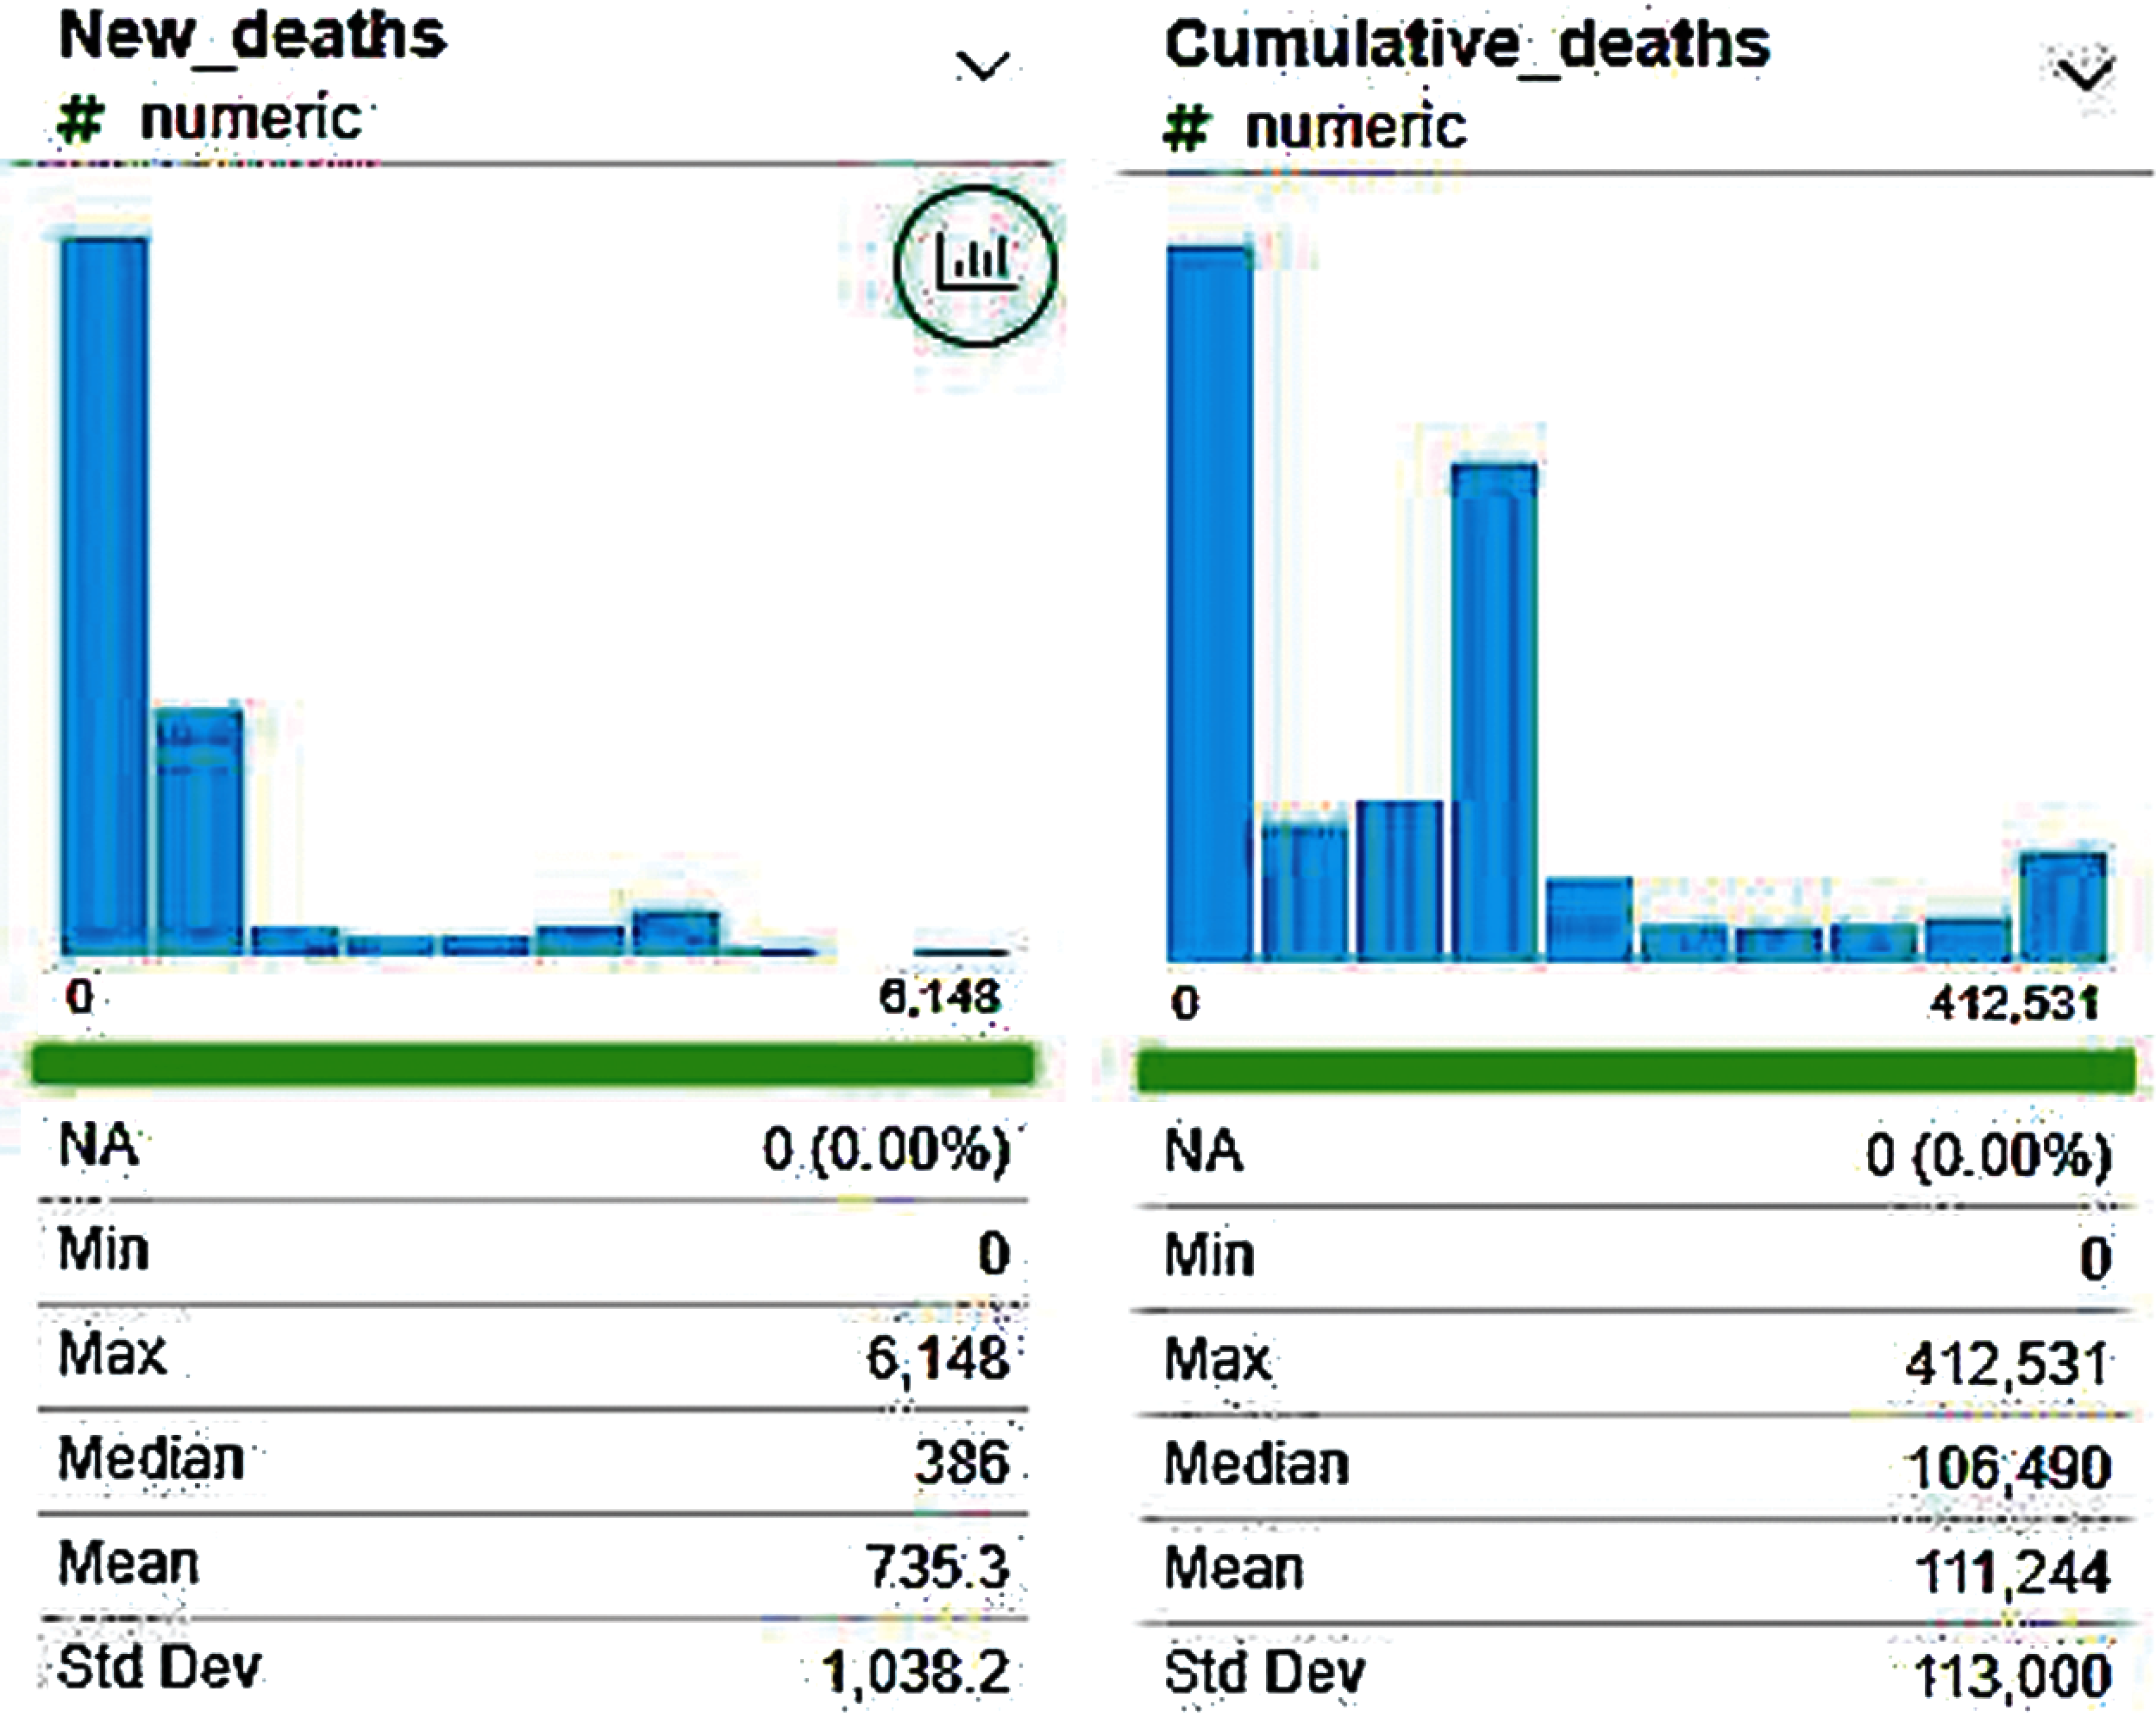
Figure 11: Daily death and cumulative death cases analysis
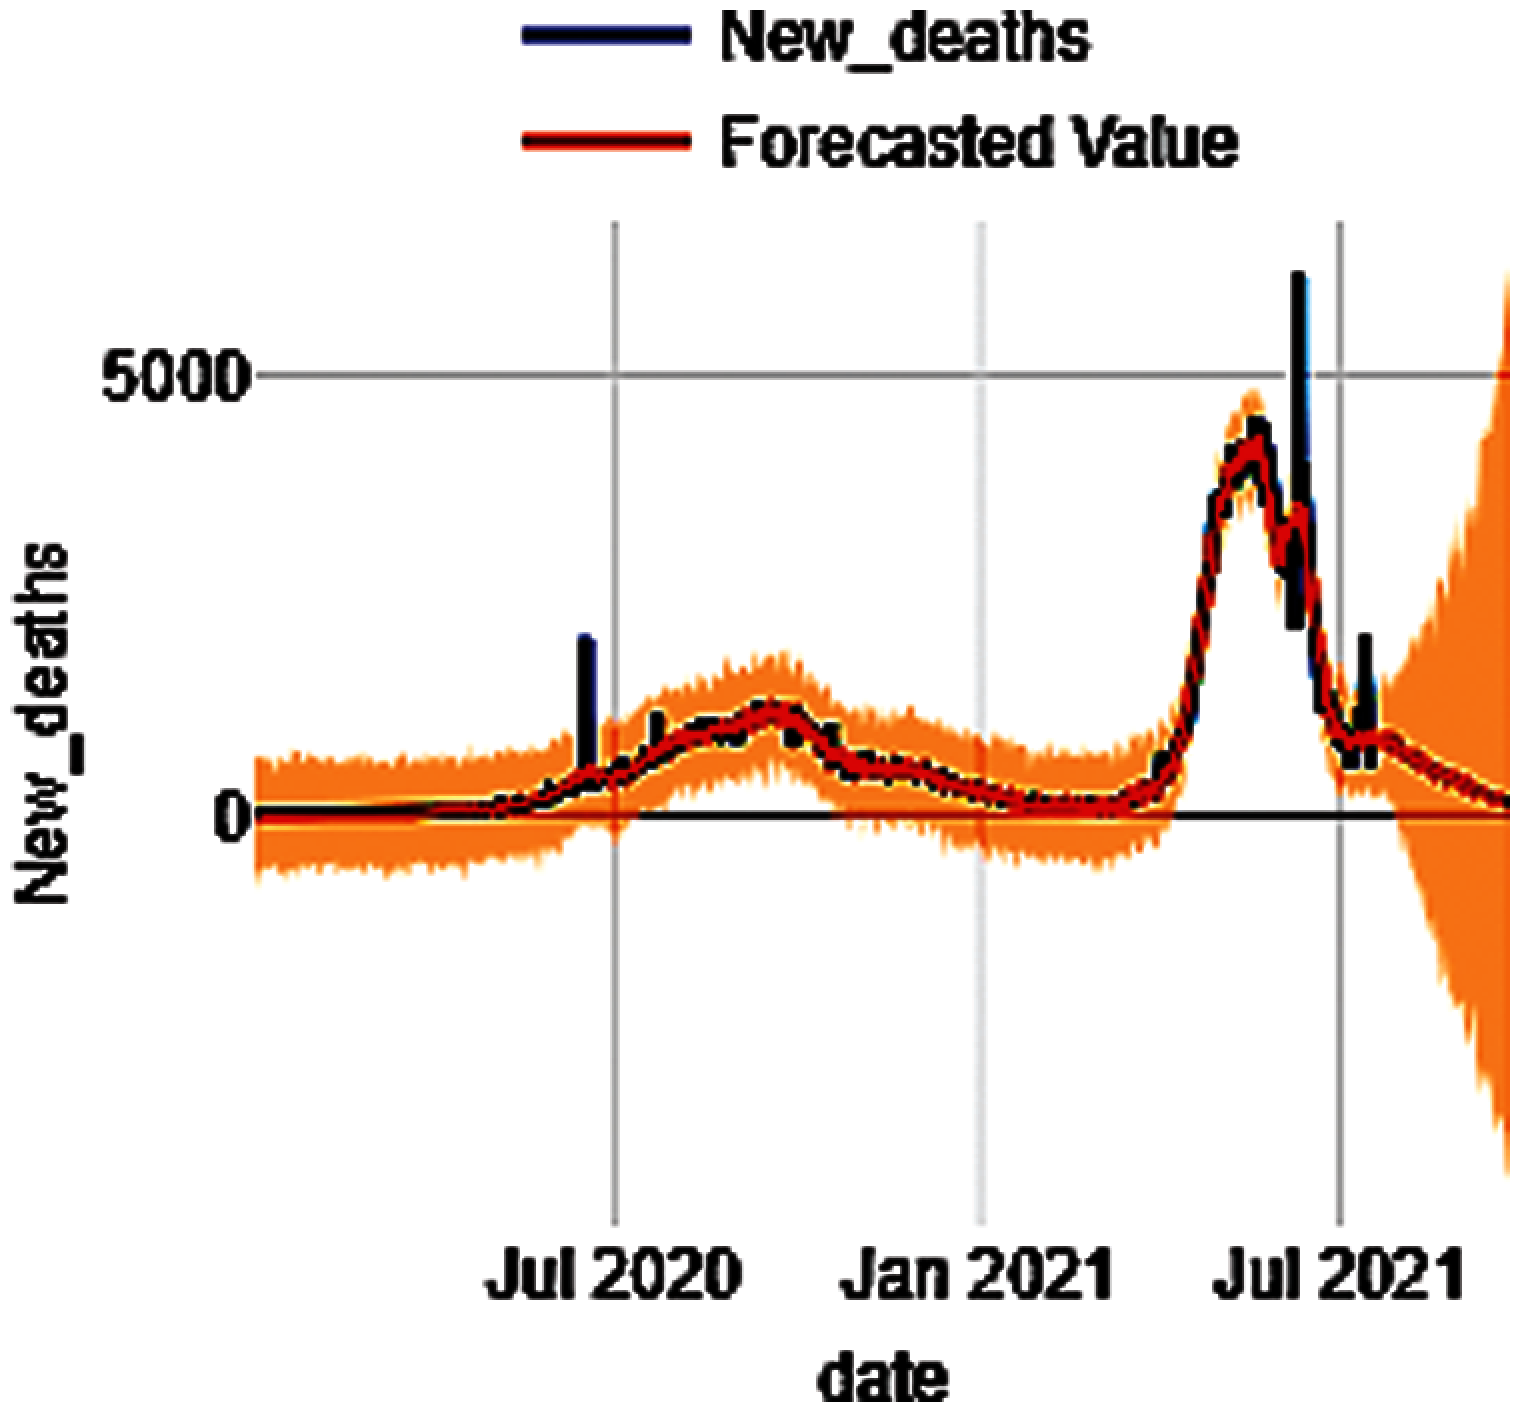
Figure 12: Daily death cases prediction using neuralprophet
However, the results obtained from the Random Forest and Poisson Distribution model, illustrated in Figs. 14 and 15 are showing that similar patterns are not appropriate for describing the case counts. Henceforth, it may be summarized that the proposed model can be considered as a reliable option for predicting and forecasting the death case values.
Fig. 16 shows the cumulative death case predictions using the NeuralProphet model that is forecasting that in the month of June the second wave effect would start to decrease. Fig. 17 shows a trend analysis of cumulative death cases. Based upon the comparative analysis so performed while considering the cumulative death cases too, it may be summarized that the predicted values using the proposed model are highly accurate when compared to and model represented in Figs. 18 and 19, respectively. Ergo, the efficacy of the proposed model is quite evident from the results and moreover, the results clearly show the supremacy of the NeuralProphet model in terms of accuracy of results too.
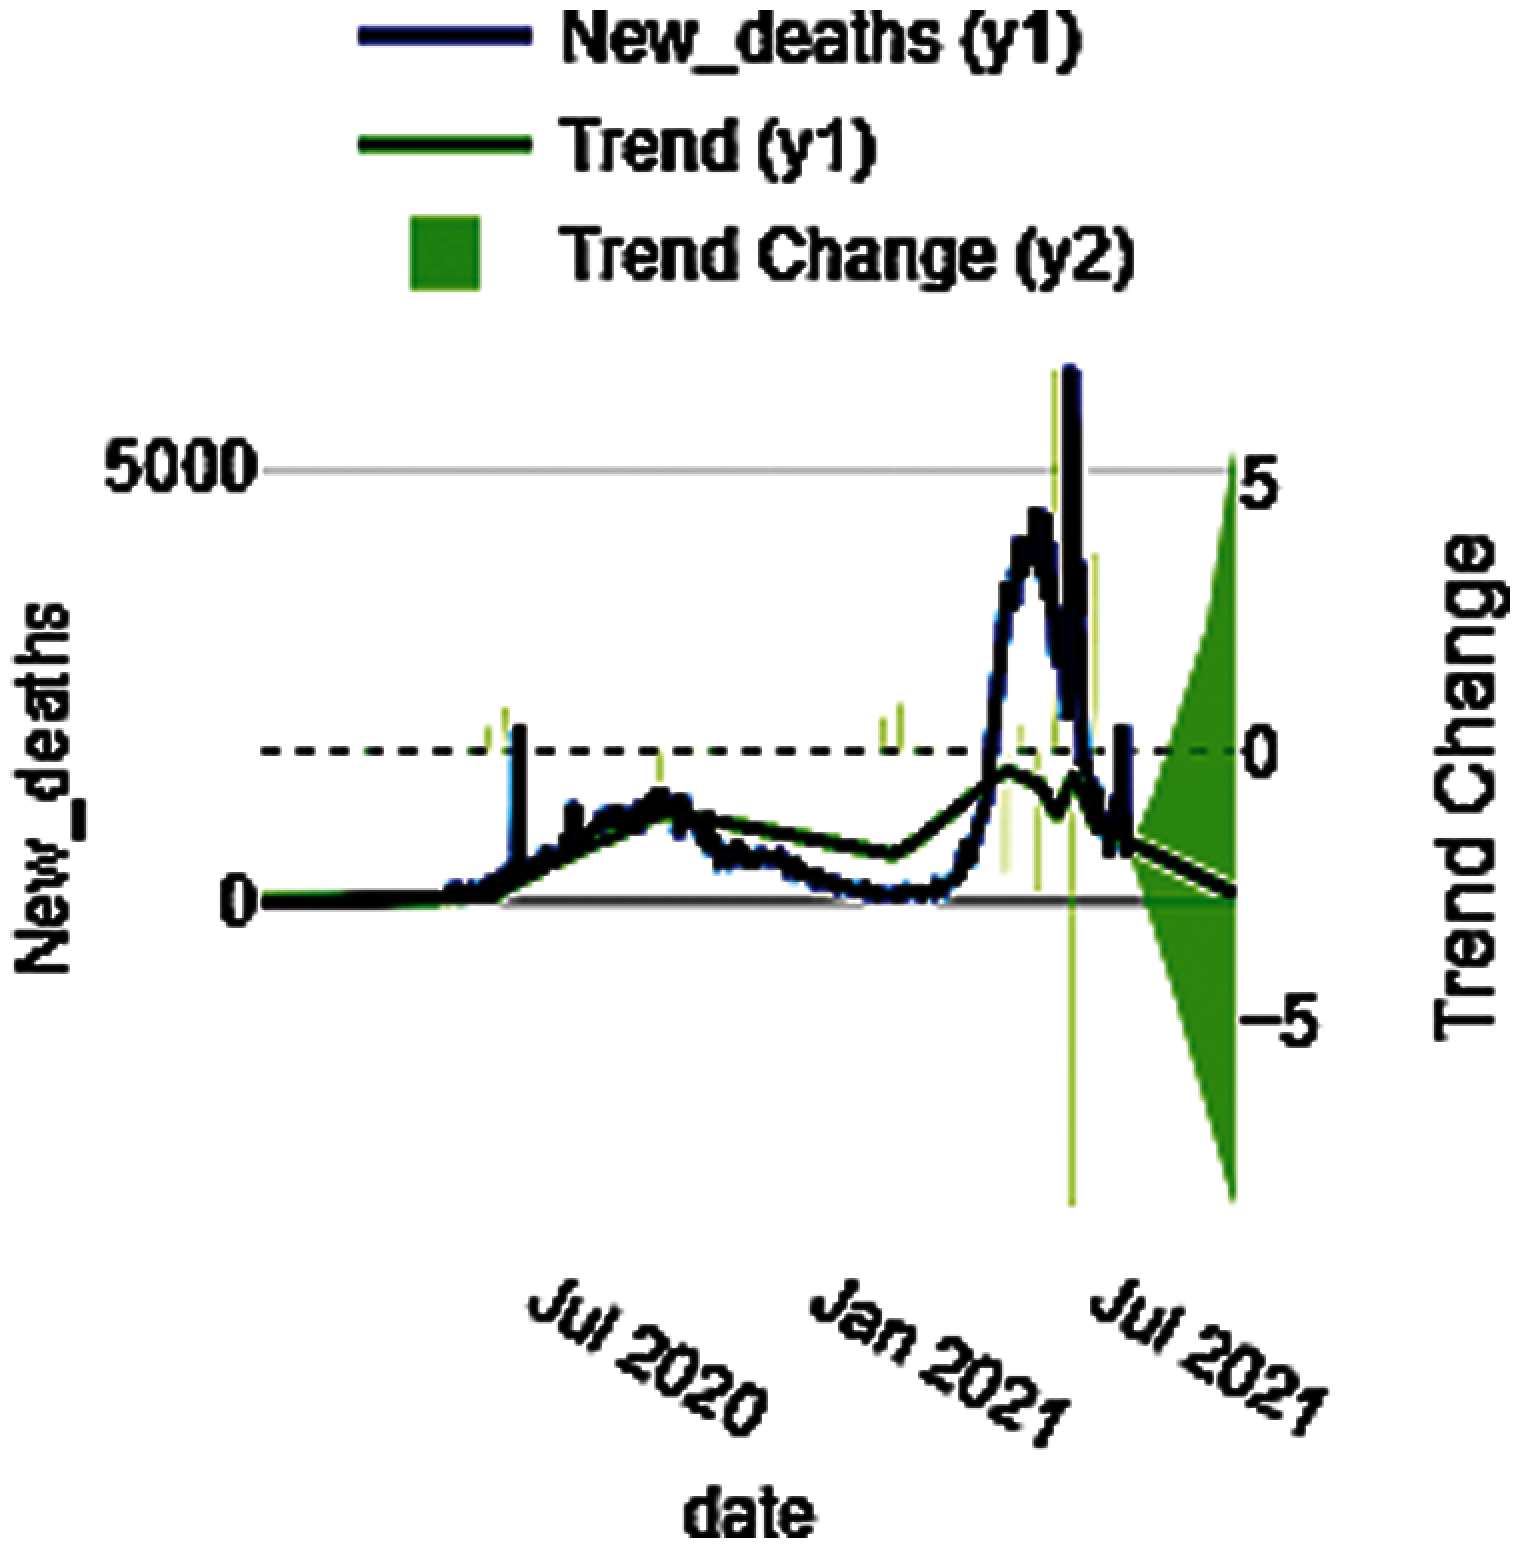
Figure 13: Daily new death cases trends analysis using neuralprophet
Figure 14: Death cases prediction using random forest
Figure 15: Death cases prediction using poisson distribution
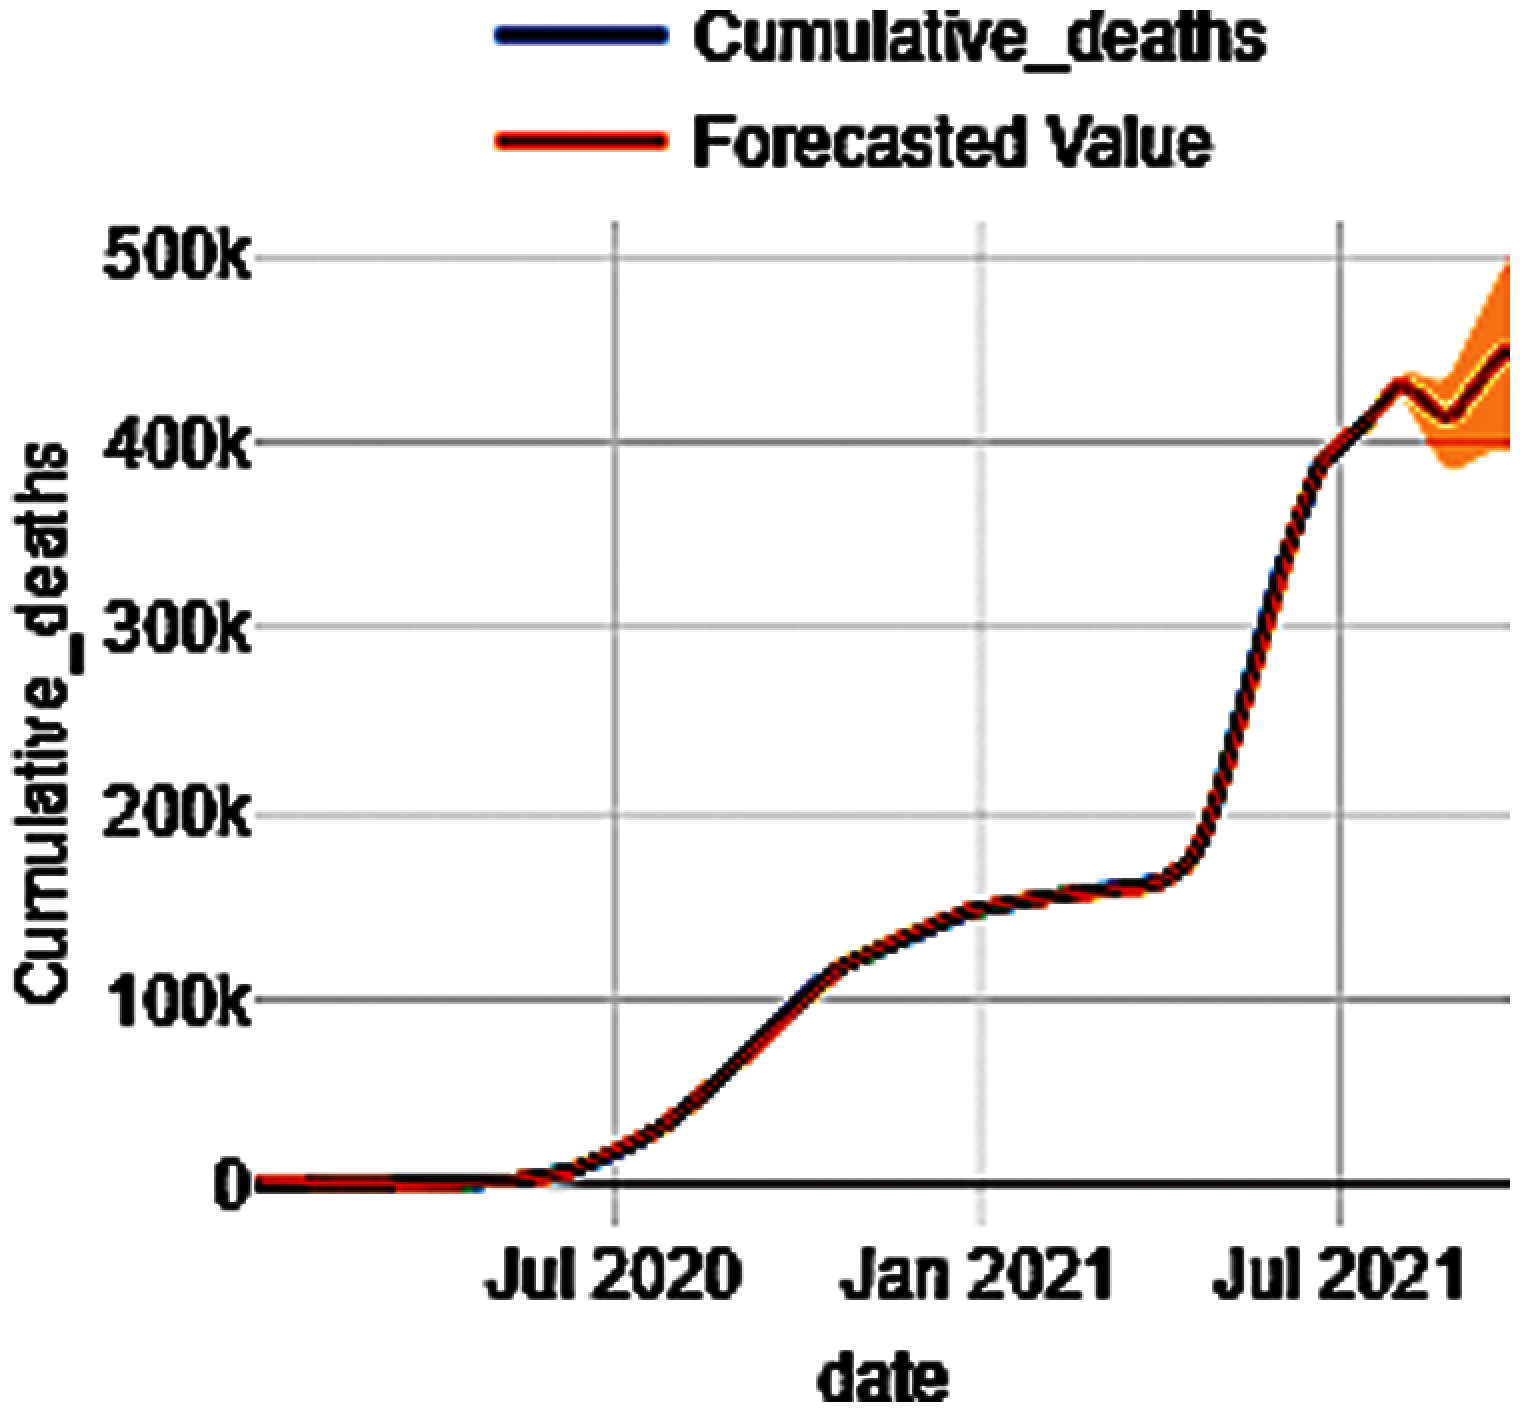
Figure 16: Cumulative death case prediction using neuralprophet
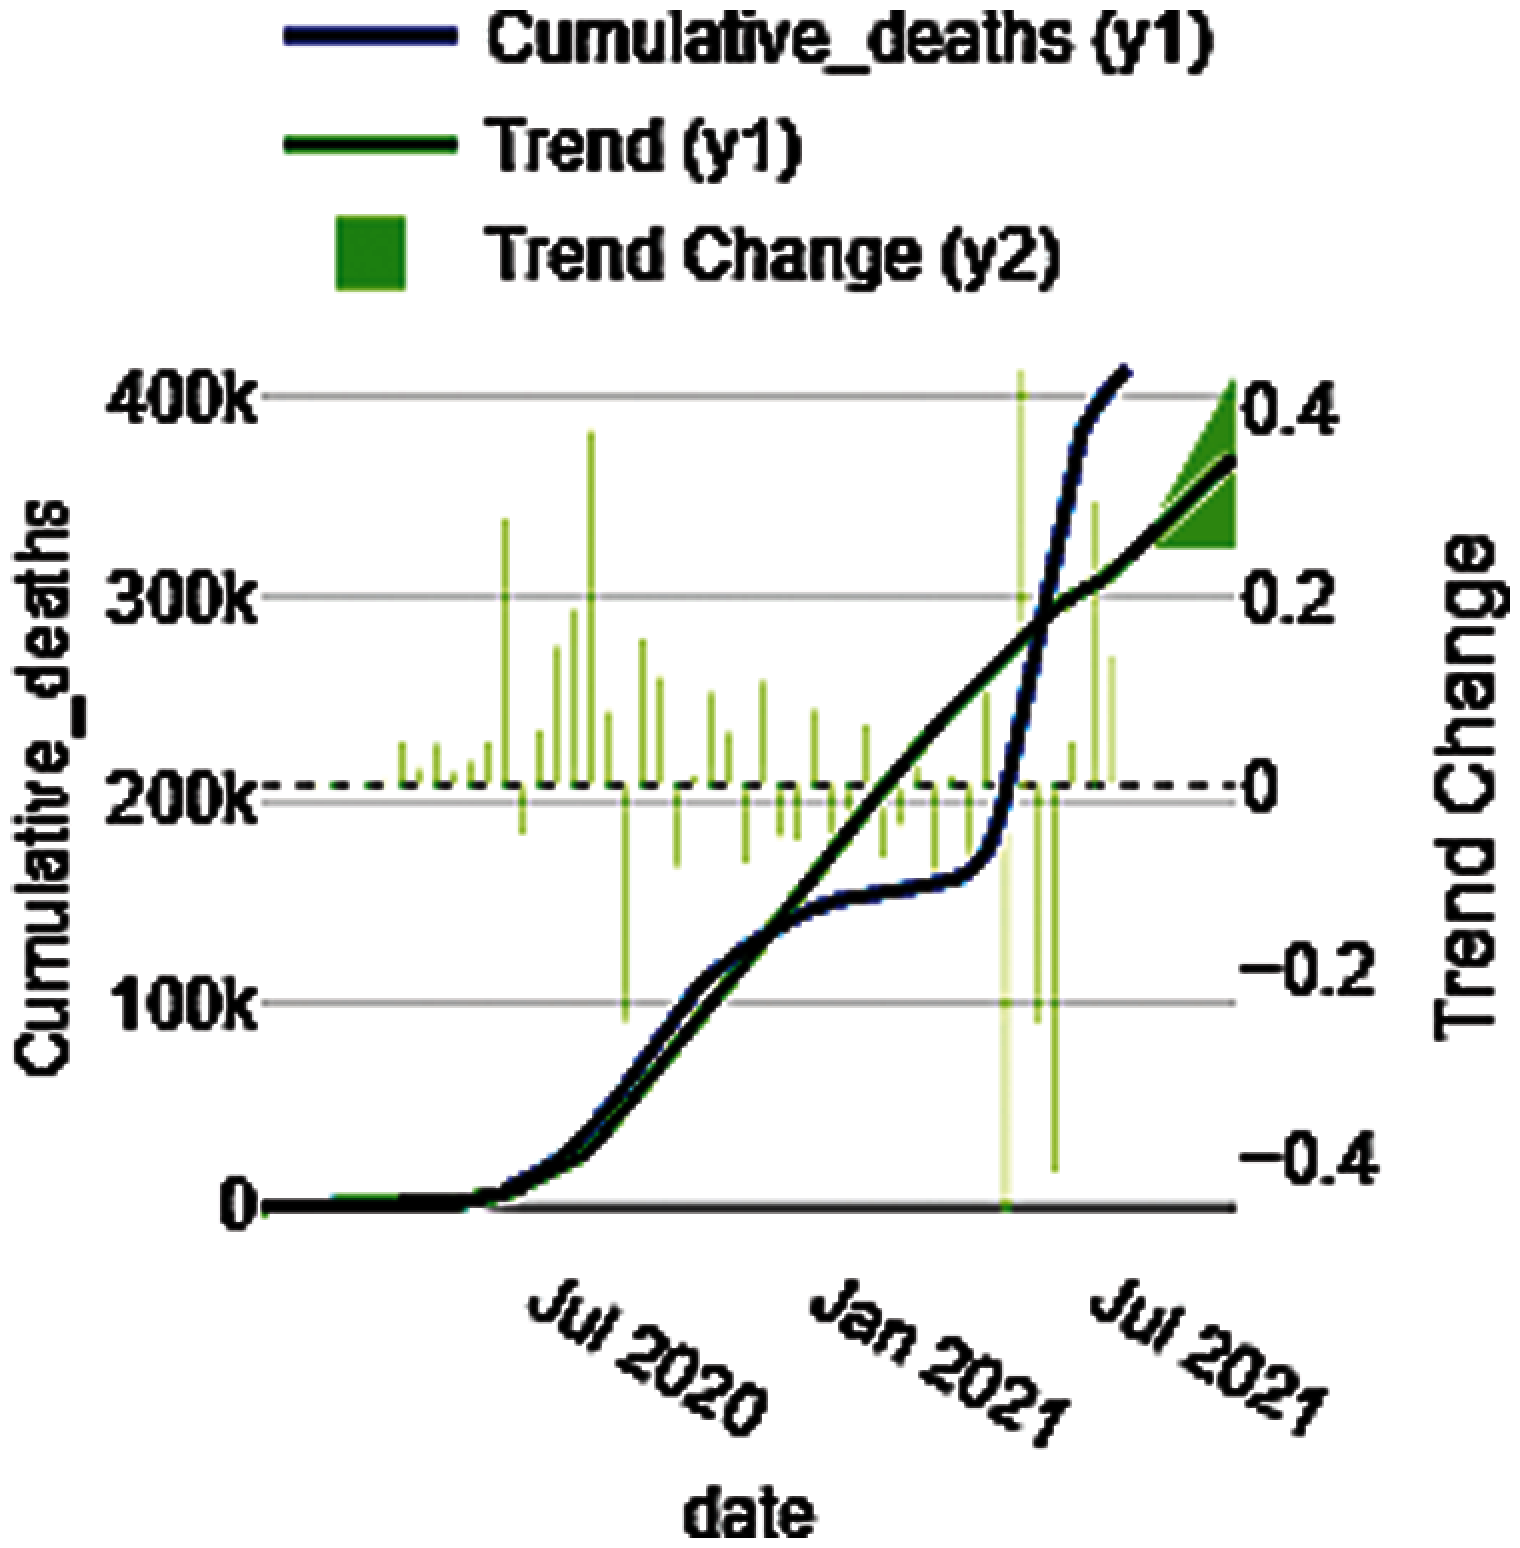
Figure 17: Cumulative death cases trends analysis using neuralprophet
Figure 18: Cumulative death case prediction using random forest
Figure 19: Cumulative death case prediction using poisson distribution
Fig. 20 shows the correlation matrix that has been drawn to analyze the correlation between new cases and new death cases (value may be observed from the Fig. 20, is 0.85). It is trivial more or less than when the new cases would increase; it would increase the count of new death cases as well since the recovery rate cannot be 100% even if effective medication exists. Likewise, the cumulative_cases and cumulative_death_cases may be correlated whose value is 0.99 since these values are also having direct relation to each other which means the count raise of cumulative cases would invoke the count increase in cumulative death cases too.
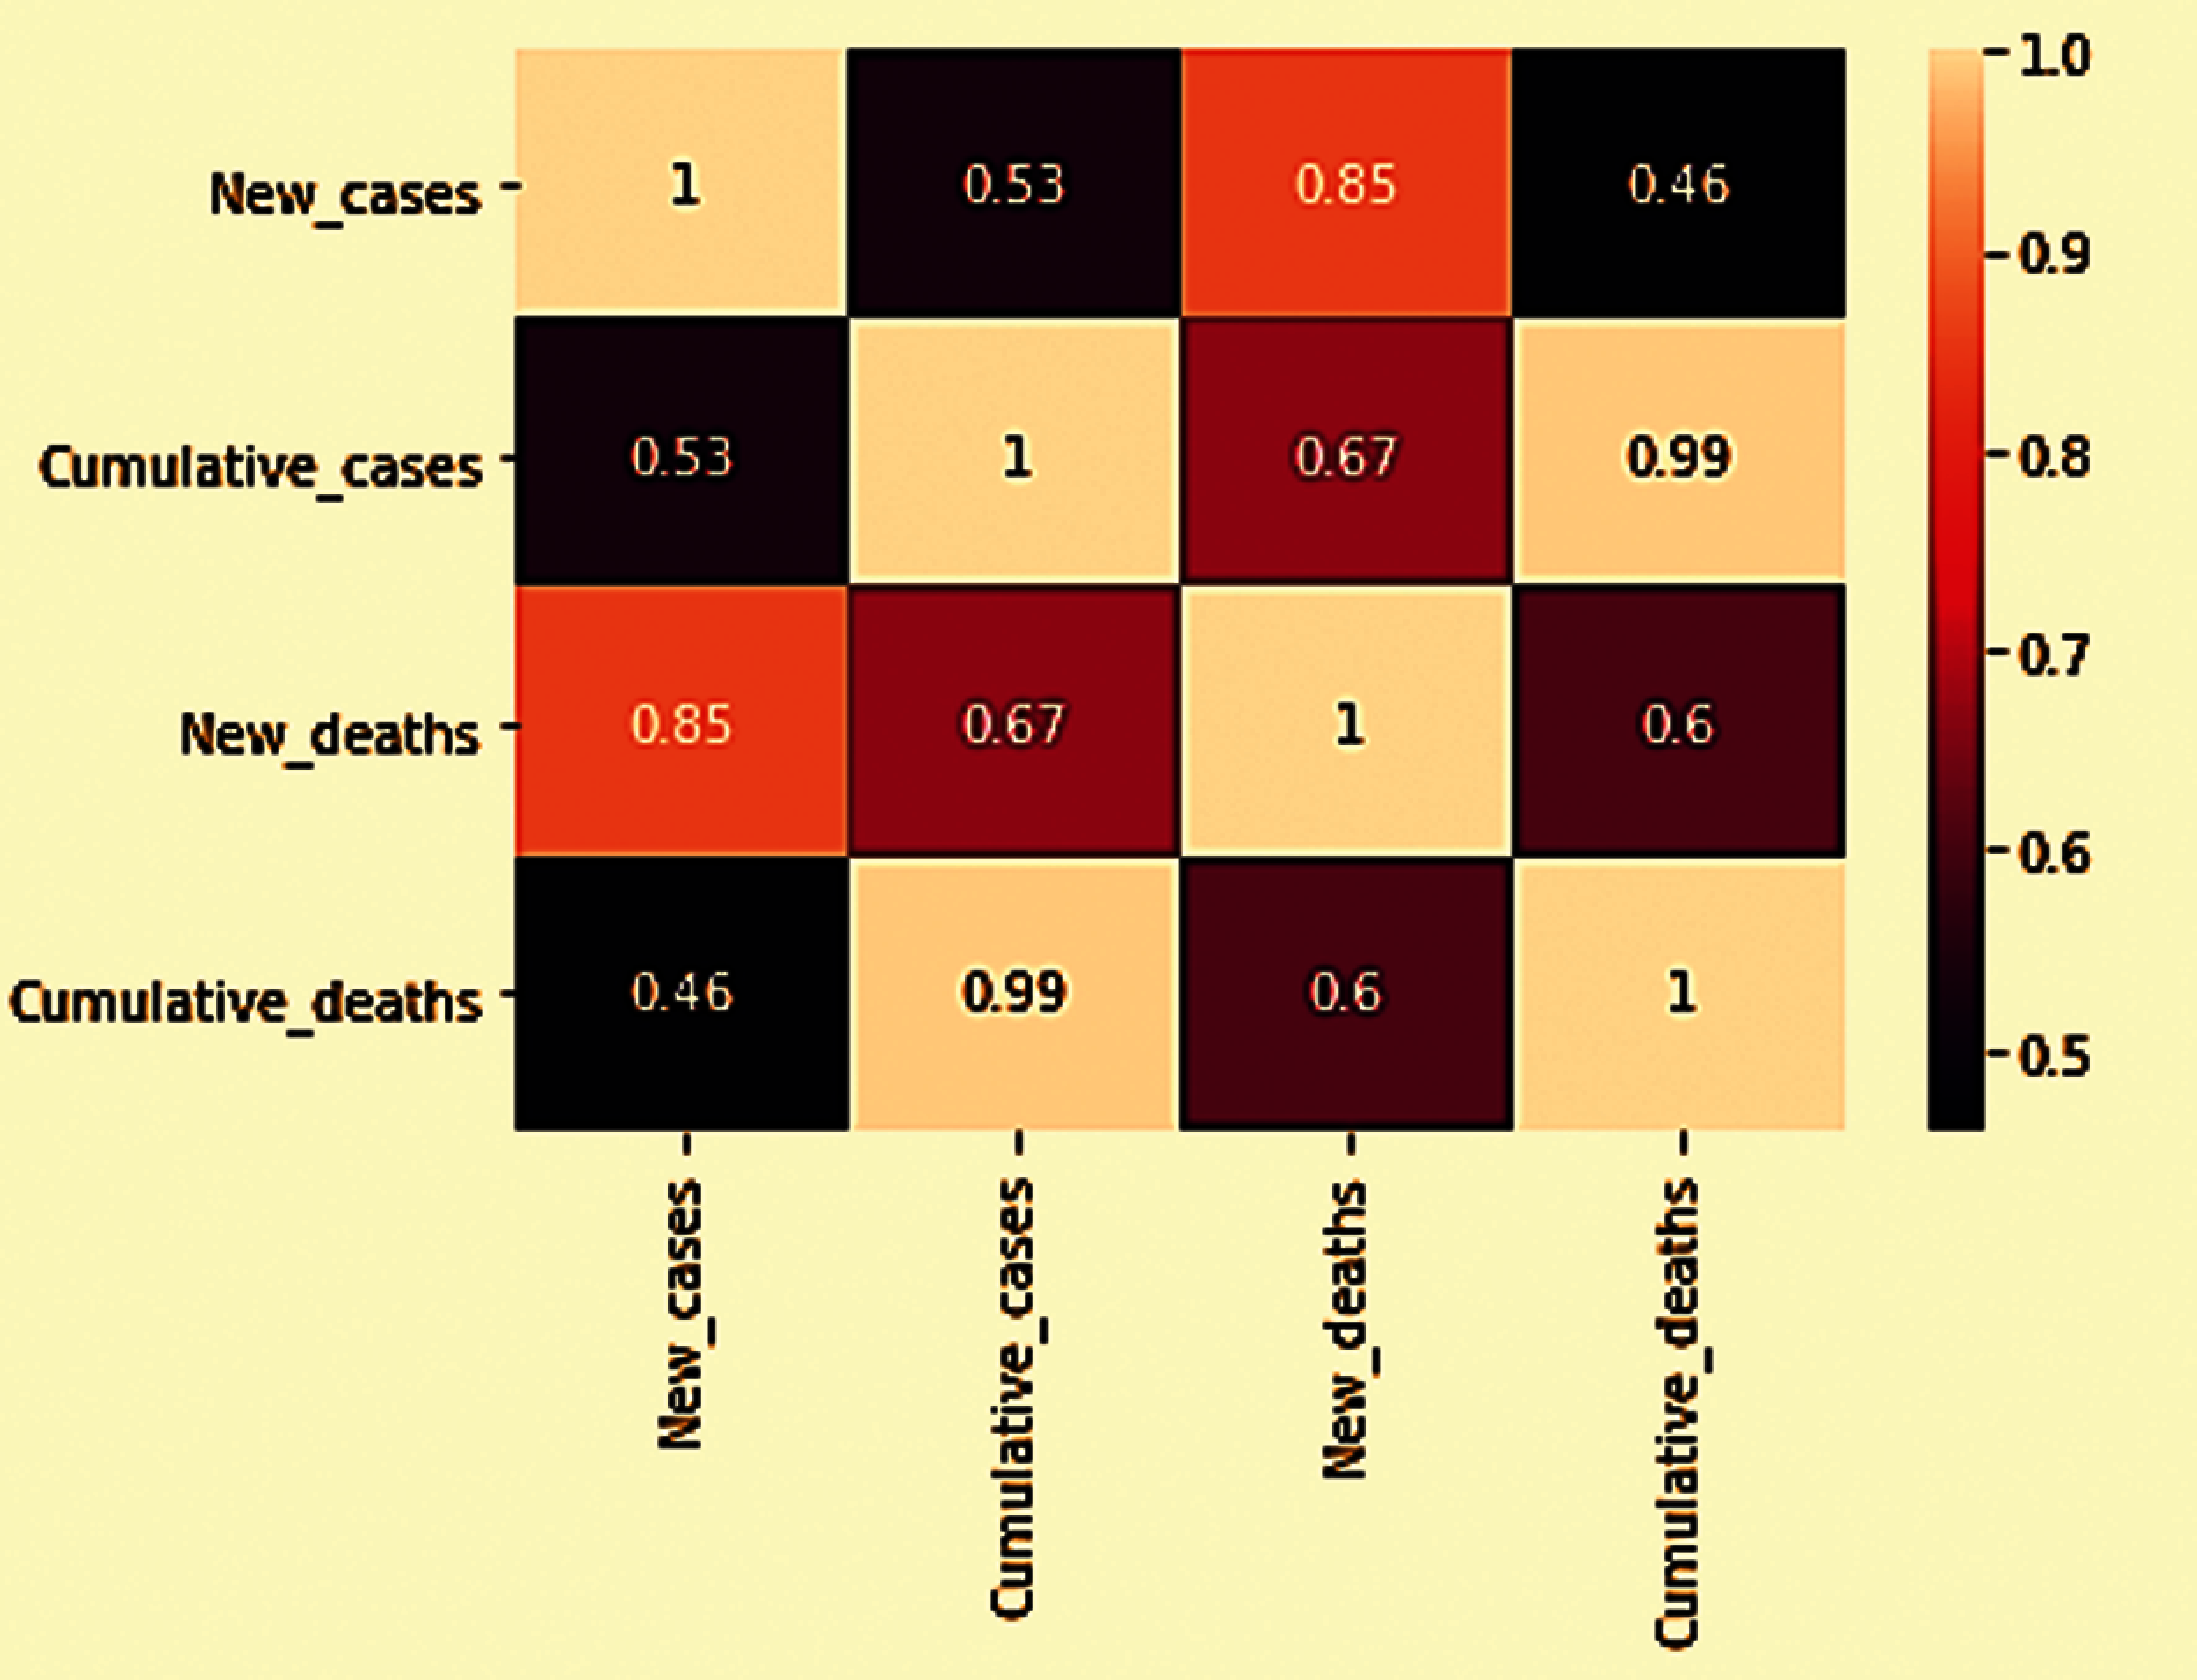
Figure 20: Correlation matrix of new cases, new death cases, cumulative cases and cumulative death cases
The dataset has been split such that the testing may also be performed after training it using the considered model. Therefore, 70% of data has been used for training purposes and the remaining 30% of data has been utilized for testing the attained results to validate the efficacy and effectiveness of the developed model. The time-series data of India has been considered for evaluating the trends of covid cases. The dataset has been trained using three algorithms, namely the NeuralProphet model for predictions and forecasting and Random Forest and Poisson Distribution model for comparative analysis. The programming language was used for the training of the models. Moreover, the model accuracy was computed using scale-dependent error.
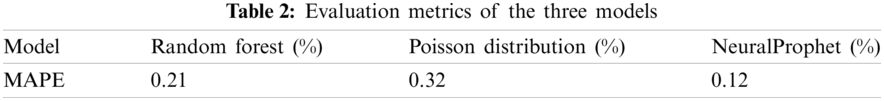
The evaluation metrics for all the three models attained using the Mean Absolute Percentage Error (MAPE) are statistically described in Tab. 2 and therefore, the accuracy so obtained for all the three models (in percent) are given in Tab. 3.
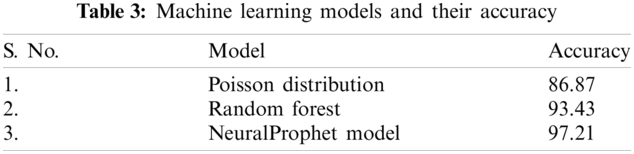
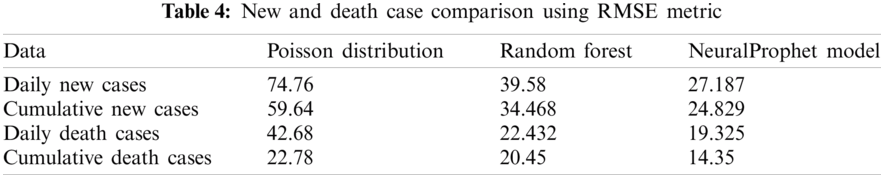
It is quite evident from the attained values and results that the NeuralProphet model outperformed the remaining two models namely Poisson Distribution as well as Random Forest model; ergo, it may be considered for fetching the trends of covid cases and outbreak for India. The performance metric i.e., Root Mean Square Error (RMSE) is also calculated and compared. The RMSE factor is directly affecting the reliability value in single time-series forecasting and the objective is to minimize the error factor to increase the accuracy value.
The performance of the models has been calculated using a valid dataset of confirmed cases and deceased cases of COVID-19 and comparison are represented in Tab. 4. The lower the value of considered parameters, the higher is the accuracy in the obtained and predicted results. The reliability comparisons of the three models are represented in Tab. 5. The residual quality is the difference between calculated actual values and predicted values using RMSE metrics.
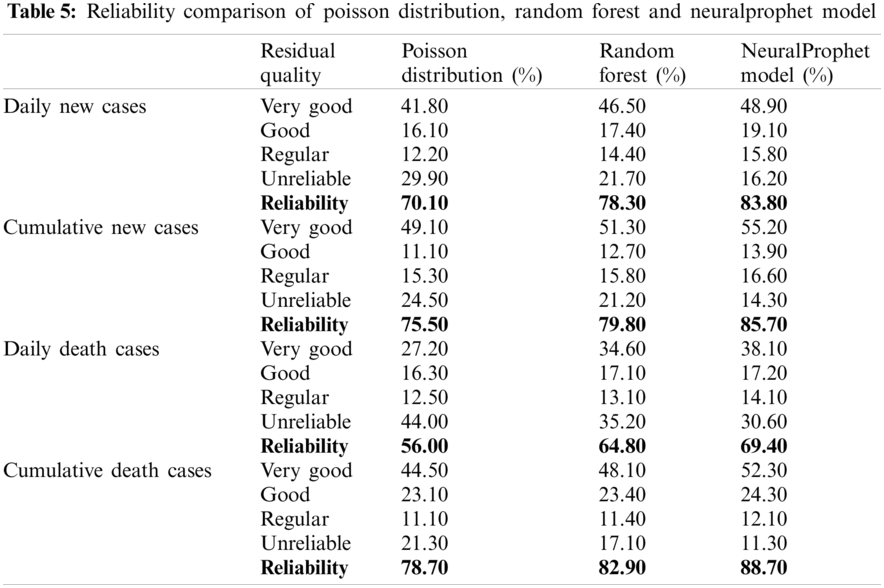
The statistics may be interpreted as follows: the predictions classified as ‘very good’ comprise remnants or residuals not more than 15% of the actual value of mean away from its analogous and equivalent actual counterpart, the next referred to as ‘good’ falls in the range of 15% to 25%, similarly, predictions classified as ‘regular’ lies in the range of 25% to 40% of the mean value; however, as and when the prediction has remanent beyond 40% of the actual mean value, it is categorized as ‘unreliable’. Henceforth, it may be deduced from the statement that the predictions comprising residuals below 40% are considered to be ‘reliable’; ergo, to depict the summary metric, the overall reliability is taken into consideration that further comprises ‘very good, ‘good’ and ‘reliable predictions’.
The proposed prediction using the NeuralProphet model yielded accurate results when compared to Poisson Distribution, and the Random Forest model. However, to accommodate the outbreak that the government has taken the necessary steps along with the availability of effective treatment or medication, the result of the outbreak would drastically decline which might affect the predicted values in the proposed approach.
The COVID-19 pandemic has traumatized the entire world in the extreme way possible while leading to the state of health emergencies worldwide. To get an insight into the proliferation as well as the repercussions of the epidemic, it has become the need-of-an-hour to evoke some sort of advancements in the prediction models for the outbreak to improvise the accuracy in the results. Moreover, the existing standard epidemiological models failed to yield accurate statistical values to accommodate long-term predictions; the reason being the non-availability of crucial data as well as the high uncertainty level. Therefore, in the proposed approach, it has been put forward to predict the end of the pandemic by predicting the confirmed cases as well as the death cases based upon the eighteen months datasets considered for attaining the predictive results. The proposed scheme has been developed with the help of an advanced time-series model while making use of hyper-parameters tuning. The attained results indicate that the proposed method based upon the NeuralProphet model got successful in attaining pretty accurate predictions. The accuracy using the NeuralProphet-based model is better than the other two models while predicting the number of confirmed cases and death cases. Furthermore, predictions also indicated that the confirmed cases would start to decline in May 2021 and the epidemic would come to an end by September 2021 in India. The proposed work may be extended to perform real-time live forecasting that could be best implemented using various advanced deep learning approaches or reinforcement learning models. The results would better ensue its real-life utility if few realistic parameters may be imbibed with the approaches namely, human behavior, vaccinations or doses, various government policies.
Acknowledgement: This research was supported by Taif University Researchers supporting Project Number (TURSP-2020/254), Taif University, Taif, Saudi Arabia.
Funding Statement: The authors would like to express their gratitude to Taif University, Taif, Saudi Arabia for providing administrative and technical support. This work was supported by the Taif University Researchers supporting Project Number (TURSP-2020/254).
Conflicts of Interest: The authors declare that they have no conflicts of interest to report regarding the present study.
1. K. Chakraborty and P. Maity, “COVID-19 outbreak: Migration, effects on society, global environment and prevention,” Science of the Total Environment, vol. 5, no. 6, pp. 1388–1396, 2020. [Google Scholar]
2. B. McKay, J. Calfas and T. Ansari, “Coronavirus declared pandemic by world health organization,” Wall Street Journal, vol. 5, no. 6, pp. 1–7, 2020. [Google Scholar]
3. N. Zhu, D. Zhang, W. Wang, X. Li and B. Yang et al., “A novel coronavirus from patients with pneumonia in China, 2019,” New England Journal of Medicine, vol. 382, pp. 727–733, 2020. [Google Scholar]
4. Z. Luo, M. J. Y. Ang, S. Y. Chan, Z. Yi and Y. Y. Goh et al., “Combating the coronavirus pandemic: Early detection, medical treatment, and a concerted effort by the global community,” Research, vol. 2020, pp. 35, 2020. [Google Scholar]
5. C. Massaroni, A. Nicolo, D. L. Presti, M. Sacchetti and S. Silvestri et al., “Contact-based methods for measuring respiratory rate,” Sensors, vol. 19, no. 4, pp. 908, 2019. [Google Scholar]
6. H. A. S. Hashmi and H. M. Asif, “Early detection and assessment of Covid-19,” Frontiers in Medicine, vol. 7, pp. 311, 2020. [Google Scholar]
7. S. Hyun, P. Kaewprag, C. Cooper, B. Hixon and S. Moffatt-Bruce, “Exploration of critical care data by using unsupervised machine learning,” Computer Methods and Programs in Biomedicine, vol. 194, pp. 105507, 2020. [Google Scholar]
8. V. Volpert, M. Banerjee and S. Petrovskii, “On a quarantine model of coronavirus infection and data analysis,” Mathematical Modelling of Natural Phenomena, vol. 15, pp. 24, 2020. [Google Scholar]
9. A. Farzad and T. A. Gulliver, “Unsupervised log message anomaly detection,” ICT Express, vol. 6, no. 3, pp. 229–237, 2020. [Google Scholar]
10. M. Hauskrecht, I. Batal, M. Valko, S. Visweswaran and G. F. Cooper et al., “Outlier detection for patient monitoring and alerting,” Journal of Biomedical Informatics, vol. 46, no. 1, pp. 47–55, 2013. [Google Scholar]
11. E. Dong, H. Du and L. Gardner, “An interactive web-based dashboard to track COVID-19 in real time,” Lancet Infectious Diseases, vol. 20, no. 5, pp. 533–534, 2020. [Google Scholar]
12. F. T. Liu, K. M. Ting and Z. H. Zhou, “Isolation-based anomaly detection,” ACM Transactions on Knowledge Discovery from Data, vol. 6, no. 1, pp. 1–39, 2012. [Google Scholar]
13. S. Chawla, M. Mittal, M. Chawla and L. M. Goyal, “Corona virus-SARS-CoV-2: An insight to another way of natural disaster,” EAI Endorsed Transactions on Pervasive Health and Technology, vol. 6, no. 22, pp. 164823, 2020. [Google Scholar]
14. S. Tuli, S. Tuli, R. Tuli and S. S. Gill, “Predicting the growth and trend of COVID-19 pandemic using machine learning and cloud computing,” Internet of Things, vol. 11, pp. 100222, 2020. [Google Scholar]
15. V. K. R. Chimmula and L. Zhang, “Time series forecasting of COVID-19 transmission in Canada using LSTM networks,” Chaos, Solitons & Fractals, vol. 135, pp. 109864, 2020. [Google Scholar]
16. P. Melin, J. C. Monica, D. Sanchez and O. Castillo, “Multiple ensemble neural network models with fuzzy response aggregation for predicting COVID-19 time series: The case of Mexico,” Healthcare, vol. 8, no. 2, pp. 181, 2020. [Google Scholar]
17. A. F. D. M. Batista, J. L. Miraglia, T. H. R. Donato and A. D. P. C. Filho, “COVID19 diagnosis prediction in emergency care patients: A machine learning approach,” In Hospital Israelita Albert Einstein-Big Data Analytics, Sao Paulo, Brazil: University of Sao Paulo, pp. 1–14, 2020. [Google Scholar]
18. Z. Ceylan, “Estimation of COVID-19 prevalence in Italy, Spain, and France,” Science of the Total Environment, vol. 729, pp. 138817, 2020. [Google Scholar]
19. R. Salgotra, M. Gandomi and A. H. Gandomi, “Time series analysis and forecast of the COVID-19 pandemic in India using genetic programming,” Chaos, Solitons & Fractals, vol. 138, pp. 109945, 2020. [Google Scholar]
20. D. Tiwari and B. S. Bhati, “A deep analysis and prediction of COVID-19 in India: Using ensemble regression approach,” Artificial Intelligence and Machine Learning for COVID-19, vol. 924, pp. 97–109, 2020. [Google Scholar]
21. K. Sultan, I. Naseer, R. Majeed, D. Musleh and M. A. S. Gollapalli et al., “Supervised machine learning-based prediction of COVID-19,”Computers, Materials and Continua, vol. 69, no. 1, pp. 21–34, 2021. [Google Scholar]
22. W. El-Shafai, N. A. El-Hag, G. M. El-Banby, A. A. M. Khalaf and N. F. Soliman et al., “An efficient CNN-based automated diagnosis framework from COVID-19 CT images,” Computers, Materials and Continua, vol. 69, no. 1, pp. 1323–1341, 2021. [Google Scholar]
23. A. Bani-Hani, A. Lavorel and N. Bessadet, “Data-fusion for epidemiological analysis of covid-19 variants in UAE,” Computers, Materials and Continua, vol. 68, no. 3, pp. 3895–3913, 2021. [Google Scholar]
24. S. S. Aljameel, I. U. Khan, N. Aslam, M. Aljabri and E. S. Alsulmi, “Machine learning-based model to predict the disease severity and outcome in COVID-19 patients,” Scientific Programming, vol. 2021, ID 5587188, pp. 1–10, 2021. [Google Scholar]
25. R. Kafieh, R. Arian, N. Saeedizadeh, Z. Amini and N. D. Serej et al., “COVID-19 in Iran: Forecasting pandemic using deep learning,” Computational and Mathematical Methods in Medicine, vol. 2021, ID 6927985, pp. 1–16, 2021. [Google Scholar]
26. S. F. Ardabili, A. Mosavi, P. Ghamisi, F. Ferdinand and A. R. Varkonyi-Koczy et al., “Covid-19 outbreak prediction with machine learning,” Algorithms, vol. 13, no. 10, pp. 249, 2021. [Google Scholar]
27. M. Khayyat, K. Laabidi, N. Almalki and M. Al-zahrani, “Time series facebook prophet model and python for COVID-19 outbreak prediction,” Computers Materials & Continua, vol. 67, no. 3, pp. 3781–3793, 2021. [Google Scholar]
28. R. Mangayarkarasi, C. Vanmathi, M. Z. Khan, A. Noorwali and R. Jain et al., “COVID19: Forecasting air quality index and particulate matter (PM2. 5),” Computers Materials & Continua, vol. 6, no. 3, pp. 3363–3380, 2021. [Google Scholar]
29. M. Gupta, R. Jain, S. Arora, A. Gupta and M. J. Awan et al., “AI-Enabled COVID-19 outbreak analysis and prediction: Indian states vs. union territories,” Computers, Materials and Continua, vol. 67, no. 1, pp. 933–950, 2021. [Google Scholar]
30. Y. Zoabi, S. Deri-Rozov and N. Shomron, “Machine learning-based prediction of COVID-19 diagnosis based on symptoms,” Npj Digital Medicine, vol. 4, no. 1, pp. 1–5, 2021. [Google Scholar]
31. T. H. Aldhyani, M. Alrasheed, M. Y. Alzahrani and H. Ahmed, “Deep learning and holt-trend algorithms for predicting COVID-19 pandemic,” Computers, Materials and Continua, vol. 67, no. 2, pp. 2141–2160, 2021. [Google Scholar]
 | This work is licensed under a Creative Commons Attribution 4.0 International License, which permits unrestricted use, distribution, and reproduction in any medium, provided the original work is properly cited. |