DOI:10.32604/cmc.2022.021830
| Computers, Materials & Continua DOI:10.32604/cmc.2022.021830 | |
| Article |
A Hybrid Deep Learning Scheme for Multi-Channel Sleep Stage Classification
1School of Sciences, University of Southern Queensland, Toowoomba, 4350, Australia
2School of Mechanical and Electrical Engineering, University of Southern Queensland, Toowoomba, 4350, Australia
*Corresponding Author: Siuly Siuly. Email: Siuly@usq.edu.au
Received: 16 July 2021; Accepted: 03 September 2021
Abstract: Sleep stage classification plays a significant role in the accurate diagnosis and treatment of sleep-related diseases. This study aims to develop an efficient deep learning based scheme for correctly identifying sleep stages using multi-biological signals such as electroencephalography (EEG), electrocardiogram (ECG), electromyogram (EMG), and electrooculogram (EOG). Most of the prior studies in sleep stage classification focus on hand-crafted feature extraction methods. Traditional hand-crafted feature extraction methods choose features manually from raw data, which is tedious, and these features are limited in their ability to balance efficiency and accuracy. Moreover, most of the existing works on sleep staging are either single channel (a single-lead EEG may not contain enough information) or only EEG signal based which can not reveal more complicated physical features for reliable classification of various sleep stages. This study proposes an approach to combine Convolutional Neural Networks (CNNs) and Gated Recurrent Units (GRUs) that can discover hidden features from multi-biological signal data to recognize the different sleep stages efficiently. In the proposed scheme, the CNN is designed to extract concealed features from the multi-biological signals, and the GRU is employed to automatically learn the transition rules among different sleep stages. After that, the softmax layers are used to classify various sleep stages. The proposed method was tested on two publicly available databases: Sleep Heart Health Study (SHHS) and St. Vincent's University Hospital/University College Dublin Sleep Apnoea (UCDDB). The experimental results reveal that the proposed model yields better performance compared to state-of-the-art works. Our proposed scheme will assist in building a new system to deal with multi-channel or multi-modal signal processing tasks in various applications.
Keywords: Convolutional neural networks; gated recurrent unit; sleep stages; multi-channel
Sleep plays a fundamental biological requirement in human health and its quality can impact both mental, and physical fitness. A sufficient good quality sleep at night can enhance the learning ability and performance of a person. Inadequate or a lack of proper sleep increases the occurrence of various sleep-related diseases and disorders, such as Insomnia, Snoring, Obstructive Sleep Apnoea, Sleep Hypoventilation, Bruxism, and Narcolepsy [1–4]. Sleep disorders may also contribute to other health conditions, including diabetes, obesity, mental health problems, cardiovascular disease and cognitive function [5]. Therefore, there is an urgent demand for accurate and efficient automatic sleep staging to improve sleep evaluation for the diagnosis of sleep disorders.
Sleep stage classification has been used to better understand sleep and sleep-related disorders in past years. Polysomnography (PSG) is a practical approach to analyse sleep patterns and sleep-related disorders. PSG consist of multiple bio-signals, such as the electroencephalogram (EEG), electrocardiography (ECG), electromyography (EMG), and electrooculogram (EOG) of a patient asleep over an entire night [6]. Subsequently, each short period of 30 s is called epochs, and is categorized into different sleep stages. Typically, sleep stages are scored visually by trained sleep technicians based on the sleep guidelines of Rechtschaffen and Kales (R&K) [6] and the American Academy of Sleep Medicine (AASM) [7] for the PSG records collected overnight. According to the R&K criteria, the periods of sleep are divided into six different stages: wake (W), rapid eye movement (REM), stages 1–4 (S1, S2, S3 and S4). In the AASM criteria, S3 and S4 are combined as a slow-wave sleep (SWS) stage as there is no apparent difference between S3 and S4 [8]. This paper is designed to develop an automatic computer-aided method for efficient classification of sleep stages from PSG because physicians or clinicians visually examine PSG recordings to diagnose sleep problems and because these methods are time-consuming, burdensome, and subject to human error, decision-making reliability is reduced.
In recent years, numerous studies have been conducted on sleep stage classification. Most studies have used a single EEG channel data. However, a single-lead EEG cannot contain sufficient information for all categories of sleep stages for proper diagnosis of sleep disorders as a single channel cannot provide all necessary information of various categories of sleep stages. Multi-category bio-signals can reveal more significant physical features than a single-channel data for efficient classification of different sleep stages. Hence, this study intends to use multi-biological signal data for the reliable classification of sleep stages. Most of the existing approaches of sleep stage classification on both single EEG channel data and multi-modal signal data are based on hand-crafted feature extraction methods (commonly chosen to suit the researcher's expertise). These traditional methods extract hand-engineered features through time-domain, frequency-domain, and time-frequency analysis, then concatenate these features into feature vectors and feed the feature vectors into vector-based classifiers such as support vector machine (SVM), decision tree, and random forest. For instance, in the multi-stage sleep classification, the applied handcrafted feature extraction methods are time-frequency distributions [9], graph theory [10,11], wavelet transform [12], signal modeling [13], improved model based essence features [14] and traditional machine learning techniques are support vector machine [15], ensemble learning based classifiers [16], random under sampling boosting [17], and discriminant analysis [18], etc. The hand-crafted feature extraction-based machine method cannot extract the deeply concealed characteristics from the signals using traditional machine learning methods because of its shallow architectures. Due to their single-layer construction, traditional machine learning methods cannot efficiently classify sleep stages from deep hidden layers.
Recently a small number of research works have been performed on the sleep stage classification using deep learning algorithms. Deep learning algorithms used on sleep stage classifications are increasingly popular due to automatically generating features at multiple layers. In the deep learning networks, the raw sleep bio-signals are fed into well-designed neural networks to extract features and stage classifications. Huy and Navin used a joint classification-and-prediction model based on CNN applied on sleep stages classification using multi-channel signals [19]. The authors in [20] developed a deep convolutional network model using neurophysiological signals for automatic sleep stage classification. Sors and Bonnet designed a novel convolutional neural network (CNN) for sleep stages classification using raw single-channel EEG and reported a 0.87 accuracy [21]. Zhang and Xu proposed a multi-model integration model based on a deep neural network using multi-channel signals as input [22]. Reference [23] used a deep learning model based on CNNs and Recurrent neural networks (RNNs) for automatic sleep classification with a good performance. Zhang et al. [24] designed a novel deep learning model based on CNNs named fast discriminative complex-valued convolutional neural network (FDCCNN). The FDCCNN method combines a Fisher criterion and complex-valued backpropagation that improved any adverse effects of imbalance database and learning features. Furthermore, several state-of-the-art papers have made an essential contribution on dimensionality, reduction and signal decomposition methods which can improve the model performance. Sadiq et al. [25] proposed a framework that is explored by several combinations of the variational mode decomposition, multi-domain features obtained with linear regression, and cascade-forward neural network. This framework reports a 99.6% accuracy for subject-specific for motor imagery EEG tasks classification. This framework reports a 99.6% accuracy for subject-specific for motor imagery EEG tasks classification. The authors in [26] compare empirical wavelet transform combined with Principal component analysis, independent component analysis, linear discriminant analysis, and neighborhood component analysis methods that building a decoding approach on brain signals, which reports a great performance on increase the classification outcome of different imagery EEG signals by the selection of efficient features. Most of the existing deep learning-based schemes have only used one deep learning method for extracting and classifying features using EEG signal data. However, they did not consider any method for feature learning which would be essential to discover significant features for efficient classification. The methods are also limited in their ability to maintain a balance between efficiency and accuracy.
Hence this study introduces a new deep learning design combining CNN and RNN to acquire deep informative features from multiple biological signals (e.g., EEG, ECG, EMG, EOG) to efficiently classify multiple sleep stages. The CNN method is considered in this study as CNNs can extract high-level edge information directly related to the input features. RNNs can be trained to learn long-term dependencies such as transition rules that help sleep experts identify the following possible sleep stages from a sequence of PSG epochs. There are three types of RNN: ‘Gated Recurrent Unit (GRU)’, ‘Vanilla RNN’ and ‘Long-Short Term Memory (LSTM)’. This study considers GRU with the CNN model because GRU has fewer training parameters and high-performance generating ability and can eliminate the risk of vanishing gradient problems. In the proposed scheme, firstly, the CNN is designed to extract hidden important features from deep layers of EEG, ECG, EMG, and EOG signals, and then the extracted features are learned by GRU. Finally, the softmax classifier is applied to identify the various categories of sleep stages. The proposed approach is evaluated on two Sleep EEG databases.
The rest of this paper is organized as follows. Section 2 provides a brief description of two databases that are used in this study. Subsequently, this section presents the description of the proposed methods. Section 3 provides experimental results with their corresponding discussions, and Section 4 discusses the finding of the study and the conclusion is found in Section 5.
In this study, we used two public databases: St. Vincent's University Hospital/University College Dublin Sleep Apnoea (UCDDB) [27]; Sleep Heart Health Study (SHHS) [28]; A brief description of these databases are provided below:
The UCDDB includes the complete overnight PSG recording of 25 patients. In the experimental setup of this study, we considered one EEG signal (C4A1) with a sample rate of 128 Hz, two EOG signals with a sample rate of 64 Hz, and one EMG signal with a sample rate of 64 Hz. All sleep stages were scored following the R&K [3] rules. For this study, we used five sleep stages: Wake, stage 1, stage 2, stage 3, REM, removing the artifact, and the indeterminate stage. We merged stage 3 and stage 4 into stage 3.
The SHHS is a multi-center cohort study that determines the consequences of sleep-disordered breathing. This study consists of two databases: SHHS1; SHHS2. In this study, we used SHHS1 in this study. Each PSG recording was chosen with one EEG signal (C4A1) with a sample rate of 125 Hz, two EOG signals (EOGL and EOGR) with a sample rate of 50 Hz, and one EMG signal with a sample rate of 125 Hz. The annotation file scored by one expert was staged according to the R&K rules.
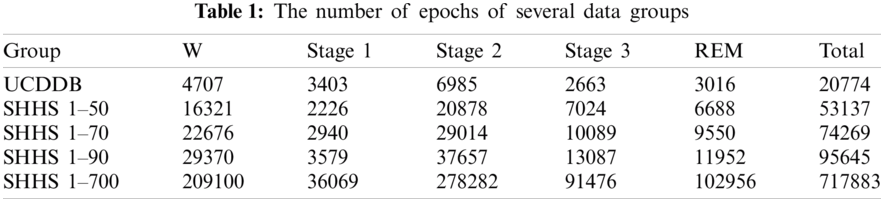
For this database, we also considered five sleep stages: Wake, stage 1, stage 2, stage 3, REM, combing stage 3 and stage 4 into stage 3 as with a like as UCDDB database. We randomly selected 50, 70, 90, and 700 PSG recordings from the SHHS1 database in this study. We did not consider all the recordings of PSG due to time complexity. Tab. 1 presents some epochs for several subject groups from the two databases used in this research.
The proposed methodology involves three main phases: data pre-processing; model design for feature extraction and feature learning; classification, and performance evaluation. Fig. 1 illustrates an architecture of the proposed plan for efficient identification of sleep stage from multi biological signal data.
In the pre-processing phase, we created a new data stream using multi biological signals: EEG, EOG, and EMG. We designed a seven-layer deep learning method using CNN with GRU for deep feature extraction and feature learning from the new data stream in the next phase. After that, we identified different sleep stages using the softmax classifier model. Finally, we evaluated the performance of the proposed scheme and made a decision based on the results.
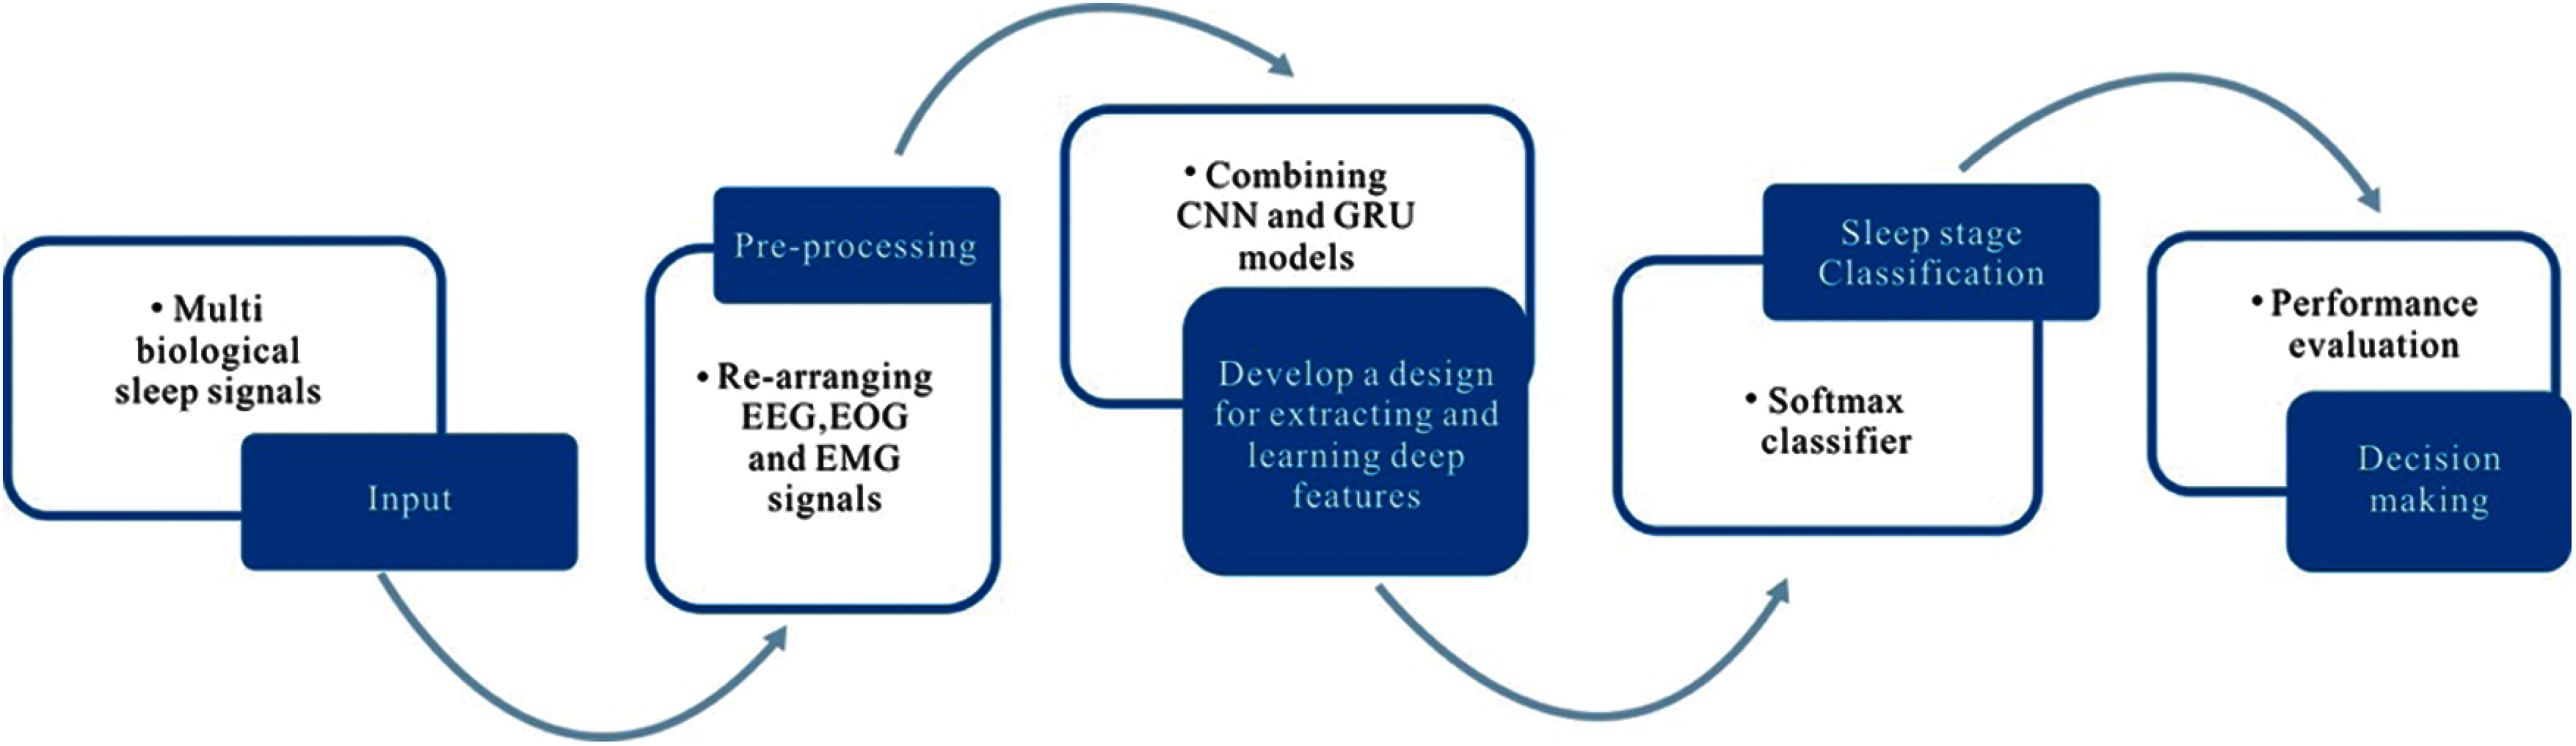
Figure 1: A structure of the proposed methodology for automatic classification of sleep stages from multi-channel biosignals
2.2.1 Pre-processing:Create a New Data Stream Using Four Channel Signals of EEG, EOG, and EMG
This section plans to create a new data stream, re-arranging the multi-channel biological signals into one data platform. This plan aims to use multi-channel signals to discover more significant information that can be used as the input of the proposed model for efficient sleep stage classification. Furthermore, the new data stream can save model training time in the experiments. Therefore, we can extract the data of the same epoch from different channels and then put them in one frame as a new data stream using independent input data. In this study, we used two databases: UCDDB and SHHS, and both have four independent channel signals: two EOG channels (EOGL, EOGR), one EMG, and one EEG. We concatenate all the epochs at the same time instance from all channels as a new epoch in the new data stream (for example: concatenating the first epoch in EOGL, the first epoch in EOGR, the first epoch in EMG, and the first epoch in EEG as the first epoch in the new data stream). Fig. 2 shows a clear picture on how the new data stream is formed.
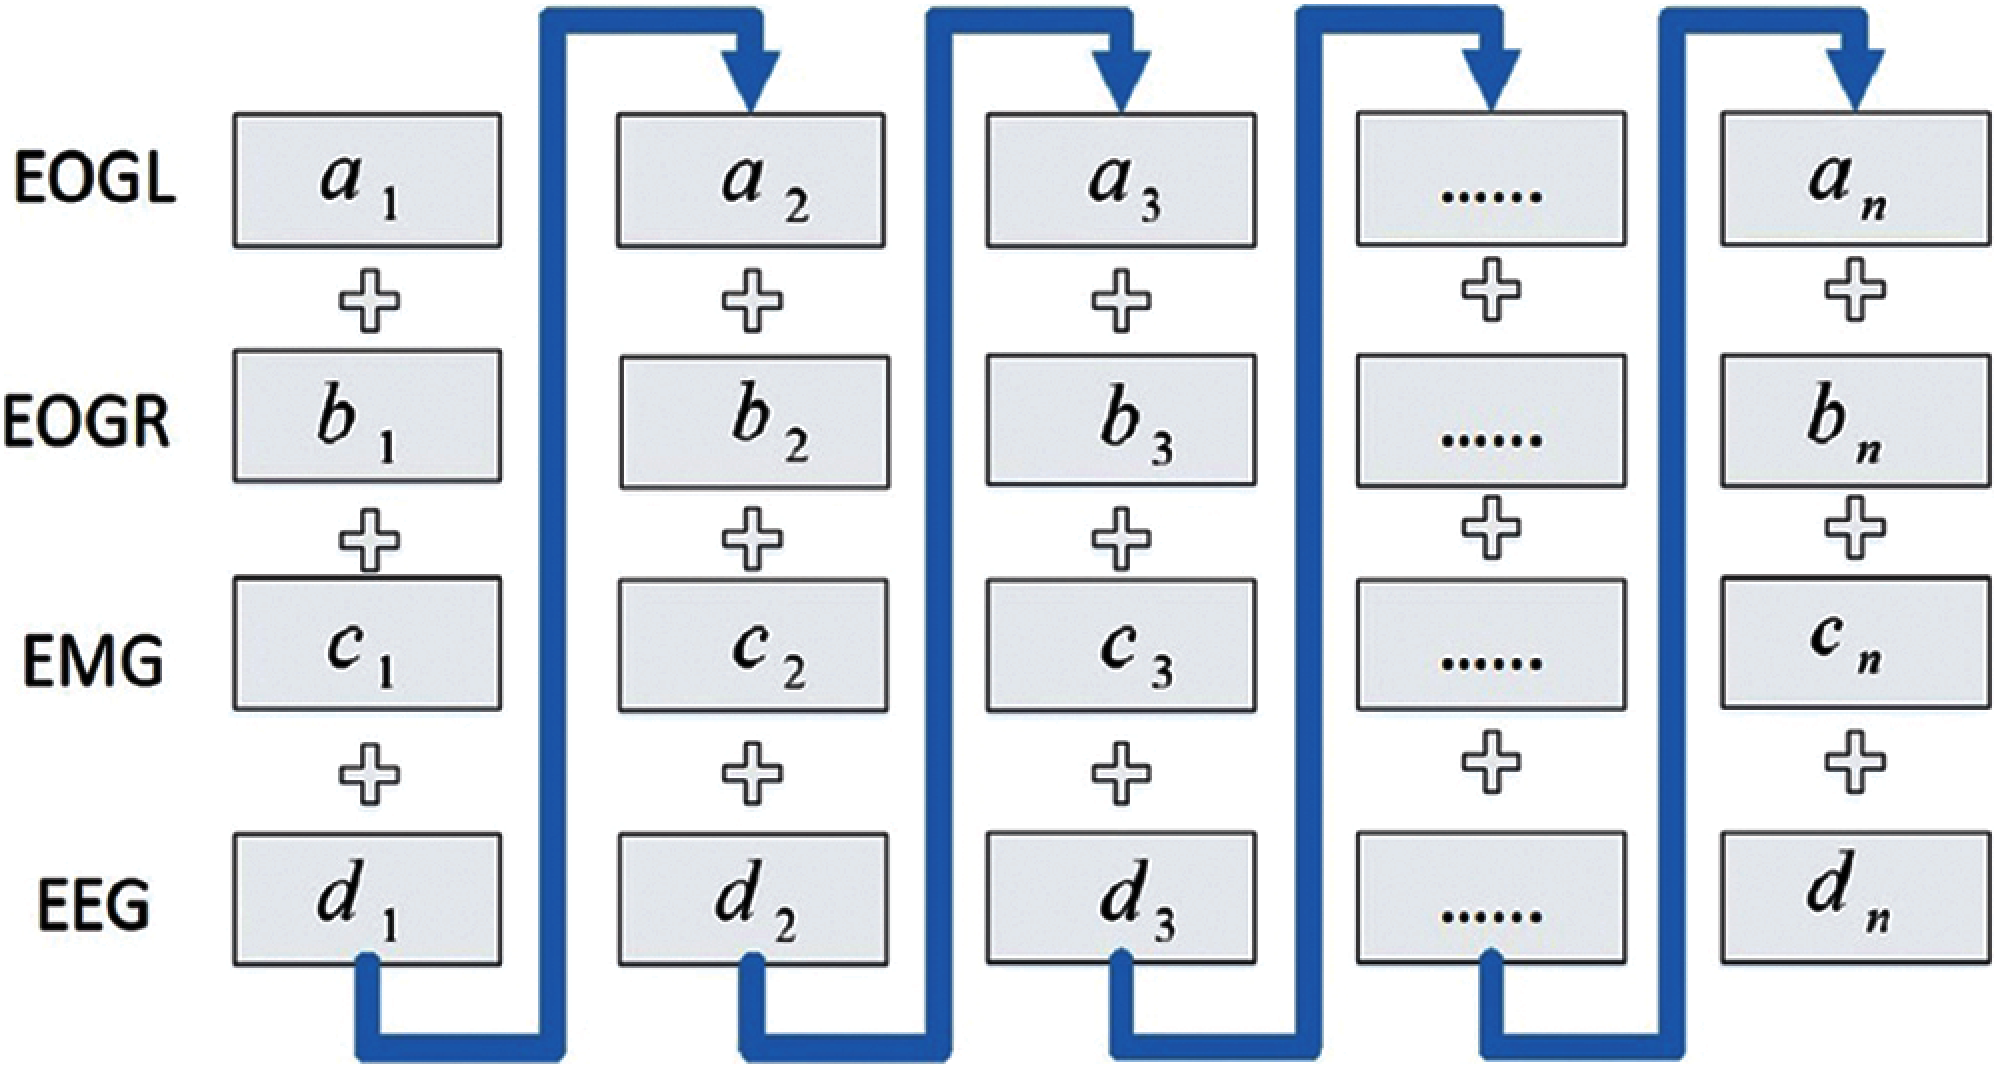
Figure 2: A new data stream using EEG, EOG and EMG channel signals
Suppose, EEG signal,
Here a1 represents the first epoch in the EEG signal, n represents the number of epochs.
Similarly, in relation to the EOGL signal:
EOGR signal:
EMG signal:
where i = 1, 2, …, n.; + is the concatenation operation.
According to equations Eq. (1), Eq. (2), Eq. (3), Eq. (4), and Eq. (5), the new data X can be represented as:
In this study, we consider one 30 s epoch for both databases. In the UCDDB database, each epoch contains 9600 samples, and in the SHHS1 database, each epoch has 10500 samples. We first rearrange data from each epoch in EEG, EOGL, EOGR, and EMG as one input in the proposed model shown in Fig. 3.
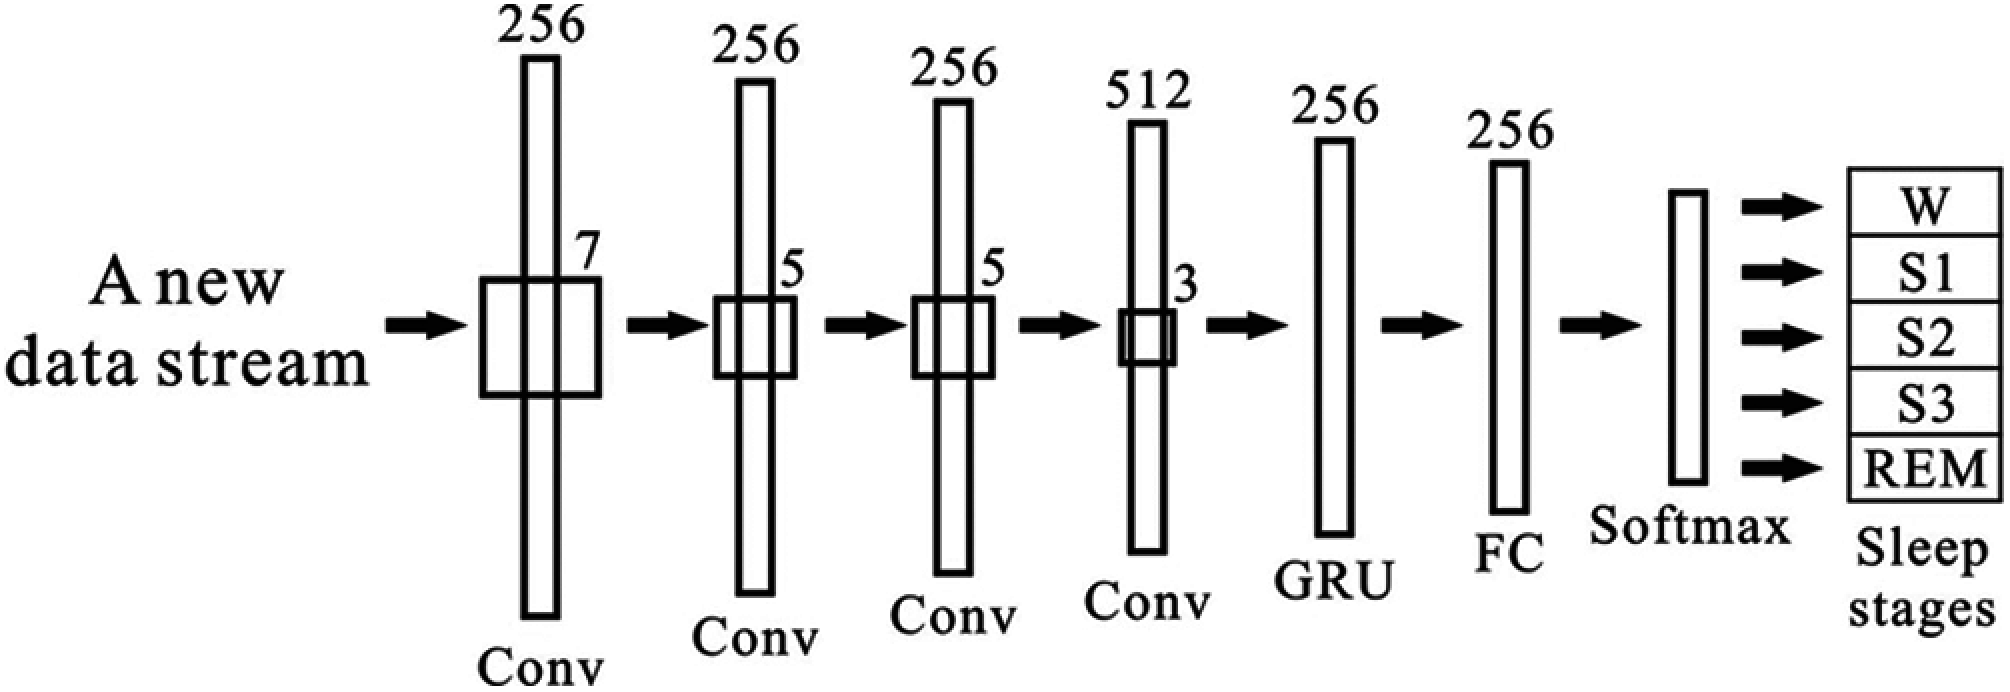
Figure 3: An overview architecture of the model
2.2.2 A Design for Extracting and Learning Deep Features from the New Data Stream
In this section, we present a structure of deep learning methods that can extract deeply hidden features from the new data stream and use the extracted features for the efficient classification of sleep stages. For this purpose, we develop a hybrid deep learning model combing CNN and GRU in this study. CNN is a kind of artificial neural network that can effectively process high-dimensional data [29]. A CNN model usually includes an input layer, multiple hidden layers, and an output layer. One hidden layer consists of a convolutional layer, a pooling layer, a fully connected layer, and a softmax function. The convolutional layer is an essential part of a CNN. The learnable filters (kernels) and biases are calculated with several feature maps in each convolutional layer. These filters are small but are spread through every element in feature maps. When the input feature maps operate in convolutional layers, a new 2-dimension map is produced after the filter spreads across input feature maps.
As shown in equation Eq. (7), every input feature map for an epoch was calculated in convolutional layers (i = 1, 2…, n. n is the total number of epochs) where xi is the i-th input epoch, wi represents the i-th weight matrices, and b denotes the bias matrices. In wi, the filter size can decide the number of elements in the feature map as input in the convolutional layer. The CNN module uses local connection and shared weights to extract local features data and obtain effective representation through the convolution and pooling layers. In this study, the input into the convolutional layer consists of four epochs, one original epoch concatenated with two preceding epochs and one following epoch. This study was inspired by the work done by Sors et al. [21].
After the feature extraction by the CNN model, we use GRU to learn sequential trends of the multi signals epochs because the sleep scoring depends on the time duration of the wave shapes and the transition sequence of the wave patterns. A GRU is a gating mechanism in RNN similar to a long short-term memory (LSTM) unit. GRUs can solve the vanishing gradient problem by using an update gate and a reset gate [30]. The GRU can enable recurrent units to detect different time scales on time-domain, similar to the LSTM [31]. There are only two gates in GRU: update gate and reset gate. However, GRUs provide better performance than conventional RNNs. GRU also performs better for fewer input data training, as it has fewer parameters than LSTM. GRU has fewer tensor operations that lead to its faster computation speed than LSTM [31]. The GRU module aims to capture the long-term dependency, and the GRU module can learn helpful information in the historical data for an extended period through the memory cell. The unusable information will be forgotten by the forget gate [32]. In this study, the obtained feature set is used in GRU as input to learning features, and the outputs of all these gated recurrent units relate to the fully connected layer (FC). When a neural network is trained, this feature vector is used for classification. The FC layer also is used as an encoded vector. During our experiment, the FC layer is used for determining the loss and training of the neural network.
The architecture of the CNN and GRU based model is presented in Fig. 3. The proposed model consists of two parts, as shown in Fig. 3. The first part includes four convolutional layers with a leaky rectified linear unit (LReLU) [33], with a negative slope of 0.1. We apply a gated recurrent unit and a softmax activation in part two. We employ a recurrent neural network unit, which is inspired by the architecture of DeepSleepNet [34], after the convolutional layers. The GRU has been shown to have a better performance on specific smaller datasets [35]. The description of the size of the layers, the stride size, and the GRU size are found in Fig. 3. This study constructed a seven-layer system and combined it with CNN and a GRU as our training model.
2.2.3 Sleep Stage Classification
This stage aims to perform the sleep stage classification task using a softmax classifier's obtained deep feature set. The softmax function (also known as multinomial logistic regression) [36] takes the input as a vector of K and normalizes it into a probability distribution, as shown in equation Eq. (8).
Where z is the input vector,
In this study, the datasets are randomly divided into a training set, a validation set, and a test set with 50%, 20%, and 30% proportion. The performance is evaluated by using confusion matrix, accuracy, Cohen's kappa, recall (RE), precision (PR), and F1-score (F1):
TP, TN, FP, and FN represent true positives, true negatives, false positives, and false negatives.
This study also used the Test Cost Index (TCI) to evaluate the model's suitability for datasets as it is an essential evaluation parameter for CNNs. The mathematical formula for the calculation of TCI is provided below:
where, yi is true label of data,
The lower TCI indicates better performance of the method. The TCI can map a value of one or more variables onto an actual number. In our experiments, the TCI is used for parameter evaluation. The value in results is the function of the difference between tested and actual values for an instance of data. Otherwise, signal processing studies usually evaluate the results by RE and specificity. We consider precision instead of specificity, as it has a better informative measure in a multiclass setting.
Tab. 2 presents the experimental results for SHHS1-50, SHHS-70, SHHS1-90, SHHS1-700, and UCDDB datasets in terms of accuracy (ACC), F1-score, Cohen's kappa (κ), and Test cost index (TCI). As mentioned in Section 2.1, we created four data sets from the SHHS1 database considering 50, 70, 90, and 700 PSG recordings to compare the performances of the proposed model. The experimental results evaluate the performances of these four different datasets. The same parameters and architecture were used to test the five datasets. We classified the results into two groups: the UCDDB training and test sets and the SHHS1 training and test sets. The UCDDB database is randomly separated into a training set and a test set when the model is in operation. The SHHS1 test sets include four groups that are randomly chosen from the SHHS1 database. All training and test subjects are pre-processed before inputting into the model.
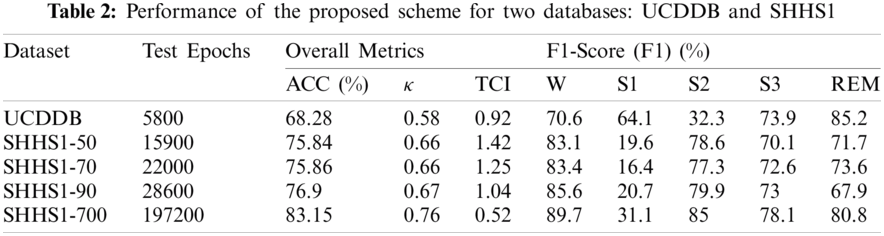
It can be seen from Tab. 2 that the proposed method yields the best classification results across ACC, F1-score, κ and TCI evaluation measurements for the SHHS1-700 dataset. The highest average accuracy achieved is 83.15% for the SHHS1-700 dataset while the value is 75.84%, 75.86%, 76.90% for SHHS1-50, SHHS1-70, and SHHS1-90, respectively. The proposed method produced the lowest accuracy value of 68.28% for UCDDB. According to the κ coefficient, the agreement of SHHS1 data sets between the sleep experts and our proposed method was substantial as the κ coefficient was between 0.61 and 0.80. It reveals that more data produce better performance by the proposed method. The TCI results in Tab. 2 show that the proposed method produces the lowest TCI for the SHHS1-700 dataset, which indicates that SHHS1-700 is a more suitable dataset than other datasets: SHHS1-50, SHHS1-70, and SHHS1-90. We can see from Tab. 2 that the SHHS1-50 test dataset does not have good convergence due to less data size, which might cause underfitting as fewer data are trained during the training period. This result demonstrates that if the number of datasets increases, the TCI decreases, indicating that more datasets will have a better performance by using this model. Compared with the test results of SHHS1-50, SHHS1-70, SHHS1-90, SHHS1-700, and UCDDB, the TCI of UCDDB is less than SHHS1-50, SHHS1-70, and SHHS1-90, indicating that the sleep stages have better distribution in the UCDDB database. The UCDDB database has the least number of epochs in these four groups; however, its accuracy only averages 68.28%. If we were able to fine-tune the parameters of this model for the UCDDB database, the result might be more accurate.
During this study, we tried to change the structure of CNN to improve the performance of the method for SHHS1-700 datasets as the input data. Firstly, we decreased the learning rate value to 0.000025 in the original model, as shown in Fig. 3. The results after these changes have been inferior to SHHS1-700 in Tab. 2. The average accuracy value decreased to 81.6%, and the test cost index increased to 0.9, indicating that while the learning rate decreased, average accuracy showed no improvement. Moreover, the model became less suitable for the datasets. On the other hand, when we increased the value of the learning rate to 0.00003, the average accuracy value decreased to 77.96%, and the test cost index increased to 0.79. Both the average accuracy value and the TCI decreased. Furthermore, we experimented with 7--8 layers with strides 2--4 and filter size 3, 5, and 7. We also tested 128, 256, and 512 of the GRU layer and FC layer. In most situations, when we changed the hyperparameters, the average accuracy of the test was inferior to SHHS1-700 in Tab. 2. Finally, the original hyperparameter of the model in Fig. 3 had the best performance.
In order to further investigate, we also tested the performance of the proposed method in terms of precision and recall on the SHHS1-50, SHHS1-70, SHHS1-90, SHHS1-700, and UCDDB data sets, separately as shown in Fig. 4.
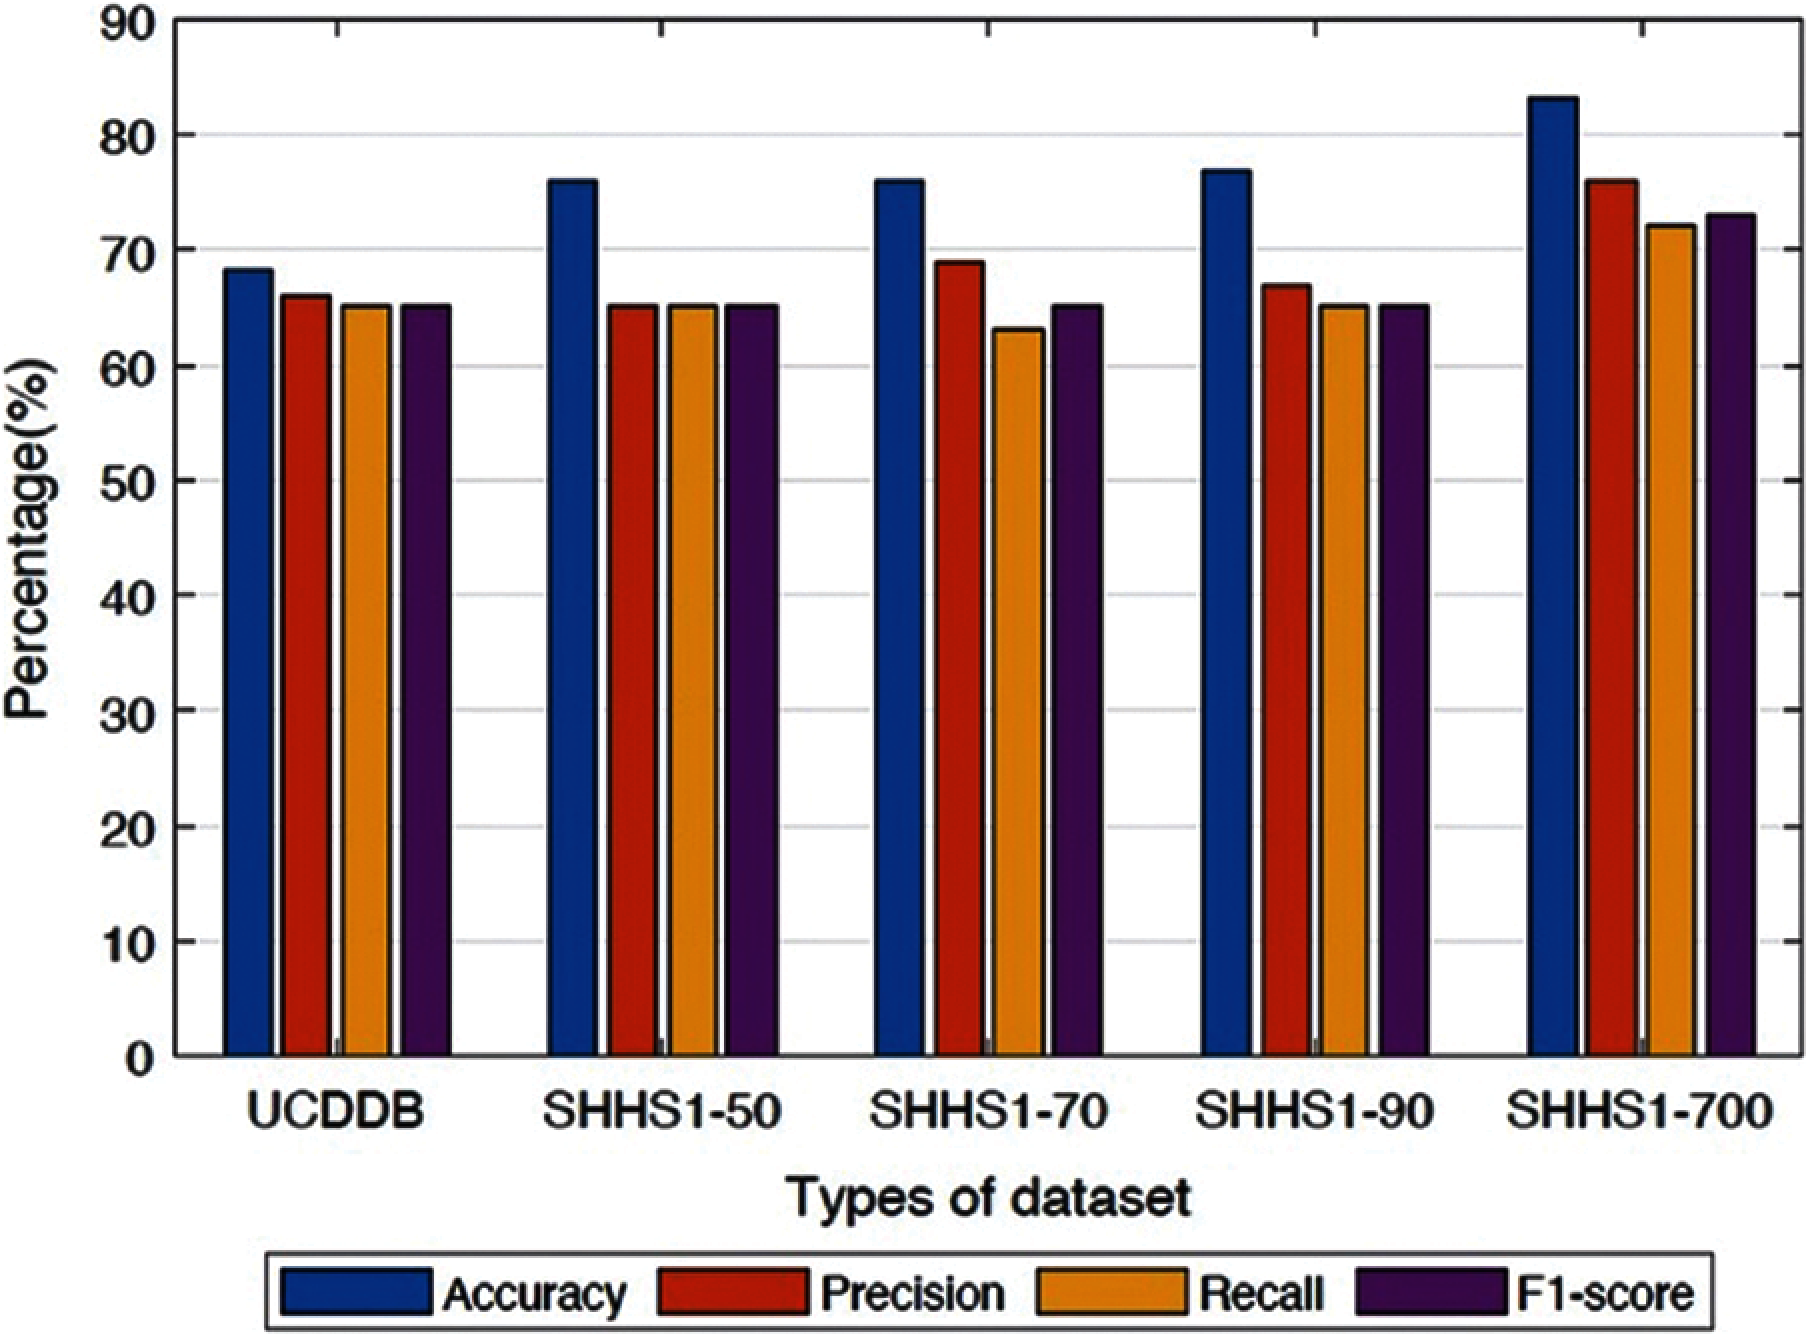
Figure 4: Average performances of the proposed method for different datasets
It is apparent from Figs. 4 and 5 that the proposed method performs better in terms of accuracy, precision, recall, and F1-score value on the SHHS1-700 dataset compared to other datasets. We separated the dataset into the training part, validation part, and testing part. After the model was trained, the data was tested one subject at a time. The performances in Fig. 4 represents the average values of the performance for each of the test datasets. This figure compares average performances for five data sets, including accuracy, precision, recall, and F1-score. In Fig. 5, we made the box plot which used the accuracy value considering all different subjects of test data. Fig. 5 shows the distribution of accuracy values of all test subjects in the five datasets.
In order to further evaluate, we computed the execution time of the proposed method calculated based on training and testing. Figs. 6 and 7 show the execution time, and accuracy for SHHS1-50, SHHS1-70, SHHS1-90, SHHS1-160, SHHS1-300, SHHS1-500, SHHS1-700, SHHS1-1000 and SHHS1-1500, respectively. Using this calculation, execution time includes training time and inference time. To compute the performance of the nine datasets, the same computer and settings were used. Every dataset was tried three times, and the average execution time and accuracy were calculated. The execution time of the proposed method was recorded for each dataset in Figs. 6 and 7 shows that when the number of subjects is around 700 for training and testing, the model's performance can achieve better accuracy than other numbers of datasets. The number of subjects represent the training set size and testing set size. When the subjects number more than 700, the accuracy decreases. The precision, recall, and F1 have the same trend as shown in Fig. 7. In addition, the execution time of the SHHS1-700 is less than the average execution time of all the subjects. The 700 subjects as input achieve the best result in the SHHS1 dataset.
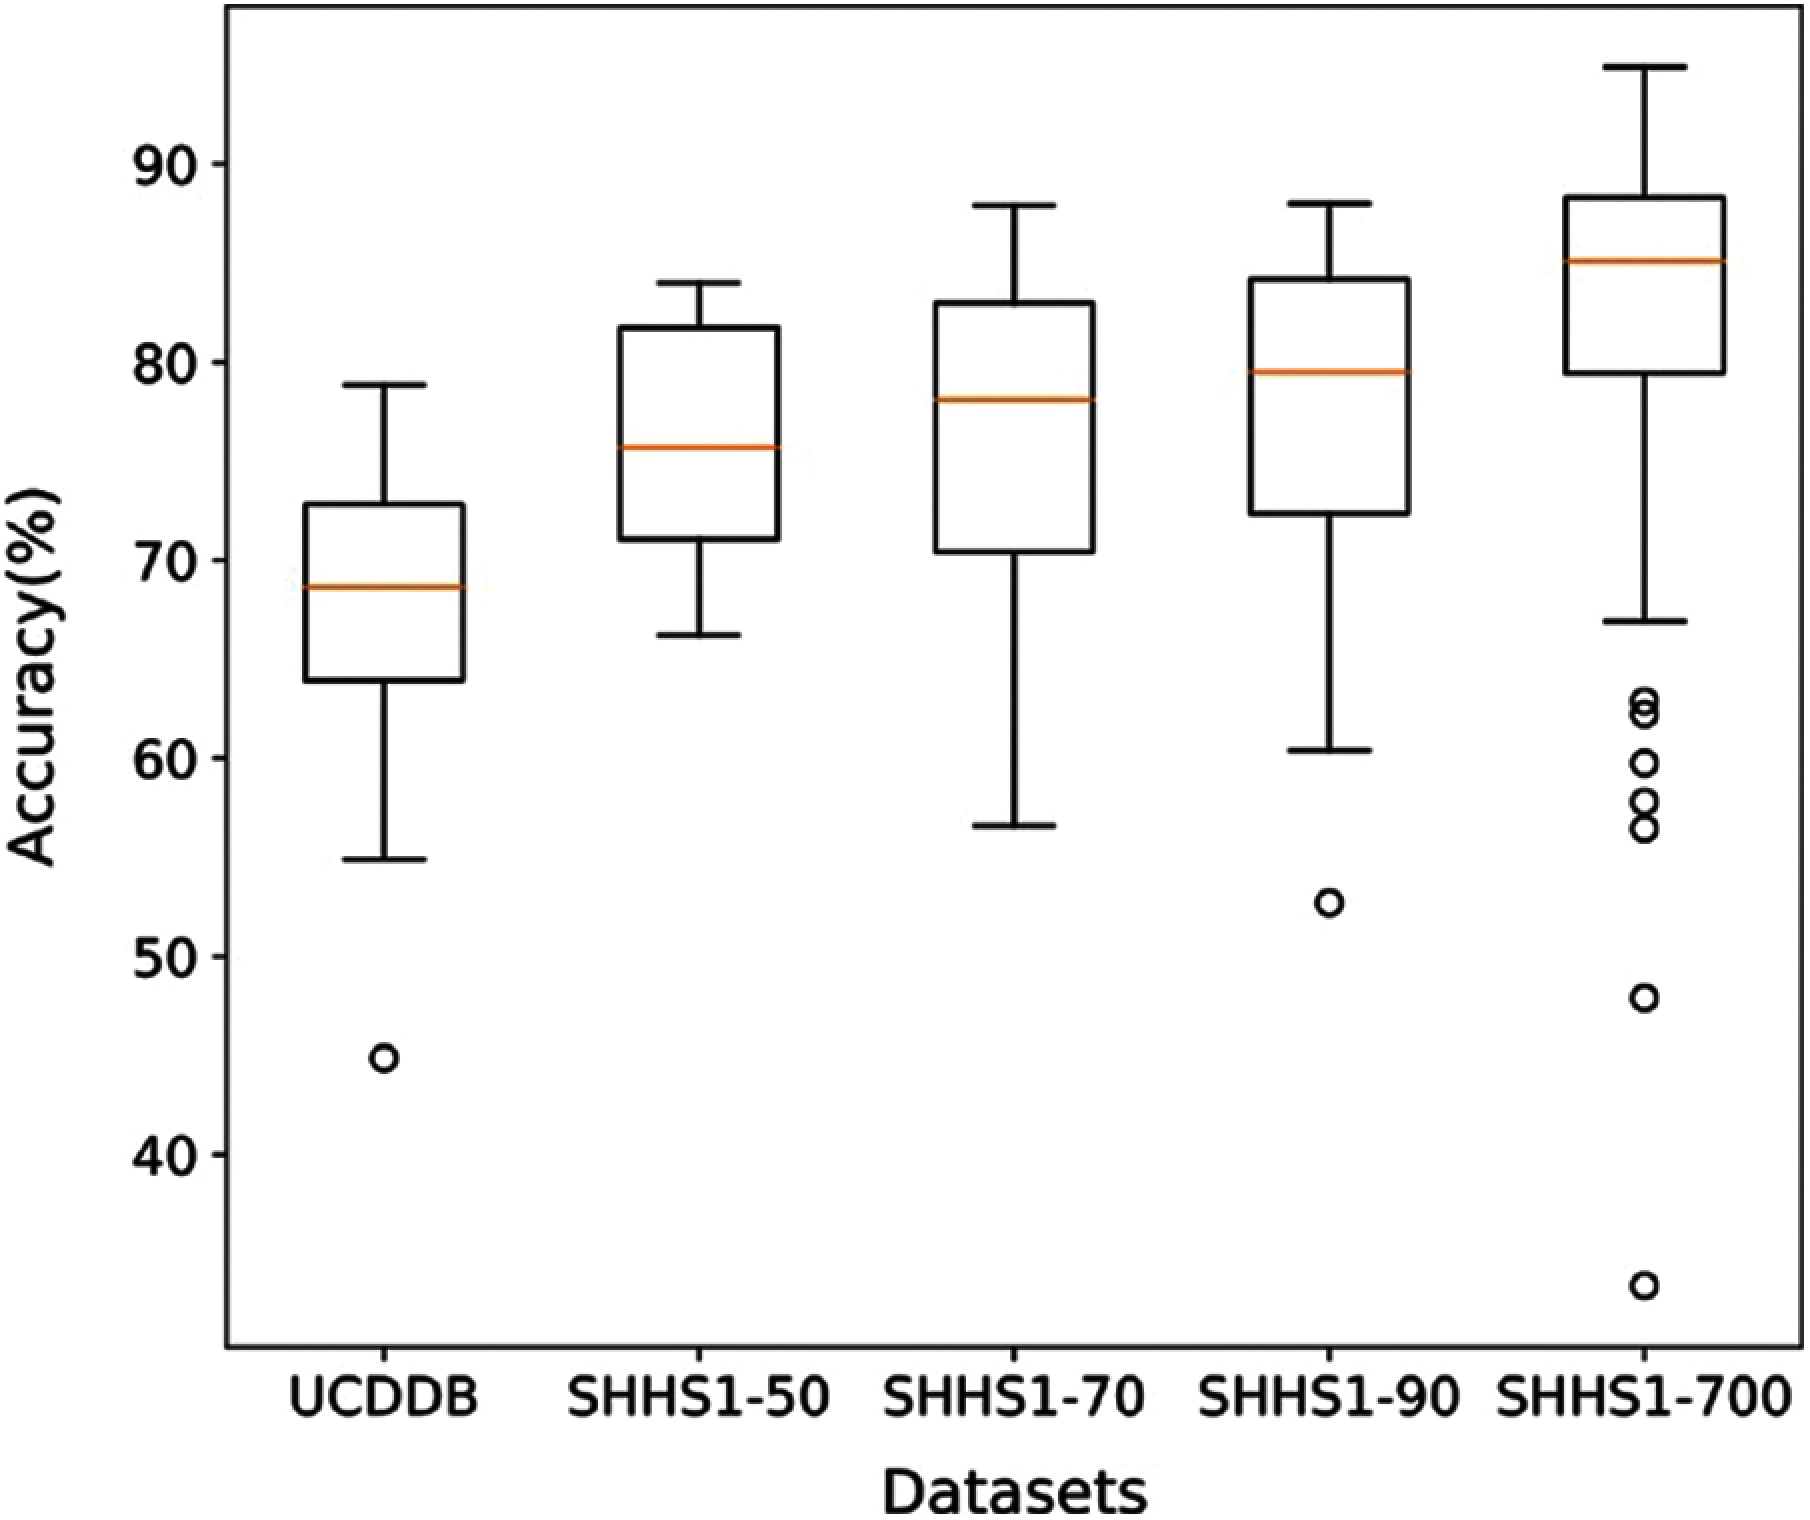
Figure 5: The distribution of accuracy for all subjects in the five test datasets
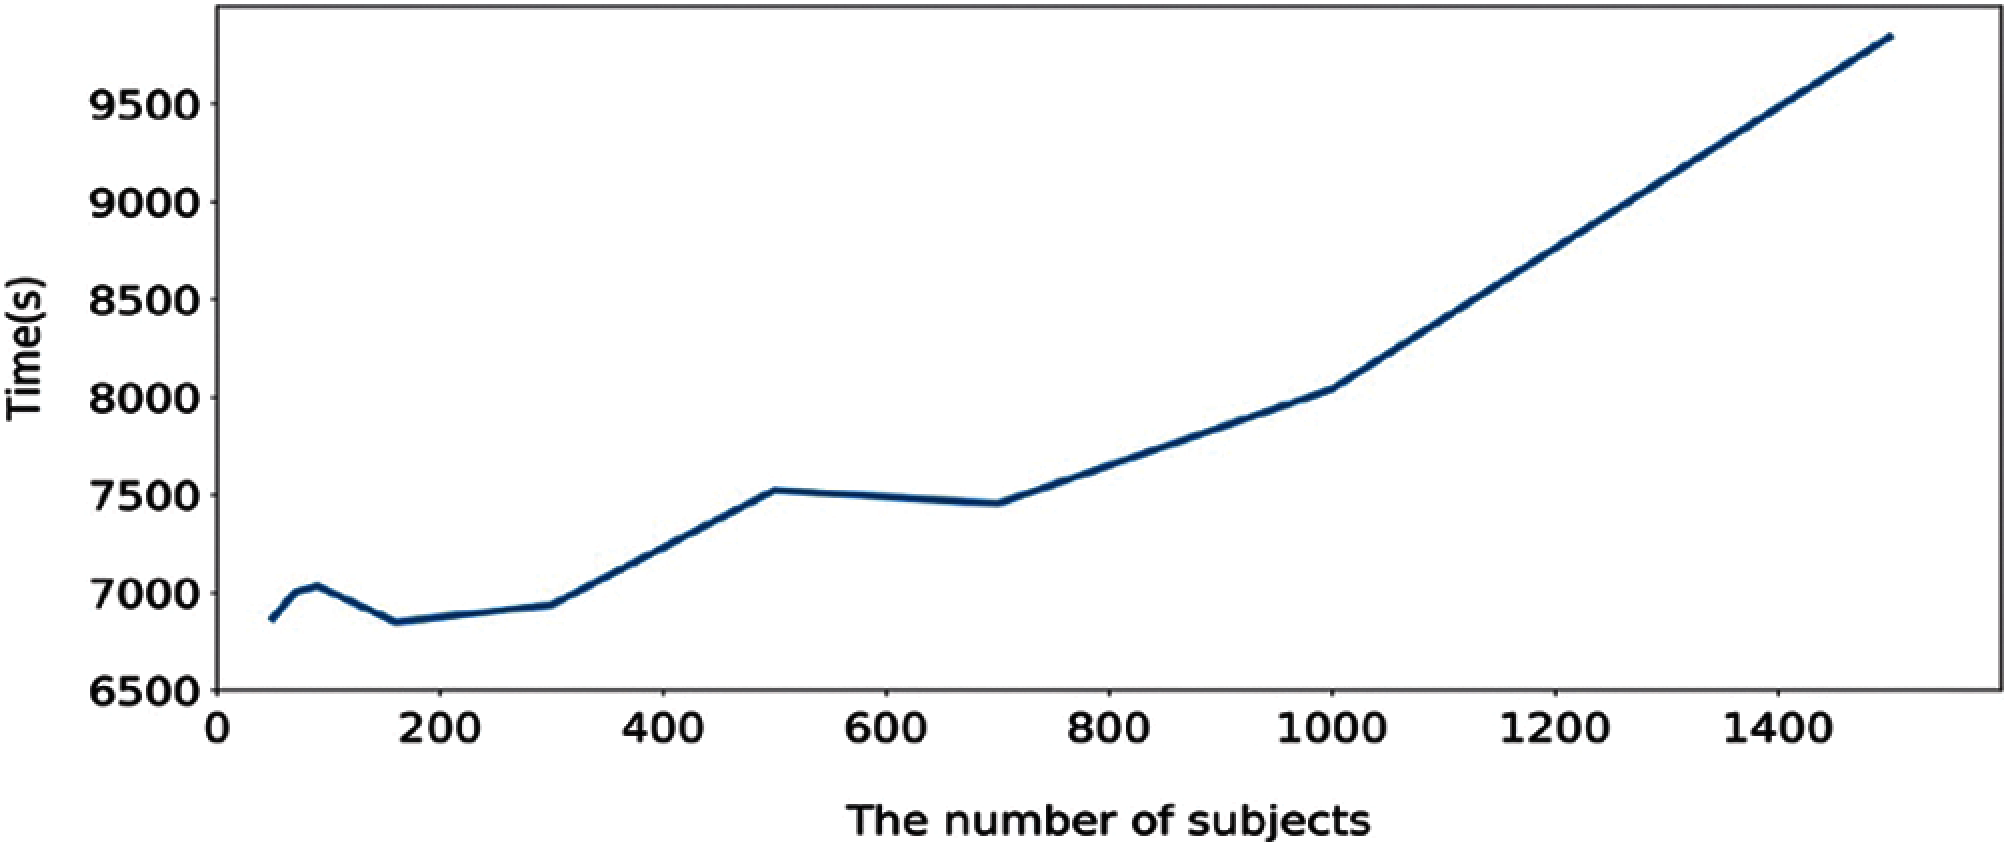
Figure 6: Execution time for the proposed method based on number of subject
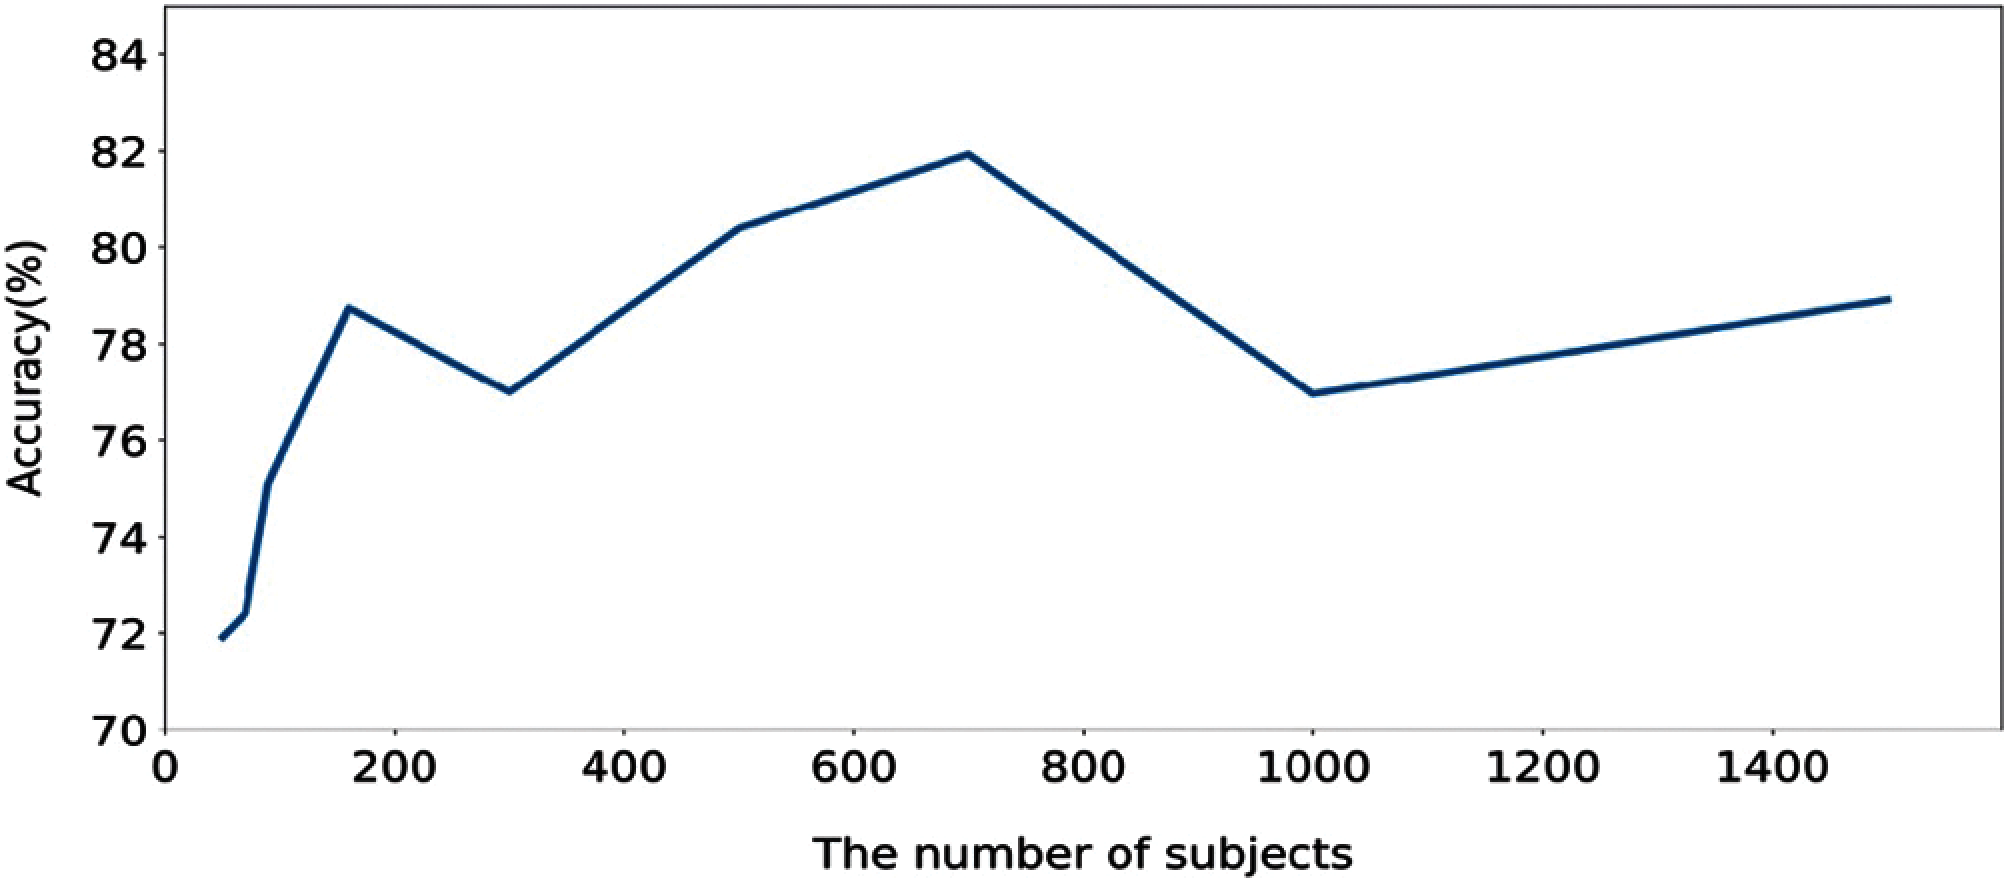
Figure 7: The accuracy based on the number of subjects
As we obtained the best performances for the proposed method on the SHHS1-700 dataset, we intend to provide more information on this dataset. To explore more information on the performance of this model, we provide overall accuracy based on each of the sleep stages for SHHS1-700. If we randomly divided SHHS1-700 (700 subjects) into 6-folds, and the distribution of accuracy of folds is presented by the boxplot in Fig. 8. From Fig. 8 we can find that the wake, stage 2, stage 3, and REM have a good performance in their classification results. Only stage 1 classification results from 14 to 23 are worse than other sleep stages. It is clear from these results that stage 1 has fewer epochs than sleep stages which leads to the model having a bad classification performance on stage 1, and this impacts the accuracy of all sleep stages.
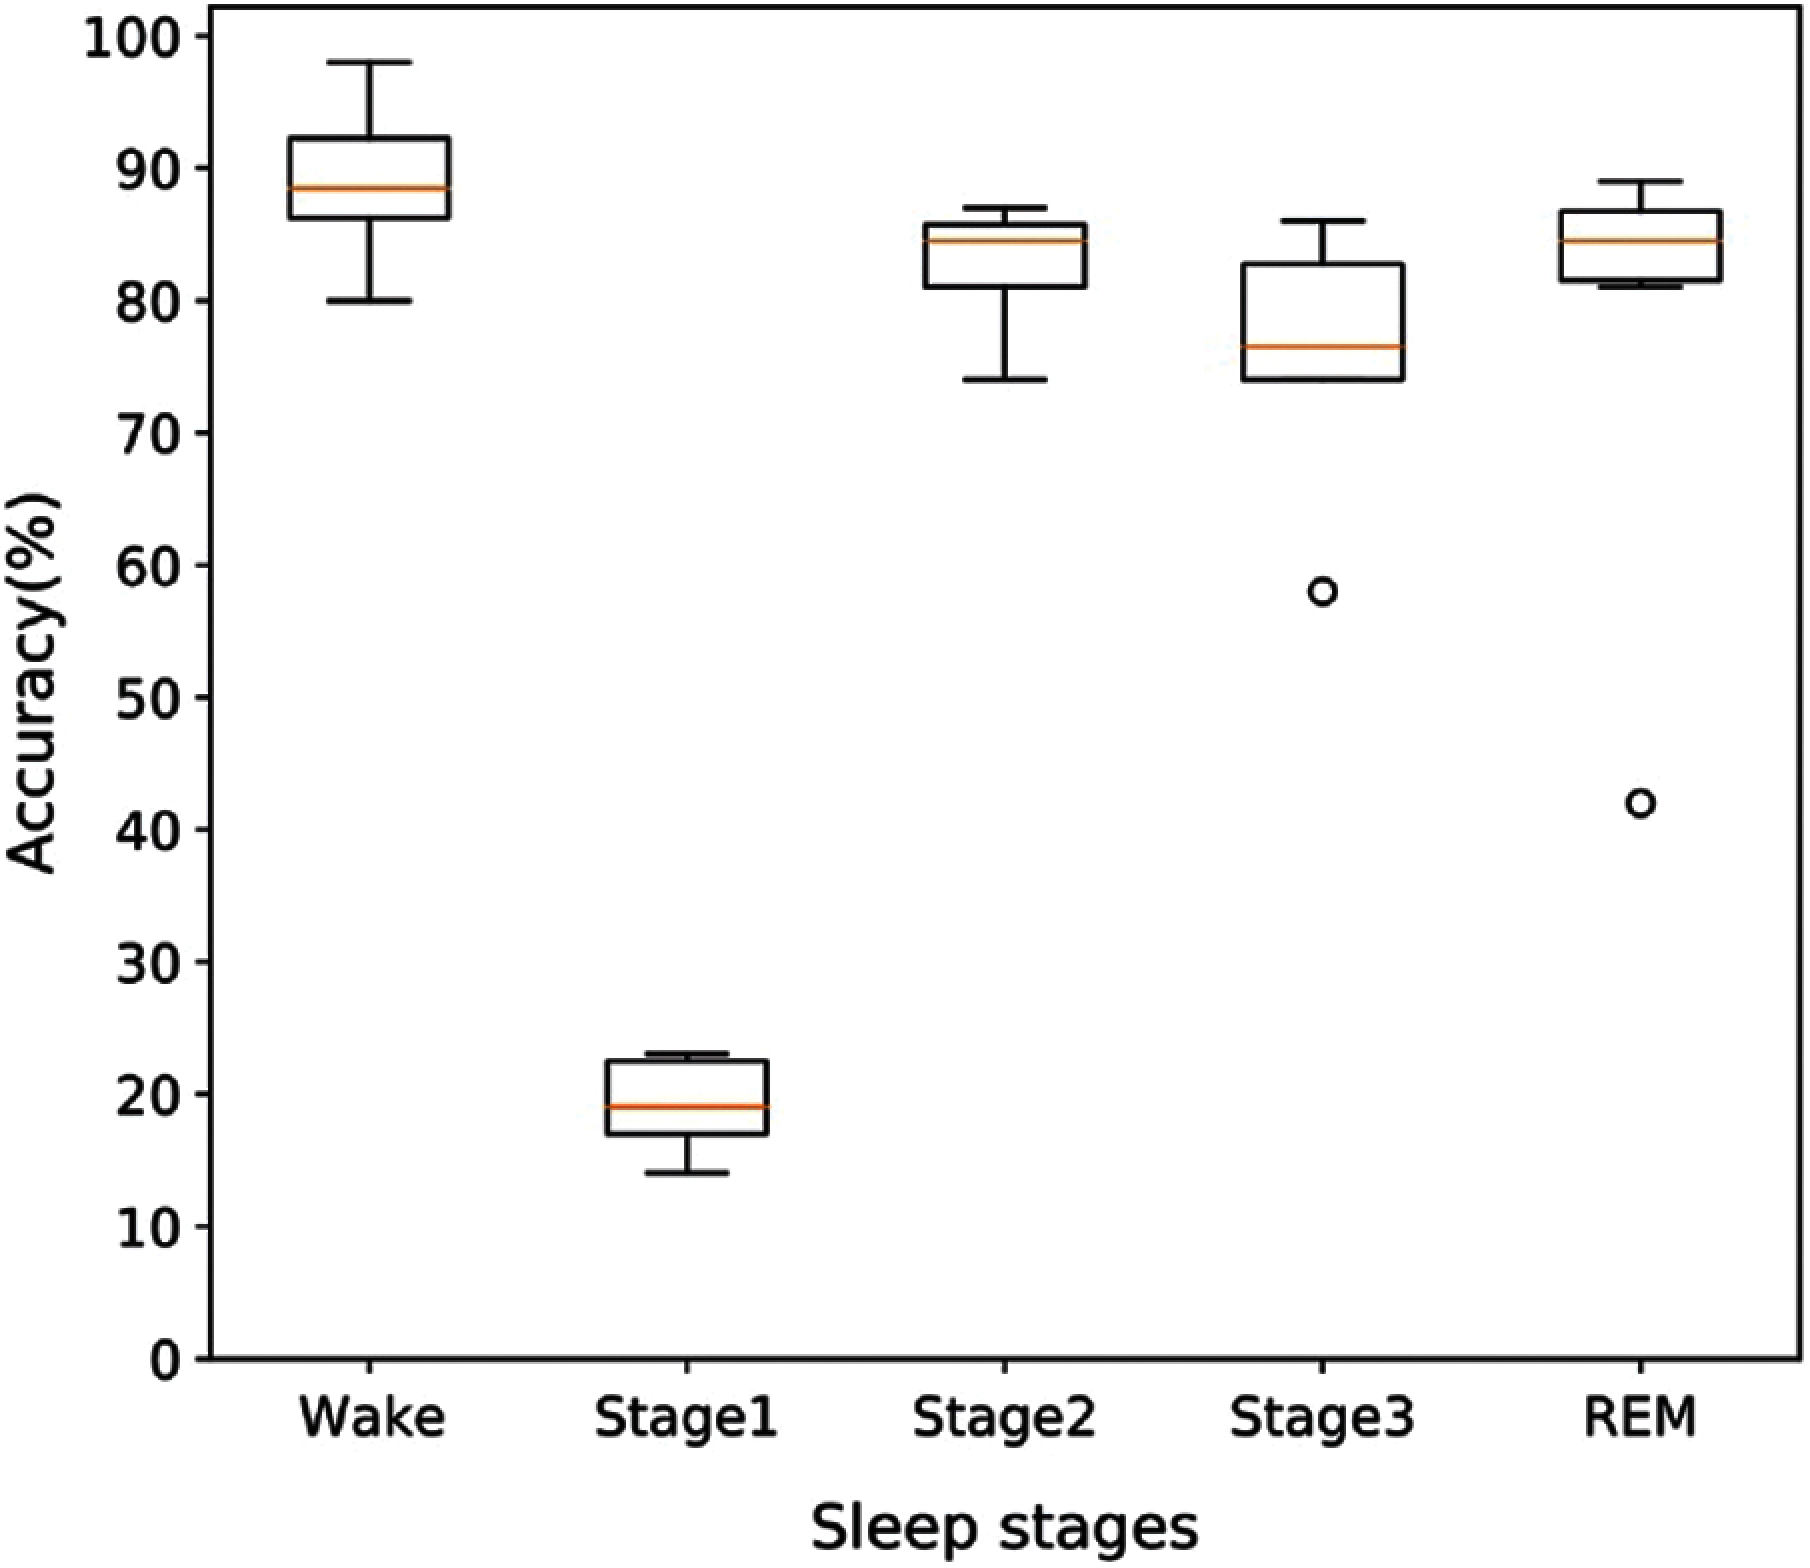
Figure 8: The distribution pattern of accuracy for different sleep stage on the SHHS1-700 testing dataset
We performed additional experiments to verify the stability of the model classification with the SHHS1-700 dataset. Fig. 9 shows the confusion matrices of the SHHS1-700 on the test set. The result shows that the SHHS1-700 dataset has an unbalanced sleep stages distribution. Most of the sleep stages are distributed in the Wake, S2, S3, and REM stages. From Tab. 2, it can be seen that the F1 score of all sleep stages, except the S1, was appropriate. This happened because of an increase in the misclassifications between the S1-Wake, S1-S2, and S1-REM. This may be due to the imbalance of the S1 sleep stage, model oversampling of the Wake and S2 in the training set. Therefore, the model predicted more of Wake and S2.
In this study, a hybrid deep learning method have been developed for automatic sleep stage classification. These experimental results show that it had a good performance on sleep stage classifications using a multi-channel signal. The proposed method is established by combining a CNN and GRU evaluated on huge multi-channel signal subjects. In addition, the performance of the method is compared with state-of-the-art methods in this research area. In this study, the model was trained end-to-end via back propagation without any requirement for feature selection work. This is one of the advantages of our method over other transitional methods [9–14] because the convolutional layers and gated recurrent units can automatically learn the features of each sleep stage. Another advantage is that our method is designed with a simple architecture that can produce better learning efficiency than the existing methods. The seven-layers model takes less than two hours to train and test 700 subjects, indicating the higher calculation efficiency of the method. Our method has higher calculation efficiency than those of Stochholm et al. [38] and Supratak et al. [34], and the performance is as effective as [38] on significant subjects except, for S1. It is noted from Fig. 9 that they mostly correspond to the unbalance sleep stage distribution in the SHHS1 database. The model overlearned the Wake and S2 stage, which leads to higher misclassification on the pairs of S1-Wake and S1--S2.
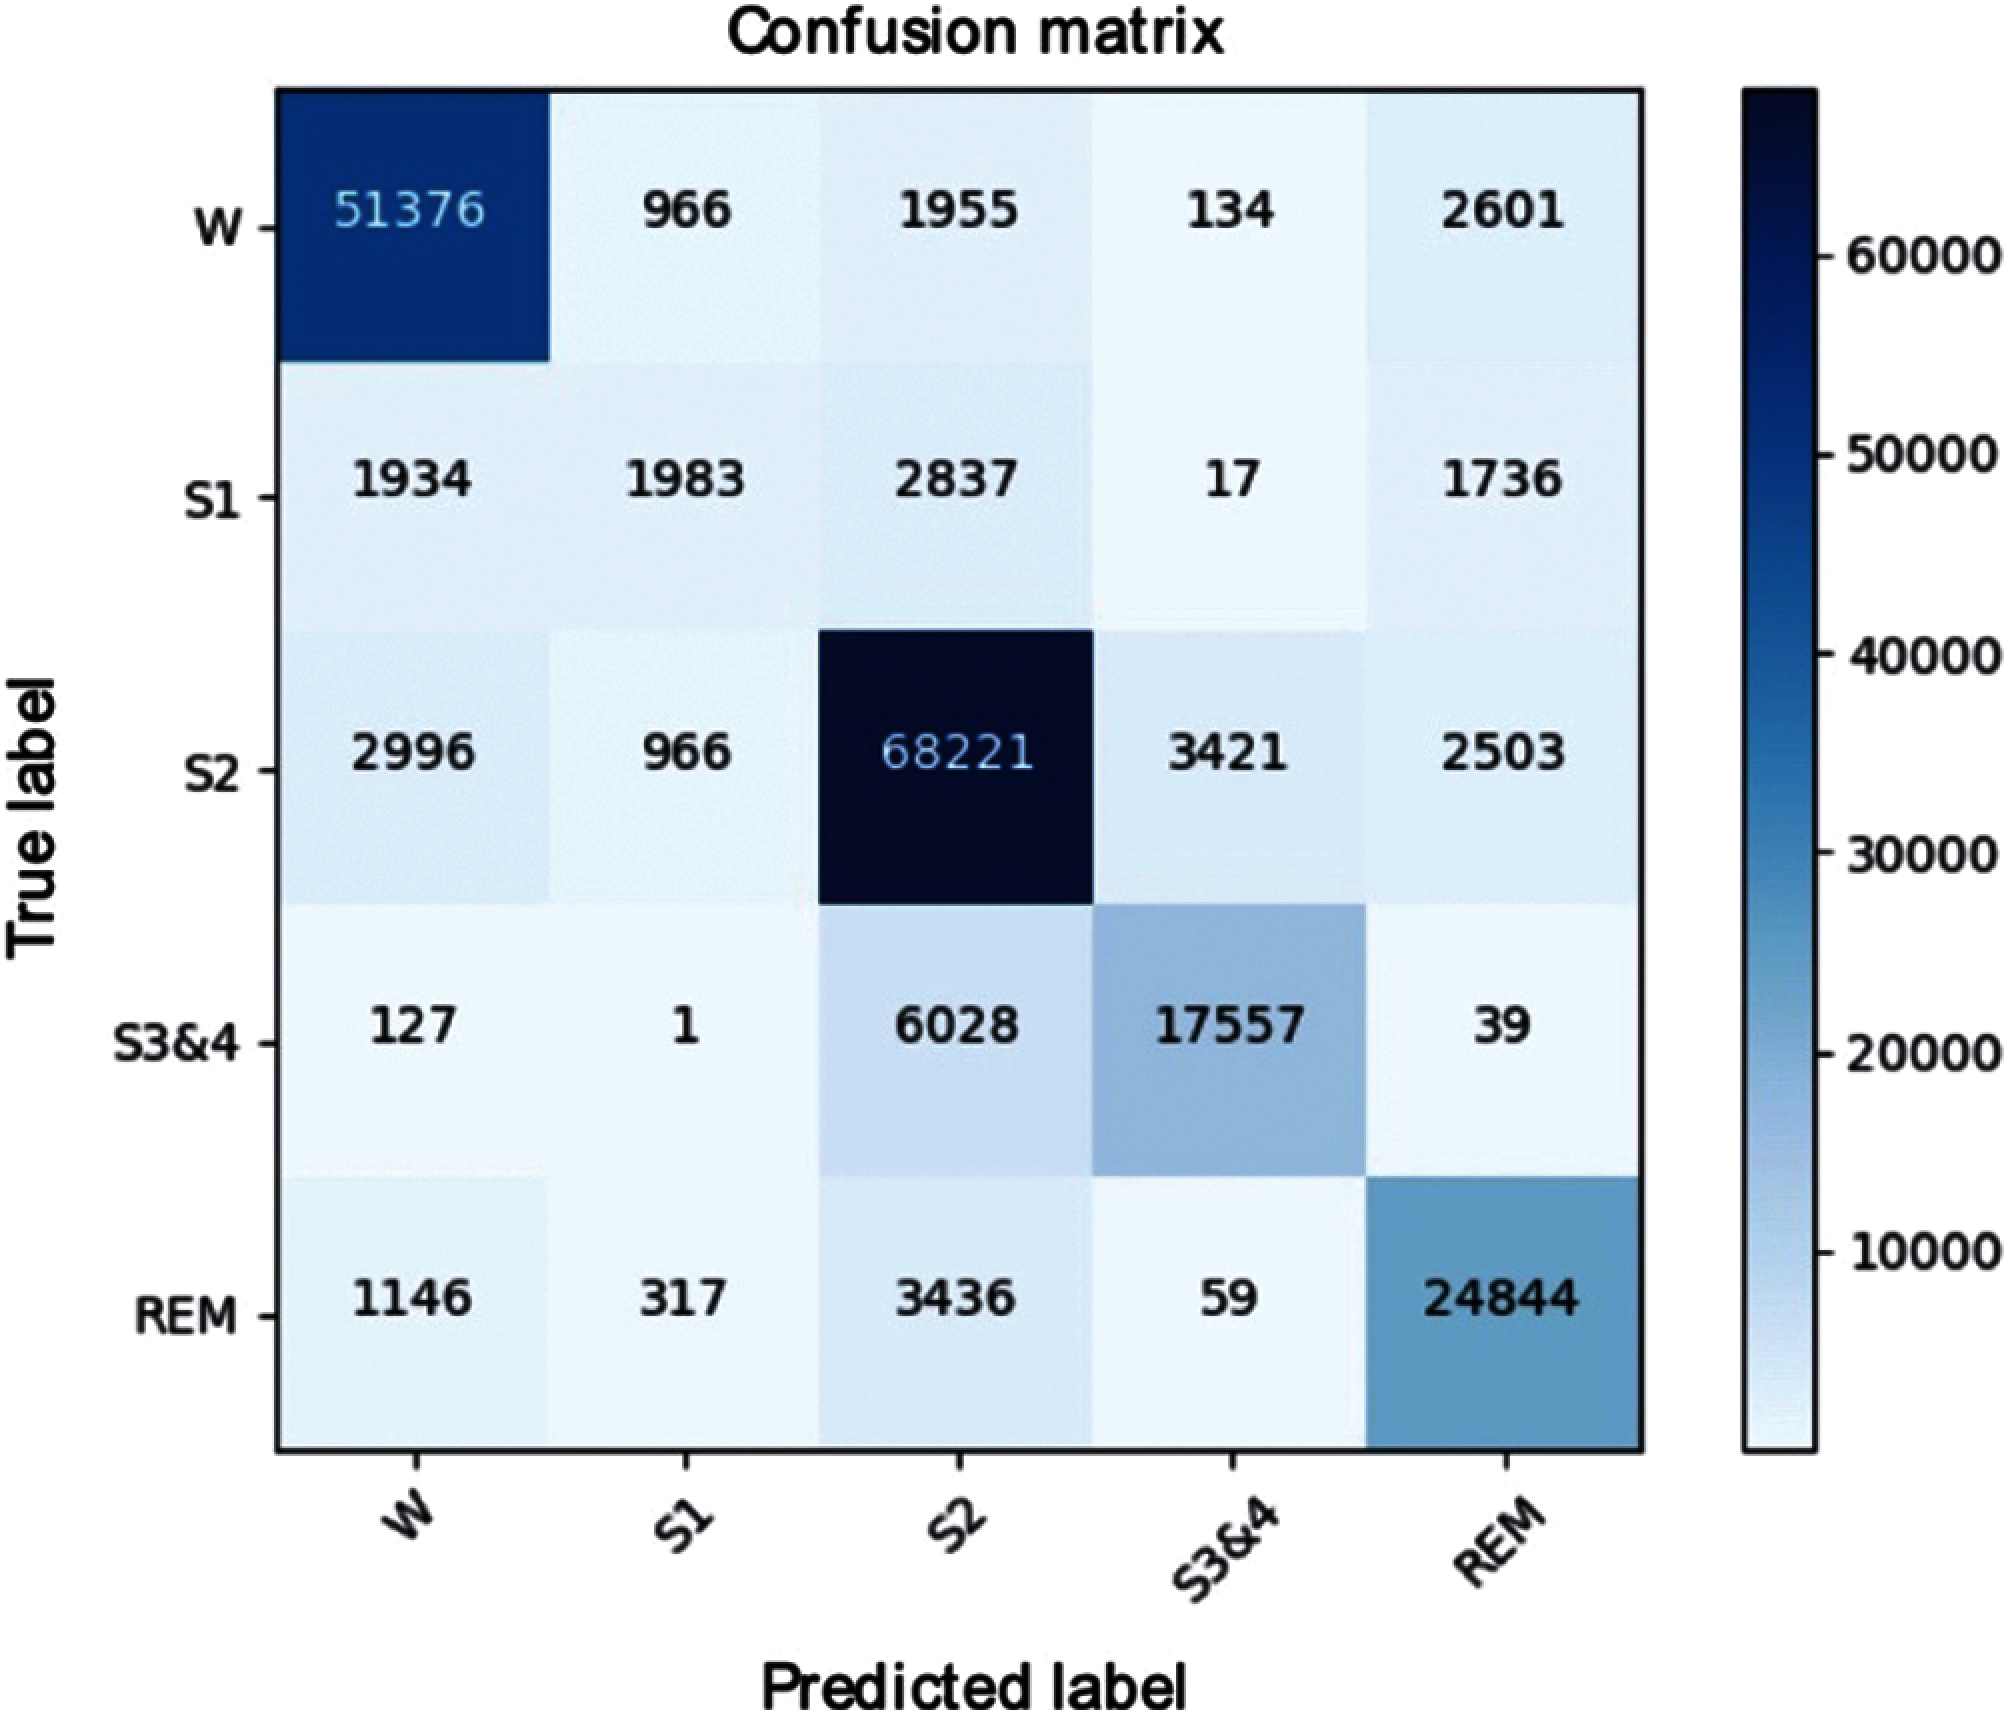
Figure 9: Confusion matrix of the SHHS1-700
According to Tab. 1 and Fig. 9, it can be seen that the datasets that we used in this study have a very imbalanced class distribution on S1. In order to solve this issue, we repeated the learning process and added an extra S1 to balance the quantity of sleep stage. The performance of the S1 metrics showed a minor improvement on the overall performance. Further research is necessary to resolve the class imbalance issue.
4.2 Comparison to Other Methods
Tab. 3 shows a comparative report for our method with some existing research studies on the sleep stage classification. Our method achieved classification results with an accuracy of 83.15% and Cohen's kappa of 0.76. As seen from Tab. 3, Sors et al. [21] achieved better performance with an accuracy of 87 and Cohen's kappa of 0.81 compared to our method. In their experiment, authors used a deep CNN method to classify colossal data sets with 5728 subjects. The main reason is that using more data as input could produce a better performance than the small size dataset. However, Sors et al. [21] trained the full model to spend approximately two days, compare to which we used two and a half hours to complete the training. The proposed model used a light framework and fewer layers on our model than [21]. Phan et al. [19] proposed a transfer learning method by applying SeqSleepNet to sleep stages from the Montreal Archive of Sleep Studies (MASS) database on single-channel EEG signals. The method produced a good performance of the EEG-EEG transfer learning with an accuracy of 82.2%. Zhu et al. designed a novel method based on the graph domain [10]. They mapped EEG signals into nine extracted features and classified them by an SVM into two to six states. They reported good performance with an accuracy of 87.5% and a kappa coefficient of 81%. Supratak et al. [34] used a bi-directional long short-term memory (LSTM) network after a convolutional neural network and used several different single-channel EEGs as a comparison. Their results reported an overall accuracy of 82% and 79.8%.
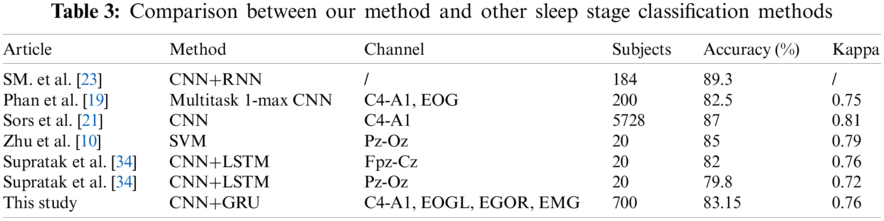
We added a GRU in our model instead of one fully connected layer and used 700 data sets as input data, suggesting that GRU and more data may improve the performance. SM. et al. [23] developed a similar model as this proposed method with an accuracy of 89.3% and f1 89%. Authors classified stage 1 and stage 2, stage 3 and stage 4 as light sleep and deep sleep, respectively. SM. et al. [23] used five branches on the feature extraction part and built 11 layers. A more complicated framework and layers can provide better performance on feature learning and classification but will likely incur more time on training.
Our method could be compared with the methods based on CNN or CNN could be combined with the deep learning method. The SHHS1 database has fewer state-of-the-art methods, so a smaller number of articles have been used on sleep stages classification. In addition, our method has only an average performance on the UCDDB database. The results prove that our model has generalized ability on two different databases but has better performance on the SHHS1 database.
The comparison methods in Tab. 3 used similar deep learning methods, the same database for sleep stages classification, or the classic sleep stages classification method. Compared with similar deep learning methods, we aim to find out the different model performances and advantages. Compared with the method used in the same database for sleep stages classification, we aim to find out our model advantage over others. Compared with the classic sleep stages classification method, we aim to determine the distance to the classic method. In Tab. 3, it provides the model performance on the different methods using different dataset. The comparison includes combined deep learning model (i.e., [23, 34], and the proposed model), normal deep learning model (i.e., [19, 21]), and a machine learning method (i.e., [10]). From Tab. 3, we can see, the proposed method can have better accuracy and kappa than another combined deep learning model [34]. In a similar situation, the more subjects used in model training can have a positive influence. SM. et al. [23] got the highest accuracy of all methods; they used the data collected by themselves, cannot see the characters of the database. Sors et al. [21] reported the accuracy of 87% better than [19, 21, 34] and the proposed method. Also, the computational time is much more than our method. We and [21] choose the SHHS dataset as evaluation. The SHHS database is suited for the deep learning model training work from the results and the number of subjects. Zhu et al. [10] reported a better accuracy than us, compare to the good performance machine learning method, our proposed method still has potential issues to improve places.
This study proposed a hybrid deep learning based method to combine CNN and a GRU for automatic sleep stage scoring using multi-channel biological signals (e.g., EEG, EOG, EMG). In the proposed method, we used the CNN model for discovering significant features from the signals and the GRU model for learning features from different sleep stages in each epoch for efficient classification of the sleep stages. The models themselves automatically learn appropriate features. We mainly focused on developing a five-stage classification model to classify Wake stage, stage 1, stage 2, stage 3, and REM using multi-biological signal data. The proposed model was tested and evaluated on two publicly available databases: UCDDB and SHHS. The results of both datasets demonstrate that our proposed model can process time sequence data to effectively extract the hidden features and learn the efficient features of the datasets for classifying the sleep stages without changing the model's architecture. The results also show that our method can achieve better performance with less execution time than the existing methods.
The main contributions of this work are summarized as follows: (1) Introducing a hybrid deep learning scheme combining CNN and GRU for mining deeper features from multi biological signals to automatically identify the different sleep stages; (2) Investigating the performance of the proposed model for different number of subject groups; (3) Improving classification performances compared to the existing methods; (4) Learning features automatically for sleep stage classification from multiple bio-signals without changing the model architecture and the training algorithm.
The proposed model can be improved by adding more relevant factors that may affect the load change. In addition, we have a plan to develop a new statistic feature based classification for the multi-channel sleep stage. The statistic feature based classification method will extract significant features from raw data representing characteristics of the signals that may explore more efficient data features for the classification of sleep stage.
Acknowledgement: The authors appreciate all research group members.
Funding Statement: The authors received no specific funding for this study.
Conflicts of Interest: The authors declare that they have no known competing financial interests or personal relationship that could have appeared to influence the work reported in this paper.
1. T. Kendzerska, A. S. Gershon, G. Hawker, R. S. Leung and G. Tomlinson. “Obstructive sleep apnea and risk of cardiovascular events and all-cause mortality: A decade-long historical cohort study.” PLoS Medicine, vol. 11, no. 2, pp. e1001599, 2014. [Google Scholar]
2. T. Kendzerska, A. S. Gershon, G. Hawker, G. Tomlinson and R. S. Leung. “Obstructive sleep apnea and incident diabetes. a historical cohort study,” American Journal of Respiratory and Critical Care Medicine, vol. 190, no. 2, pp. 218–225, 2014. [Google Scholar]
3. Y. K. Loke, J. W. Brown, C. S. Kwok, A. Niruban and P. K. Myint, “Association of obstructive sleep apnea with risk of serious cardiovascular events: A systematic review and meta-analysis,” Circulation: Cardiovascular Quality and Outcomes, vol. 5, no. 5, pp. 720–728, 2012. [Google Scholar]
4. R. K. Tripathy, S. K. Ghosh, P. Gajbhiye and U. R. Acharya, “Development of automated sleep stage classification system using multivariate projection-based fixed boundary empirical wavelet transform and entropy features extracted from multichannel EEG signals,” Entropy, vol. 22, no. 10, pp. 1141, 2020. [Google Scholar]
5. R. Tripathy and U. R. Acharya, “Use of features from RR-time series and EEG signals for automated classification of sleep stages in deep neural network framework,” Biocybernetics and Biomedical Engineering, vol. 38, no. 4, pp. 890–902, 2018. [Google Scholar]
6. A. Rechtschaffen and A. Kales, “A manual of standardized terminology, Techniques and Scoring System for Sleep Stages of Human Subjects,” In Public Health Service, US Government Printing Office, Washington, DC, 1968. [Google Scholar]
7. R. B. Berry, R. Brooks, C. E. Gamaldo, S. M. Harding, C. Marcus et al., “The AASM manual for the scoring of sleep and associated events,” Rules, Terminology and Technical Specifications, Darien, Illinois,” American Academy of Sleep Medicine, vol. 176, pp. 2012, 2012. [Google Scholar]
8. E. P. Giri, M. I. Fanany and A. M. Arymurthy, “Combining generative and discriminative neural networks for sleep stages classification,” ArXiv Preprint ArXiv: 1610.01741, 2016. [Google Scholar]
9. M. Sharma, D. Goyal, P. V. Achuth and U. R. Acharya, “An accurate sleep stages classification system using a new class of optimally time-frequency localized three-band wavelet filter bank,” Computers in Biology and Medicine, vol. 98, pp. 58–75, 2018. [Google Scholar]
10. G. Zhu, Y. Li and P. Wen, “Analysis and classification of sleep stages based on difference visibility graphs from a single-channel EEG signal,” IEEE Journal of Biomedical and Health Informatics, vol. 18, no. 6, pp. 1813–1821, 2014. [Google Scholar]
11. S. Supriya, S. Siuly, H. Wang and Y. Zhang, “EEG sleep stages analysis and classification based on weighed complex network features,” IEEE Transactions on Emerging Topics in Computational Intelligence, vol. 5, no. 2, pp. 236–246, 2018. [Google Scholar]
12. A. R. Hassan and M. I. H. Bhuiyan, “A decision support system for automatic sleep staging from EEG signals using tunable Q-factor wavelet transform and spectral features,” Journal of Neuroscience Methods, vol. 271, pp. 107–118, 2016. [Google Scholar]
13. T. Kayikcioglu, M. Maleki and K. Eroglu, “Fast and accurate PLS-based classification of EEG sleep using single channel data,” Expert Systems with Applications, vol. 42, no. 21, pp. 7825–7830, 2015. [Google Scholar]
14. H. Shen, F. Ran, M. Xu, A. Guez, A. Li et al., “An automatic sleep stage classification algorithm using improved model based essence features,” Sensors, vol. 20, no. 17, pp. 4677, 2020. [Google Scholar]
15. A. J. Basha, B. S. Balaji, S. Poornima, M. Prathilothamai and K. Venkatachalam, “Support vector machine and simple recurrent network based automatic sleep stage classification of fuzzy kernel,” Journal of Ambient Intelligence and Humanized Computing, vol. 12, no. 6, pp. 6189–6197, 2021. [Google Scholar]
16. A. R. Hassan and M. I. H. Bhuiyan, “Computer-aided sleep staging using complete ensemble empirical mode decomposition with adaptive noise and bootstrap aggregating,” Biomedical Signal Processing and Control, vol. 24, pp. 1–10, 2016. [Google Scholar]
17. M. M. Rahman, M. I. M. Bhuiyan and A. R. Hassan, “Sleep stage classification using single-channel EOG,” Computers in Biology and Medicine, vol. 102, pp. 211–220, 2018. [Google Scholar]
18. X. Long, J. Foussier, P. Fonseca, R. Haakma and R. M. Aarts, “Analyzing respiratory effort amplitude for automated sleep stage classification,” Biomedical Signal Processing and Control, vol. 14, pp. 197–205, 2014. [Google Scholar]
19. H. Phan, F. Andreotti, N. Cooray, O. Y. Chén and M. De Vos, “Joint classification and prediction CNN framework for automatic sleep stage classification,” IEEE Transactions on Biomedical Engineering, vol. 66, no. 5, pp. 1285–1296, 2018. [Google Scholar]
20. Y. Sun, B. Wang, J. Jin and X. Wang, “Deep convolutional network method for automatic sleep stage classification based on neurophysiological signals,” in 2018 11th Int. Congress on Image and Signal Processing, BioMedical Engineering and Informatics (CISP-BMEIBeijing, China, IEEE, pp. 1–5, 2018. [Google Scholar]
21. A. Sors, S. Bonnet, S. Mirek, L. Vercueil and J. F. Payen, “A convolutional neural network for sleep stage scoring from raw single-channel EEG,” Biomedical Signal Processing and Control, vol. 42, pp. 107–114, 2018. [Google Scholar]
22. X. Zhang, M. Xu, Y. Li, M. Su, Z. Xu et al., “Automated multi-model deep neural network for sleep stage scoring with unfiltered clinical data,” Sleep and Breathing, vol. 24, pp. 581–590, 2020. [Google Scholar]
23. I. N. SM., X. Zhu, Y. Chen and W. Chen, “Sleep stage classification based on EEG, EOG, and CNN-GRU deep learning model,” in 2019 IEEE 10th Int. Conf. on Awareness Science and Technology (iCAST) IEEE, Morioka, Japan, pp. 1–7, 2019. [Google Scholar]
24. J. Zhang and Y. Wu, “A new method for automatic sleep stage classification,” IEEE Transactions on Biomedical Circuits and Systems, vol. 11, no. 5, pp. 1097–1110, 2017. [Google Scholar]
25. M. T. Sadiq, X. J. Yu and Z. H. Yuan, “Exploiting dimensionality reduction and neural network techniques for the development of expert brain–computer interfaces,” Expert Systems with Applications, vol. 164, pp. 114031, 2021. [Google Scholar]
26. M. T. Sadiq, X. J. Yu, Z. H. Yuan, Z. Aziz, S. Siuly et al., “Towards the development of versatile brain-computer interfaces,” IEEE Transactions on Artificial Intelligence, pp. 1, 2021. [Google Scholar]
27. A. Goldberger, L. Amaral, L. Glass, J. Hausdorff, P. C. Ivanov et al., “Physiobank, physioToolkit, and physioNet: Components of a new research resource for complex physiologic signals,” Circulation[Online], vol. 101, no. 23, pp. e215–e220, 2000, [online]. Available: https://physionet.org/content/uc-ddb/1.0.0/. [Google Scholar]
28. S. F. Quan, B. V. Howard, C. Iber, J. P. Kiley, F. J. Nieto et al., “The sleep heart health study: Design, rationale, and methods,” Sleep, vol. 20, no. 12, pp. 1077–1085, 1997. [Google Scholar]
29. L. Wu, C. Kong, X. Hao and W. Chen, “A short-term load forecasting method based on GRU-CNN hybrid neural network model,” Mathematical Problems in Engineering, vol. 2020, pp. 1–10, 2020. [Google Scholar]
30. K. Cho, B. Van Merriënboer, C. Gulcehre, D. Bahdanau, F. Bougares et al., “Learning phrase representations using RNN encoder-decoder for statistical machine translation,” ArXiv Preprint ArXiv, pp. 1406.1078, 2014. [Google Scholar]
31. J. Chung, C. Gulcehre, K. Cho and Y. Bengio, “Empirical evaluation of gated recurrent neural networks on sequence modelling,” ArXiv Preprint ArXiv, pp. 1412.3555, 2014. [Google Scholar]
32. S. Roy, I. Kiral-Kornek and S. Harrer, “Chrononet: A deep recurrent neural network for abnormal EEG identification,” In Conference on Artificial Intelligence in Medicine in Europe, Poznan, Poland, pp. 47–56, 2019. [Google Scholar]
33. B. Xu, N. Wang, T. Chen and M. Li, “Empirical evaluation of rectified activations in convolutional network,” ArXiv Preprint ArXiv, pp. 1505.00853, 2015. [Google Scholar]
34. A. Supratak, H. Dong, C. Wu and Y. Guo, “Deepsleepnet: A model for automatic sleep stage scoring based on raw single-channel EEG,” IEEE Transactions on Neural Systems and Rehabilitation Engineering, vol. 25, no. 11, pp. 1998–2008, 2017. [Google Scholar]
35. J. Chung, C. Gulcehre, K. Cho and Y. Bengio, “Empirical evaluation of gated recurrent neural networks on sequence modelling,” ArXiv Preprint ArXiv, pp. 1412–3555, 2014. [Google Scholar]
36. C. M. Bishop, “Pattern recognition and machine learning,” in Springer Science and Business Media, 1st ed., Springer press, New York, USA, vol. 1, pp. 115, 2006. [Google Scholar]
37. M. Abadi, A. Agarwal, P. Barham, E. Brevdo, Z. Chen et al., “Tensorflow: Large-scale machine learning on heterogeneous distributed systems,” ArXiv Preprint ArXiv,1 603.04467, 2016. [Google Scholar]
38. A. Stochholm, K. Mikkelsen and P. Kidmose, “Automatic sleep stage classification using ear-EEG,” in 2016 38th Annual Int. Conf. of the IEEE Engineering in Medicine and Biology Society (EMBCIEEE, Orlando, FL, USA, pp. 4751–4754, 2016. [Google Scholar]
 | This work is licensed under a Creative Commons Attribution 4.0 International License, which permits unrestricted use, distribution, and reproduction in any medium, provided the original work is properly cited. |