DOI:10.32604/cmc.2022.021406
| Computers, Materials & Continua DOI:10.32604/cmc.2022.021406 | |
| Article |
Analysis of Flow Structure in Microturbine Operating at Low Reynolds Number
1King Abdulaziz University, Deanship of Scientific Research, Jeddah, Saudi Arabia
2King Abdulaziz University, Electrical and Computer Engineering Department, Jeddah, Saudi Arabia
3Université de Sherbrooke, Interdisciplinary Institute for Technological Innovation (3IT), Sherbrooke, Canada
*Corresponding Author: Mohamed Omri. Email: mnomri@kau.edu.sa
Received: 02 July 2021; Accepted: 03 September 2021
In this paper, three-dimensional flows in laminar subsonic cascades at relatively low Reynolds numbers (Re < 2500) are presented, based on numerical calculations. The stator and rotor blade designs are those for a MEMS-based Rankine microturbine power-plant-on-a-chip with 109-micron chord blades. Blade passage calculations in 3D were done for different Reynolds numbers, tip clearances (from 0 to 20%) and incidences (0° to 15°) to determine the impact of aerodynamic conditions on the flow patterns. These conditions are applied to a blade passage for a stationary outer casing. The 3D blade passage without tip clearance indicates the presence of two large symmetric vortices due to the interaction between hub/casing boundary layers and the blade. Opening the tip clearance introduces the tip vortex, which tends to become dominant above a tip clearance of 10%. In addition to providing a description and understanding of the 3D flow in a MEMS microturbine, these results suggest the importance of considering 3D flows in the design of microturbomachinery, even though the geometry is dominantly 2D.
Keywords: Microturbomachinery; turbine; vortex; internal flows; secondary flows
Power generation is no more limited to utility-scale power plants. Gas turbine power generation units on the 10–100 kW scale, for example, are increasingly used for energy autonomy or co-generation in some industrial installations. We could go further and imagine distributed power generation down to the 1–100 W scale. This would address the growing need for portable and distributed power to drive hand tools, mobile electronics and distributed sensors. With common manufacturing technologies however, creating miniature heat engines at such small scale is not economically viable. Instead, we currently rely on batteries that are charged through the grid, offering limited power density and autonomy. To address the need for portable power, the concept of low-cost, batch manufactured micro heat engines has been proposed [1] and stimulated the development of multiple MEMS gas turbine and steam turbine research and development efforts worldwide [1–5]. Somewhat similar to their large-scale counterparts, these microengines implement thermodynamic power cycles, but within cm-scale volumes and with micron-scale features using semiconductor wafer manufacturing technologies. These techniques consist of using photolithographic patterning to imprint large arrays of micron-scale features onto a silicon wafer, in a single step. The features are then etched down into the silicon substrate to form the micro-engine structures and fluidic channels. These techniques initially developed by the microelectronics industry for integrated circuit fabrication have since been applied to create microelectromechanical systems (MEMS), such as miniature sensors, actuators, and microfluidic systems. Photolithographic patterning, thin film deposition, and etching have allowed the fabrication of mechanical parts and microfluidic channels in silicon, as well as their integration with electrical components. Although this approach limits the structures to planar 2D extruded geometries, it allows parallel and batch fabrication with sub-micron tolerances at low unit cost. It has successfully been applied to create dime-size planar microturbines, as shown in Fig. 1, with thousands of 100 µm chord blades formed by a single silicon etch.
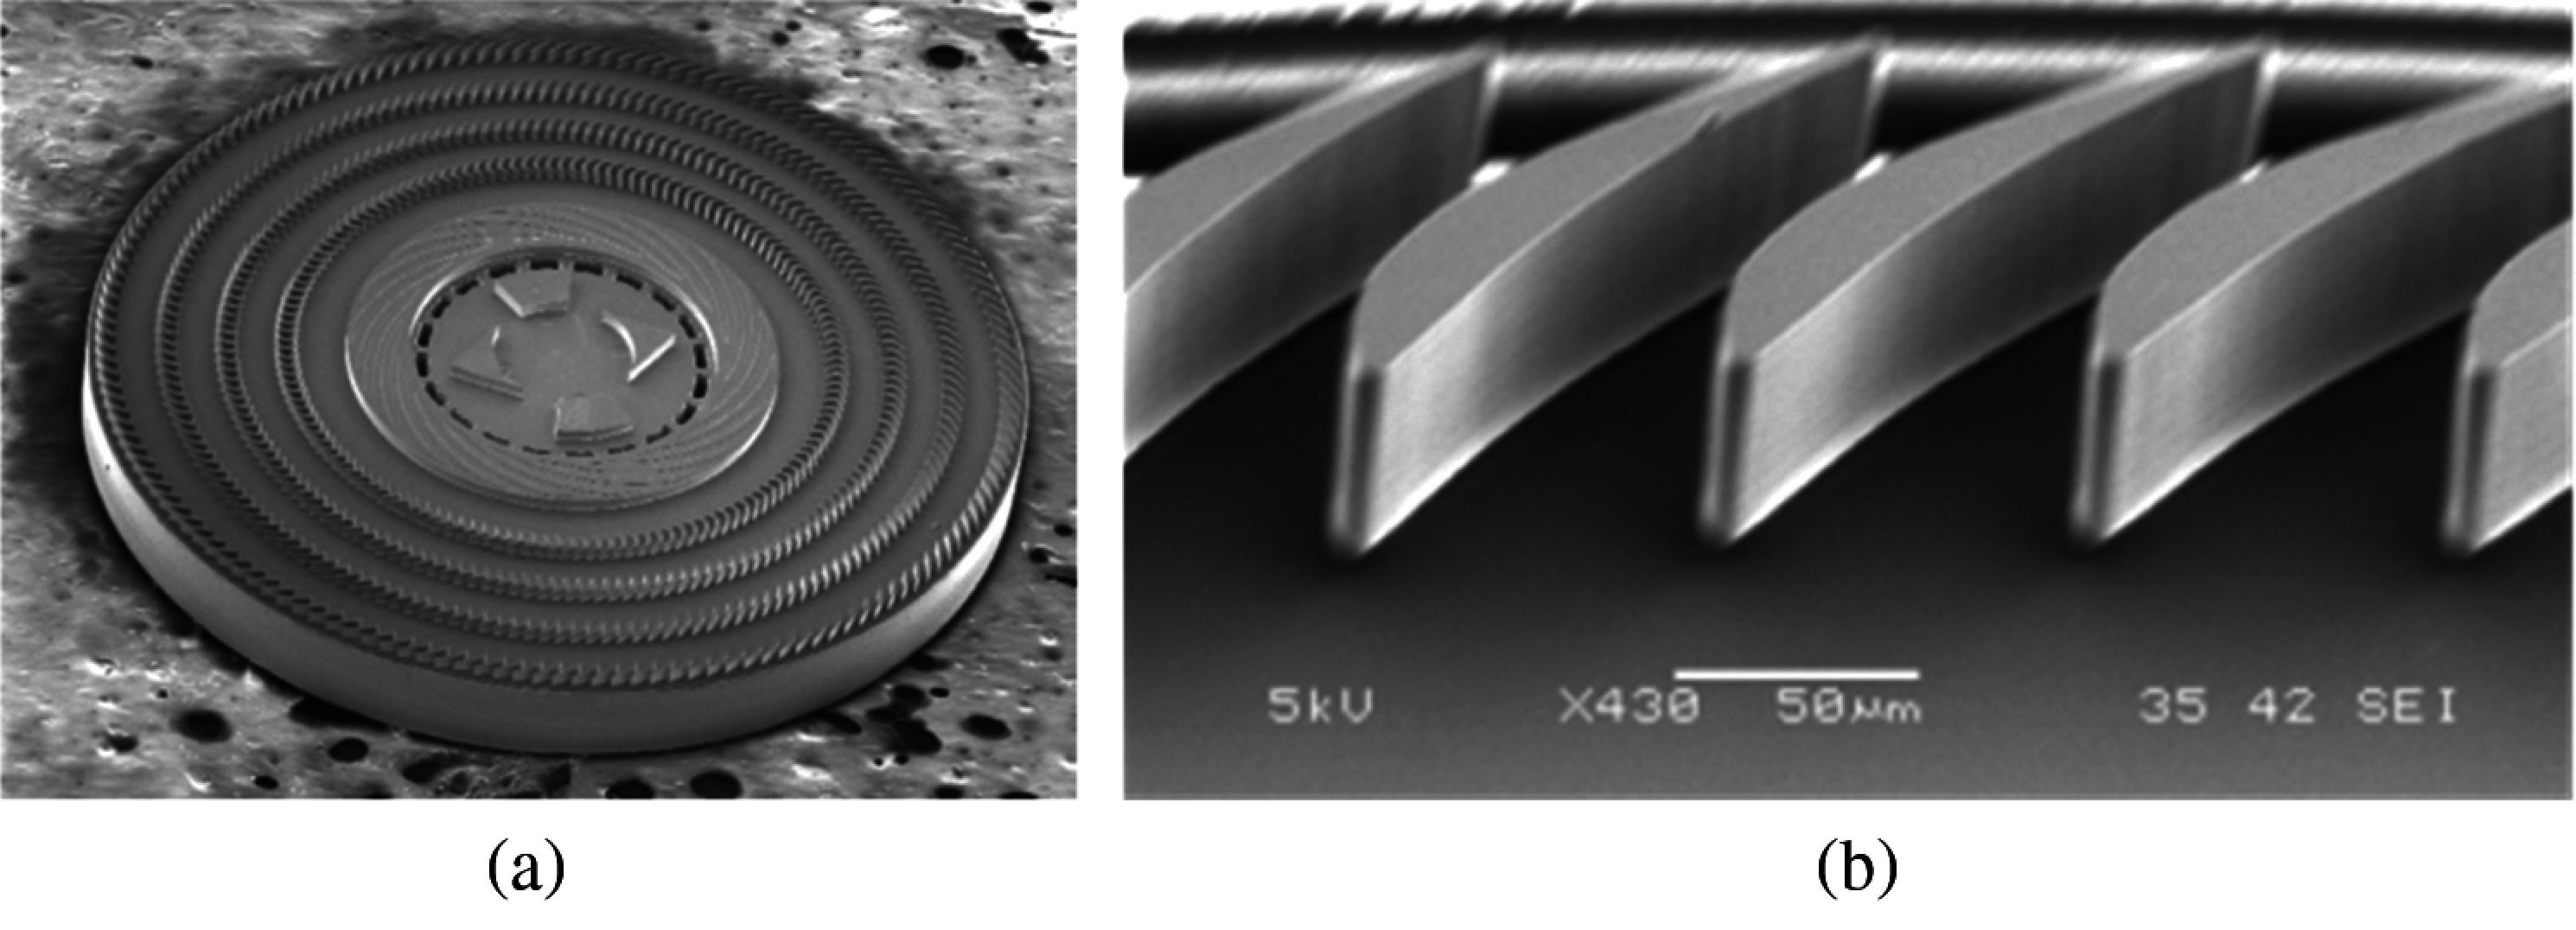
Figure 1: Typical MEMS microturbine fabricated by lithography and etching of silicon [6]. (a) Rotor (4 mm dia.), (b) Blade row
Understanding the source of losses in these unprecedented conditions is one of the goals of the present study. Since the microfabrication techniques used here lead to straight (no twist) and uniform height blades, numerical studies of the aerothermodynamics has focused on 2D cascades, assuming a planar flow field. They have led to loss correlations as a function of Rec, Mach number and incidence, for a limited range of blade and cascade geometries [6,7]. It has been shown that profile losses tend to increase significantly for Rec < 1000, suggesting minimum blade chords on the order of 100 microns. In this range, thickness of the boundary layers developing along the blades tends to be on the order of the blade passage width, which is significantly different from the thin boundary layers typical of macroscale turbines. These studies neglect however the three-dimensional flow components that stem from hub and casing boundary layers and tip leakage flows. Initial numerical studies in a 3D blade passage (but without tip clearance) identified the presence of vortical structures that can also extend across the blade passage, making their contribution to the overall losses significant [8]. Similar studies of 3D microturbomachinery flows in the flow passage of a single stage micro gas turbine suggest that secondary flows can increase losses by up to 50% based on the 2D profile losses, for Rec > 10,000 [9]. A correction factor was defined to extrapolate the 3D losses from 2D CFD calculations to facilitate the design process, but without linking this factor to actual flow structures and loss mechanisms. The effect of wall shear due to relative motion of the blade passage with respect to the casing was also shown to impact the efficiency of a microturbine, but only global loss parameters were studied [10]. The three-dimensional flow field remains largely unexplored and the related loss mechanisms ill-defined. To enable the development of microturbomachinery-based heat engines, an understanding of the 3D flow structures in representative configurations, including tip clearance, is therefore essential. This is a second objective of the present study.
1.1 Vortical Flow Structures in Macroscale Turbomachinery
The vortex dynamics in the case of a traditional turbine cascade, with turbulent flow and large Reynolds number (Rec > 500,000) has been described by different authors [11–18]. In a turbine cascade with tip clearance, the leakage flow generates a vortical structure located in the upper half span of the blade, which worsens the aerodynamic characteristics in this area due to dissipation of the vortex energy and mixing losses. In addition, velocity gradients in the boundary layer developing on the hub and casing surfaces lead to horseshoe vortices that wrap around the blade with one leg of this vortex along the pressure side and the other leg along in the suction side. The pressure side leg is amplified and becomes the main passage vortex. The other leg (suction side) is drawn into the adjacent blade passage and has an opposite sense of rotation to the larger passage vortex. The tip vortex generated by the presence of a tip clearance flow, interacts with the upper passage vortex, adding to the flow complexity. In macroscale turbomachinery, these vortical structures are limited near the hub and casing walls, leaving a 2D core flow along most of the blade span. In addition to these main vortices, which are the principal loss sources, various secondary vortices may also be present [19], such as corner vortices that appear at the junction of blade and endwall, and induced vortices, that result from the interaction between the passage vortex and the suction side wall.
This work provides a comprehensive description of the 3D flow structure in subsonic laminar microturbomachinery, considering tip clearance effects on the flow structure and losses. Computational fluid dynamics (CFD) finds its rightful place since it is difficult and even impossible to give a fine experimental description of the flow within those small devices. Unlike macro-scale turbomachinery aerodynamics this numerical study focuses on laminar flow given the relatively low Rec in microturbomachines. The blade configuration and operating range are representative of the multi-stage steam microturbine proposed by Fréchette et al. [20] to implement the Rankine vapor power cycle on a chip. As in macro-scale turbines [21–23], a small annular tip clearance between the rotor blade tip and the casing is required. At microscale, the clearances are typically larger (relative to the blade height) however to accommodate imperfections due to the etching process and bearing tolerances. Microturbine rotors are typically supported by fluid film bearings that allow microns of tip deflection. Thus, a tip clearance of 5% of the blade height is considered as a minimum limit, while tip clearances up to 20% have been required in microturbomachines [24]. First, the structure and evolution of the vortices are detailed. A broad yet detailed investigation over the operating range and design space was required to properly identify the changes in vortex dynamics. Special importance is given to the dynamics of the tip vortex when increasing the tip gap size given its significant impact on losses. A range of tip clearances is considered from 0% (ideal geometry) to 20% of the passage height, based on the typical values achieved by microfabrication. For each geometry, incidences from 0° to 15° are considered. Following a description of the numerical model (Section 2), we present the 3D flow structure and vortex dynamics (Section 3). The effects of varying the tip clearance gap are presented in Section 4. Analytical criteria are also defined to determine when the dominant flow structures are to be expected, providing a basis for 3D-aware microturbomachine design.
2 Description and Modelling of the Problem
The blade passage modeled here is based on a steam microturbine currently under development [25]. It consists of a 4-mm diameter rotor with a single radial turbine stage. It is designed to operate at 1.2 × 10⁶ RPM (Ω = 125714 rad/s), which corresponds to a tip speed of approximately 250 m/s. The nominal blade dimensions are 109 microns chord and 100 microns height. The rotor blade is obtained by modifying the A3K7 profile [26]. We consider a single blade passage to give an adequate description of the flow and losses within this radial turbine. Fig. 2 gives all details about the computational domain and also surfaces where losses are calculated. The fluid is water vapour entering at 600 K, considered as a compressible ideal gas. Stationary adiabatic calculations are performed at different incidences (α = 0°, 5°, 10° and 15°) and different tip clearances (0%, 0.5%, 1.5%, 2.5%, 5%, 7.5%, 10%, 15% and 20%), varying the inlet total pressure and the scale of the cascade to vary the chord-based inlet Reynolds number from 40 < Rec < 2500, while maintaining Mach number within 0.3 < M < 0.5. Losses are calculated by taking averaged properties at the cascade’s inlet (S1) and outlet (S3); plots will also be shown at the mid-chord plane (S2) (Fig. 2).
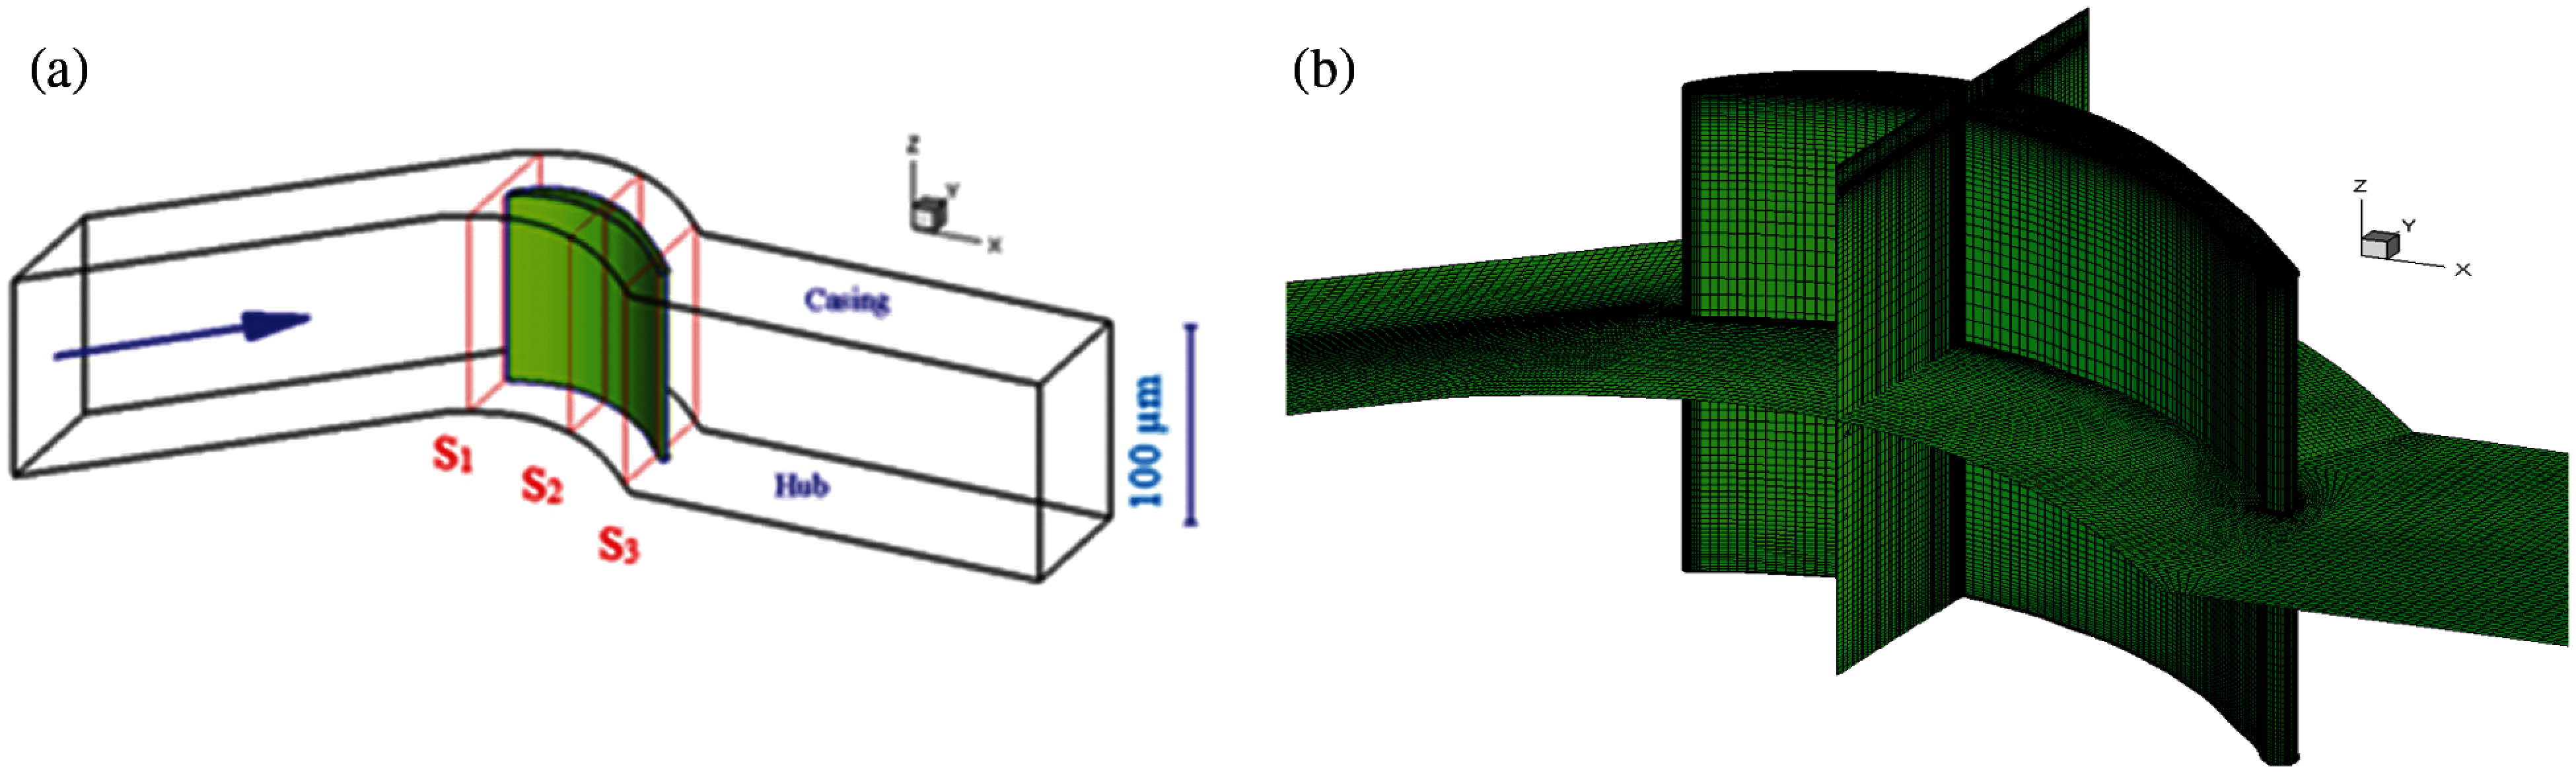
Figure 2: Computation domain and discretization for the CFD calculations of the microturbine cascade. (a) Sketch of the cascade computational domain, showing the relevant planes and sections. (b) Computational discretization, showing grids on the blade surfaces and cross-sections to illustrate the refined grids near the tip clearance, blade surface, leading edge and trailing edge
The coupled partial differential equations describing the flow field are discretized with the finite volume method, using a commercial solver (Ansys-Fluent). Second order upwind discretization is used. The rectangular staggered grid is non-uniform in both directions: it is finer near the walls and in the tip clearances where gradients are more important. Grid size plays an important role in both convergence and accuracy of the solution. It was indicated that in the 2D case (x-y plane), 20,000 triangular nodes are sufficient to force grid independence [7,24,27] and that 15000 rectangular nodes give identical results [8]. Since the 3D geometry is simply a sweep of the 2D profile, the mesh can be described by its discretization in the three main components. Grids with increasing density were tested for blade passage without tip clearance as a reference. The study indicates that a minimum grid of 40 nodes in the Z direction is sufficient to capture losses, which is consistent with the fact that a minimum number of twelve nodes allow a representation of the boundary layer [28]. Nevertheless, further refinement of the grid was motivated by the desire to represent well the details of the vortices. Tab. 1 shows the final grid density, divided into three blocs (upstream of the leading edge, the blade passage, and downstream of the trailing edge).
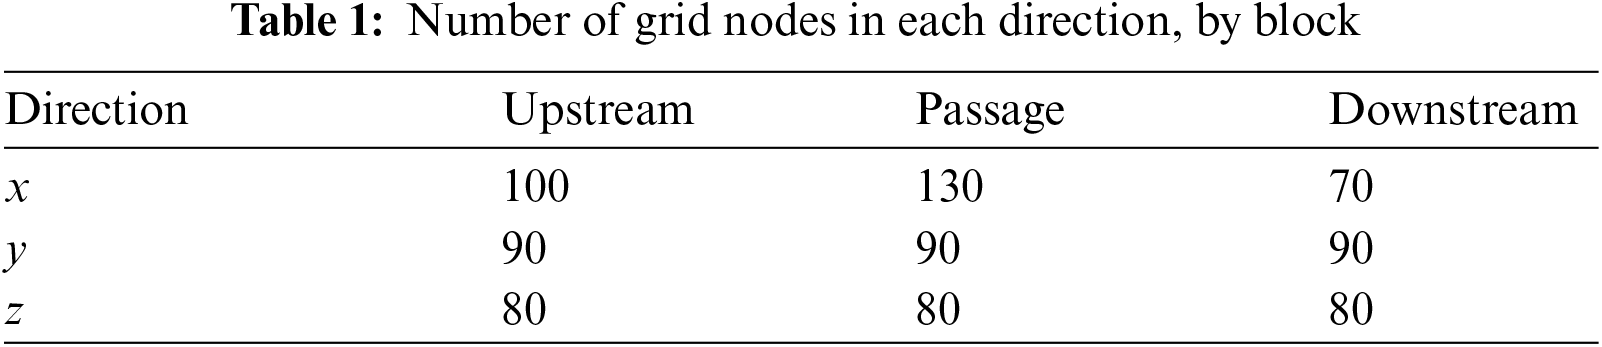
When a tip clearance is added, we maintain the same mesh up to the blade height, but with an additional mesh to cover the gap. For tip clearances of 0.5%, 1.5%, 2.5%, 5%, 7.5%, 10%, 15% and 20% of blade height the added number of grid nodes along z are 6, 12, 16, 18, 26, 30, 30 and 30 respectively. Doubling the number of grid nodes in the tip clearance was verified not to change the results. Convergence is declared when the cumulative residuals for all conservation equations are less than at least 10–10 and when the drag coefficients are mainly constant especially on the top wall of the blade.
3 Description of the Flow Structures
The design of recent microturbines has been generally based on 2D calculations, since classical turbines generally exhibit a core meridional flow that validates the 2D assumption. The present study is the first detailed investigation of the 3D flow structures in microturbine to support future design efforts. This section presents the vortical flow structures, consisting of the horseshoe to passage vortex, the tip vortex and the rest of secondary vortices. To clearly distinguish the tip vortex from the passage vortex, a cascade without tip clearance (referred to as ideal) is considered first. Influence of Reynolds number on the passage vortex is analysed. Secondly the more realistic configuration with tip clearance is studied, followed by a discussion of the secondary vortices also present. To visualise the vortical structures, the Q criteria [29] is used, which is the second invariant of the velocity gradient tensor. The rotation direction is identified by coloring the vortices by the helicity (defined by the dot product of vorticity (curl of the flow velocity) and the velocity vector) and also adding some streamlines.
3.1 Idealised Case without Tip Clearance
The inlet boundary layers that form along the casing and hub endwalls result in y-vorticity that can be viewed as vortex filaments in the lateral direction. As they meet the blade, they wrap around it, creating a horseshoe vortex around the obstacle (Fig. 3(a)). In a blade passage, we therefore expect two branches of adjacent horseshoe vortices, along the pressure side of one blade and the suction side of the adjacent blade [16]. This is observed at the hub, but also symmetrically at the tip, for the ideal case of a cascade with no tip clearance flow. Figs. 3(b)–3(d) illustrate the simulated flow structures with no tip clearance, showing this symmetry. In Fig. 3(b), the value of the Q-factor chosen to draw the iso-surfaces was sufficiently high to only show the most dominant vortical structures, which are the horseshoe vortices. The pressure-side leg is amplified by the passage pressure-to-suction endwall flow and becomes the passage vortex, while the other leg (suction side) is weaker and has an opposite sense of rotation. Its presence is identified by streamlines and the Q-factor contours further downstream, where it gets wrapped around the pressure-side leg of the adjacent horseshoe vortex [17]. The other vortical structures in Fig. 3(b) correspond to z-vorticity in the boundary layer on the suction side as well as at the blade blunt trailing-edge, from the onset of some vortex shedding. Globally, the horseshoe vortex legs combine to form a pair of quasi-symmetrical, quasi-identical counter-rotating blade passage vortices (the lower is clockwise), which are positioned along the suction side near the hub and casing endwalls (Figs. 3(b) and 3(c)). The present vortices dominate totally the flow and the secondary flow is here the primary one, which is a major difference with classical turbines. Indeed, at first glance there is no core flow by reference to the classical cases and the 2D assumption does not fit in this case.
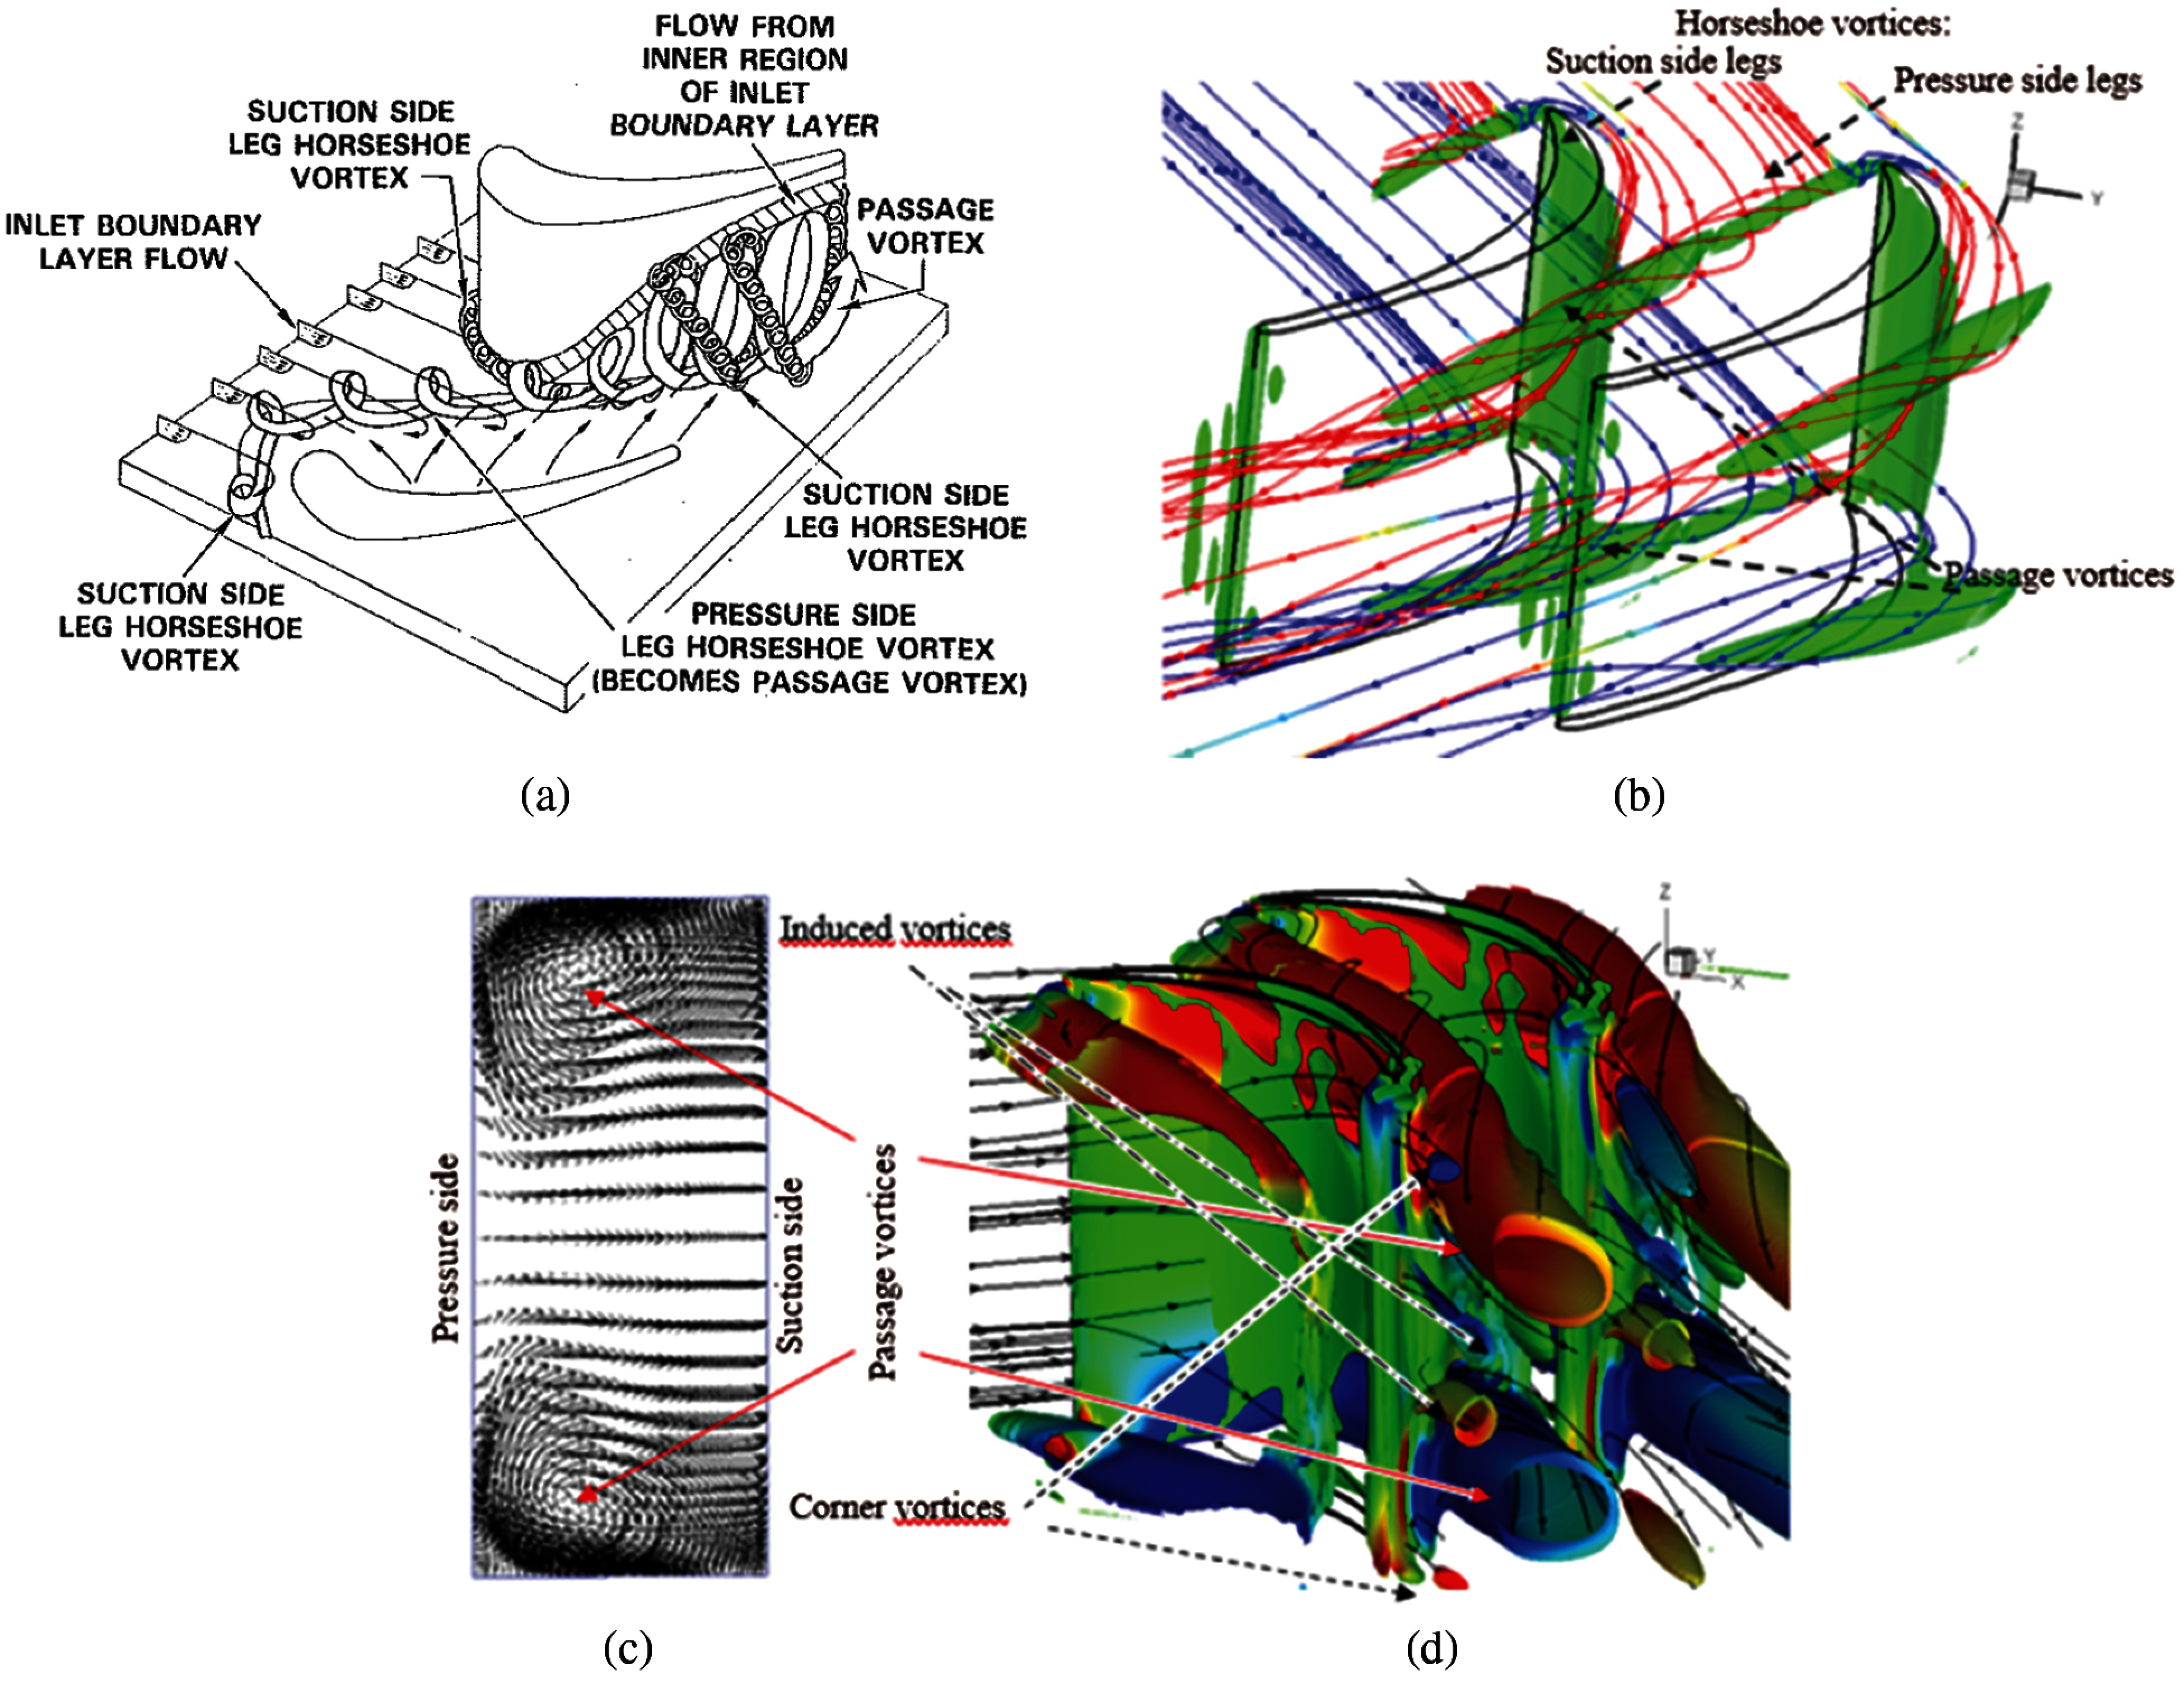
Figure 3: Vortex structures for a micro-cascade with no tip clearance at Re = 1200 ± 50. (a) Schematic of horseshoe vortex and formation of the passage vortex, according to [16]. (b) Three dimensional dominant vortical structures illustrated by Q-factor contour and streamlines, showing the pressure and suction side legs of the horseshow vortex, and the passage vortex that results (tip 0%). (c) Velocity vectors at mid-chord plane. (d) Vortex structures in the turbine cascade (Q-Factor colored by the helicity)
The secondary flow is no longer localised at the hub and the casing. This total large volume occupied by vortices is characteristic to the low Reynolds number; at high Reynolds numbers typically found in large-scale turbomachinery (Re > 105), the secondary flows are localised near the hub and casing [27]. As mentioned in the introduction, the microturbines considered here operate in the laminar regime (Rec < 2500), and in this range the flow topology is affected by varying the Reynolds number. From a shape point of view, increasing the Reynolds number deforms the vortex, which is more symmetrical about its axis at the lowest Reynolds numbers (Fig. 4). Thus, increasing the Rec results in a tendency to crush the vortex on the suction side and end wall (hub or casing) leaving more space for the core flow and affecting the losses related to these secondary flows. The low Rec found in microfabricated turbines is also expected to increase profile losses [25], as shown here by the 2D calculations in Fig. 4. The profile losses are considered in the ideal case (no tip clearance) for a 0° incidence as an example, defined as:
where the average of each quantity
We notice a gradual increase in profile loss from Rec = 2500 to 1000, followed by a dramatic increase as Rec is reduced below 500. The 3D losses, which include profile losses and secondary flow losses, follow the same trend, with an apparent bias increase. It can be noticed that secondary flow losses are the largest contributor, compared to the profile losses above Rec of 1000, stressing the importance of analysing the 3D flows.
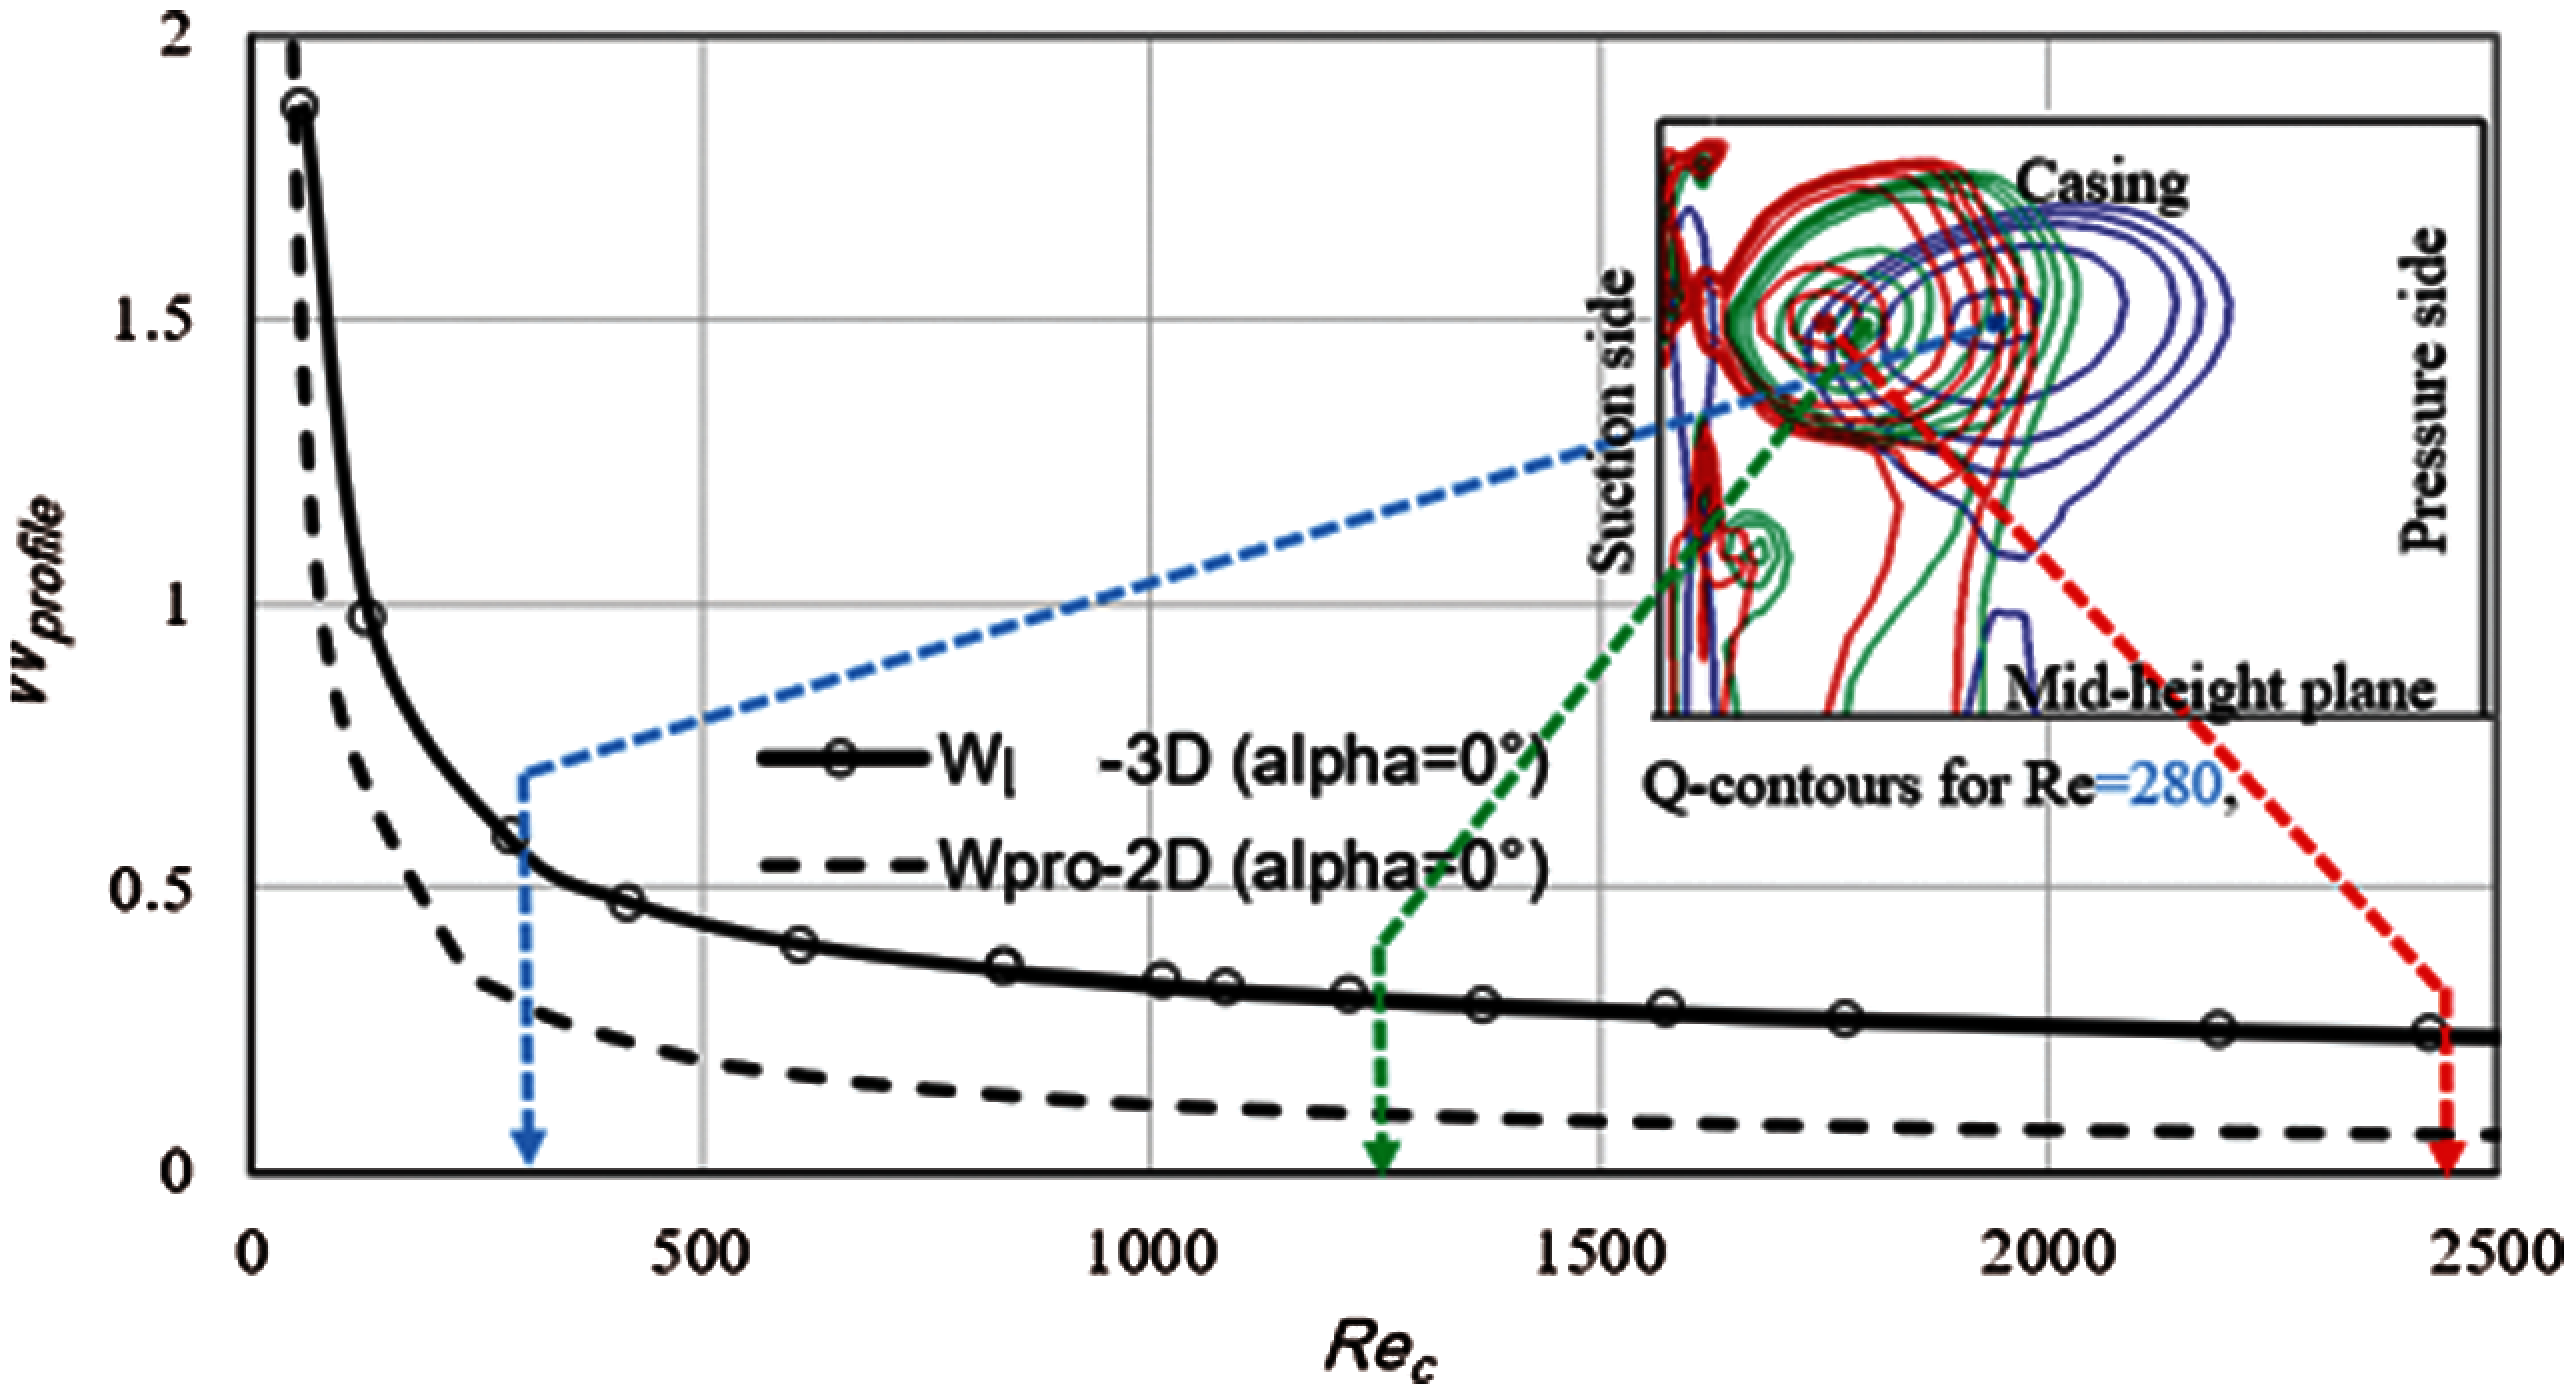
Figure 4: Losses versus Reynolds number for an ideal cascade (no tip clearance) with zero incidence. The inset of Q-contours shows that the top passage vortex becomes less dominant (pushed towards the blade and casing).
In addition to the dominant passage vortex, we notice secondary vortices in Fig. 3(d). Although the dominant vortices mostly contribute to the loss generation in the inter blades region, comprehension of the flow structure and minimization of losses are conditioned by all the vortices. Secondary vortices generally appear near the trailing edge, as sees in Fig. 3(d), adding more complexity in the mixing region. A first type of secondary vortex appears resulting from the interaction between the dominant vortices and the flow in the center of passage called induced vortices [30]. This vortex develops near the mid-height of the blade suction side. When the passage vortex moves away from this wall appears a zone where the fluid is almost quiescent (separation region), the rotation effect of the passage vortex induced the rotation of fluid in this zone like the corner vortex in a cavity. By symmetry there are two counter rotating vortices. These are also called concentrated shed vortex (CSV), as indicated by Kang [11]. Finally, we can also notice in Fig. 3(d) another pair of smaller secondary counter rotating vortices adjacent to the hub and casing, that forms along the suction side of the blade, also found at higher Rec and called corner vortices [30].
3.2 Tip Vortex with Tip Clearance Gap
Between the blade pressure side and the suction side tends to force the flow through the clearance gap. This short-circuit flow is a major source of inefficiency in a turbine [22]. This leakage can induce a tip vortex and affect the flow in the upper half span of the blade. Downstream of the trailing edge, the flow field is characterized by a strong local flow blockage in the tip region which is important and the dominant source of loss within the blade passage upper region. Thus, increasing tip clearance leads automatically to increase losses; then seen the importance of manufacturing turbines with the lowest possible clearance. This is not the case in micro-fabrication, where a tip clearance of less than 5% is difficult to be obtained and a tip clearance 10% is realistic or even more. The tip vortex then appears which is shown by the vorticity layer near the suction side of the blade (Fig. 5). This clockwise turning vortex modifies the position and the direction of the counter-clockwise top passage vortex and also reduces the shape of the upper induced vortex. The size of the tip vortex mainly depends on the tip clearance gap and the pressure difference. Presence of the passage vortex results in a deformation of the tip vortex in the mixing region. At the blade exit, we also notice that the top corner vortex is carried away by the tip vortex since they are turning in the same direction. Given the strong impact of the tip clearance on the flow structure, the following sections will further investigate the parameters that affect it, including the tip clearance size (Section 4) and the effect of a relative wall motion, as would be experienced in a rotating machine (Section 5).
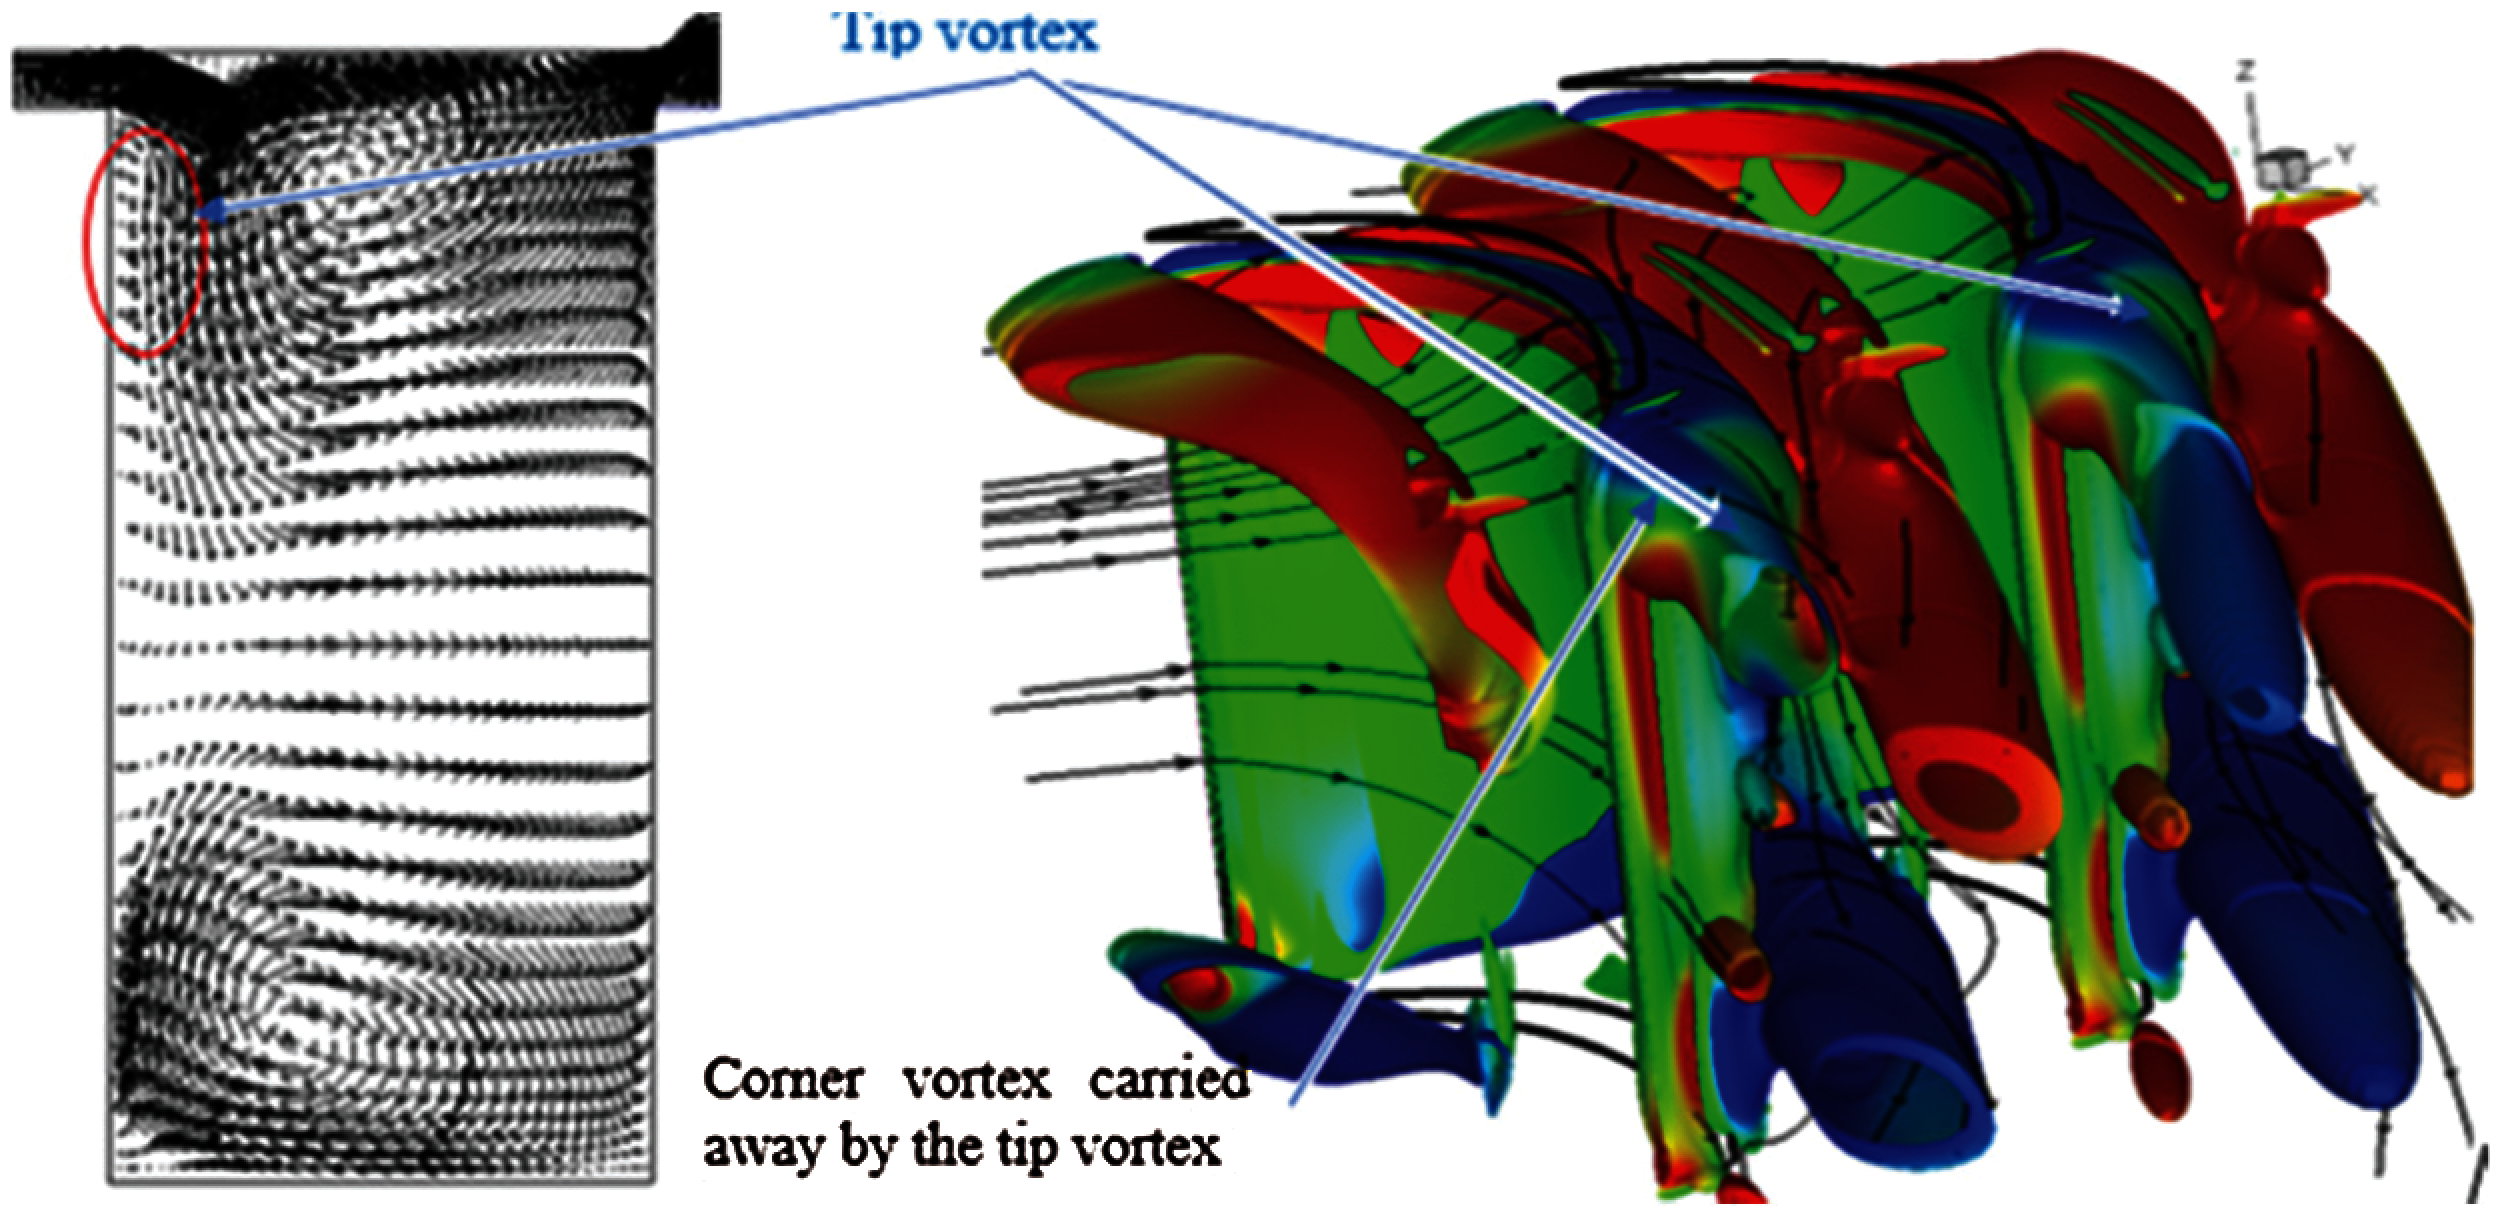
Figure 5: Appearance of the tip vortex with tip clearance gap and interaction with the upper passage vortex (Q-criterion with tip clearance 5%, with mid-chord cross section vector field)
4 Effects of the Tip Clearance Size
4.1 Flow Topology and Existence of the Tip Vortex
The above observations with no tip clearance remain valid when the tip clearance size remains small. As seen in Fig. 6, which shows the vorticity magnitude contours for different small tip clearances (0%, 0.5%, 1.5% and 2.5%) in the mid-chord plane, the two passage vortices that results from the horseshow vortex remain well defined. It also indicates an absence of the tip vortex at low tip gaps but a loss of symmetry between the two passage vortices when increasing the tip gap size.

Figure 6: Vorticity magnitude contours at the mid-chord plane for small tip clearance, showing the absence of a tip clearance vortex below 2.5% tip clearance (Stationary blade at Re = 1200 ± 50)
For larger tip clearance gaps (10%), the presence of the tip vortex is characterized by its large size compared with the passage vortex (Fig. 7). As seen in this figure, the tip vortex dominates the upper region making the passage vortex secondary in the cases of gaps 10% and more. This means more complexity, since the tip vortex becomes dominant and takes the place of the top passage vortex. The top passage vortex becomes distorted and disappears progressively along the flow. At the exit plane, the two principal vortices are rotating in the same direction.
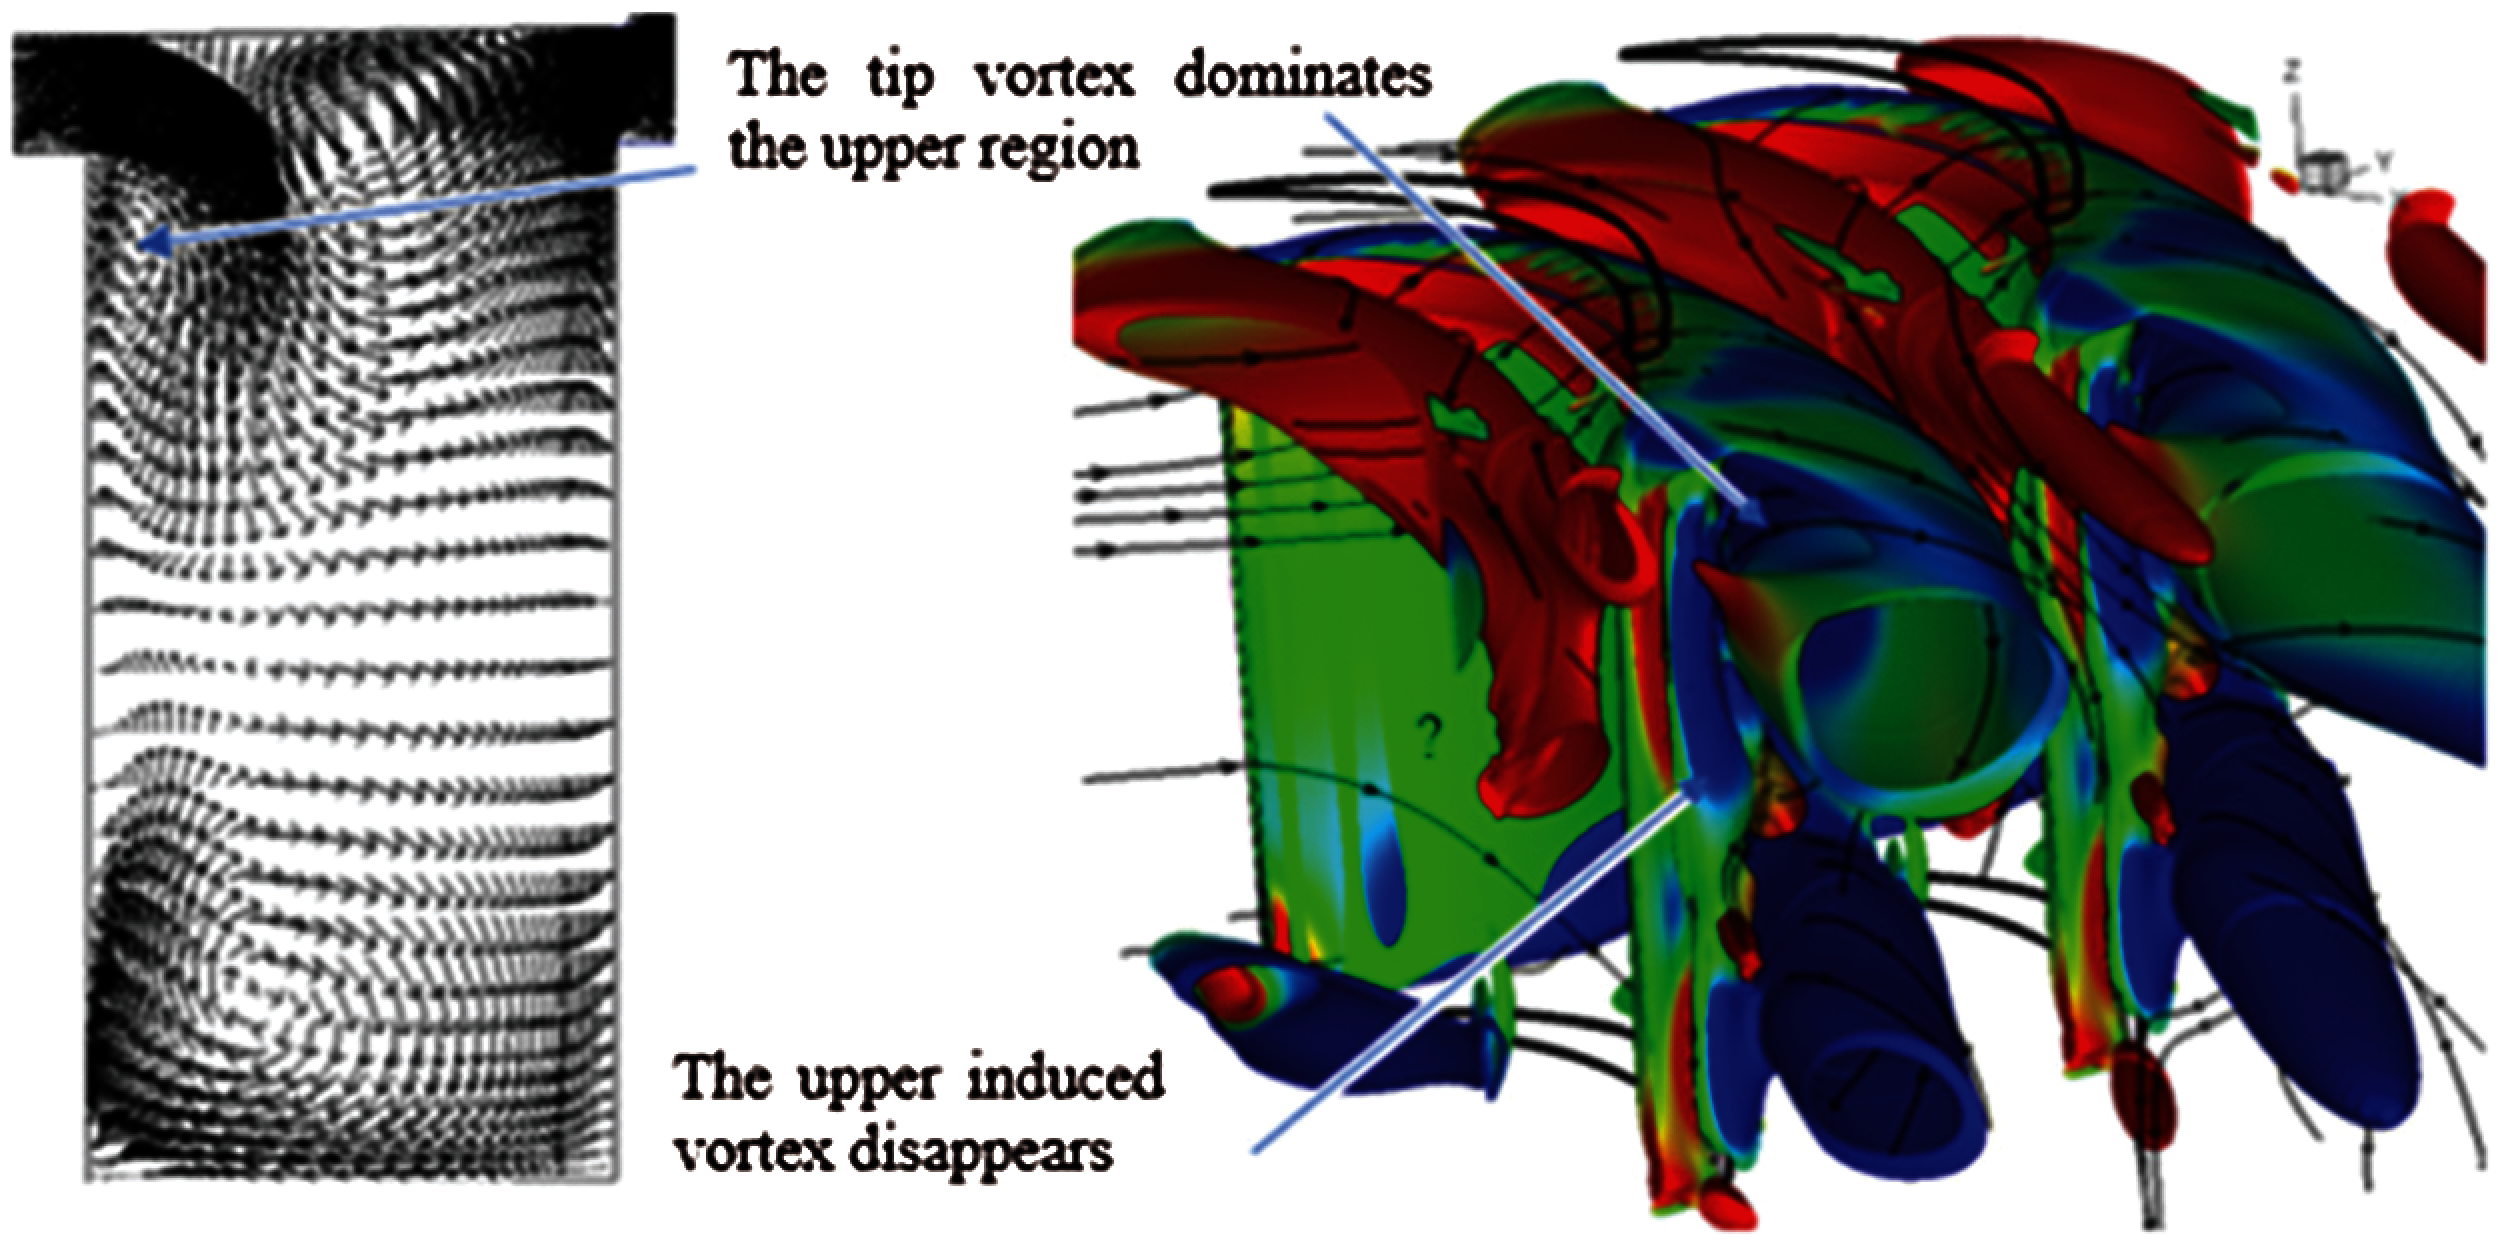
Figure 7: Dominant tip vortex over top passage (horseshoe) vortex (Q-criterion with tip clearance 10%, and mid-chord cross section vector field)
As summarized in Fig. 8, increasing the tip clearance size results in an increased size of the tip vortex. This figure also indicates that 3 different regimes occur:
---For the 2.5% tip clearance (or less), there is no tip vortex, so the structure of the flow is comparable to the ideal cascade but slightly asymmetric.
---For a 5% tip clearance, the tip vortex is present and does not exclude the top existing passage vortex (analogous to classical turbomachines). The structure of the flow is based on that of an ideal flow passage (dominant passage vortex), with the additional presence of the tip vortex.
---For the 10% tip clearance or more, the flow configuration changes totally: the tip vortex becomes dominant over the top passage vortex.
Another important visual result from this figure is that increasing the gap size makes the tip vortex larger and leads to more mixing and then more losses are expected. To explain these regimes and better determine the criteria that defines their ranges, the following sections will further analyse the tip clearance flow and the forces at play and formulate an analytical criterion.

Figure 8: Contours of vorticity magnitude at mid-chord plane, for increasing tip clearance size (2.5% to 20%), showing the transition from no tip vortex to a dominant tip vortex. (a)-tip 2.5%; (b)-tip 5%; (c)-tip 10%; (d)-tip 20%
4.2 Flows in the Tip Clearance Region
As indicated in the introduction, nine different tip gap sizes have been considered (0, 0.5, 1.5, 2.5%, 5%, 7.5%, 10%, 15% and 20%) in order to clarify some point such as the appearance of the tip vortex and the occupation of the top region (near the casing) by the tip vortex or by the passage vortex. From the CFD results, the flow rate and forces acting in the tip clearance region can be analysed to define the regimes for tip vortex formation. To do so, a control volume containing the tip clearance region is used, as illustrated in Fig. 9. From mass conservation in steady state, the mass flow rate is constant throughout the tip clearance and can be calculated at the entry or exit. The balance of wall shear and pressure force will also applied in this control volume. Fig. 10(a) shows the leakage mass flow rate versus the tip clearance size. Generally, the leakage flow increases with gap size and follows a linear trend for large tip clearance (>8%). For small tip clearance (<3%), the flow rate follows a trend for Poiseuille flow [31], as shown by the dashed line in Fig. 10(a), and appears to represent a viscous dominated regime. This is better shown by the force balance presented in Fig. 10(b), which compares the flow leakage driving effect of the increment of blade tip pressure difference caused by the blade loading (solid line) to the viscous resistance in the gap (dashed line).
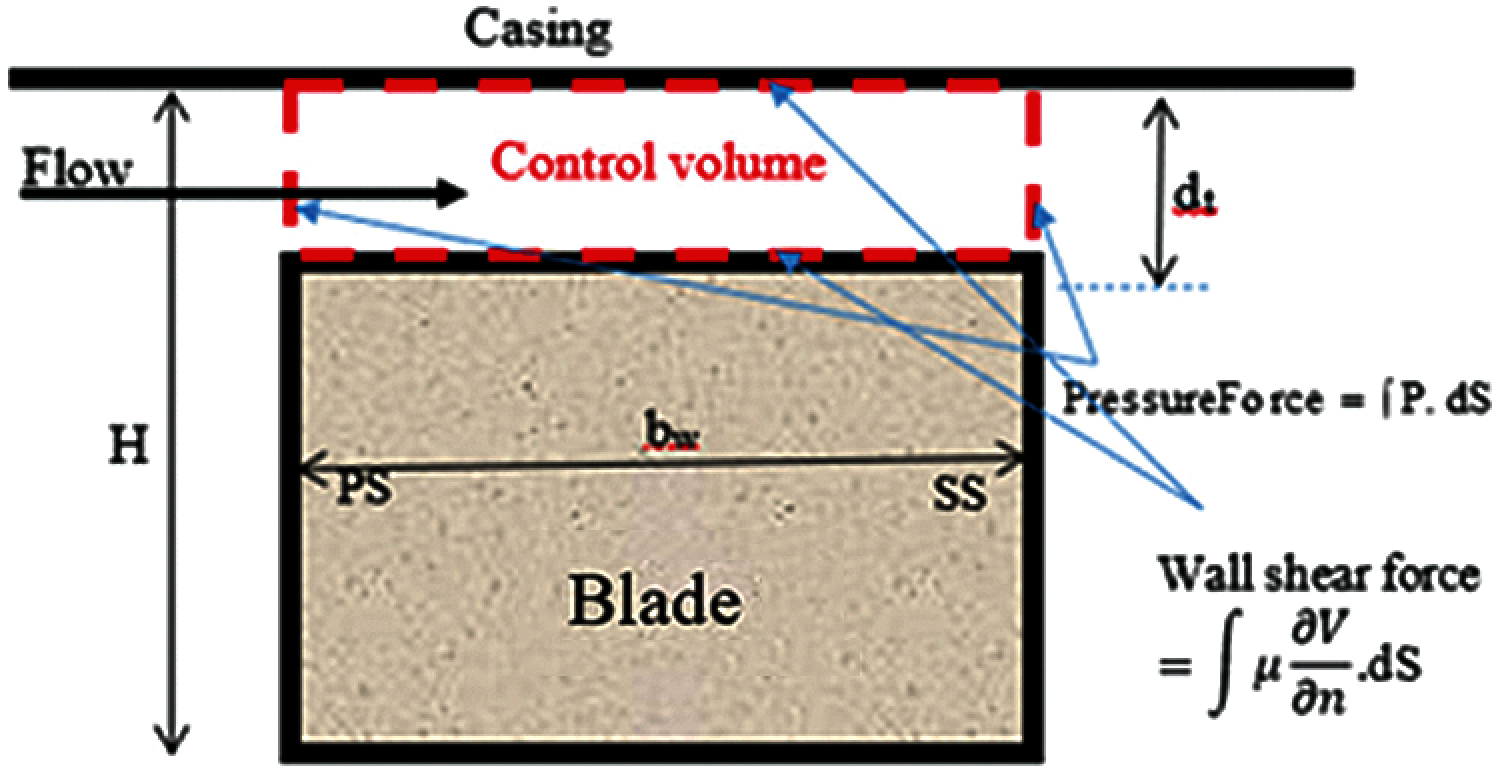
Figure 9: Schematic of the tip clearance control volume with the forces
For a tip clearance lower than ∼3%, the wall shear force is dominant and this correlates with the absence of the tip vortex observed in the previous section. The dominance of this force in the tip clearance is also coherent with the flow rate characteristic of Poiseuille flow, as indicated in Fig. 10(a). When the driving pressure force dominates over the viscous forces, a higher momentum tip clearance flow is created, which is coherent with the appearance and intensification of the tip vortex at larger tip clearance size see in Fig. 8. Moreover, the presence of a tip vortex can be verified by considering the velocity profiles in the tip clearance as indicated in the Fig. 11.
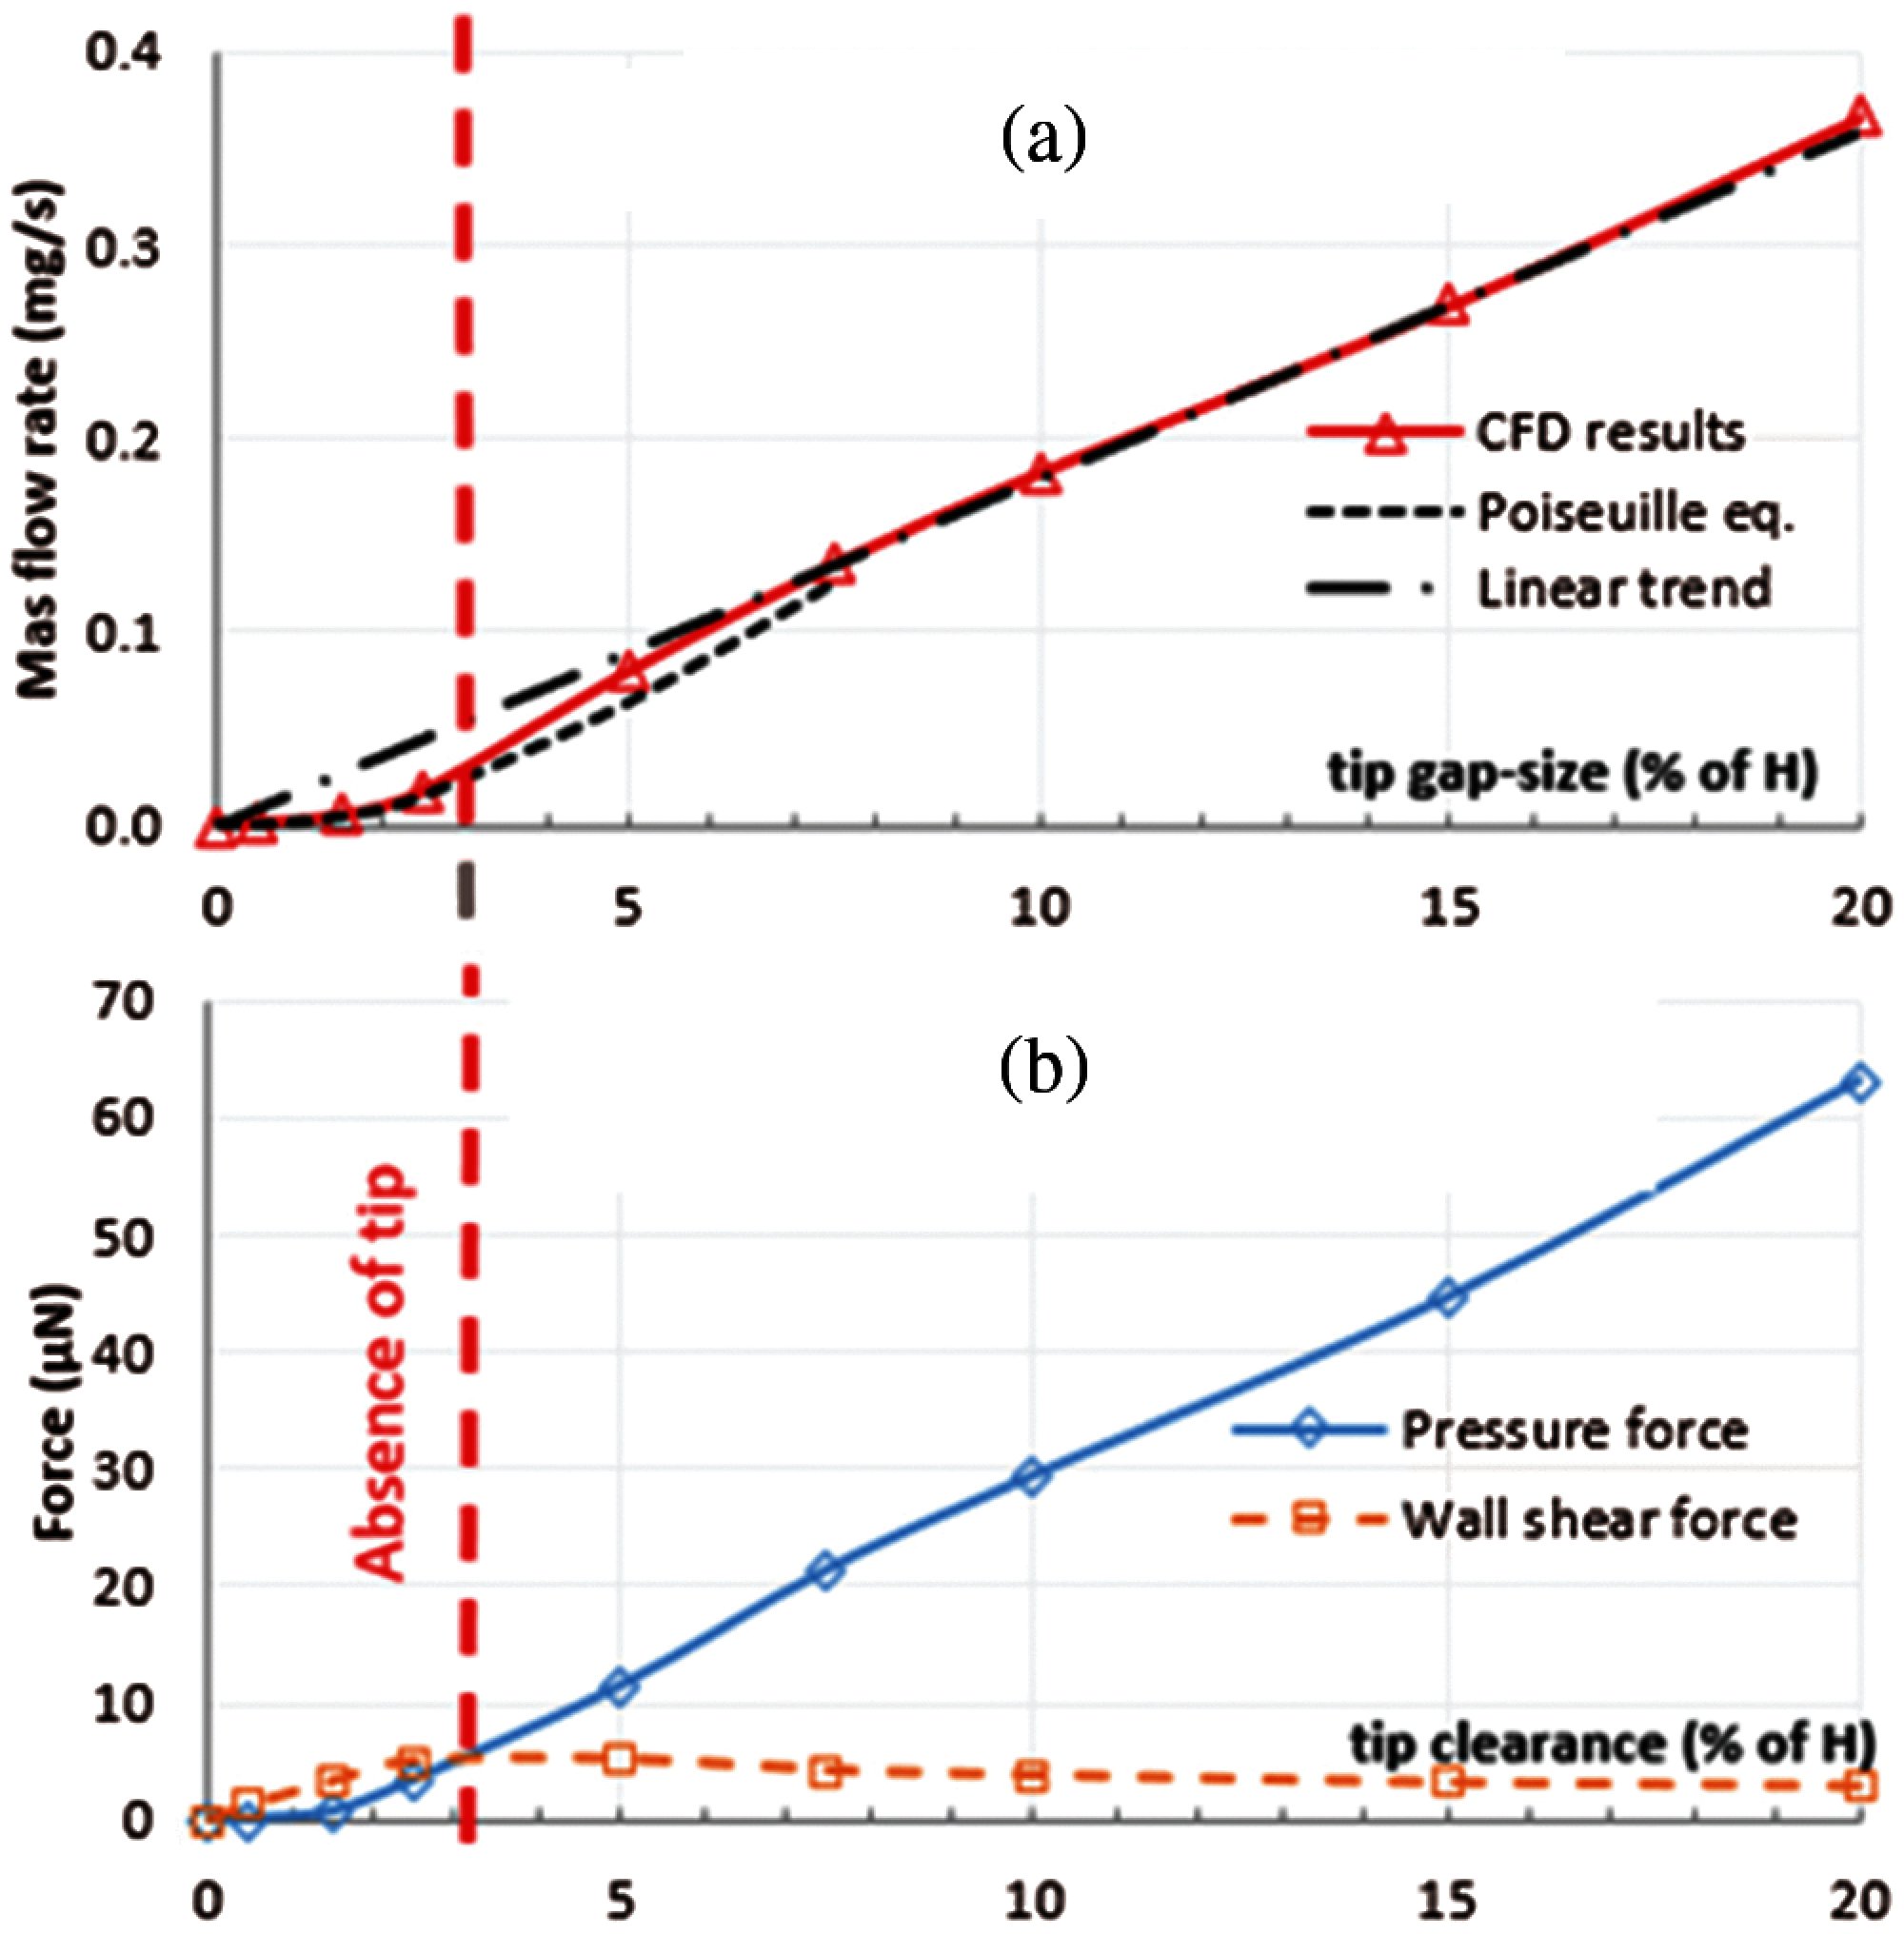
Figure 10: Leakage mass flow rate and force balance in the tip clearance, as a function of tip clearance size. (a) Mass flow rate in the tip clearance. (b) Pressure forces and Wall shear forces on the tip clearance volume
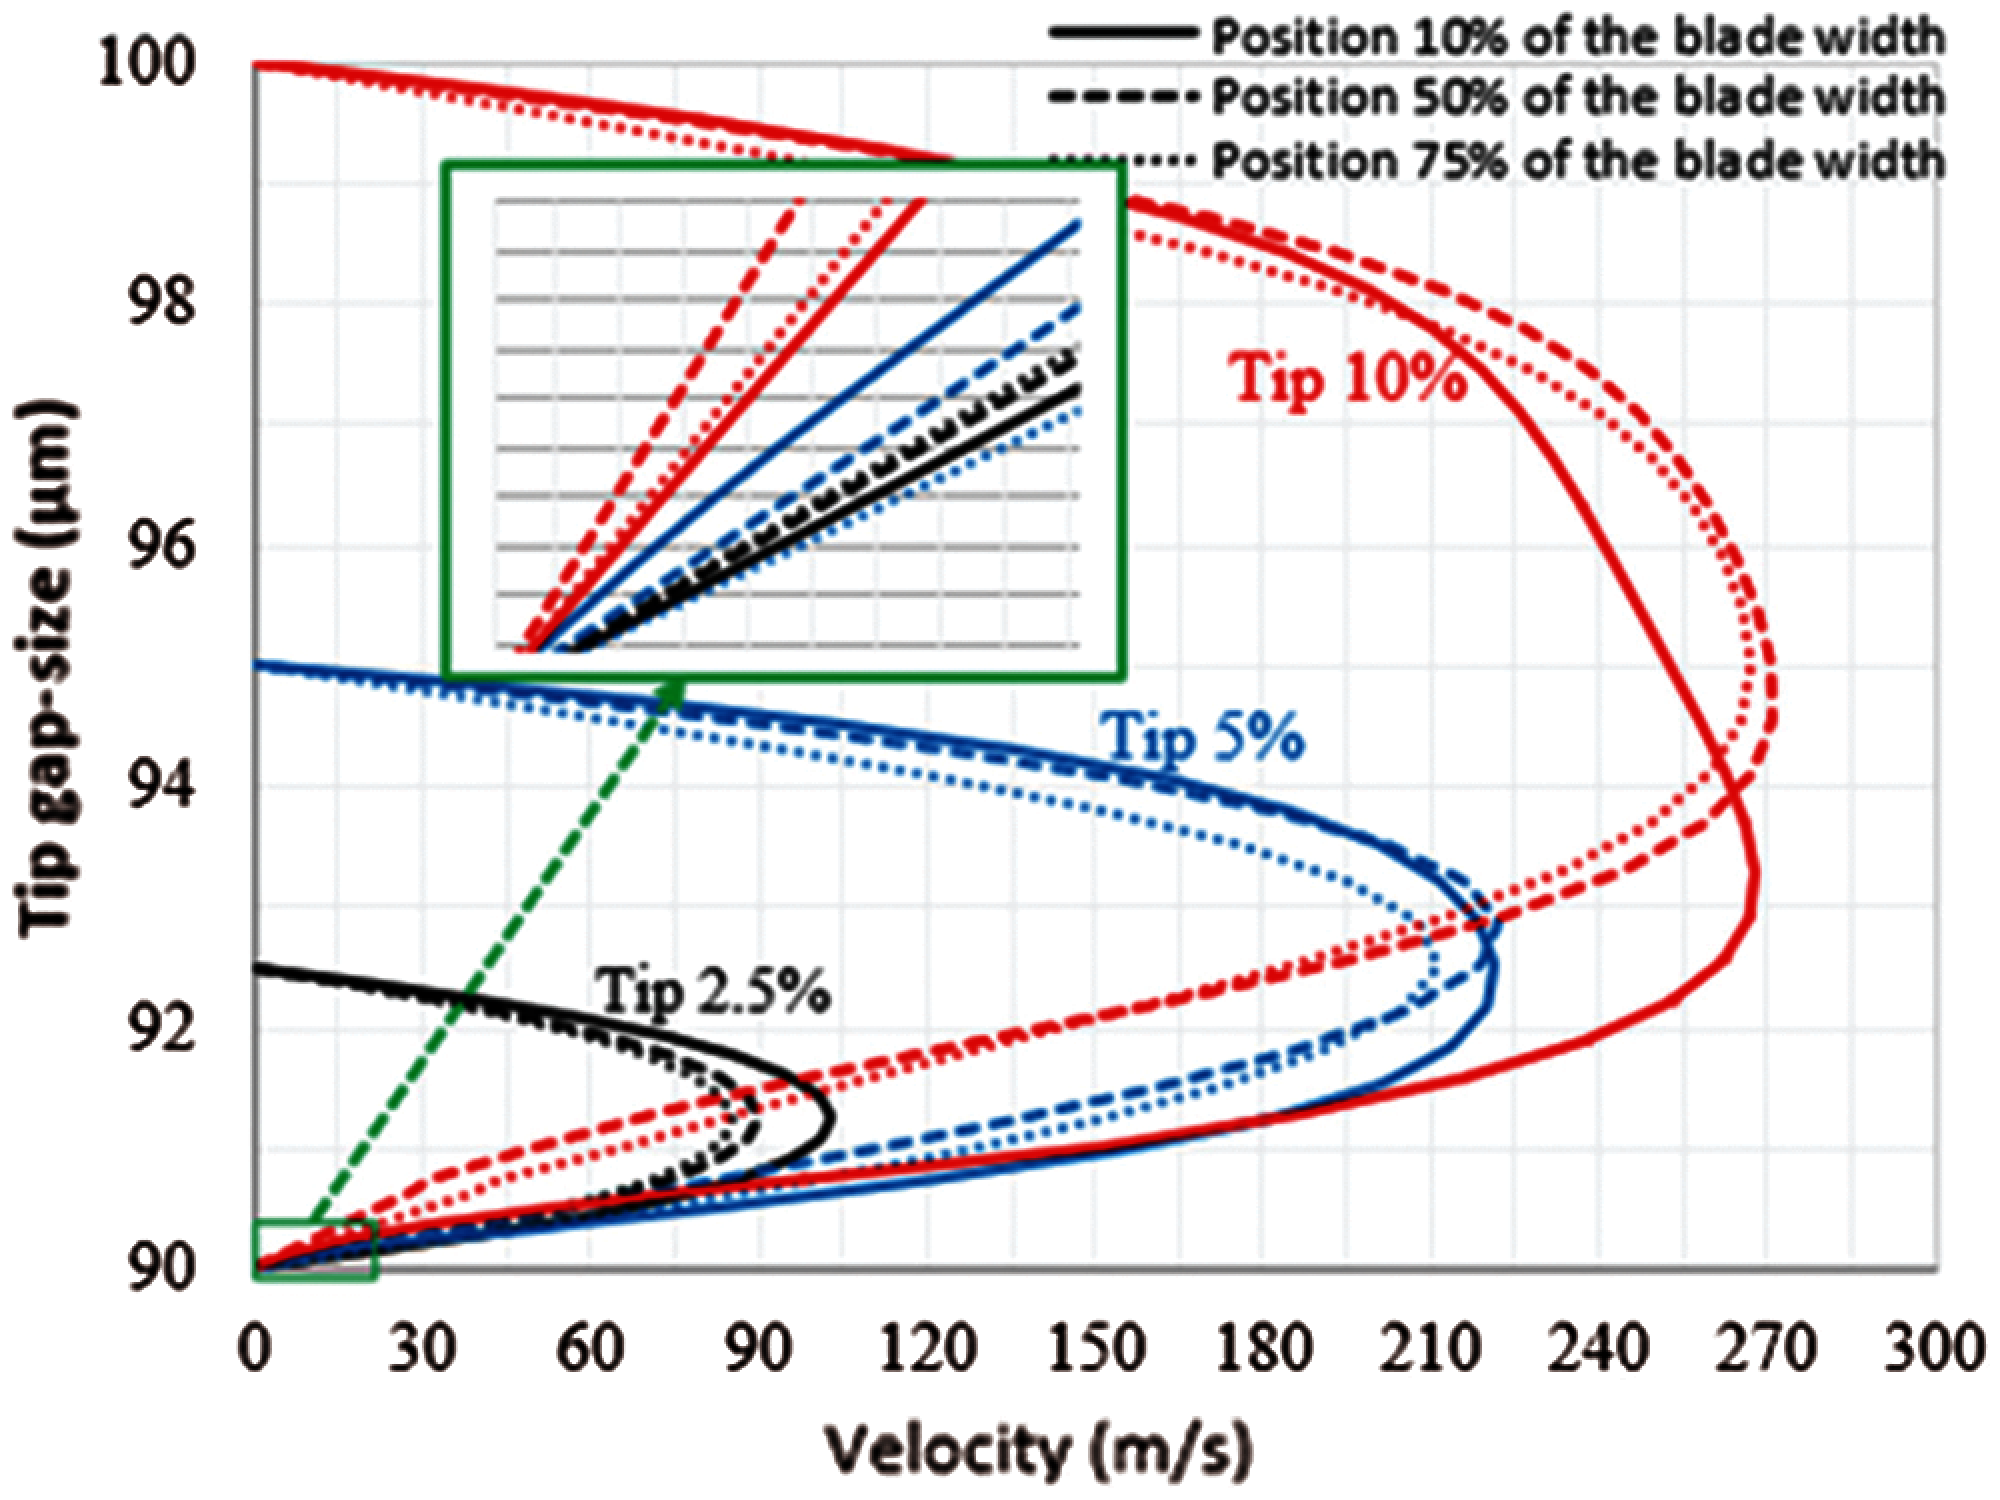
Figure 11: Velocity profile across the tip clearance, taken at mid-chord for three different tip gap sizes (2.5%, 5% and 10%) at three positions
When the tip vortex is absent (tip clearances <3%), the leakage flow velocities are lower and present a fully developed profile. For larger tip clearances (5% and 10%), when the tip vortex is present, the velocities increase, and we start to observe a core flow. The asymmetry of the velocity profile is due to the effect of flow entering the gap with a spanwise velocity component from the blade side.
4.3 Dominance of the Tip Vortex
The analogy with the classical turbomachinery is quite possible when the tip vortex is present and does not dominate the upper region. For larger tip clearances however (>10%), we are dealing with new flow conditions. In the design of microturbines, we should take this regime onto account since the microfabrication and bearing technologies do not allow fabrication of small gap-sizes that would be beneficial to minimize losses. The dominance of the tip vortex is a limit that should not be exceeded to obtain reasonable losses. This limit can be correlated with the averaged wall shear stress on the top blade, as plotted in Fig. 12, normalised by the average wall shear stress at the hub.
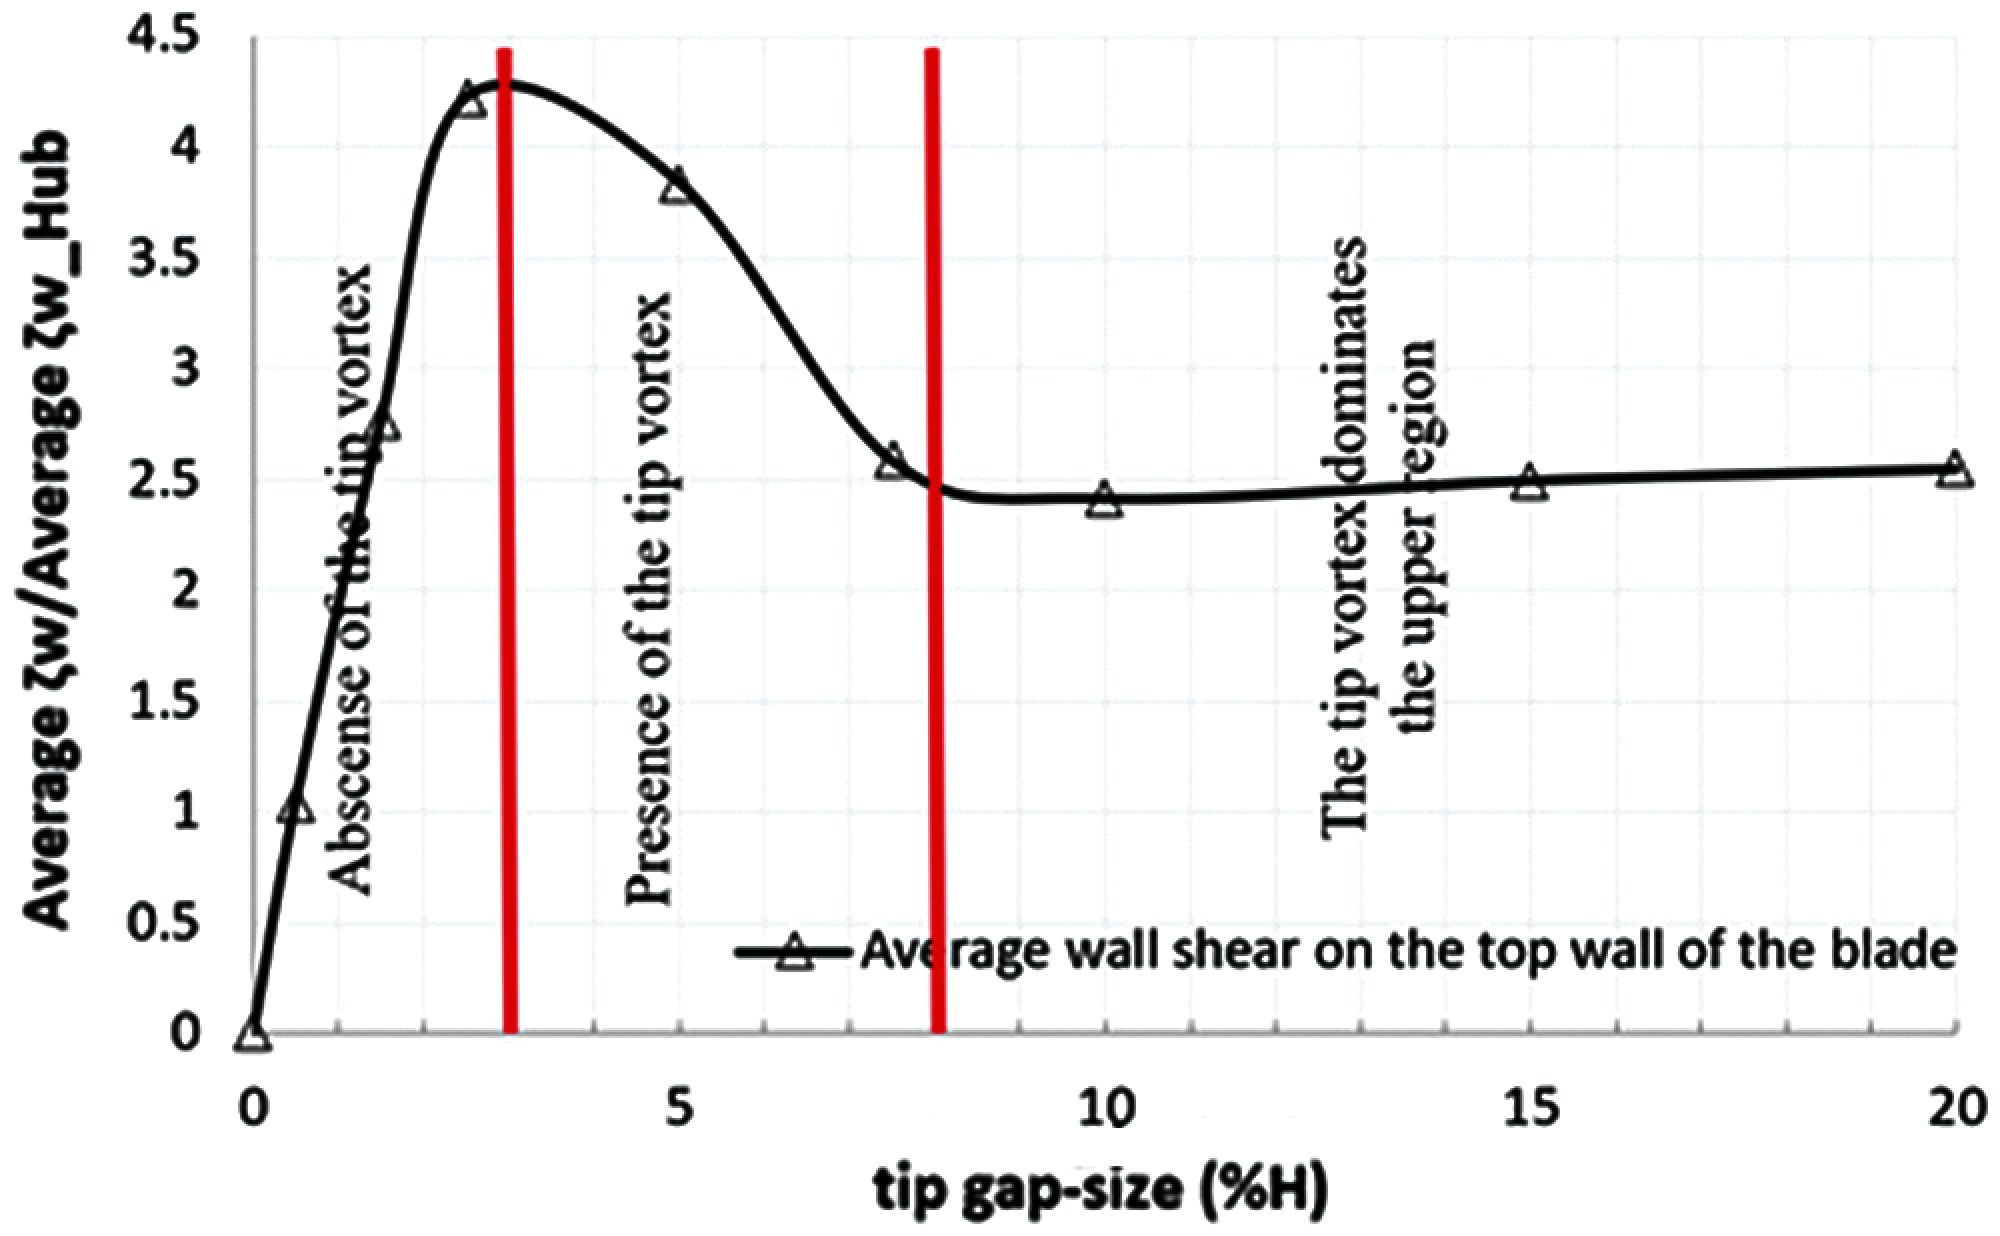
Figure 12: Average shear wall on the top wall of the blade (tip surface), coherent with the observed tip vortex regimes
The wall shear stress initially increases up to a gap size ~3%, then decreases until a gap size of approximately 8%, and then appears to remain constant: Thus the viscous resistance effect is present for this gap range [0%, 8%] but for beyond (>8%), the gap is large enough to consider that the casing doesn’t directly affect the top blade wall. This limit corresponds to a mass flow behaviour typically linear (Fig. 10(a)), since the pressure variation from the pressure side to the suction side is mainly constant. This is effectively the gap size limit that should be respected when designing micro-turbines to prevent excessive losses. It is consistent with Fig. 11 as the wall shear for the 2.5% tip clearance is greater than for the 5% tip clearance which in terms is larger than for the 10% tip gap.
Generally, in a conventional turbine, the vortex structures are localised near the hub and casing, and their traces on the blade surface are seen only on a small fraction of the total blade surface; this is not the case when considering micro-turbines. As indicated in Fig. 13, showing the contours of wall shear on the suction side (ss) for different tip clearance sizes, traces of the vortices occupy a significant part of the blade span. Wall shear from the vortices show the expected symmetry for 0% tip clearance, some asymmetry due to the presence of the small gap (2.5%), the presence of the small tip vortex at 5% gap that prevents the contact between the upper passage vortex and the suction side, and reappearance of shear near the tip, but due to the dominant tip vortex. For all these tip clearances, the lower part of the blade remains comparable.

Figure 13: Contours of wall shear on the blade sides (ss and ps) and wall shear stress at different positions of the suction side (equipositions from the leading edge to the trailing edge)
The same observations are quantified on the suction side by plotting the wall shear stress along the span at different vertical lines from the leading to the trailing edges as indicated in the Fig. 13. The lower region of the blade near the suction surface seems un-affected when changing the tip clearance; it indicates essentially that the lower passage vortex trace is comparable for all tip clearances (see the blue dotted line). The trajectory of the bottom passage vortex is mainly unchanged. This is not the case for top region where the presence of the tip vortex (tip 5%) pushes away the top passage vortex making its trace weak on the suction side. However, in the 10% tip clearance case, the top vortex trace is not due to the passage vortex but to the tip vortex.
Now if the pressure side (lower part of the Fig. 13) is considered, clearly the wall shear is more important in those surfaces; it is increasingly important from the leading edge to the trailing edge. These latest cases indicate two important points: 1) the zone where the wall shear is approximately zero indicate that from those regions detached the passage vortex, and 2) in the 5% and 10% cases, the horizontal layer near the tip with maximum shear is indicative of the presence of the tip vortex.
The static pressure distributions for two tip clearances (5% and 10%) at 25%, 50% and 75% of the blade height are given in Fig. 14 by the static pressure coefficients,
with Pin, ρin and Uin are respectively the static pressure, the density and the velocity at the cascade inlet. The position 50% of the blade height is supposed to be a reference since at mid-span the present vortices have little influence (see also Fig. 11). But on the suction side, we see a difference between the 5% and 10% tip clearances. Up to 30% of the chord (x/C = 0.3), the static pressure coefficient Cp is less in the case of 10% tip clearance, but after (x/C > 0.3) the trend is reversed. This is attributed to the dominant tip vortex (for 10% tip clearance) which results in more pressure on the suction side.

Figure 14: Static pressure distribution at 25% (dotted), 50% (line) and 75% (dashed) of the blade height for the tip gaps 5% (black) and 10% (red)
This paper presented a numerical analysis of subsonic laminar flow through a cascade for microturbomachinery applications operating at low Re. Numerical calculations were done with 3D static geometries associated to nine tip clearances (0%, 0.5%, 1.5%, 5%, 7.5%, 10%, 15% and 20%) at for 40 ≤ Re ≤ 2500 and four different incidences (0°, 5°, 10° and 15°). For all the considered geometrical and physical parameters, numerical calculations indicate that the flow is essentially 3D and the whole volume is occupied by vortices. Consequently, there is no core flow, and the classical 2D (meridional) design assumption would not be applicable.
The calculations indicate essentially three different flow configurations classified according to the tip gap size, small [0%–3%], medium [3%–8%] and more than 8% of blade height. The distinction between these different flow configurations was based on a detailed study of the leakage flow. Specifically, the mass flow through the tip clearance was characterized through a comparison between the pressure and shear forces in the tip gap volume and also the wall shear applied of the top wall blade.
At relatively small tip clearance, lower than 3%, the wall shear force in the tip clearance dominates, so the leakage flow is reduced and of Poiseuille type; this correlates with the absence of the tip vortex. Also within this tip clearance range, the mean wall shear stress on the blade top-wall increases. The calculations indicate the presence of two quasi-symmetrically positioned passage vortices at the hub and casing, near the suction side. The trajectory of these vortices depends on the Reynolds number and incidence. Two secondary corner vortices were identified on the suction side at the exit blade corners near the hub and the casing. Also, induced vortex appears resulting from the interaction between the dominant vortices and the core flow.
For a tip clearance within the range [3%–8%], the tip vortex appears in view, which is justified but the driving pressure force that dominates over the shear force in the tip clearance. Increasing the tip gap within this range leads to a decrease of the blade top-wall shear. The limit 8% was determined by a leakage mass flow rate that begins to follow a linear behavior and mean shear on the blade top-wall that tends towards a constant as tip clearance is increased. This case is more representative of the flow structure and losses in a microfabricated turbine. The tip vortex modifies the position and the direction of the upper passage vortex. This vortex carried away the top corner vortex and the upper induced vortex becomes smaller compared to the lower one.
For a tip clearance greater than 8%, the pressure difference across the tip clearance remains unchanged. Consequently, the pressure force increases by increasing the tip gap size and largely dominates the shear force (which remains constant). The leakage mass flow rate behaves linearly since it depends on the tip gap size. The tip clearance vortex dominates totally the upper region making the top passage vortex secondary and the upper induced vortex is not seen. This situation does not exist in traditional turbomachinery but is within the achievable range for microfabricated turbines. This tip clearance value should be considered as a limit to reduce losses when designing a microturbine.
For all the three configurations the lower region near the hub seems to be not affected by the tip gap variation and remains qualitatively unchanged i.e., a presence of a passage vortex, corner vortex and an induced vortex.
Acknowledgement: This project was funded by the National Plan for Science, Technology and Innovation (MAARIFAH)—King Abdulaziz City for Science and Technology—the Kingdom of Saudi Arabia—award number 14-ENE2142-03. The authors also, acknowledge with thanks Science and Technology Unit, King Abdulaziz University for technical support.
Funding Statement: This project was funded by the National Plan for Science, Technology and Innovation (MAARIFAH)—King Abdulaziz City for Science and Technology—the Kingdom of Saudi Arabia—award number 14-ENE2142-03.
Conflicts of Interest: The authors declare that they have no conflicts of interest to report regarding the present study.
1. A. H. Epstein and S. D. Senturia, “Macro power from micro machinery,” Science, vol. 276, no. 5316, pp. 1211, 1997. [Google Scholar]
2. L. G. Fréchette, C. S. Lee, S. Arslan and Y. C. Liu, “Design of a microfabricated rankine cycle steam turbine for power generation,” in Proc. ASME IMECE 2003-42082, Washington, DC, USA, pp. 335–344, 2003. [Google Scholar]
3. L. G. Fréchette, S. A. Jacobson, K. S. Breuer, F. F. Ehrich, R. Ghodssi et al., “High-speed microfabricated silicon turbomachinery and fluid film bearings,” Journal of Microelectromechanical Systems, vol. 14, no. 1, pp. 141–152, 2005. [Google Scholar]
4. J. H. Horlock and J. D. Denton, “A review of some early design practice using computational fluid dynamics and a current perspective,” Journal of Turbomachinery, vol. 127, no. 1, pp. 5–13, 2005. [Google Scholar]
5. R. E. Peacock, “A review of turbomachinery tip gap effects: Part 1: Cascades,” International Journal of Heat and Fluid Flow, vol. 3, no. 4, pp. 185–193, 1982. [Google Scholar]
6. C. Lee, “Development of a microfabricated turbopump for a Rankine vapor power cycle,” Ph.D. dissertation. Columbia University, New York, NY, USA, 2006. [Google Scholar]
7. D. Borello, K. Hanjalic and F. Rispoli, “Computation of tip-leakage flow in a linear compressor cascade with a second-moment turbulence closure,” International Journal of Heat and Fluid Flow, vol. 28, no. 4, pp. 587–601, 2007. [Google Scholar]
8. M. Omri and L. G. Fréchette, “Computational investigation of the three-dimensional flow structure and losses in a low Reynolds number microturbine,” in Proc. ASME IGTI 2011, Vancouver, British Columbia, Canada, pp. 2179–2187, 2011. [Google Scholar]
9. A. Mehra, “Computational investigation and design of low Reynolds number micro-turbomachinery,” M.S. dissertation. Massachusetts Institute of Technology, Cambridge, MA, USA, 1997. [Google Scholar]
10. Y. Gong, B. T. Sirakov, A. H. Epstein and C. S. Tan, “Aerothermodynamics of micro-turbomachinery,” in Proc. ASME IGTI Turbo Expo, Vienna, Austria, pp. 95–102, 2004. [Google Scholar]
11. S. Kang, “Investigation on the three-dimensional flow within a compressor cascade with and without tip clearance,” Ph.D. dissertation. Department of Fluid Mechanics, Vrije Universiteit Brussels, Belgium, 1993. [Google Scholar]
12. J. Peirs, D. Reynaerts and F. Verplaetsen, “A micro turbine for electric power generation,” Sensors and Actuators A: Physical, vol. 113, no. 1, pp. 86–93, 2004. [Google Scholar]
13. L. Qi, Z. Zou, P. Wang, T. Cao and H. Liu, “Control of secondary flow loss in turbine cascade by streamwise vortex,” Computers & Fluids, vol. 54, pp. 45–55, 2012. [Google Scholar]
14. C. H. Sieverding and D. B. Van, “The use of colored smoke to visualize secondary flows in turbine-blade cascade,” Journal of Fluid Mechanics, vol. 134, pp. 85–89, 1983. [Google Scholar]
15. C. H. Sieverding, “Recent progress in the understanding of basic aspects of secondary flows in turbine blade passages,” Journal of Engineering for Gas Turbines and Power, vol. 107, no. 2, pp. 248–257, 1985. [Google Scholar]
16. O. P. Sharma and T. L. Butler, “Predictions of endwall losses and secondary flows in axial flow turbine cascades,” Journal of Turbomachinery, vol. 109, no. 2, pp. 229–236, 1987. [Google Scholar]
17. R. L. Simpson, “Junction flows,” Annual Review of Fluid Mechanics, vol. 33, no. 1, pp. 415–443, 2001. [Google Scholar]
18. M. I. Yaras and S. A. Sjolander, “Effects of simulated rotation on tip leakage in a planar cascade of turbine blades: Part I—Tip gap flow,” Journal of Turbomachinery, vol. 114, no. 3, pp. 652–659, 1992. [Google Scholar]
19. B. Lakshminarayana and J. H. Horlock, “Review—Secondary flows and losses in cascades and axial-flow turbomachines,” International Journal of Mechanical Sciences, vol. 5, no. 3, pp. 287–307, 1963. [Google Scholar]
20. L. G. Fréchette, C. Lee and S. Arslan, “Development of a MEMS-based Rankine cycle steam turbine for power generation: Project status,” in Proc. PowerMEMS’04, Kyoto, Japan, pp. 92–95, 2004. [Google Scholar]
21. A. H. Epstein, S. D. Senturia, O. Al-Midani, G. Anathasuresh, A. Ayon et al., “Micro-heat engines, gas turbines, and rocket engines—the MIT microengine project,” in Proc. 28th AIAA Fluid Dynamics Conf., Snowmass Village, CO, USA, pp. 1773, 1997. [Google Scholar]
22. E. M. Greitzer, C. S. Tan and M. B. Graf, Internal flow: Concepts and applications.Cambridge, UK: University Press, 2007. [Online]. Available: https://www.book2look.com/vbook.aspx?id=9780521036726. [Google Scholar]
23. Moon Y. J. and Koh S-R., “Counter-rotating streamwise vortex formation in the turbine cascade with end fence,” Journal of Computers & Fluids, vol. 30, no. 4, pp. 473–490, 2001. [Google Scholar]
24. M. Omri and L. G. Fréchette, “CFD analysis of three-dimensional flows in a low Reynolds number microturbine,” in Proc. PowerMEMS 2010, Leuven, Belgium, pp. 1–4, 2010. [Google Scholar]
25. C. Lee, S. Arslan and L. G. Fréchette, “Design principles and measured performance of multistage radial flow microturbomachinery at low re numbers,” Journal of Fluids Engineering, vol. 130, no. 11, pp. 111–103, 2008. [Google Scholar]
26. P. B. Martel and L. G. Frechette, “Numerical analysis of sub-millimeter-scale microturbomachinery aerothermodynamics,” in Proc. ASME IMECE 2008-68190, Boston, MA, USA, pp. 87–96, 2008. [Google Scholar]
27. L. S. Langston, “Secondary flows in axial turbines—A review,” Heat and Mass Transfer in Gas Turbine Systems, vol. 943, no. 1, pp. 11–26, 2001. [Google Scholar]
28. M. Omri and N. Galanis, “Numerical analysis of turbulent buoyant flows in enclosures: Influence of grid and boundary conditions,” International Journal of Thermal Sciences, vol. 46, no. 8, pp. 727–738, 2007. [Google Scholar]
29. G. Haller, “An objective definition of a vortex,” Journal of Fluid Mechanics, vol. 525, pp. 1–26, 2005. [Google Scholar]
30. H. P. Wang, S. J. Olson, R. J. Goldstein and E. R. G. Eckert, “Flow visualization in a linear turbine cascade of high-performance turbine blades,” Journal of Turbomachinery, vol. 119, no. 1, pp. 1–8, 1997. [Google Scholar]
31. S. Wilson, “The development of Poiseuille flow,” Journal of Fluid Mechanics, vol. 38, no. 4, pp. 793–806, 1969. [Google Scholar]
 | This work is licensed under a Creative Commons Attribution 4.0 International License, which permits unrestricted use, distribution, and reproduction in any medium, provided the original work is properly cited. |