DOI:10.32604/cmc.2022.021199
| Computers, Materials & Continua DOI:10.32604/cmc.2022.021199 | |
| Article |
Optimized Stacked Autoencoder for IoT Enabled Financial Crisis Prediction Model
1Department of Natural and Applied Sciences, College of Community-Aflaj, Prince Sattam bin Abdulaziz University, Saudi Arabia
2Department of Information Systems, College of Computer and Information Sciences, Princess Nourah bint Abdulrahman University, Saudi Arabia
3Department of Computer Science, King Khalid University, Muhayel Aseer, Saudi Arabia
4Faculty of Computer and IT, Sana’a University, Sana’a, Yemen
5Department of Computer and Self Development, Preparatory Year Deanship, Prince Sattam bin Abdulaziz University, AlKharj, Saudi Arabia
*Corresponding Author: Manar Ahmed Hamza. Email: ma.hamza@psau.edu.sa
Received: 26 June 2021; Accepted: 30 July 2021
Recently, Financial Technology (FinTech) has received more attention among financial sectors and researchers to derive effective solutions for any financial institution or firm. Financial crisis prediction (FCP) is an essential topic in business sector that finds it useful to identify the financial condition of a financial institution. At the same time, the development of the internet of things (IoT) has altered the mode of human interaction with the physical world. The IoT can be combined with the FCP model to examine the financial data from the users and perform decision making process. This paper presents a novel multi-objective squirrel search optimization algorithm with stacked autoencoder (MOSSA-SAE) model for FCP in IoT environment. The MOSSA-SAE model encompasses different subprocesses namely pre-processing, class imbalance handling, parameter tuning, and classification. Primarily, the MOSSA-SAE model allows the IoT devices such as smartphones, laptops, etc., to collect the financial details of the users which are then transmitted to the cloud for further analysis. In addition, SMOTE technique is employed to handle class imbalance problems. The goal of MOSSA in SMOTE is to determine the oversampling rate and area of nearest neighbors of SMOTE. Besides, SAE model is utilized as a classification technique to determine the class label of the financial data. At the same time, the MOSSA is applied to appropriately select the ‘weights’ and ‘bias’ values of the SAE. An extensive experimental validation process is performed on the benchmark financial dataset and the results are examined under distinct aspects. The experimental values ensured the superior performance of the MOSSA-SAE model on the applied dataset.
Keywords: Financial data; financial crisis prediction; class imbalance problem; internet of things; stacked autoencoder
Financial crisis over the globe has highlighted the responsibility of financial connectedness as a probable resource of systematic risks and macro-economic instabilities. The crisis has showcased the requirement of clearly understanding whether a rise in connectedness resulted in a maximum possibility of a financial crisis. Forbes et al. [1] defined that contagion as a noteworthy rise in market relations next to a considerable shock to all economic channels. Particularly, the contagion defines the status where the dispersion of financial disturbance can be observed among countries or from a particular economic channel to other. Besides, when two indices demonstrate a maximum level of co-movement at the time of tranquil period, and they endure to be extremely correlated next to a shock in the market, it does not comprise a financial contagion. Several other studies defined that contagion as an extreme rise in the relationship between the countries triggering the crisis and all other countries.
In previous years, the increase in the financial crisis of the companies takes place over the globe, where the companies have started to concentrate on the concept of financial crisis prediction (FCP) [2]. The process of FCP is highly needed for modelling a trustworthy, accurate, and early predictive technique for forecasting the significant risks of the company’s economic status earlier. The FCP is generally considered as the binary classification process that can be resolved in rational ways. The results of the classifier technique undergo categorization into two kinds namely, the one indicating the failing condition of an organization and the second one representing the non-failing condition of the same organization. The input to the classifier technique is generally the statistical ratio attained from the financial statement of the original organization. Presently, several classifier techniques have been presented by the use of different domain knowledge for FCP.
Statistics-based and machine learning (ML) techniques are commonly utilized to find out the important factors of the FCP. On the domain of FCP, the ML models are applied in several manners [3]. It is used for the modal construction process for validating the techniques for the identification of financial crisis. The major assumption is that the financial parameters extracted from the open-access financial stamen like financial ratio comprises large amount of data relating the financial details of the company and is helpful for the FCP process [4]. The FCP is a tedious procedure to utilize the interconnected economic details and other information about the company’s strategic affordability to active data for the construction of a novel technique. Along with the AI and database concepts, data mining techniques are widely used in several domains. In FCP, data mining approaches are commonly available in two manners namely early warning and decision-making models. It will be helpful for taking necessary action to eliminate the financial failure of the organization. Followed by, the FCP techniques help the decision-making experts of the company to evaluate and select the firm to collaborate or invest. In order to deeply understand a large amount of data, it is needed to afford high computation time and processing. At the same time, class imbalance problem poses a major issue in FCP which greatly affects the predictive outcome.
This paper presents a novel multi-objective squirrel search optimization algorithm with stacked autoencoder (MOSSA-SAE) model for FCP in internet of things (IoT) environment. The MOSSA-SAE model encompasses diverse subprocesses namely pre-processing, class imbalance handling, parameter tuning, and classification. In addition, SMOTE technique is employed to handle class imbalance problems. The goal of MOSSA in SMOTE is to compute the oversampling rate and area of nearest neighbors of SMOTE. Also, SAE model is exploited as a classification technique to determine the class label of the financial data. Simultaneously, the MOSSA is utilized for the appropriate election of the ‘weights’ and ‘bias’ values of the SAE. A comprehensive experimental analysis is carried out on the benchmark financial dataset and the results are inspected under different aspects.
Several researchers have developed a large number of FCP models by the exploitation of the details of the financial company. Presently, ML based artificial neural network (ANN) model is employed as a popular method for the prediction procedure. A new support vector machine (SVM) based ensemble model is developed for FCP, which is mainly dependent on the particular SVM classifier technique [5]. The resultant outcome demonstrated that the SVM based ensemble model offers the particular SVM classifier. Another SVM technique designed in [6] with classical model revealed that the raking method varies with respect to accuracy and precision of Taiwan stock exchange. In Geng et al. [7], a new FCP model is solely developed for Chinese corporations. The experimental outcome denoted that the neural network (NN) is considered to be an effective model compared to traditional ML models like decision tree (DT) and SVM. On the other hand, metaheuristic algorithms are also started to be employed for resolving the binary classification problem.
A GA based feature selection (FS) with FCP technique has been developed in [8] to achieve minimal cost with higher accurateness. At the same time, a new fruitfly optimization based FCP model has been presented in [9] by the integration of general regression NN [10]. The resultant values are interconnected to general and multiple regression NN. The presented methodology is explored to be the effective method with respect to the convergence rate and the ability of the classification model. An enhanced boosting model terms as FS-Boosting is devised as feature selection (FS)-Boosting [11] model. By the application of FS in the boosting process, the presented technique is found to be effective and results in higher accurateness. Another type of FS technique is developed in Lin et al. [12], which integrates the popularity level of the experts and wrapper based FS model. Primarily, the financial standards are partitioned into a total of seven parts and afterward the wrapper model is applied for choosing the feature subsets. The experimental values demonstrated that the presented model outperforms the other FS algorithms to increase the classification performance.
An efficient Ant Colony Optimization (ACO) algorithm for the design of FCP model is developed in [13] and the effectiveness has been analyzed on qualitative as well as quantitative datasets. In Metawa et al. [14], other FCP technique is developed by the use of ACO algorithm, which makes use of ACO for FS and classification process. Another FCP model on the basis of clustering with classification model is developed in Uthayakumar et al. [15] by the use of improved K-means based clustering and a fitness scaling chaotic genetic ant colony algorithm (FSCGACA) classification technique. Firstly, the introduced clustering principle groups the data and removes the misclustered data instances. Subsequently, a ruling technique is elected to make it appropriate for the intended dataset. At last, the FSCGACA is utilized for the election of optimum values of the ruling technique. Sankhwar et al. [16] designed a novel FCP technique utilizing improved grey wolf optimization (IGWO) and fuzzy neural classifier (FNC) models. The IGWO technique solely depends upon the amalgamation of the GWO technique and tumbling effect. Although several FCP methodologies have existed in the previous works, it is still needed to concentrate on the development of FCP for advanced prediction outcomes.
3 The Proposed MOSSA-SAE Based Predictive Model
The working principle of the MOSSA-SAE model is demonstrated in Fig. 1. Mainly, the MOSSA-SAE model allows the IoT devices such as smartphones, laptops, etc to collect the financial details of the users which are then transmitted to the cloud for further analysis. At the cloud server, data pre-processing is initially performed to remove the unwanted data and improve the compatibility of the data for the subsequent processes. Followed by, the SMOTE with SSA is applied for handling the class imbalance problem. Finally, the SAE with SSA model is applied to carry out the classification process and determine the appropriate class label of the financial data. The detailed working of the processes is discussed in the subsequent sections.
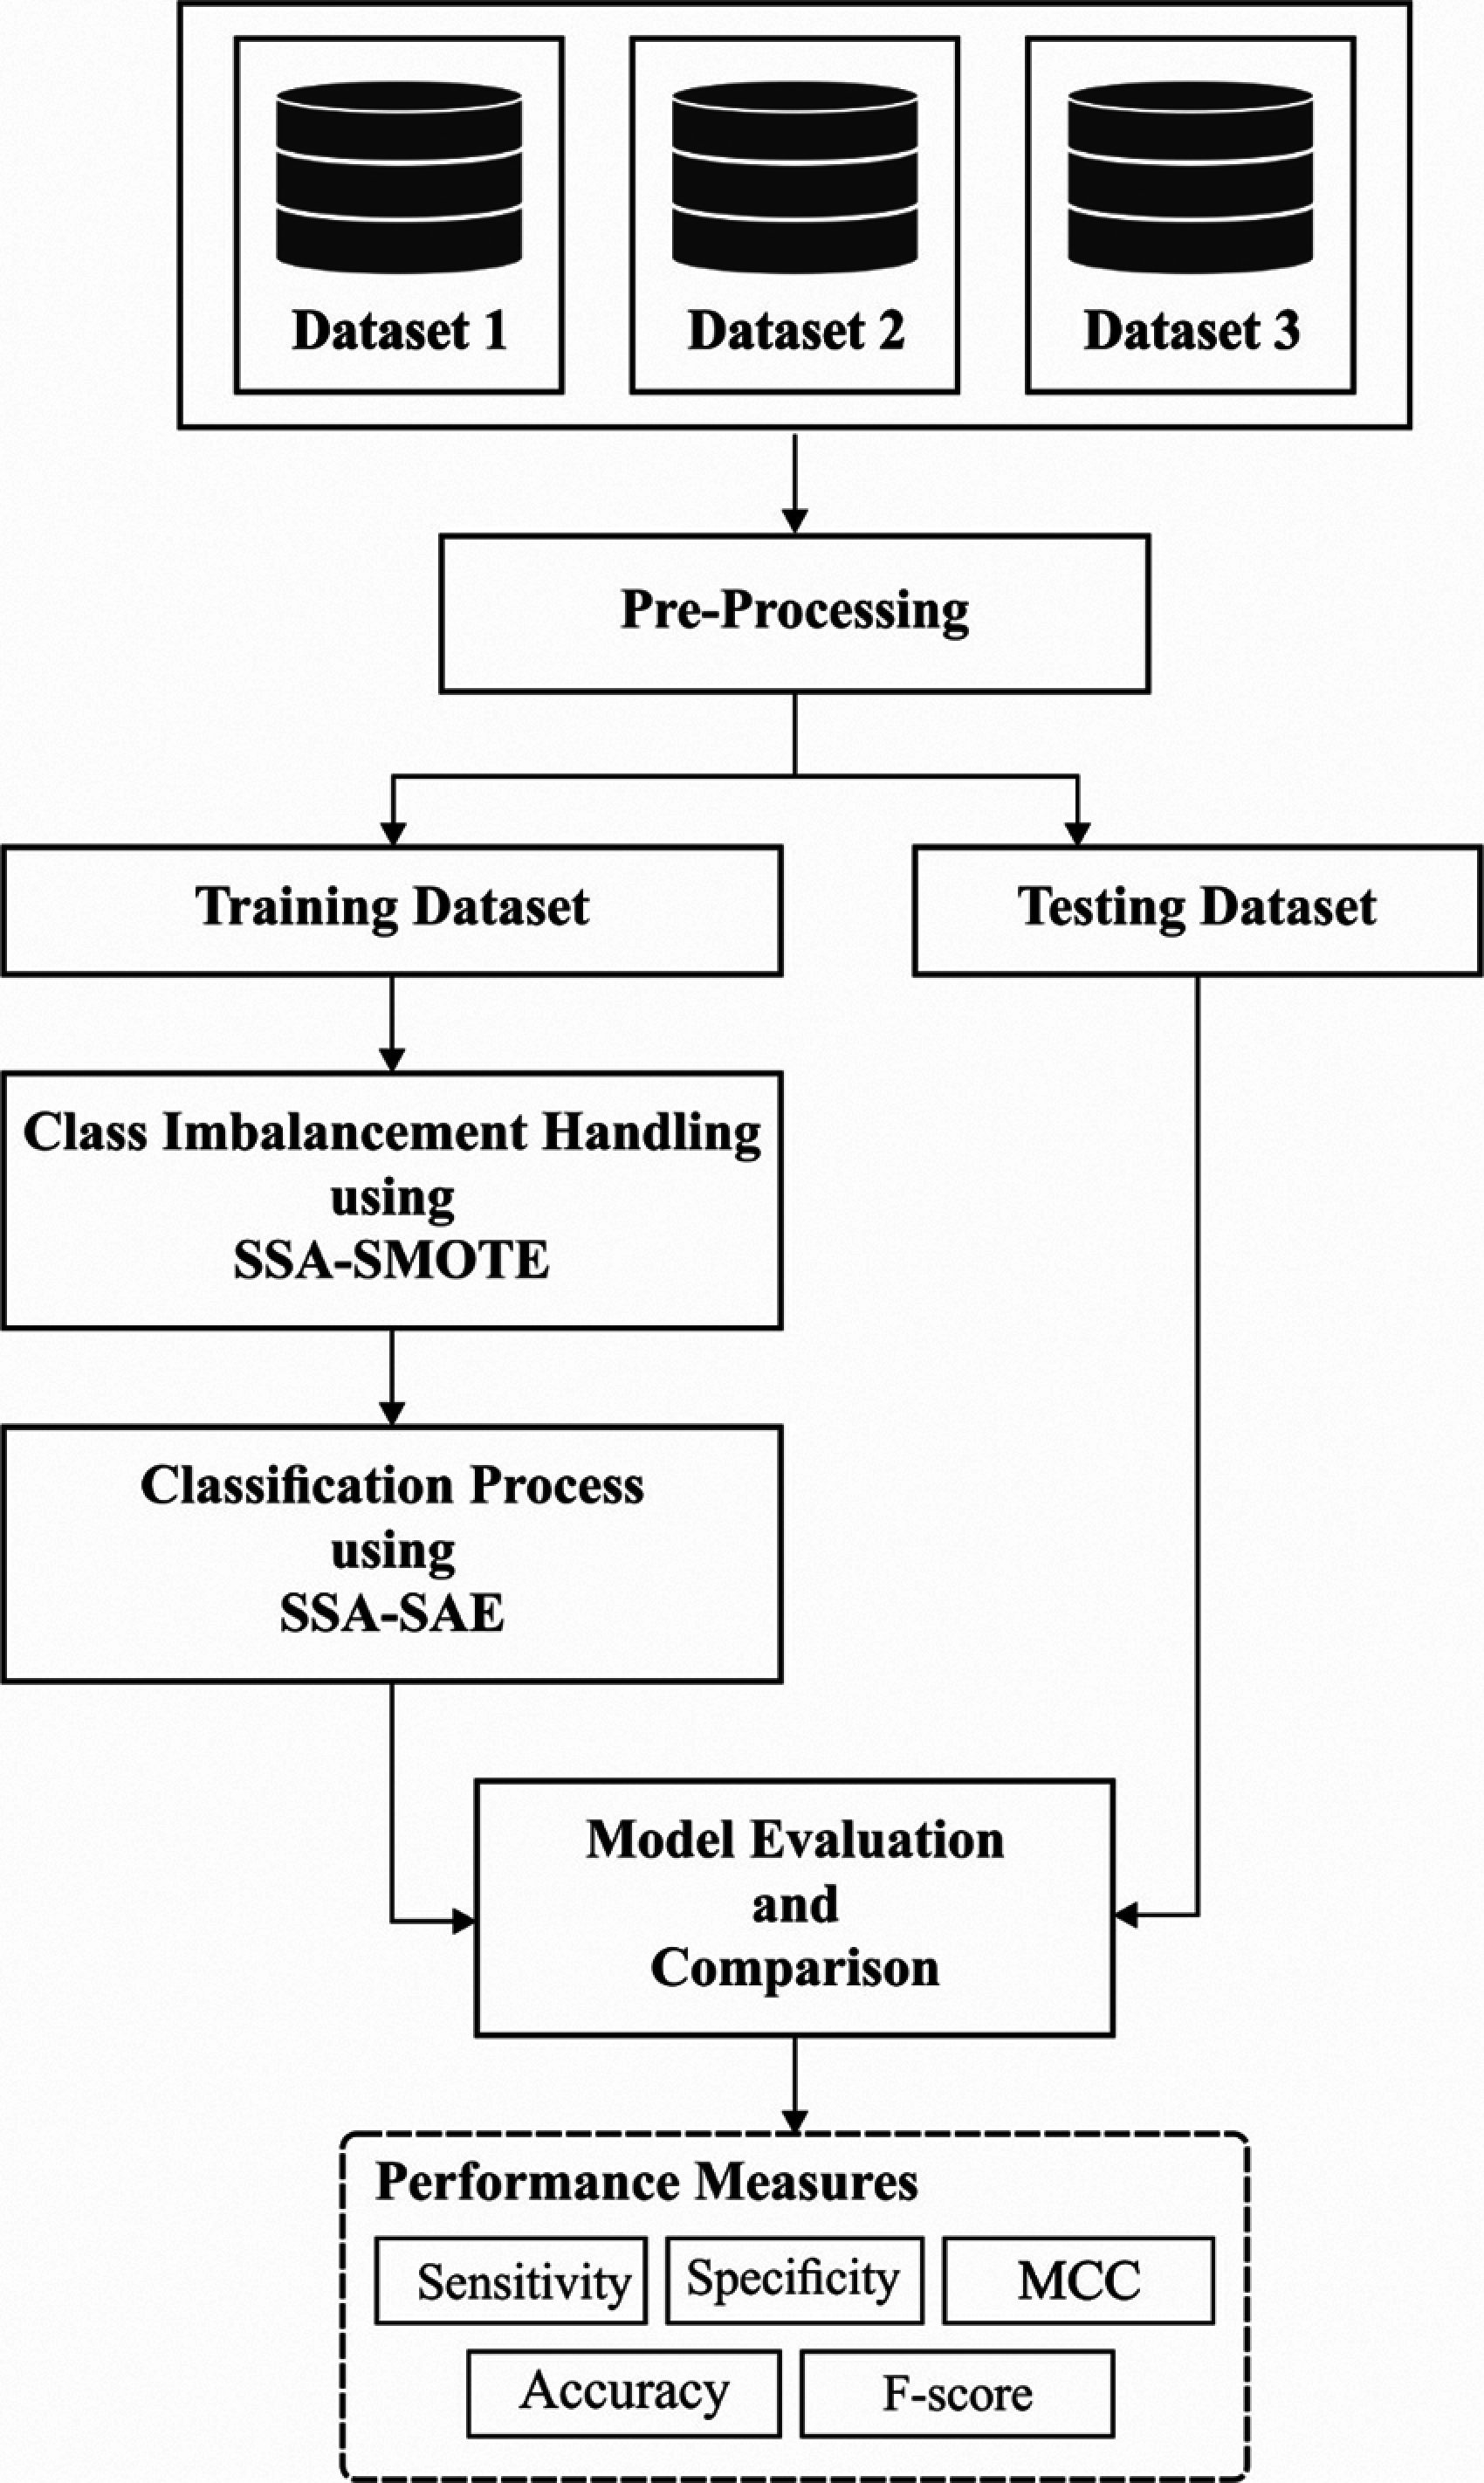
Figure 1: The working process of MOSSA-SAE model
The SSA model is based on the adaptive foraging characteristics of the southern flying squirrels by gliding, an efficiency model employed by the small mammals to pass over long distances. During summer, the squirrels frequently adapt the location to glide between trees and determine the source of food. At the same time, it has the ability to determine the acorn nuts for daily food. Besides, the hickory nuts are discovered and stored for winter season. During winter, they are not active and sustain with the energy that comes from the stored hickory nuts. When the season is altered, they are again come back into active model [17,18]. Based on the foraging nature of flying squirrels, optimization of SSA is derived as given below.
3.1.1 Initiate the Algorithm Parameters
Major parameters of SSA are maximal count of iterations
3.1.2 Initialize Flying Squirrels ‘Locations and Sorting’
A location of squirrels is fixed arbitrarily in a search apace as given below:
where rand
The fitness measure
Followed by, the supremacy of food sources is described by the fitness value of flying squirrels’ position is arranged in increasing order:
Once the food sources of flying squirrel’s position are organized, 3 classes of trees are classified namely, Hickory tree, Oak tree (acorn nuts food source), and Normal tree. A position of supreme food source (low fitness value) is considered to be the hickory nut tree
3.1.3 Produce New Locations by Gliding
Tree scenarios might be displayed after dynamic gliding procedure of squirrels.
Condition 1. The flying squirrels residing on Oak tree intends to travel to the hickory nut tree. Hence, novel position is generated in the following:
where
Condition 2. A few squirrels placed on normal trees travel to the Oak tree and meet the regular energy demands. Hence, new position is generated by:
where
Condition 3. A few squirrels living in normal trees go to hickory nut trees when the energy requirements are satisfied previously. Here, new position of squirrels is produced as shown in the following:
where
From the above conditions, gliding distance
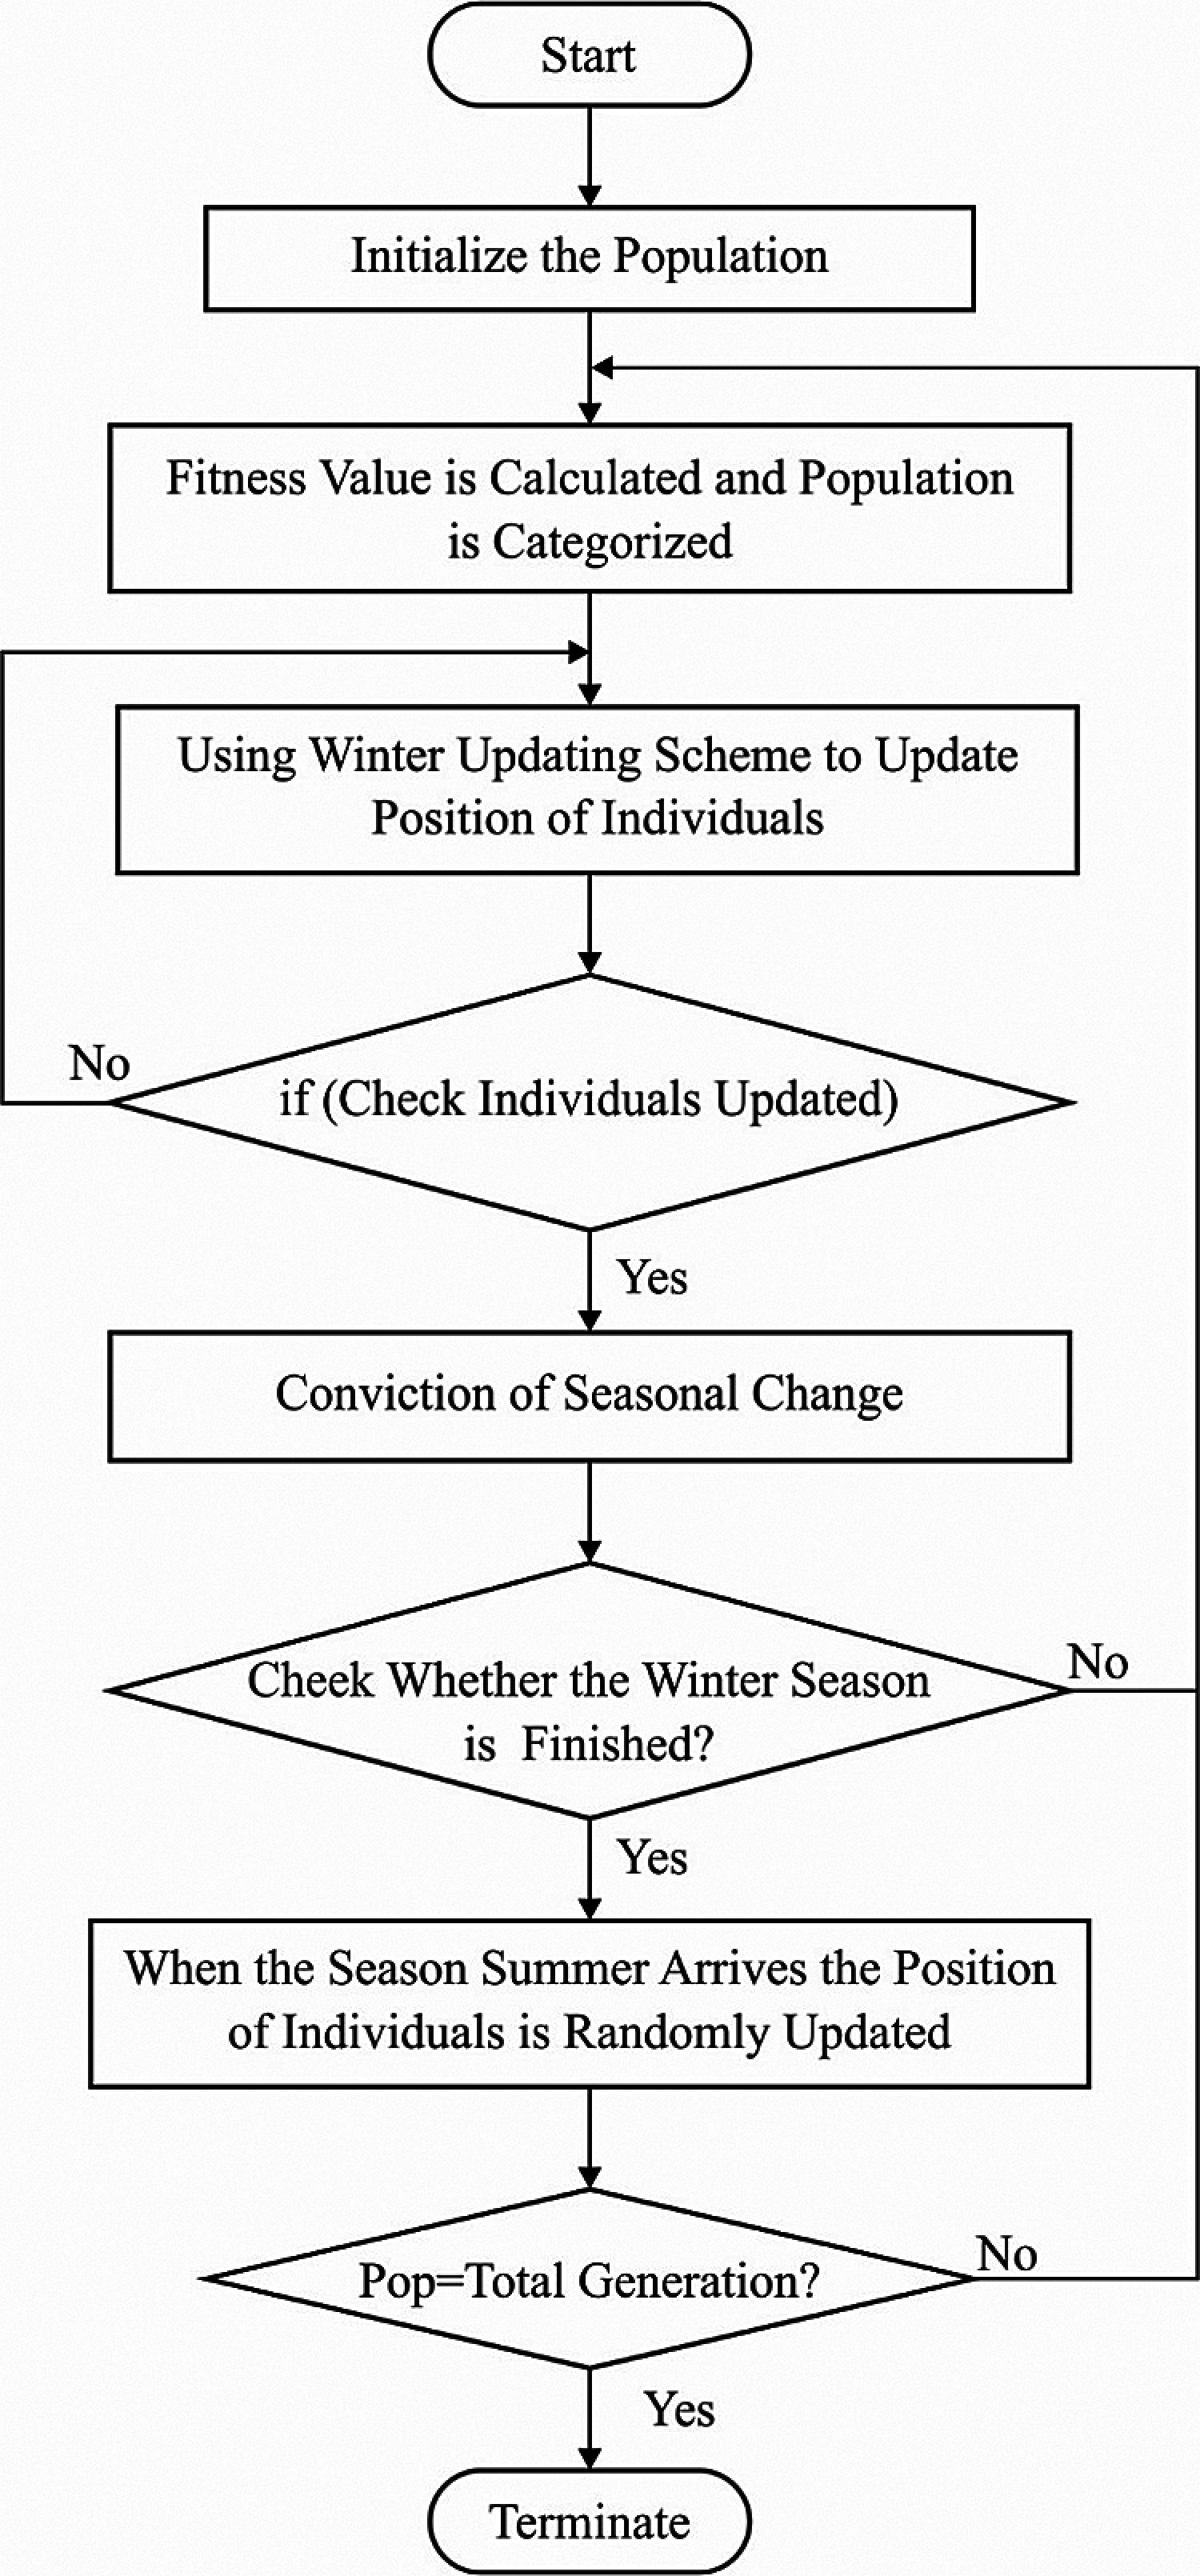
Figure 2: Flowchart of SSA
3.1.4 Check Seasonal Monitoring Condition
In foraging nature of flying squirrels are influenced by season modifications. Hence, seasonal monitoring is deployed to eliminate the trapping condition of local optimal results. Also, seasonal constant
Followed by, seasonal monitoring mechanism is validated. By considering
where Levy distribution defines a powerful mathematical device for enhancing the global exploration ability of optimization frameworks:
where
where
The processes get terminated when maximal count of iterations is reached. Else, the nature of producing novel position and validating seasonal monitoring condition is followed repeatedly.
3.2 Class Imbalance Data Handling Process Using SSA-SMOTE
For improving the importance of the smaller and particular regions belong to the positive class in the decision region, the SMOTE is employed for the generation of synthetic instances for the positive class for balancing the training dataset. In general, SMOTE is defined as an over-sampling mechanism presented by [19] and performs in feature space and not in data space. Under the application of this model, count of samples for minority class in actual data set has been maximized by developing novel synthetic samples and results in better decision making process for the minority class whereas naive over-sampling along with replacement results in the decision region of minority class which has to be specific. Here, novel synthetic instances are developed by special kind of parameters namely, over-sampling rate (%) as well as count of nearest neighbors (
Step 1: Measure the distance from feature vector in minority class as well as the
Step 2: Combine the distance attained in Step 1 by using random values from
Step 3: Sum the value gained from Step 2 for the feature value of actual feature vector. Hence, a fresh feature vector has been developed by
where
Step 1: Gain the majority vote from the features by considering the kNN for nominal feature score. At this point, selected in random fashion.
Step 2: Allocate the given value for new synthetic minority sample.
For instance, it is applied with collective features from a sample as
3.3 SSA‐SAE Based Predictive Model for FCP
Once the IoT devices transmitted the data, the classification process takes place using SAE. Generally, SAE is a type of unsupervised DL method, which has been stacked by using various AE. The AE is comprised of 2 portions namely, encoder and decoder. Initially, encoder layer has been employed for converting the input
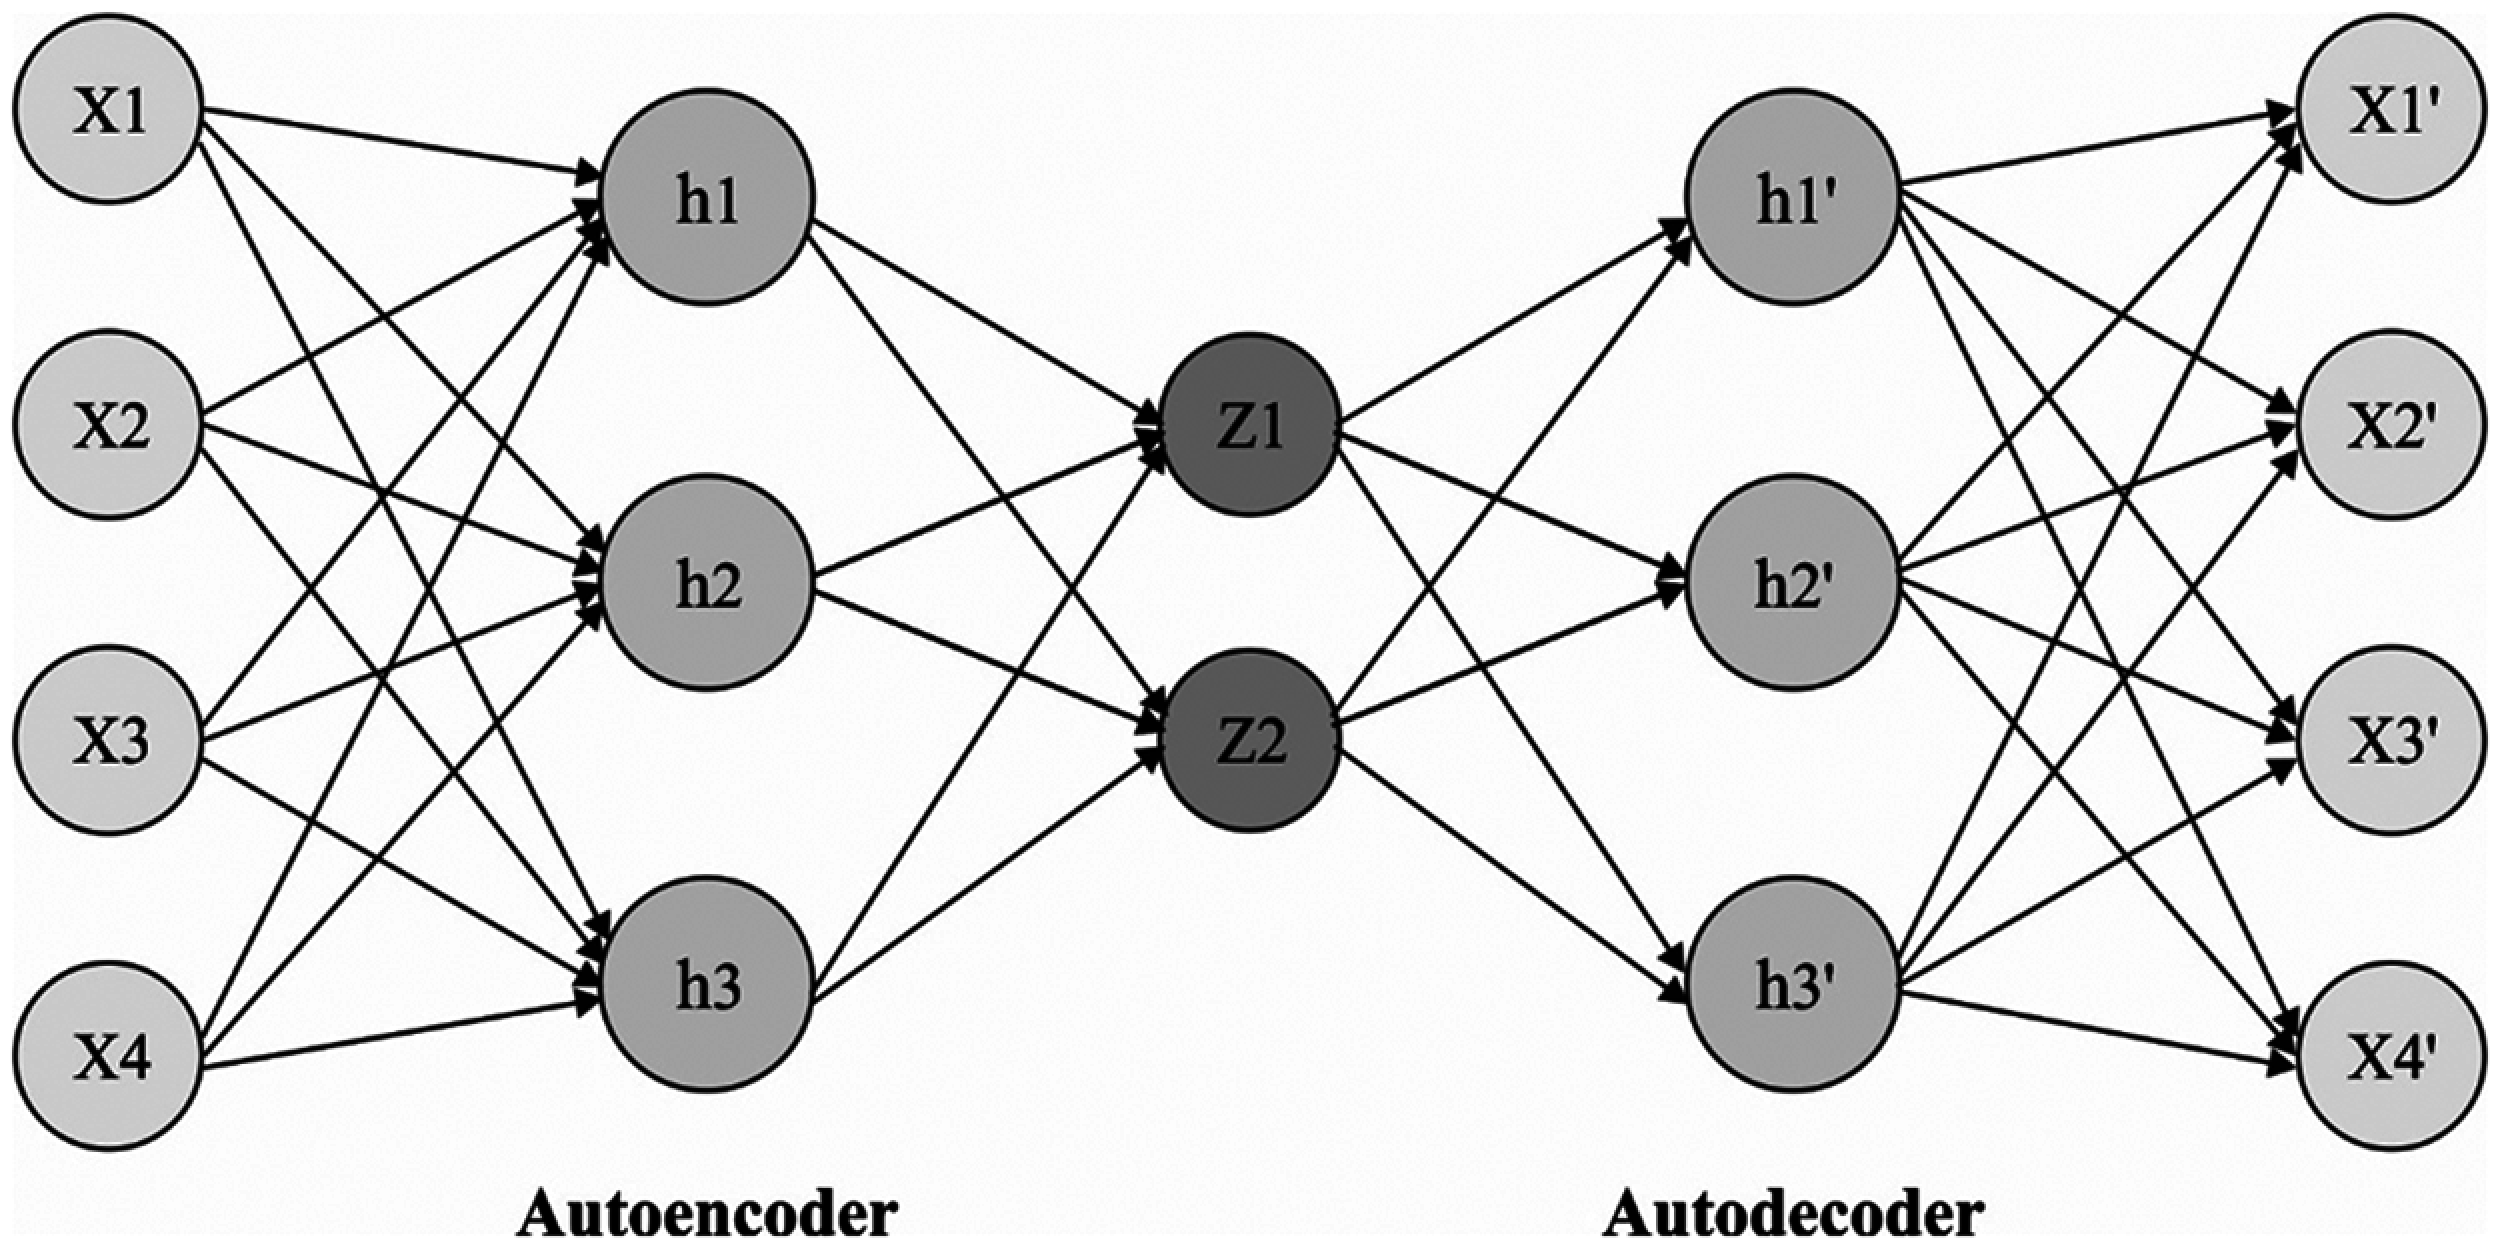
Figure 3: Structure of autoencoder
where
Furthermore, it is constrained term that is added to the loss function of AE. The extended loss function is depicted as,
where
where
In this model, Sun refers that minimizing the loss functions (16)–(18) which does not make sure the AE learns “meaningful” features for specific operation. In case of image classification, “useful” features are represented for enhancing the classification rate. Thus, explicit guiding norms relevant to special tasks such as the cross-entropy loss function are recommended to be included in the loss function of AE and approved to be significant. Thus, the modified loss function is illustrated as,
where
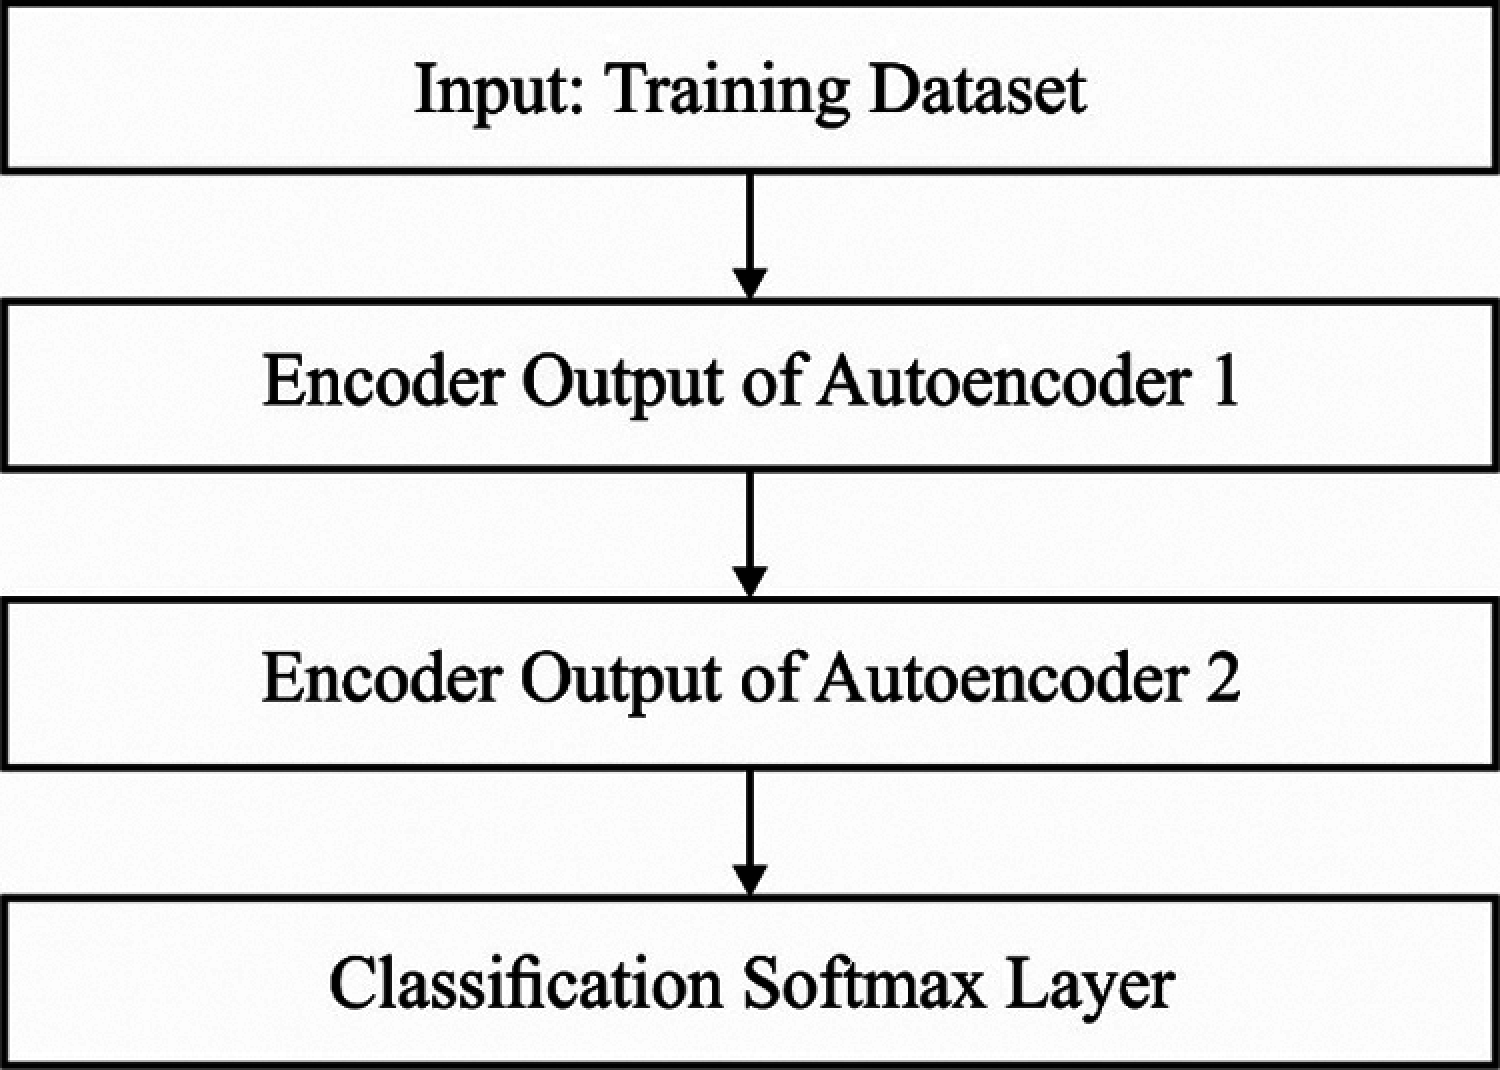
Figure 4: Flow diagram of stacked autoencoder
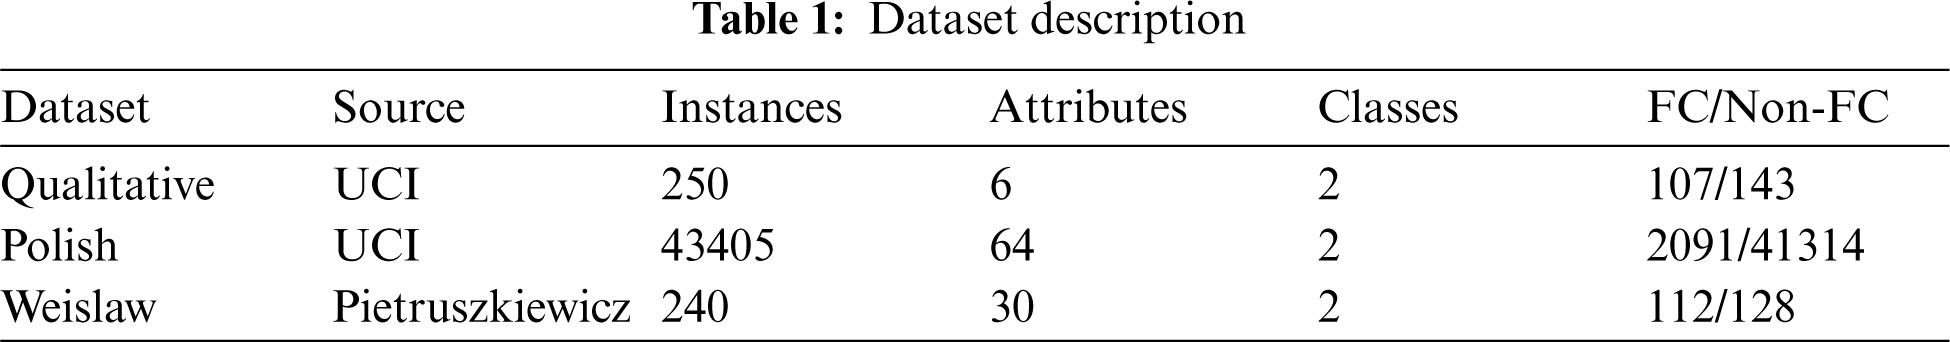
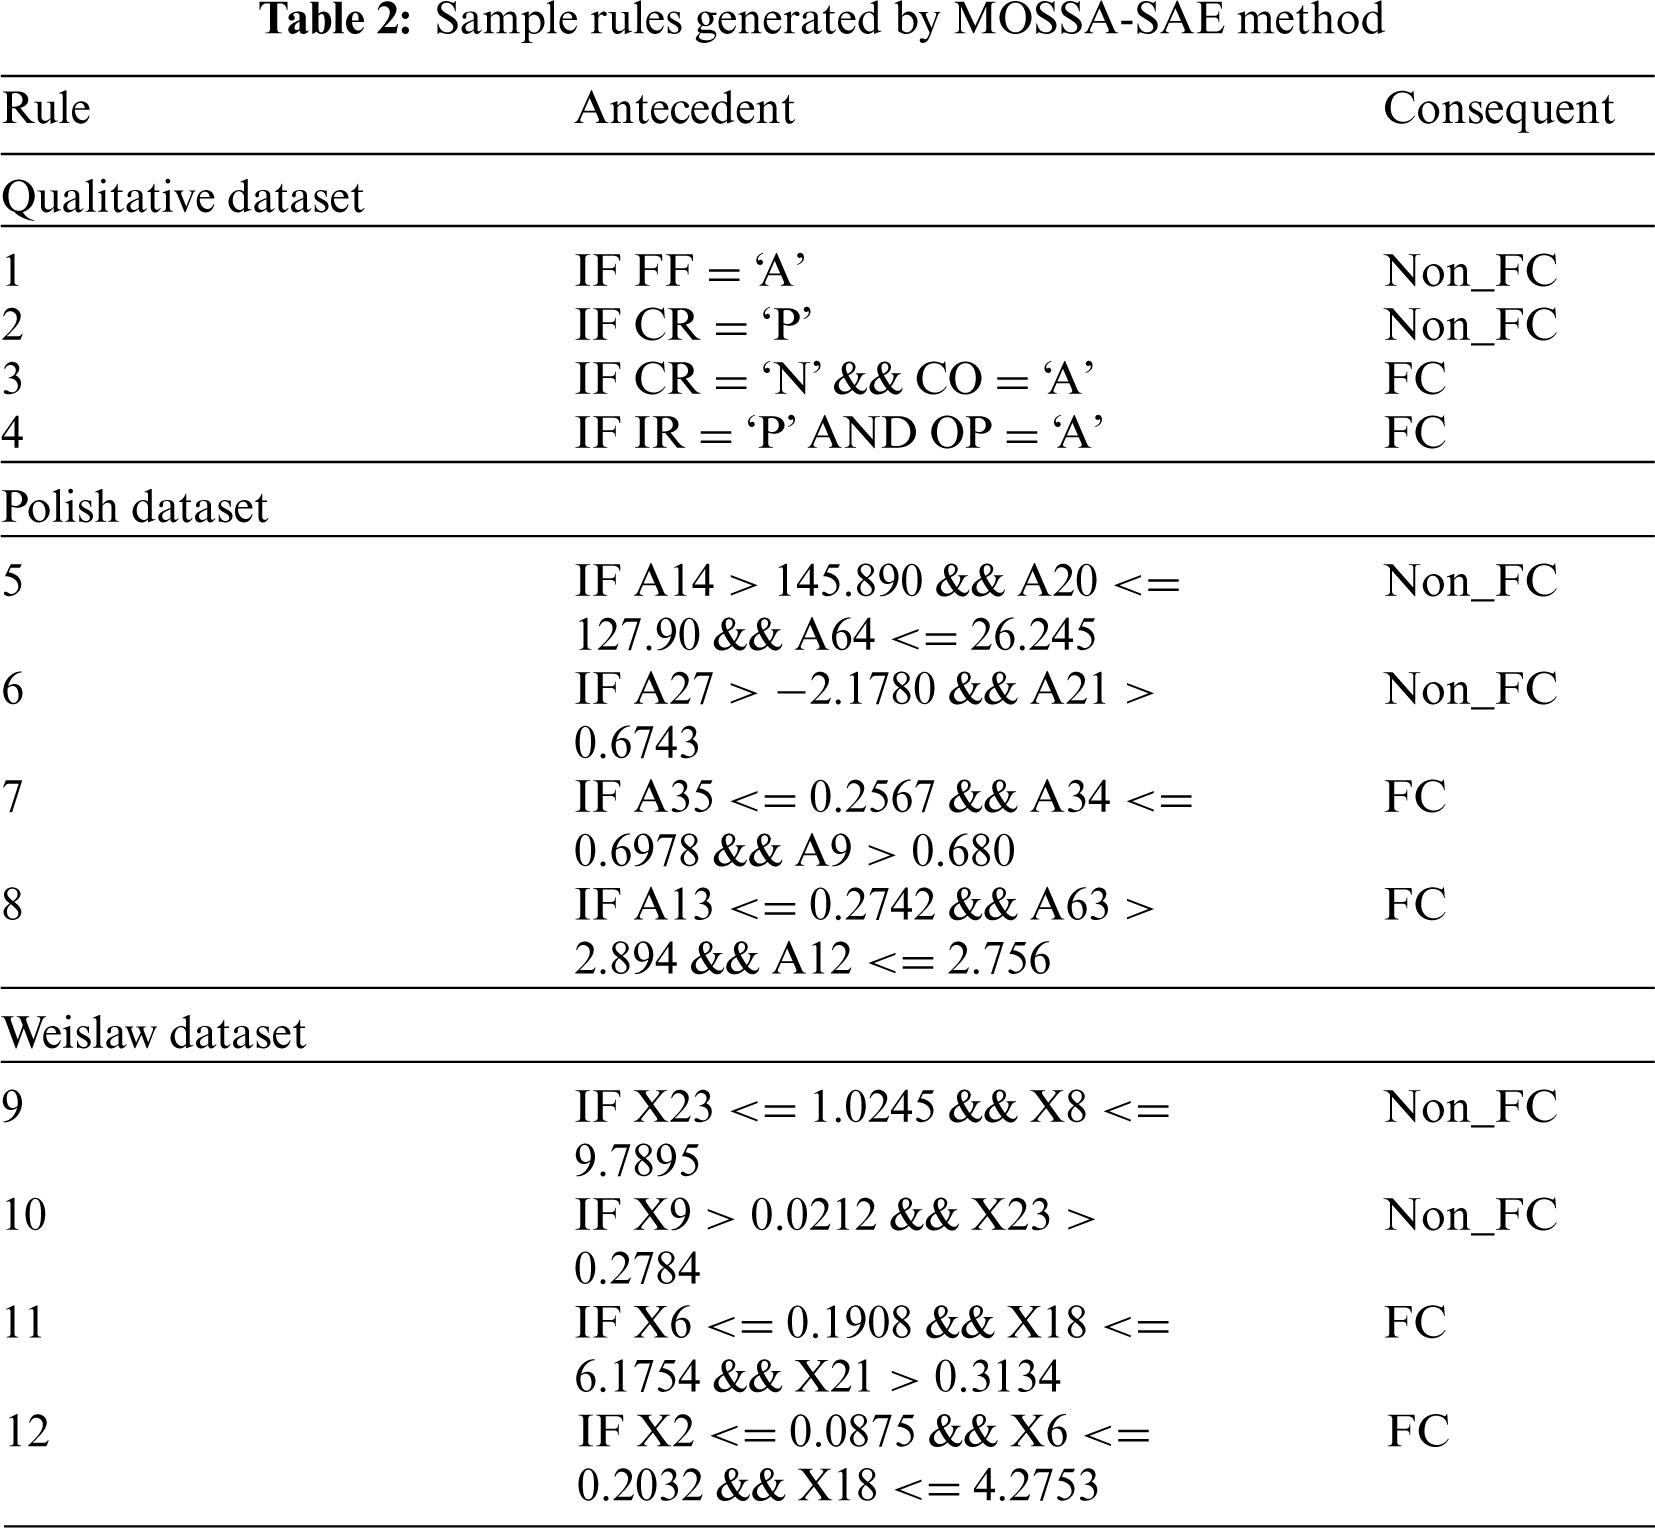
This section investigates the predictive performance of the MOSSA-SAE algorithm against three benchmark datasets namely qualitative, Polish, and Weislaw datasets. The first qualitative dataset comprises 250 samples with a total of 6 attributes and 2 classes. Similarly, the second Polish dataset includes a set of 43405 samples with 64 attributes and 2 classes. Thirdly, the Weislaw dataset comprises a collection of 240 instances with 30 attributes and 2 classes. The information related to these datasets is given in Tab. 1. Besides, a set of rules generated by the MOSSA-SAE model to carry out the classification process is tabulated in Tab. 2.
4.1 Results Analysis on Qualitative Bankruptcy Dataset
Tab. 3 and Fig. 5 studied the comparative results analysis of MOSSA-SAE model on the applied qualitative bankruptcy dataset [14,15]. The resultant values denoted that the OlexGA model has showcased inferior results with the sens. of 66.66%, spec. of 75.78%, accu. of 71.48%, F-score of 68.77%, and MCC of 0.43. At the same time, it is noticed that the ACA model has offered slightly improved outcomes with the sens. of 79.46%, spec. of 86.15%, accu. of 83.05%, F-score of 81.27%, and MCC of 0.66. Eventually, the GACA model has showcased certainly enhanced performance over ACA and OlexGA models with the sens. of 89.09%, spec. of 93.18%, accu. of 91.32%, F-measure of 90.32%, and MCC of 0.82.
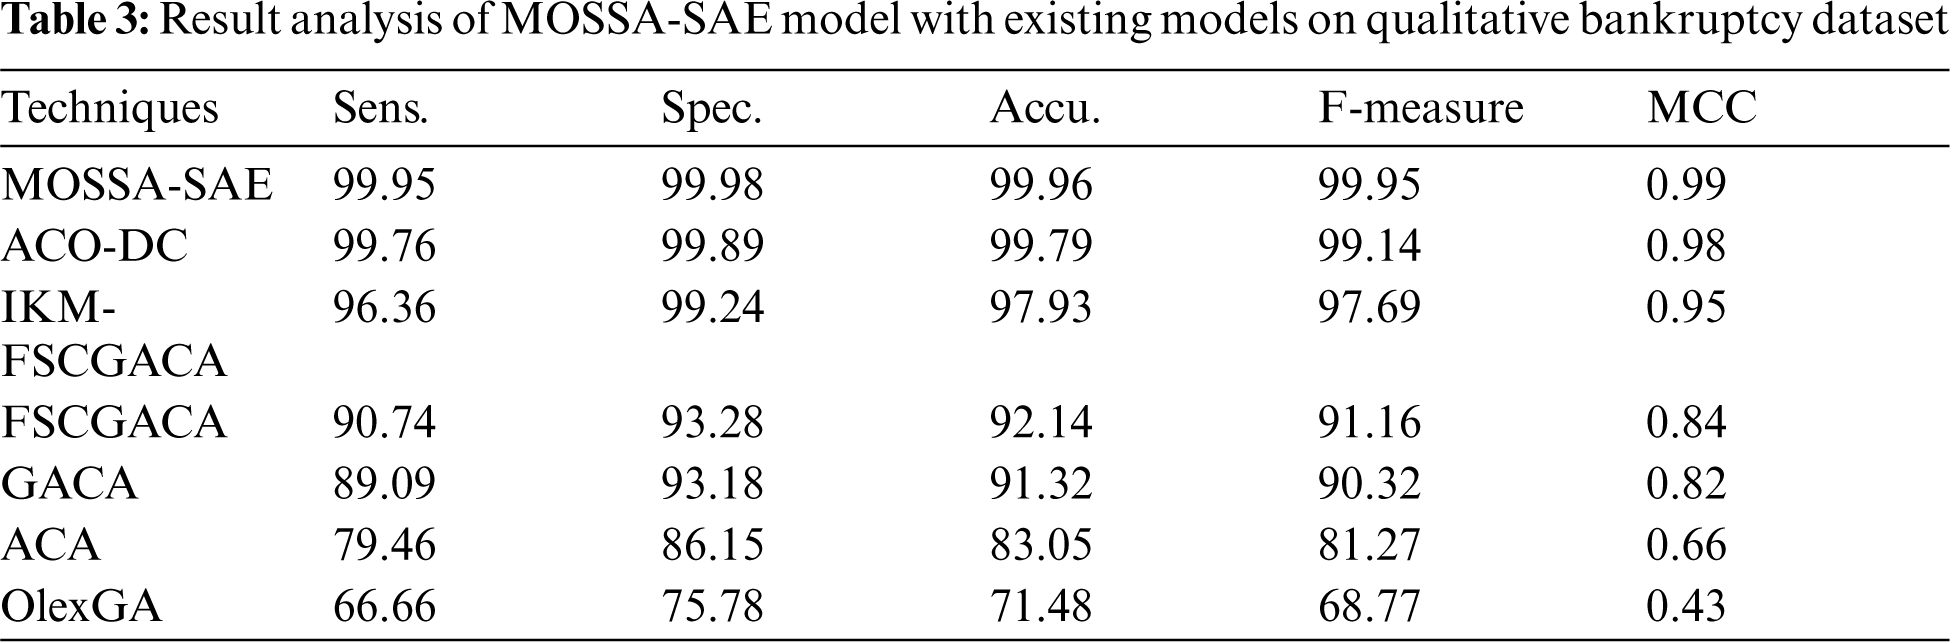
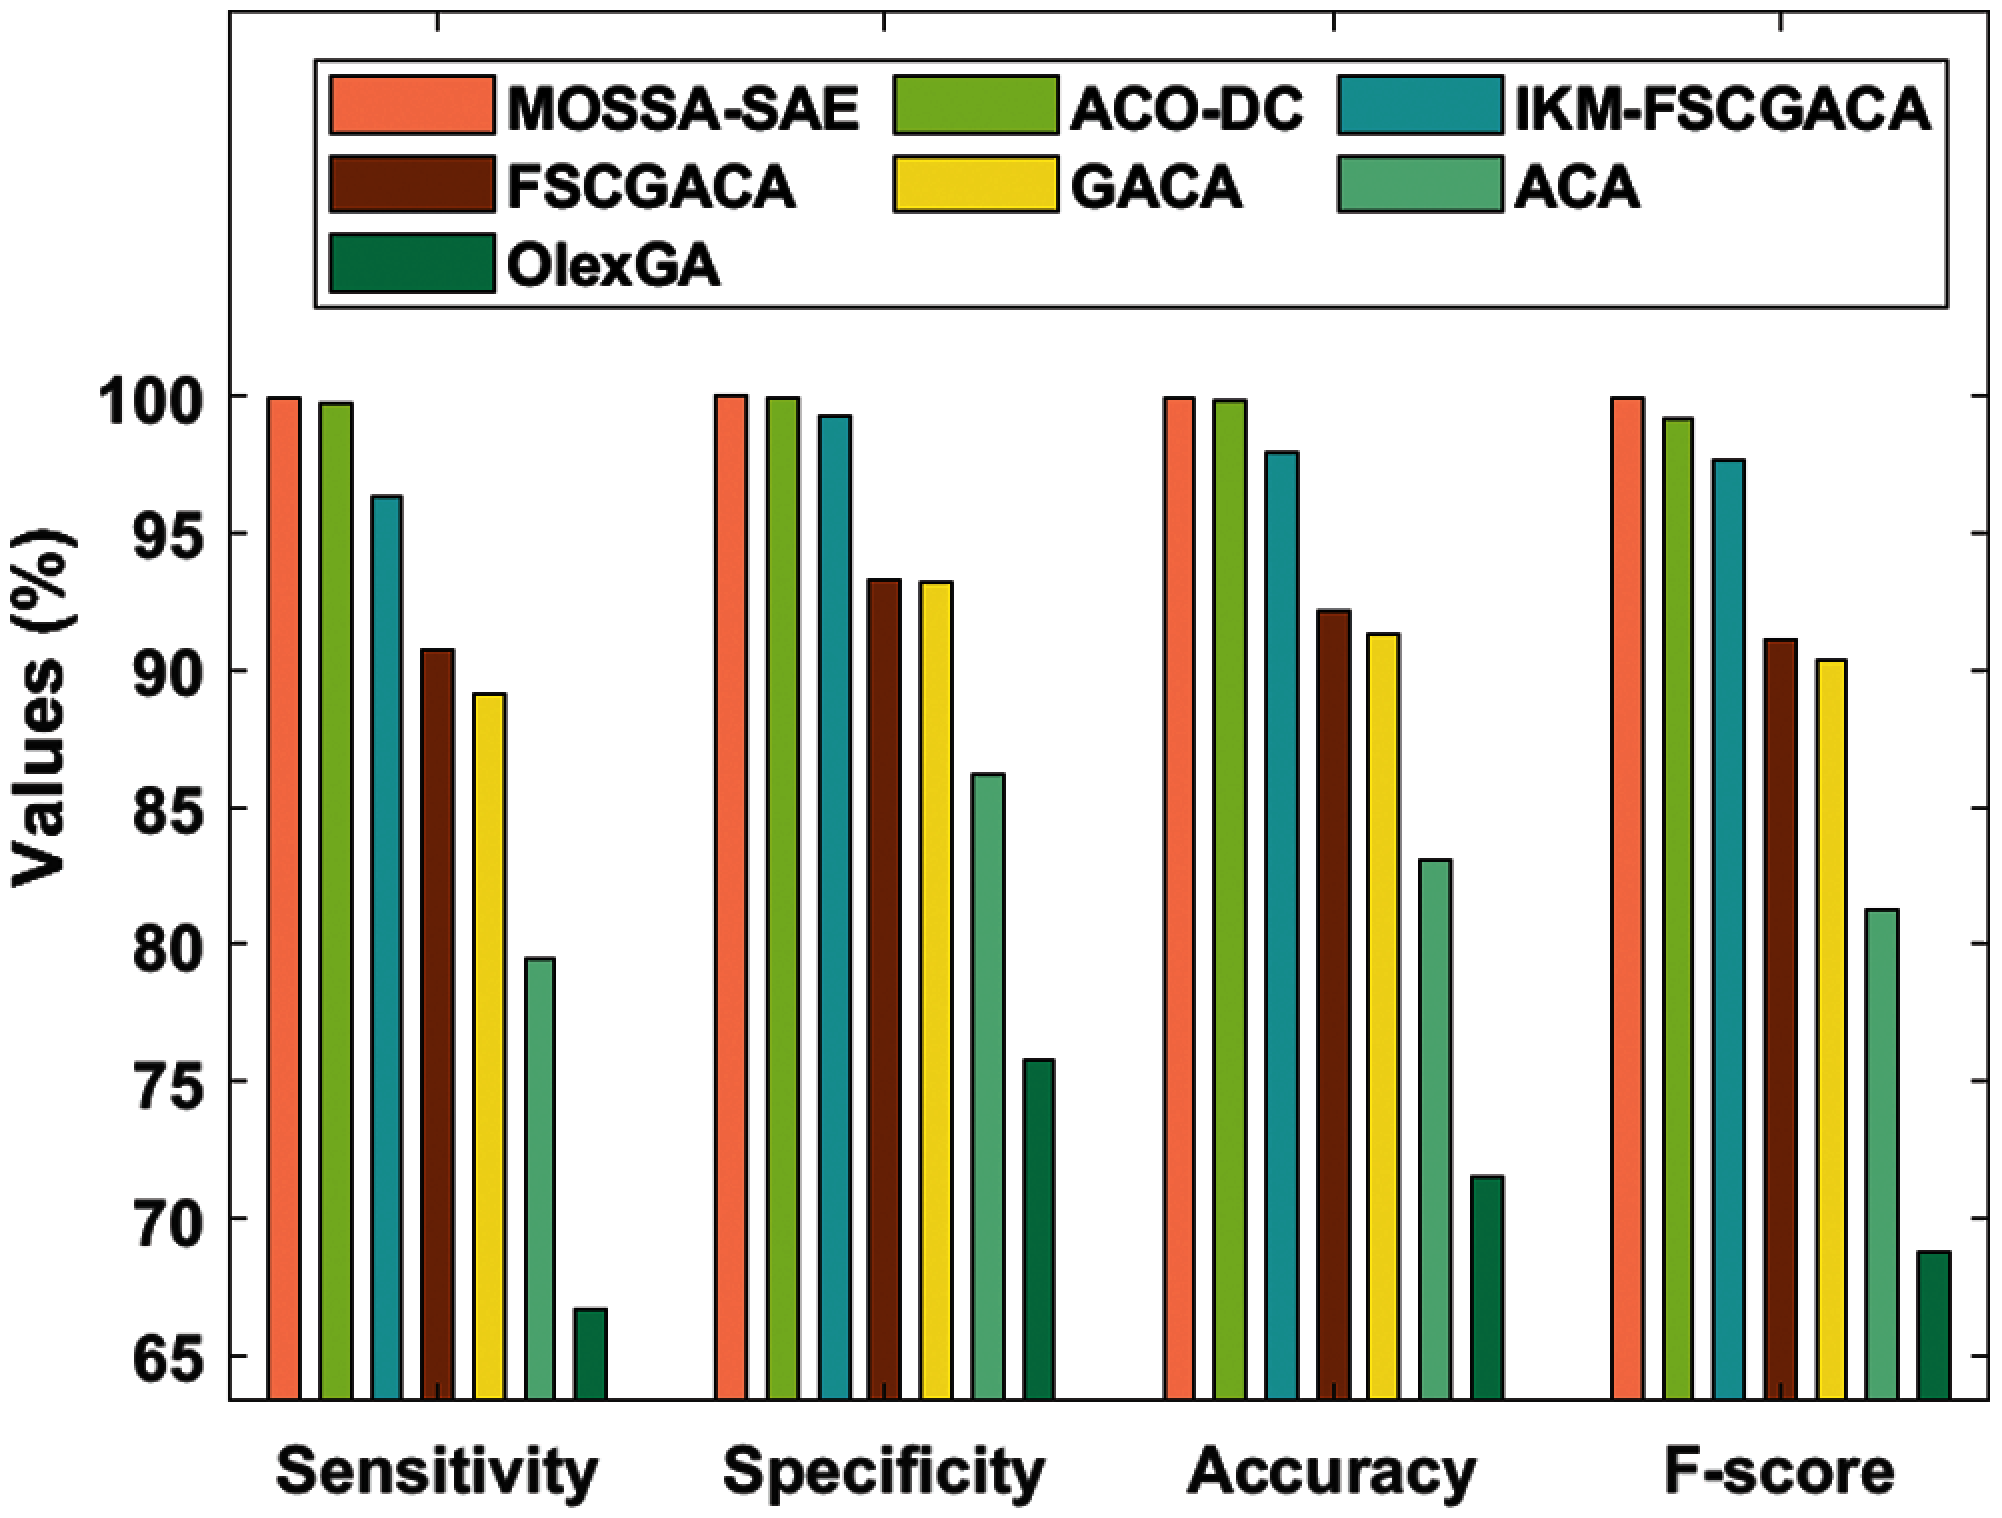
Figure 5: Result analysis of MOSSA-SAE model on qualitative bankruptcy dataset
Additionally, the FSCGACA model has tried to show moderate results with the sens. of 90.71%, spec. of 93.28%, accu. of 92.14%, F-measure of 91.16%, and MCC of 0.84. Furthermore, the IKM-FSCGACA model has demonstrated moderate outcome with the sens. of 96.36%, spec. of 99.24%, accu. of 97.93%, F-measure of 97.69%, and MCC of 0.95. Moreover, the ACO-DC model has exhibited near optimum outcomes with the sens. of 99.76%, spec. of 99.89%, accu. of 99.79%, F-measure of 99.14%, and MCC of 0.98. But the MOSSA-SAE model has outperformed all the other methods by accomplishing a maximum sens. of 99.95%, spec. of 99.98%, accu. of 99.96%, F-measure of 99.95%, and MCC of 0.99.
Fig. 6 shows the ROC analysis of different FCP models on the applied qualitative bankruptcy dataset. The figure demonstrated that the MOSSA-SAE model has resulted to a maximum ROC of 99.13% whereas the ACO-DC, IKM-FSCGACA, FSCGACA, GACA, and ACA models have led to a minimum ROC of 99.21%, 97.39%, 92.03%, 91.15%, 82.85%, and 71.02% respectively. Therefore, the presented MOSSA-SAE model has showcased effective outcome on the applied qualitative bankruptcy dataset.
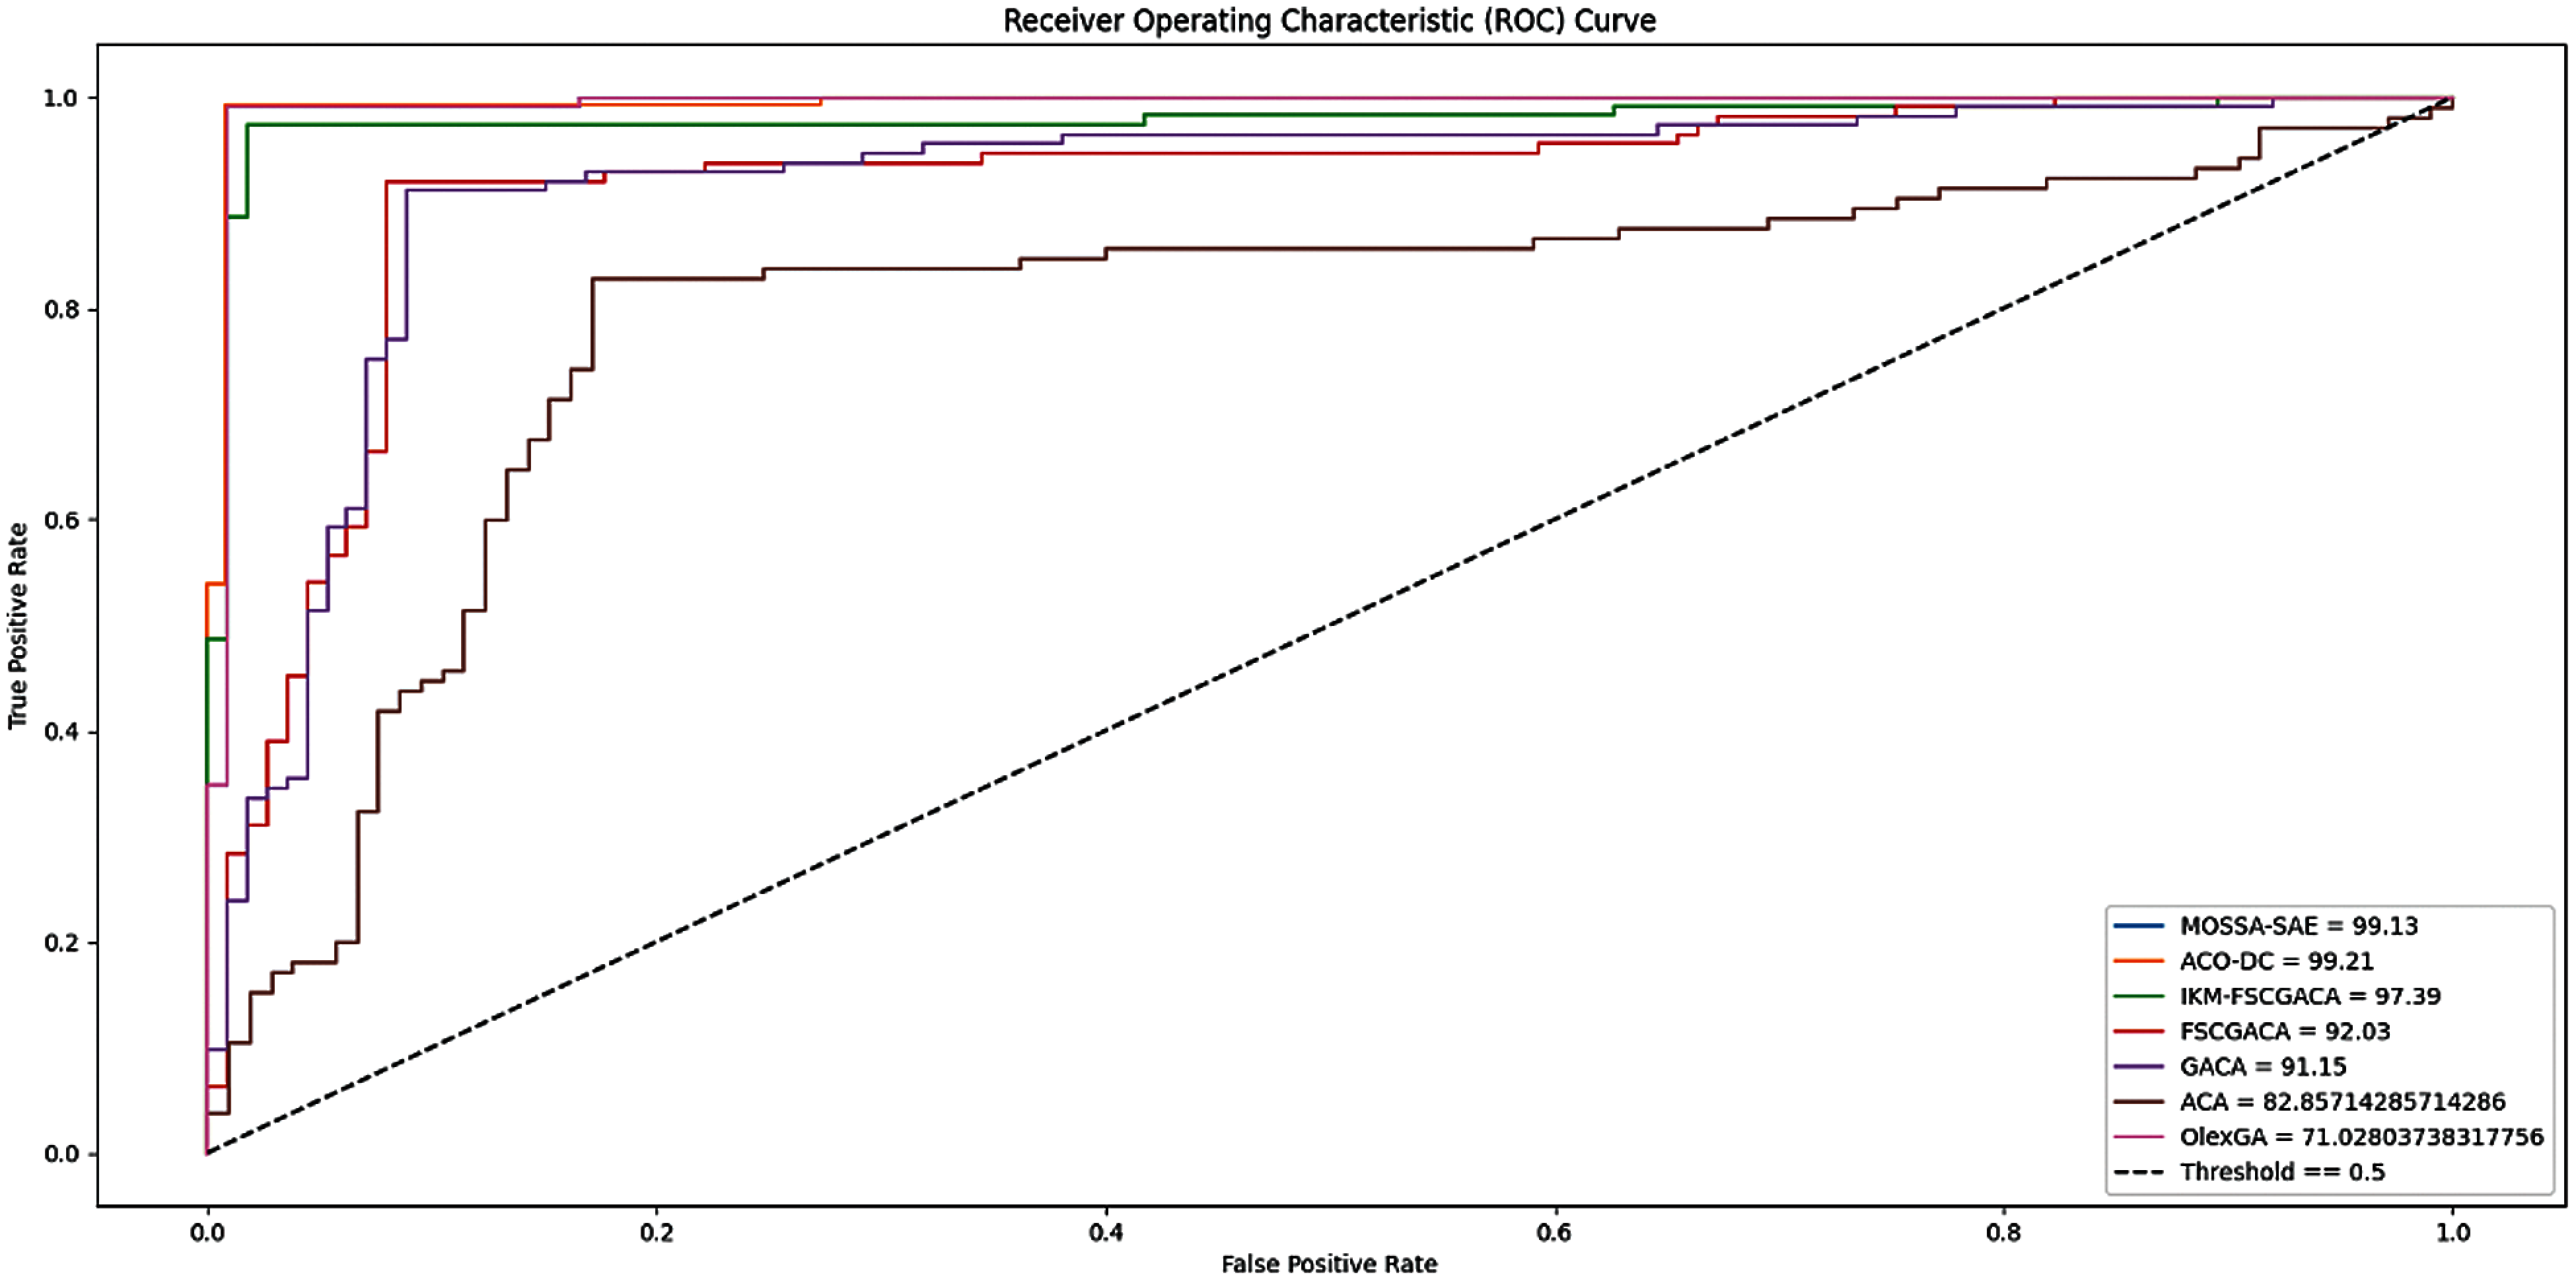
Figure 6: ROC analysis of different FCP models on qualitative bankruptcy dataset
4.2 Results Analysis on Polish Dataset
Tab. 4 and Fig. 7 presented the comparative results analysis of MOSSA-SAE method on the given polish bankruptcy dataset. The final measures have implied that the OlexGA scheme has demonstrated poor results with the sens. of 14.99%, spec. of 98.06%, accu. of 79.46%, F-measure of 24.64%, and MCC of 0.25. Simultaneously, it is clear that the ACA approach has provided moderate results with the sens. of 29.65%, spec. of 99.20%, accu. of 89.41%, F-measure of 44.09%, and MCC of 0.46.
Followed by, the GACA framework has depicted improved performance over ACA and OlexGA methodologies with the sens. of 31.55%, spec. of 99.48%, accu. of 89.98%, F-measure of 46.84%, and MCC of 0.50. In addition, the FSCGACA scheme has attempted to display considerable outcomes with the sens. of 35.29%, spec. of 99.58%, accu. of 91.39%, F-measure of 51.12%, and MCC of 0.54. Moreover, the IKM-FSCGACA framework has illustrated acceptable results with the sens. of 47.91%, spec. of 99.89%, accu. of 94.72%, F-measure of 64.39%, and MCC of 0.66. Eventually, the ACO-DC technique has implied closer optimal results with the sens. of 97.63%, spec. of 99.90%, accu. of 97.69%, F-measure of 98.80%, and MCC of 0.71. However, the MOSSA-SAE approach has surpassed the compared models by gaining higher sens. of 98.76%, spec. of 99.93%, accu. of 98.99%, F-measure of 98.97%, and MCC of 0.96.
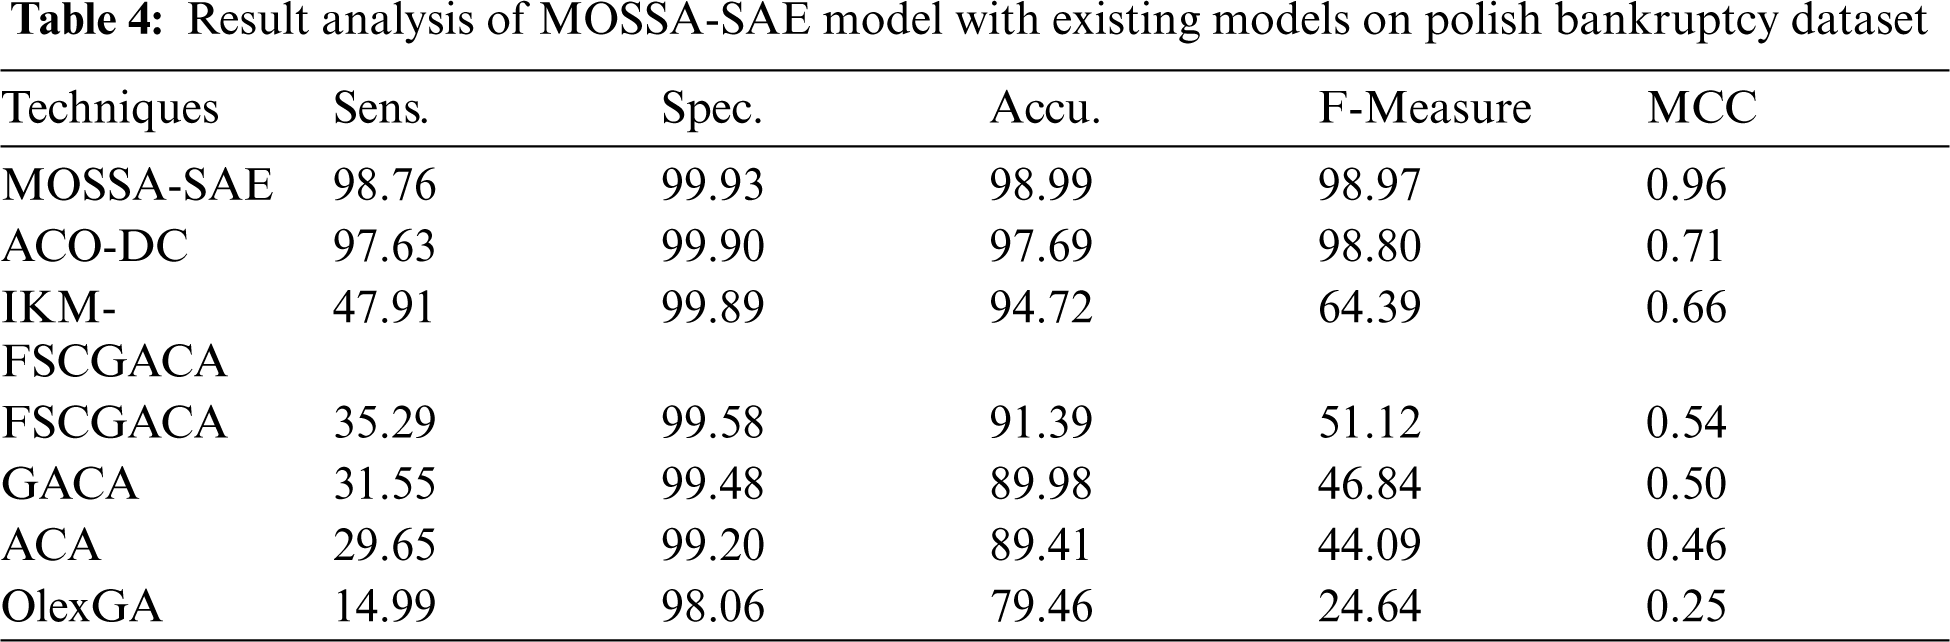
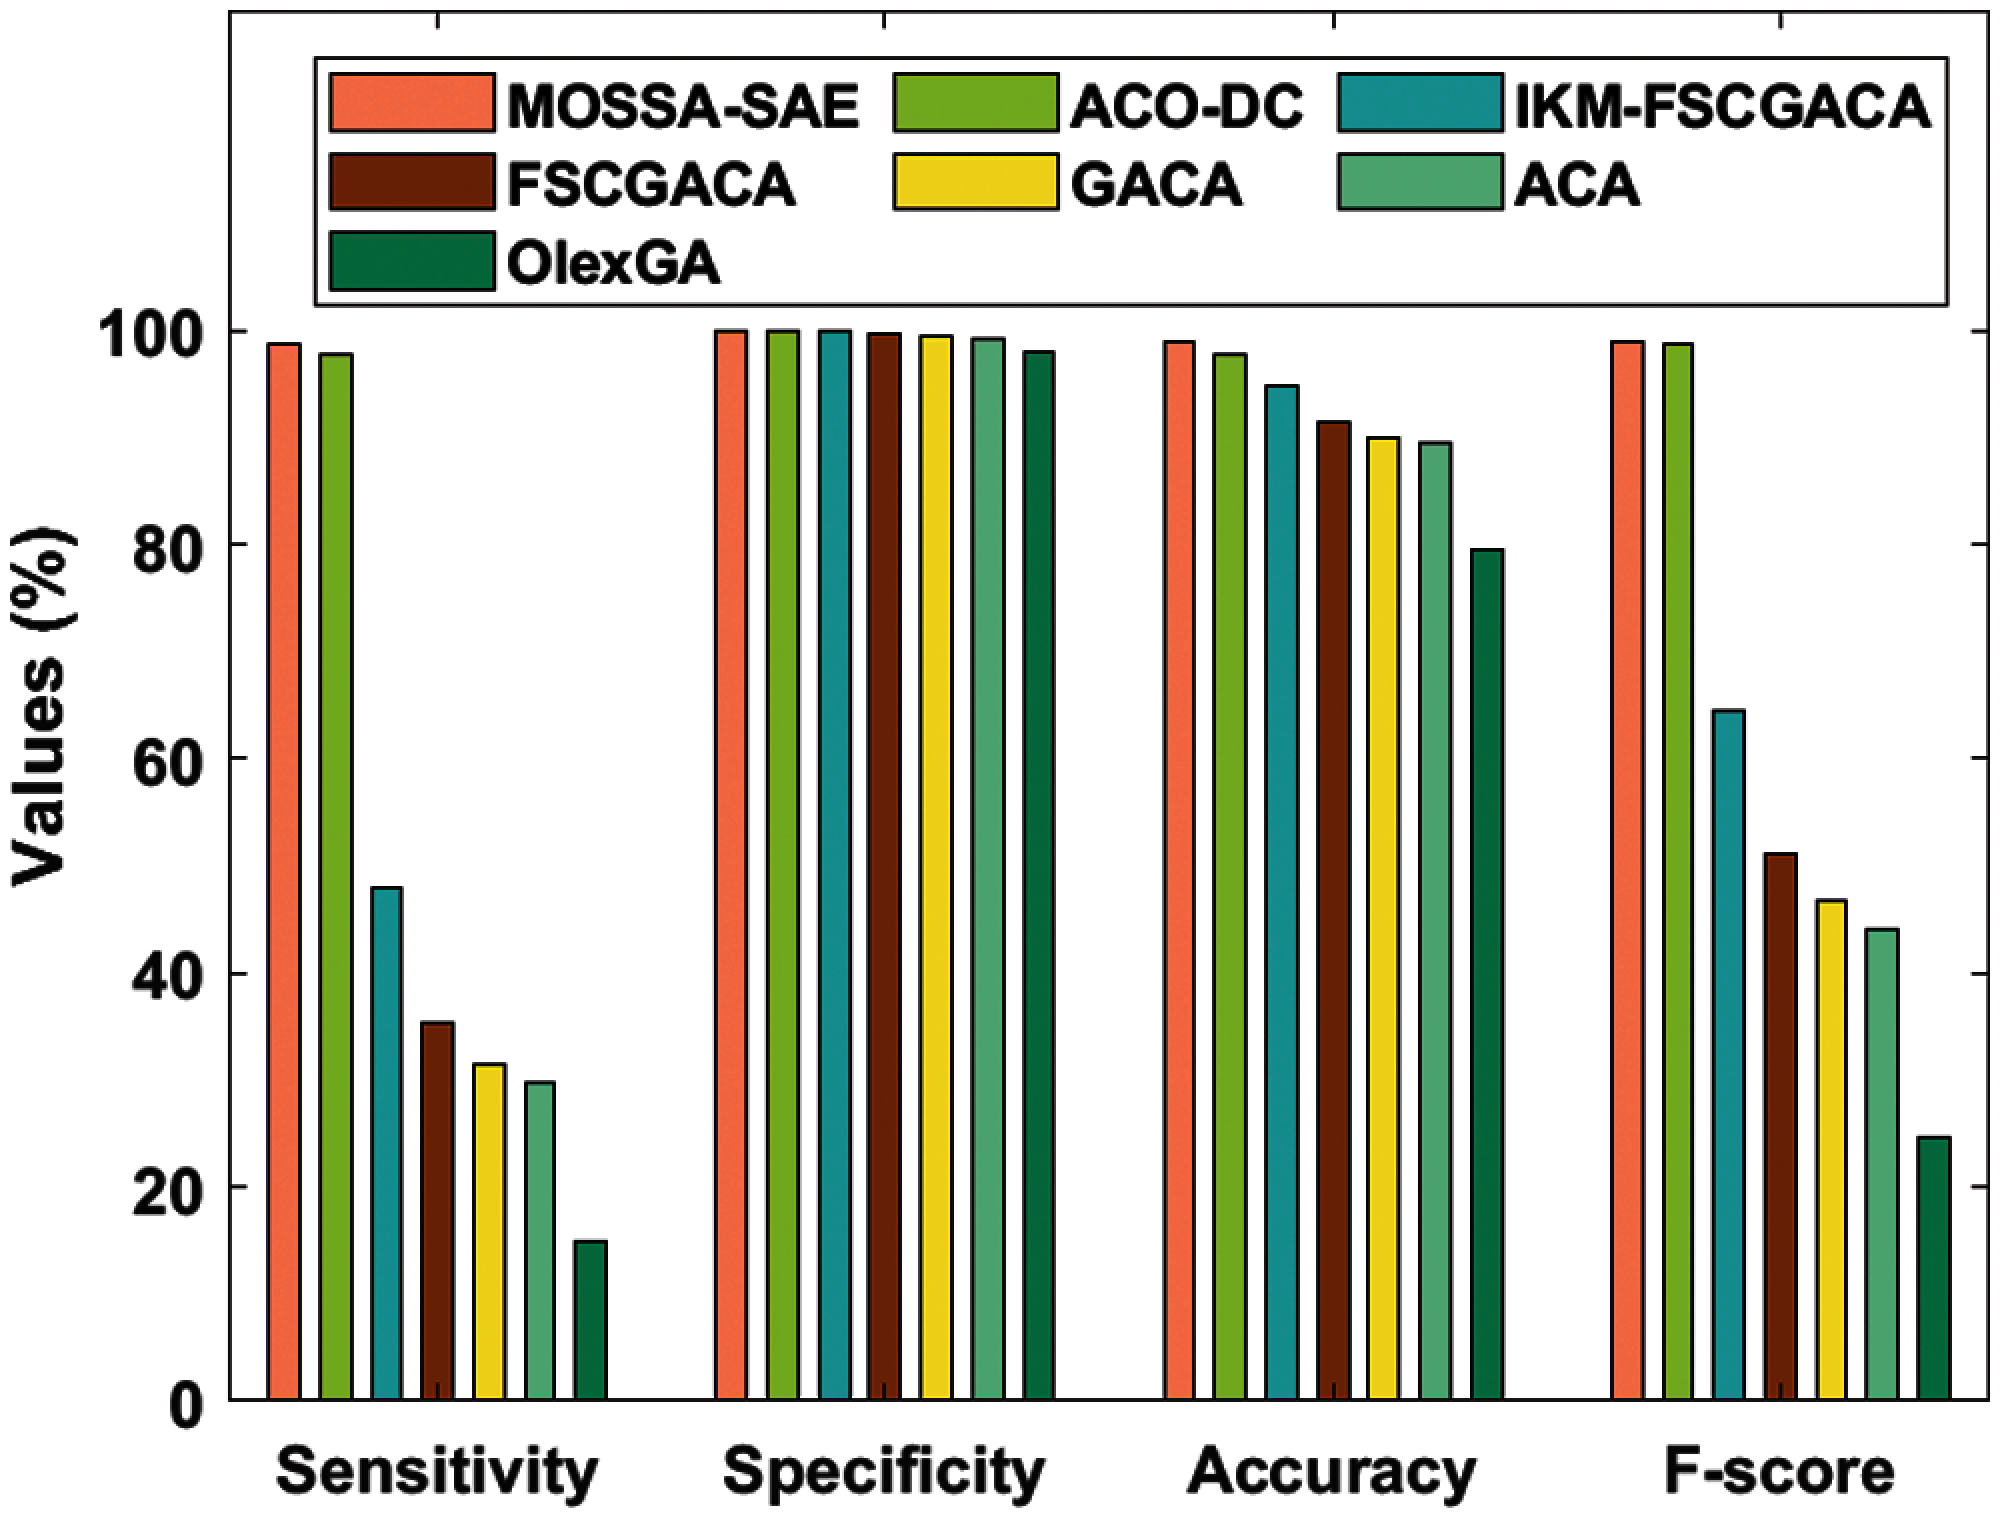
Figure 7: Result analysis of MOSSA-SAE model on polish bankruptcy dataset
Fig. 8 displays the ROC analysis of dissimilar FCP models on the applied Polish bankruptcy dataset. The figure revealed that the MOSSA-SAE model has led to a higher ROC of 99.13% whereas the ACO-DC, IKM-FSCGACA, FSCGACA, GACA, and ACA models have accomplished to a lower ROC of 99.21%, 97.39%, 92.03%, 91.15%, 82.85%, and 71.02% respectively. So, the presented MOSSA-SAE model has offered superior performance on the applied dataset.
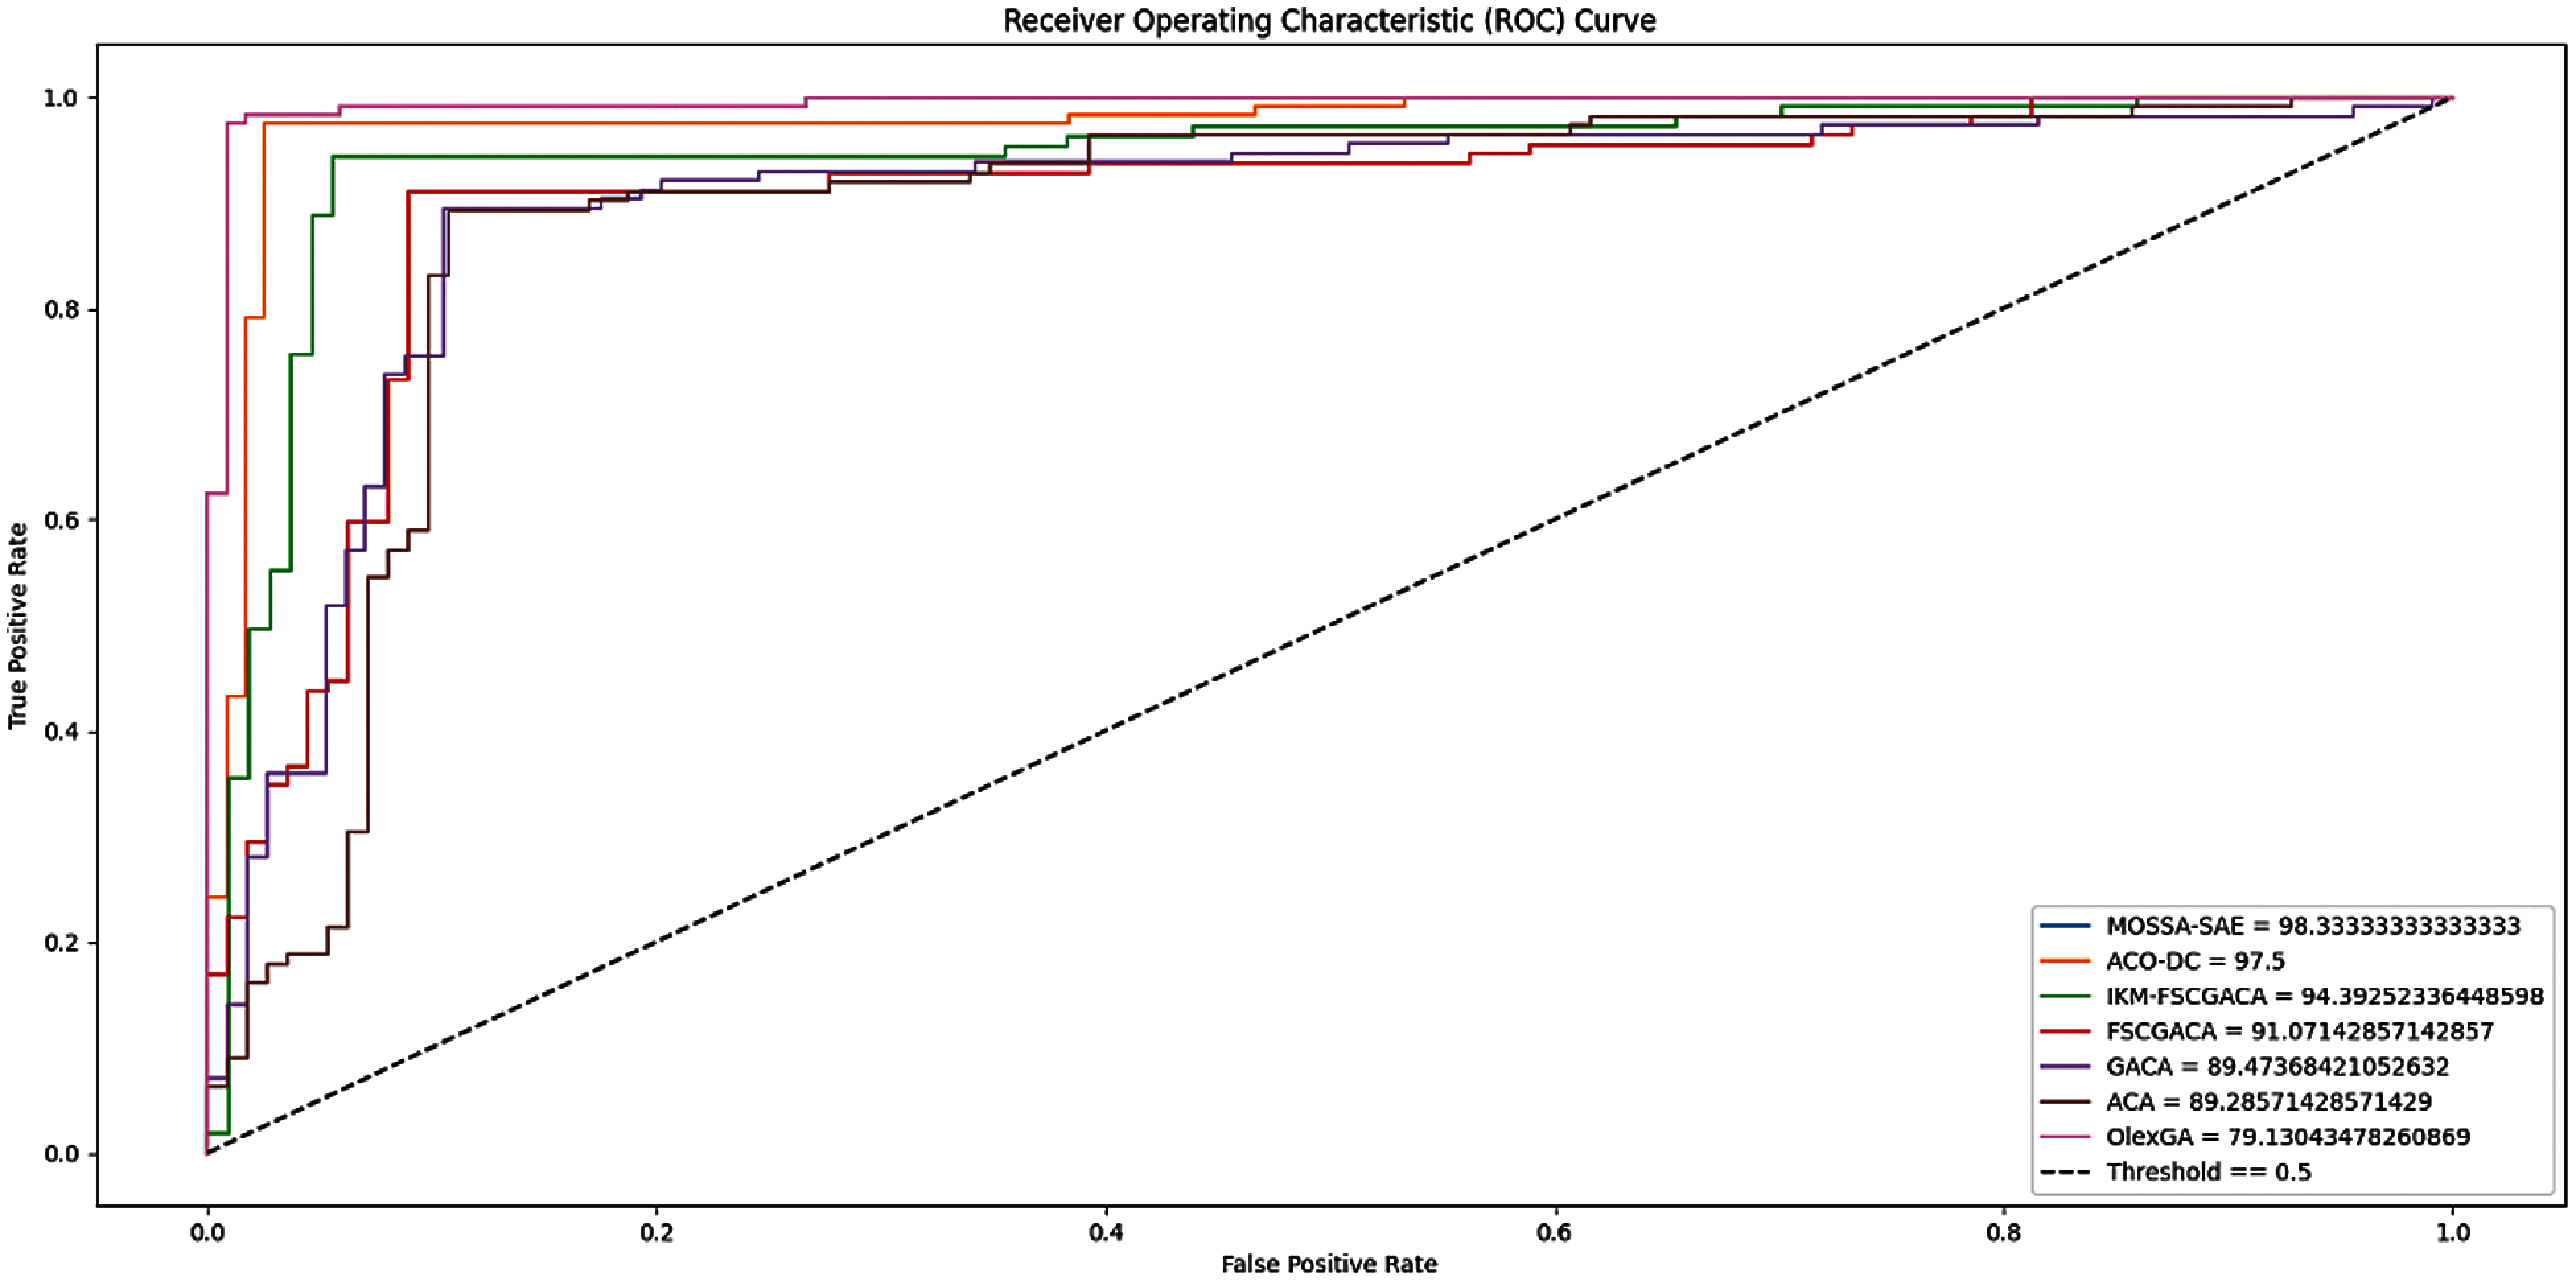
Figure 8: ROC analysis of different FCP models on polish bankruptcy dataset
This paper has developed an effective MOSSA-SAE model for FCP in IoT environments. The MOSSA-SAE model encompasses diverse subprocesses, i.e., preprocessing, class imbalance handling, parameter tuning, and classification. Mainly, the MOSSA-SAE model allows the IoT devices such as smartphones, laptops, etc. to collect the financial details of the users which are then transmitted to the cloud for further analysis. At the cloud server, data preprocessing is firstly accomplished to remove the unwanted data and improve the compatibility of the data for the subsequent processes. After that, the SMOTE with SSA is applied for handling the class imbalance problem. Finally, the SAE with SSA model is applied to carry out the classification process and determine the appropriate class label of the financial data. The application of SSA helps to tune the parameters involved in SMOTE and SAE. A widespread experimental validation process is executed on the benchmark financial dataset and the results are studied under separate aspects. The experimental values guaranteed the superior performance of the MOSSA-SAE method on the applied dataset. As a part of future work, the predictive outcome of the MOSSA-SAE method can be improved using clustering and feature selection methodologies.
Funding Statement: The authors extend their appreciation to the Deanship of Scientific Research at King Khalid University for funding this work under grant number (RGP 2/23/42), https://www.kku.edu.sa. This research was funded by the Deanship of Scientific Research at Princess Nourah bint Abdulrahman University through the Fast-Track Path of Research Funding Program.
Conflicts of Interest: The authors declare that they have no conflicts of interest to report regarding the present study.
1. K. J. Forbes and R. Rigobon, “No contagion, only interdependence: Measuring stock market comovements,” The Journal of Finance, vol. 57, no. 5, pp. 2223–2261, 2002. [Google Scholar]
2. M. Ala’raj and M. F. Abbod, “Classifiers consensus system approach for credit scoring,” Knowledge-Based Systems, vol. 104, no. 8, pp. 89–105, 2016. [Google Scholar]
3. J. Uthayakumar, N. Metawa, K. Shankar and S. K. Lakshmanaprabu, “Financial crisis prediction model using ant colony optimization,” International Journal of Information Management, vol. 50, no. 5, pp. 538–556, 2020. [Google Scholar]
4. Z. Huang, H. Chen, C.-J. Hsu, W.-H. Chen and S. Wu, “Credit rating analysis with support vector machines and neural networks: A market comparative study,” Decision Support Systems, vol. 37, no. 4, pp. 543–558, 2004. [Google Scholar]
5. J. Sun and H. Li, “Financial distress prediction using support vector machines: Ensemble vs. individual,” Applied Soft Computing, vol. 12, no. 8, pp. 2254–2265, 2012. [Google Scholar]
6. Y. Lin, H. Guo and J. Hu, “An SVM-based approach for stock market trend prediction,” in The 2013 Int. Joint Conf. on Neural Networks (IJCNNTexas, USA, pp. 1–7, 2013. [Google Scholar]
7. R. Geng, I. Bose and X. Chen, “Prediction of financial distress: An empirical study of listed chinese companies using data mining,” European Journal of Operational Research, vol. 241, no. 1, pp. 236–247, 2015. [Google Scholar]
8. Y. Li and X. Zeng, “Sequential multi-criteria feature selection algorithm based on agent genetic algorithm,” Applied Intelligence, vol. 33, no. 2, pp. 117–131, 2010. [Google Scholar]
9. J.-D. Shie and S.-M. Chen, “Feature subset selection based on fuzzy entropy measures for handling classification problems,” Applied Intelligence, vol. 28, no. 1, pp. 69–82, 2008. [Google Scholar]
10. W. TsaoPan, “A new fruit fly optimization algorithm: Taking the financial distress model as an example,” Knowledge-Based Systems, vol. 26, no. 7, pp. 69–74, 2012. [Google Scholar]
11. G. Wang, J. Ma and S. Yang, “An improved boosting based on feature selection for corporate bankruptcy prediction,” Expert Systems with Applications, vol. 41, no. 5, pp. 2353–2361, 2014. [Google Scholar]
12. F. Lin, D. Liang, C.-C. Yeh and J.-C. Huang, “Novel feature selection methods to financial distress prediction,” Expert Systems with Applications, vol. 41, no. 5, pp. 2472–2483, 2014. [Google Scholar]
13. J. Uthayakumar, T. Vengattaraman and P. Dhavachelvan, “Swarm intelligence based classification rule induction (CRI) framework for qualitative and quantitative approach: An application of bankruptcy prediction and credit risk analysis,” Journal of King Saud University-Computer and Information Sciences, vol. 32, no. 6, pp. 647–657, 2020. [Google Scholar]
14. N. Metawa, I. V. Pustokhina, D. A. Pustokhin, K. Shankar and M. Elhoseny, “Computational intelligence-based financial crisis prediction model using feature subset selection with optimal deep belief network,” Big Data, vol. 9, no. 2, pp. 100–115, 2021. [Google Scholar]
15. J. Uthayakumar, N. Metawa, K. Shankar and S. K. Lakshmanaprabu, “Intelligent hybrid model for financial crisis prediction using machine learning techniques,” Information Systems and e-Business Management, vol. 18, no. 4, pp. 617–645, 2020. [Google Scholar]
16. S. Sankhwar, D. Gupta, K. C. Ramya, S. Sheeba Rani, K. Shankar et al., “Improved grey wolf optimization-based feature subset selection with fuzzy neural classifier for financial crisis prediction,” Soft Computing, vol. 24, no. 1, pp. 101–110, 2020. [Google Scholar]
17. M. Jain, V. Singh and A. Rani, “A novel nature-inspired algorithm for optimization: Squirrel search algorithm,” Swarm and Evolutionary Computation, vol. 44, no. 4, pp. 148–175, 2019. [Google Scholar]
18. T. Zheng and W. Luo, “An improved squirrel search algorithm for optimization,” Complexity, vol. 2019, pp. 1–31, 2019. [Google Scholar]
19. N. V. Chawla, K. W. Bowyer, L. O. Hall and W. P. Kegelmeyer, “SMOTE: Synthetic minority over-sampling technique,” Journal of Artificial Intelligence Research, vol. 16, pp. 321–357, 2002. [Google Scholar]
20. K.-J. Wang, B. Makond, K.-H. Chen and K.-M. Wang, “A hybrid classifier combining SMOTE with PSO to estimate 5-year survivability of breast cancer patients,” Applied Soft Computing, vol. 20, no. 3, pp. 15–24, 2014. [Google Scholar]
21. G. Liu, Y. Li, L. Jiao, Y. Chen and R. Shang, “Multiobjective evolutionary algorithm assisted stacked autoencoder for PolSAR image classification,” Swarm and Evolutionary Computation, vol. 60, no. 6, pp. 100794, 2021. [Google Scholar]
 | This work is licensed under a Creative Commons Attribution 4.0 International License, which permits unrestricted use, distribution, and reproduction in any medium, provided the original work is properly cited. |