DOI:10.32604/cmc.2022.021119
| Computers, Materials & Continua DOI:10.32604/cmc.2022.021119 | |
| Article |
Intelligent Machine Learning Based EEG Signal Classification Model
1Department of Natural and Applied Sciences, College of Community-Aflaj, Prince Sattam bin Abdulaziz University, Saudi Arabia
2Department of Information Systems, College of Computer and Information Sciences, Princess Nourah Bint Abdulrahman University, Saudi Arabia
3Department of Computer Science, King Khalid University, Muhayel Aseer, Saudi Arabia & Faculty of Computer and IT, Sana'a University, Sana'a, Yemen
4Department of Computer Science, College of Computer, Qassim University, Saudi Arabia
5Department of Computer and Self Development, Preparatory Year Deanship, Prince Sattam bin Abdulaziz University, Alkharj, Saudi Arabia
*Corresponding Author: Anwer Mustafa Hilal. Email: a.hilal@psau.edu.sa
Received: 24 June 2021; Accepted: 23 August 2021
Abstract: In recent years, Brain-Computer Interface (BCI) system gained much popularity since it aims at establishing the communication between human brain and computer. BCI systems are applied in several research areas such as neuro-rehabilitation, robots, exoeskeletons, etc. Electroencephalography (EEG) is a technique commonly applied in capturing brain signals. It is incorporated in BCI systems since it has attractive features such as non-invasive nature, high time-resolution output, mobility and cost-effective. EEG classification process is highly essential in decision making process and it incorporates different processes namely, feature extraction, feature selection, and classification. With this motivation, the current research paper presents an Intelligent Optimal Fuzzy Support Vector Machine-based EEC recognition (IOFSVM-EEG) model for BCI system. Independent Component Analysis (ICA) technique is applied onto the proposed IOFSVM-EEG model to remove the artefacts that exist in EEG signal and to retain the meaningful EEG information. Besides, Common Spatial Pattern (CSP)-based feature extraction technique is utilized to derive a helpful set of feature vectors from the preprocessed EEG signals. Moreover, OFSVM method is applied in the classification of EEG signals, in which the parameters involved in FSVM are optimally tuned using Grasshopper Optimization Algorithm (GOA). In order to validate the enhanced EEG recognition outcomes of the proposed IOFSVM-EEG model, an extensive set of experiments was conducted. The outcomes were examined under distinct aspects. The experimental results highlighted the enhanced performance of the presented IOFSVM-EEG model over other state-of-the-art methods.
Keywords: Brain computer interface; EEG recognition; human computer interface; machine learning; parameter tuning; FSVM
Brain Computer Interface (BCI) system translates a user's brain activity designs to commands/messages for a collaborative application that is processed and measured by the scheme [1,2]. Electroencephalography (EEG) is generally used to measure the brain activities of a BCI user. To be specific, BCI system could enable its user to move a cursor to left/right of a computer screen by visualizing left/right hand motions, correspondingly [3]. Then, it also can likely create computer controls with no other physical activities. So, EEG-based BCI is a promising system that can transform several application regions, particularly enable severely motor-impaired users control their assistive techniques, viz. text input system or wheelchair, rehabilitation device for stroke-affected individuals, novel gaming input device, implementation of an adaptive human computer interface in which the clouds respond to a user's mental state and so on. Fig. 1 illustrates the block diagram of BCI [4].
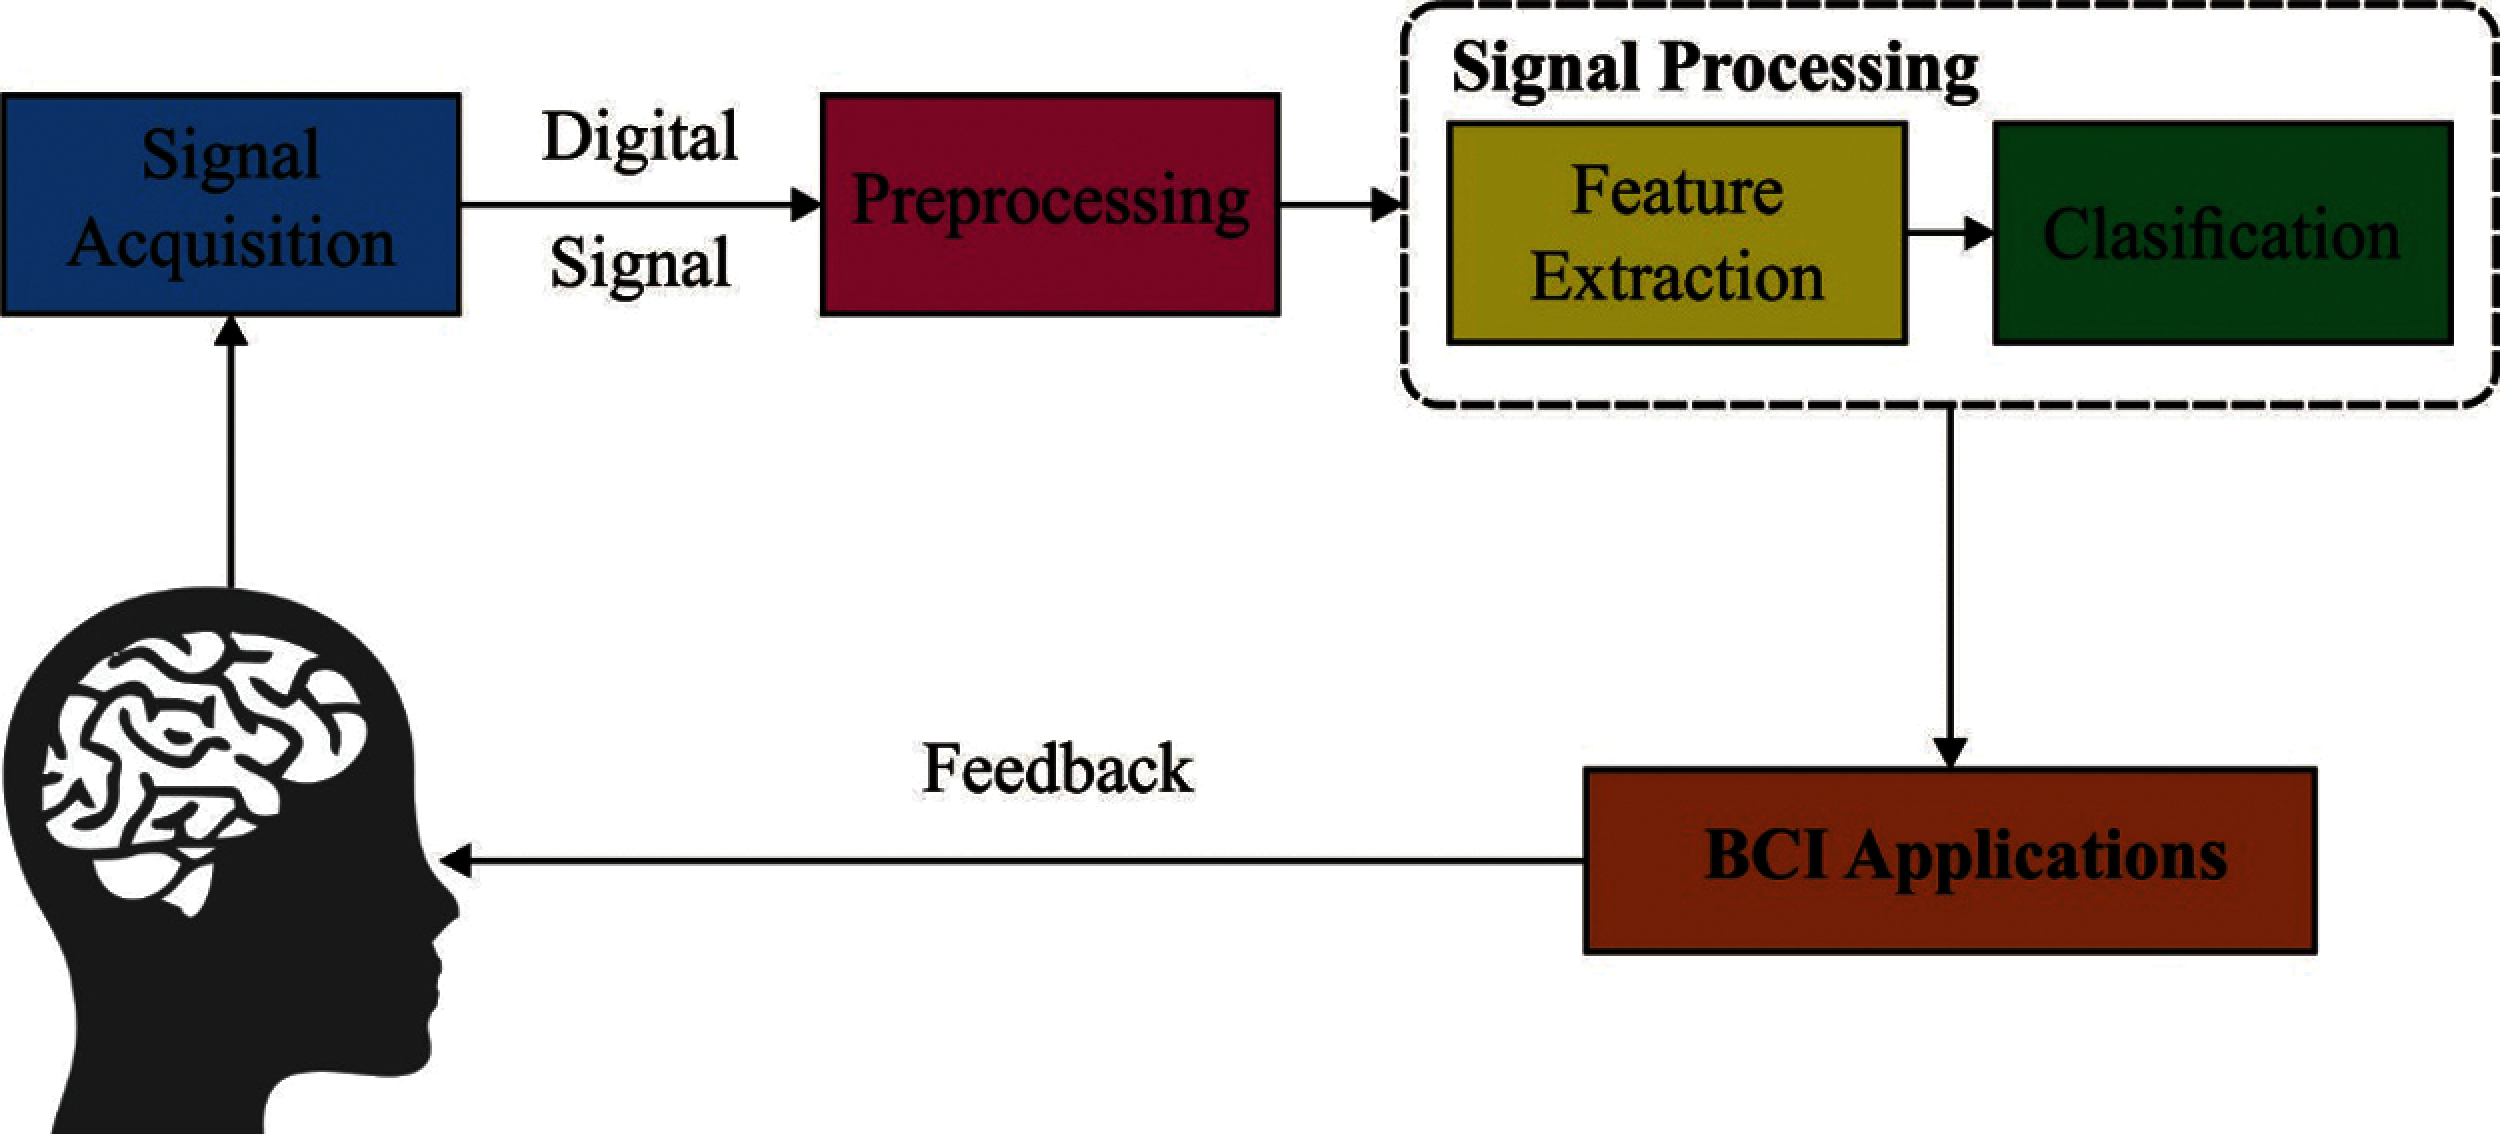
Figure 1: Block diagram of BCI systems
EEG tools are extensively applied in recording brain signals from BCI system, since it is non-invasive in nature, produces high-time resolution, significant mobility from user's perspective and comparatively cost-effective [5]. In spite of the fact that BCI system can be implemented to use EEG signal in broad range to control, the Motor Imagery (MI) BCI, in which the users visualize motions arising in their limbs to control the system, is subjected to wide study. This sort of huge attention is due to its huge significance in few applications like gaming, neurorehabilitation, and neuroprosthetics. In these fields, a user's thought process is decoded as a visualized motion which is an invaluable output [6]. EEG signal is generally utilized in BCI system, thanks to its higher-time resolution, comparatively easy to adopt and cost efficient functioning to acquire the brain signals than other approaches like magnetoencephalography (MEG) and Functional Magnetic Resonance Imaging (fMRI). They possess high mobility compared to fMRI/MEG techniques [7]. However, EEG signals are non-stationary in nature and poses processing problems since they tend to suffer from external noise and are inclined towards signal objects. Additionally, EEG signals are caused by mood and posture of a subject. When a person is in standing position, then he/she is inclined to develop the concentration and EEG quality at the time of recording. Further, high frequency content would remain robust, if the user remains in standing posture, as opposed to horizontal. It has been noted in the literature [8] that posture modifications can be utilized in increasing the interest of subjects who feel exhausted. EEG-based BCI has two categories such as spontaneous & evoked though few studies refer these categories as endogenous and exogenous, correspondingly. In evoked system, it is essential to have external stimulations like sensory, visual, or auditory stimulation. Stimulation evokes a response in brain which is later recognized using BCI scheme to determine the willpower of the user. In spontaneous BCI, no external stimulations are needed, and control action is taken according to the activity created from mental activity.
BCI system works in two stages such as offline training stage, in which the scheme is regulated and operation online stage in which the scheme identifies the brain activity patterns and translates it as commands for a computer [9]. Usually, EEG signal is pre-processed by several spectral & spatial filters while the features are removed in these signals to represent them in a dense form. At last, EEG feature is categorized beforehand to convert it as a command for an application, and beforehand feedback is given to users so as to update them whether a certain mental command is identified or not [10]. Though more efforts are taken nowadays to achieve regulation-free modes of function, an offline regulation is now utilized and is needed in all the BCIs so as to achieve a consistent scheme. This trained dataset has EEG signals recorded in it, when a client executes every mental task for attention many times, based on the provided commands.
The current research article presents an Intelligent Optimal Fuzzy Support Vector Machine based EEC Recognition Model (IOFSVM-EEG) for BCI system. The proposed IOFSVM-EEG model involves Independent Component Analysis (ICA) technique to remove the artefacts that exist in EEG signal and retain the meaning EEG information. In addition, Common Spatial Pattern (CSP)-based feature extractor is applied to the preprocessed EEG signals. Furthermore, OFSVM model is utilized in the classification of EEG signals, during when the parameters involved in FSVM are optimally tuned with the help of Grasshopper Optimization Algorithm (GOA). GOA is applied to optimally adjust the parameters involved in FSVM model. This scenario helps in considerably increasing the outcomes of EEG recognition. To examine the improved EEG recognition performance of IOFSVM-EEG model, a comprehensive experimental analysis was conducted on benchmark dataset and the outcomes were inspected under distinct measures. In short, the paper contribution is given as follows.
• Design a new IOFSVM-EEG technique to detect EEG signals on BCI system
• Propose an ICA technique for artefact removal and thereby retains useful details
• Derive a CSP based feature extractor and OFSVM based classifier to detect and classify EEG signals
• Design a GOA for the parameter tuning of the FSVM technique and thereby enhances the classifier outcome
• Validate the performance on the benchmark EEG dataset and investigate the results interms of different measures
The rest of the paper is organized as follows. Section 2 offers the literature review, Section 3 elaborates the proposed method, Section 4 discusses the result analysis, and Section 5 draws the conclusion.
In the classification of EEG BCI, a lot of areas of interest exist while the general classifier includes Linear Discriminate Analyses (LDA) that depends on statistical rules, SVM that depends on structural risk minimization, and Relevance Vector Machine (RVM) depending on sparse Bayesian probability module. With the help of probabilistic implication, Jin et al. [11] presented a sparse Bayesian ELM-based Method (SBELM) to improve the efficiency of MI classification. Zhang et al. [12] presented SBE technique using Laplace priors, for instance SB Laplace, for EEG classification. The whole set of essential module variables were manually calculated from the trained data without any need to perform cross validation. In ML module, RVM is featured with strong generalization capability and the parameters such as sparsity and any limits on Mercer proposal are automatically determined [13] from kernel functions’ selective.
Zhang et al. [14] proposed a Multi Kernel ELM (MKELM)-based technique for the classification of EED motor images. The kernel extensions of ELM offer a sophisticated method to circumvent the estimation of hidden layer output and encode it integrally in a kernel matrix itself. Dong et al. [15] proposed a new hybrid kernel function RVM which performs efficient classification at global and local feature levels. Multi task motor imagery EEG classifications are regarded as authenticated for the presented technique.
Gaur et al. [16] presented a technique to reduce the channel amount by achieving a decline in computation complexity, while at the same time, the adequate level of accuracy is maintained uncompromised. This is achieved with the help of automated subject-specific channel selective technique made by Pearson correlation coefficient. Zheng et al. [17] conducted a study to detect efficient EEG channels and features for emotion detection. Initially, the discriminative features of EEG signals in distinct dimensions were removed to classify the emotions. Next, relief method and floating-generalized sequential backward selective methods were integrated together to form a new channel selection technique. Later, SVM was utilized in this study to classify the emotions and verify the efficiency of channel selective technique and the extracted features.
3 The Proposed EEG Recognition Model for BCI System
The overall working principle involved in the proposed IOFSVM-EEG technique is depicted in Fig. 2. According to the figure, IOFSVM-EEG model comprises of four major processes namely, ICA-based pre-processing, CSP-based feature extraction, FSVM-based classification, and GOA-based parameter tuning. The detailed working processes of these modules are discussed in the following subsections.
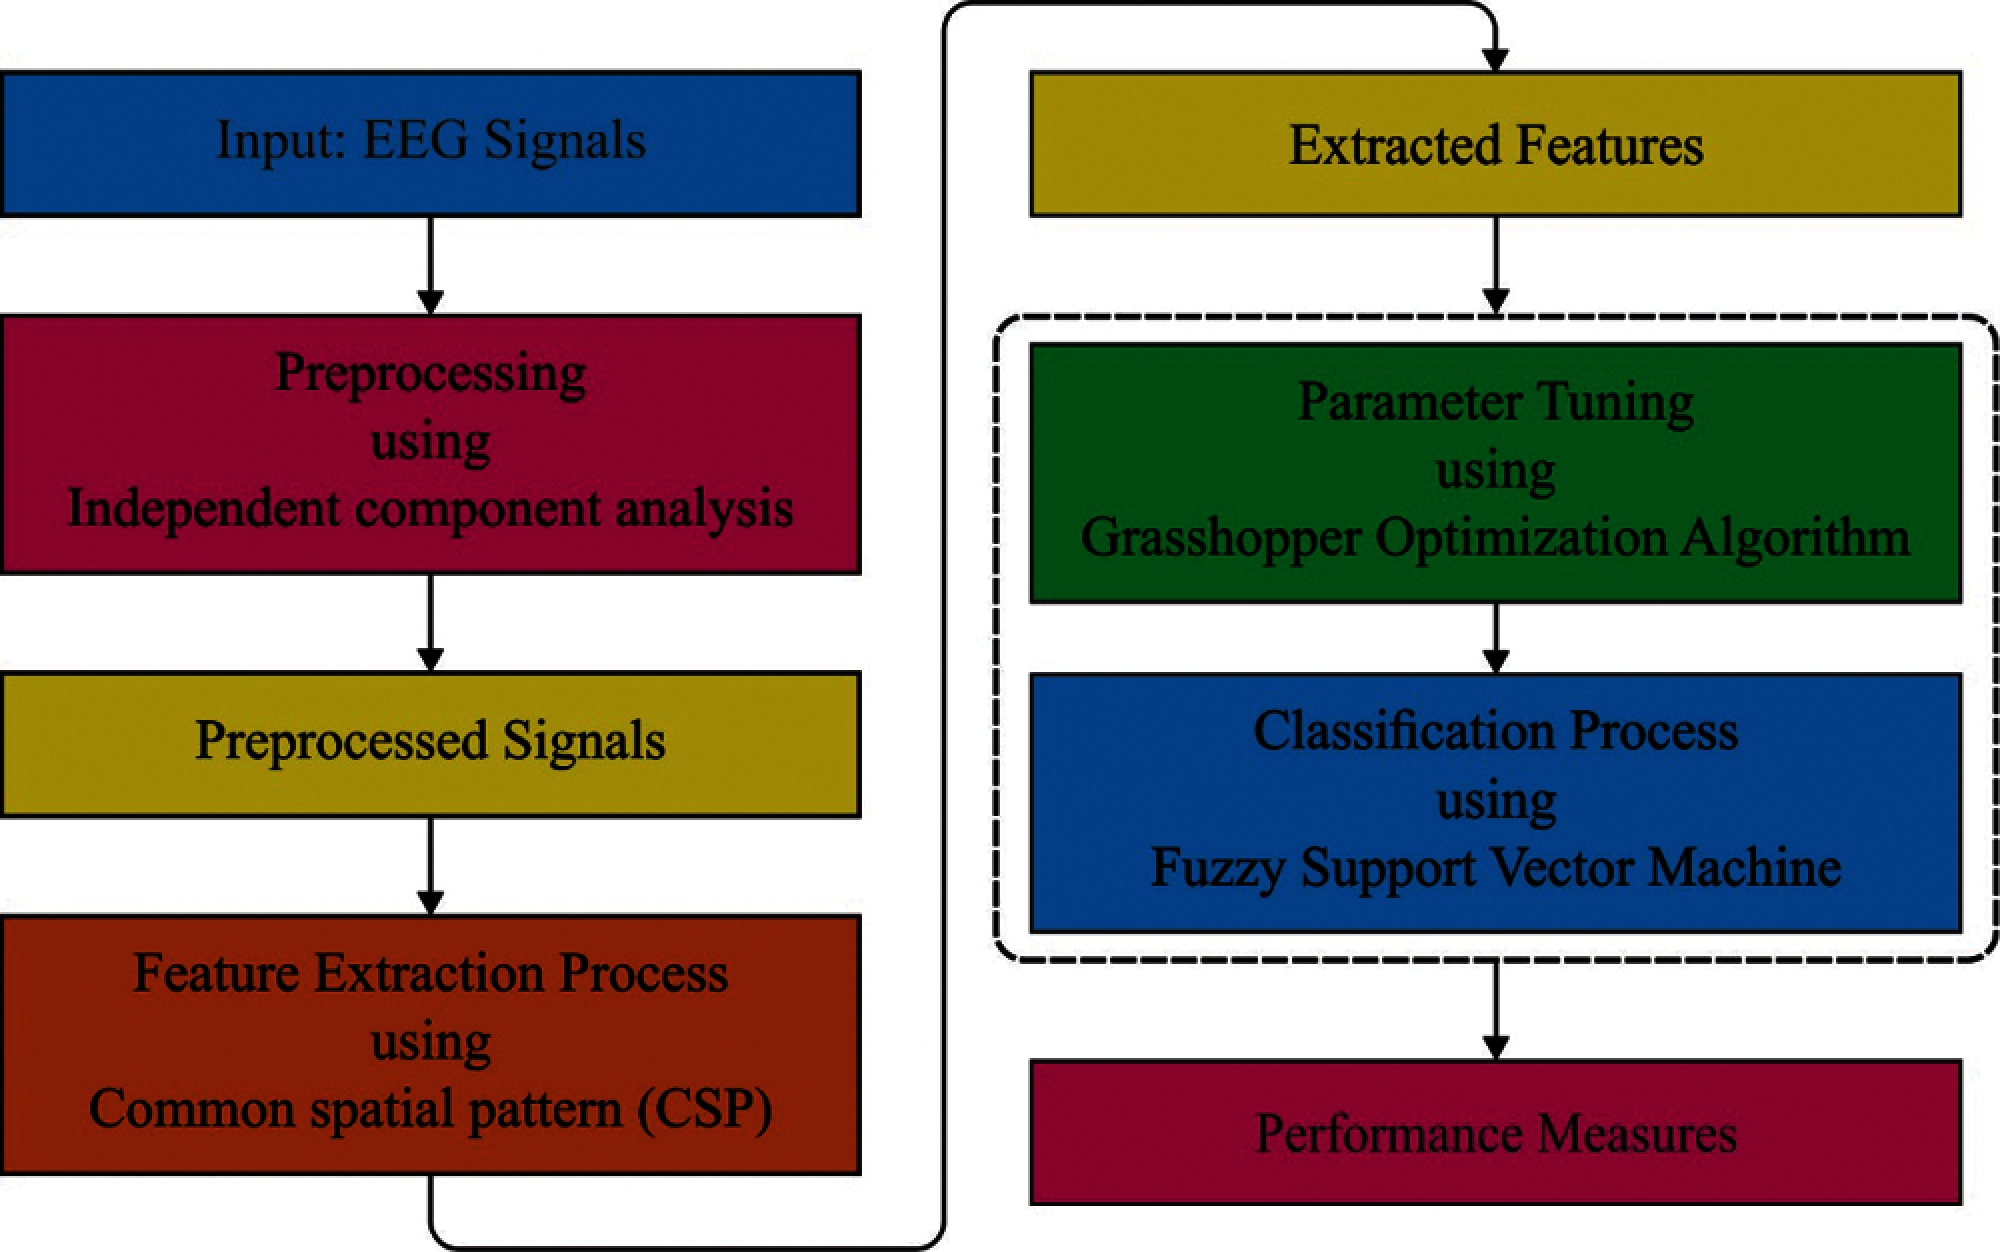
Figure 2: The overall working process of IOFSVM-EEG model
Both artefact and noises from EEG signals are removed by ICA which further retains the helpful EEG data. The original EEG signal has EOG signals whereas the artefacts that are appropriate to EOG, present in EEG channel, are eliminated as ICA. In original EEG signals
where
EEG signal, after the de-mixing of ICA, and the removal of EOG artefacts and noise signal, further increases the accuracy in terms of explaining the electrophysiological actions of altered brain regions. For instance, the 7th independence module of topographic map from forehead place is evidently experiential based on the attendance of EOG artefacts.
CSP is a feature extraction technique that utilizes the spatial filters to project signals in space. This is performed so as to maximize the difference of change features which is generally utilized from motor imagery EEG signal procedure [19]. By generating a group of spatial filter matrices, CSP analyzes scheme 2 class of the signals in planes. In this method, one class of alteration of signal is maximized whereas the difference of another class of signals is minimized. So, different features (CSP feature) improve the variances between two classes of the signal. CSP feature vector is assumed to be an input for classifiers that can achieve superior classification accuracy. In order to have two classes of EEG signals,
The mean of covariance
where
During transformation of the average covariance matrix, one attains the following notion.
The estimate matrix W is as follows
By the estimate matrix W, the original EEG is changed to uncorrelated modules.
where Z is obvious that it is a EEG source module containing general and particular information of distinct tasks. The feature of k-th row from estimate matrix Z is computed as
where
3.3 FSVM-Based EEG Classification
After the extraction of features from EEG signals, they are fed as input in FSVM classifier to determine and allocate proper class labels onto it. In order to perform the classification, a dataset is considered as given herewith
with ω being the parametric matrix,
Though the researchers considered the high-dimension feature space as
where
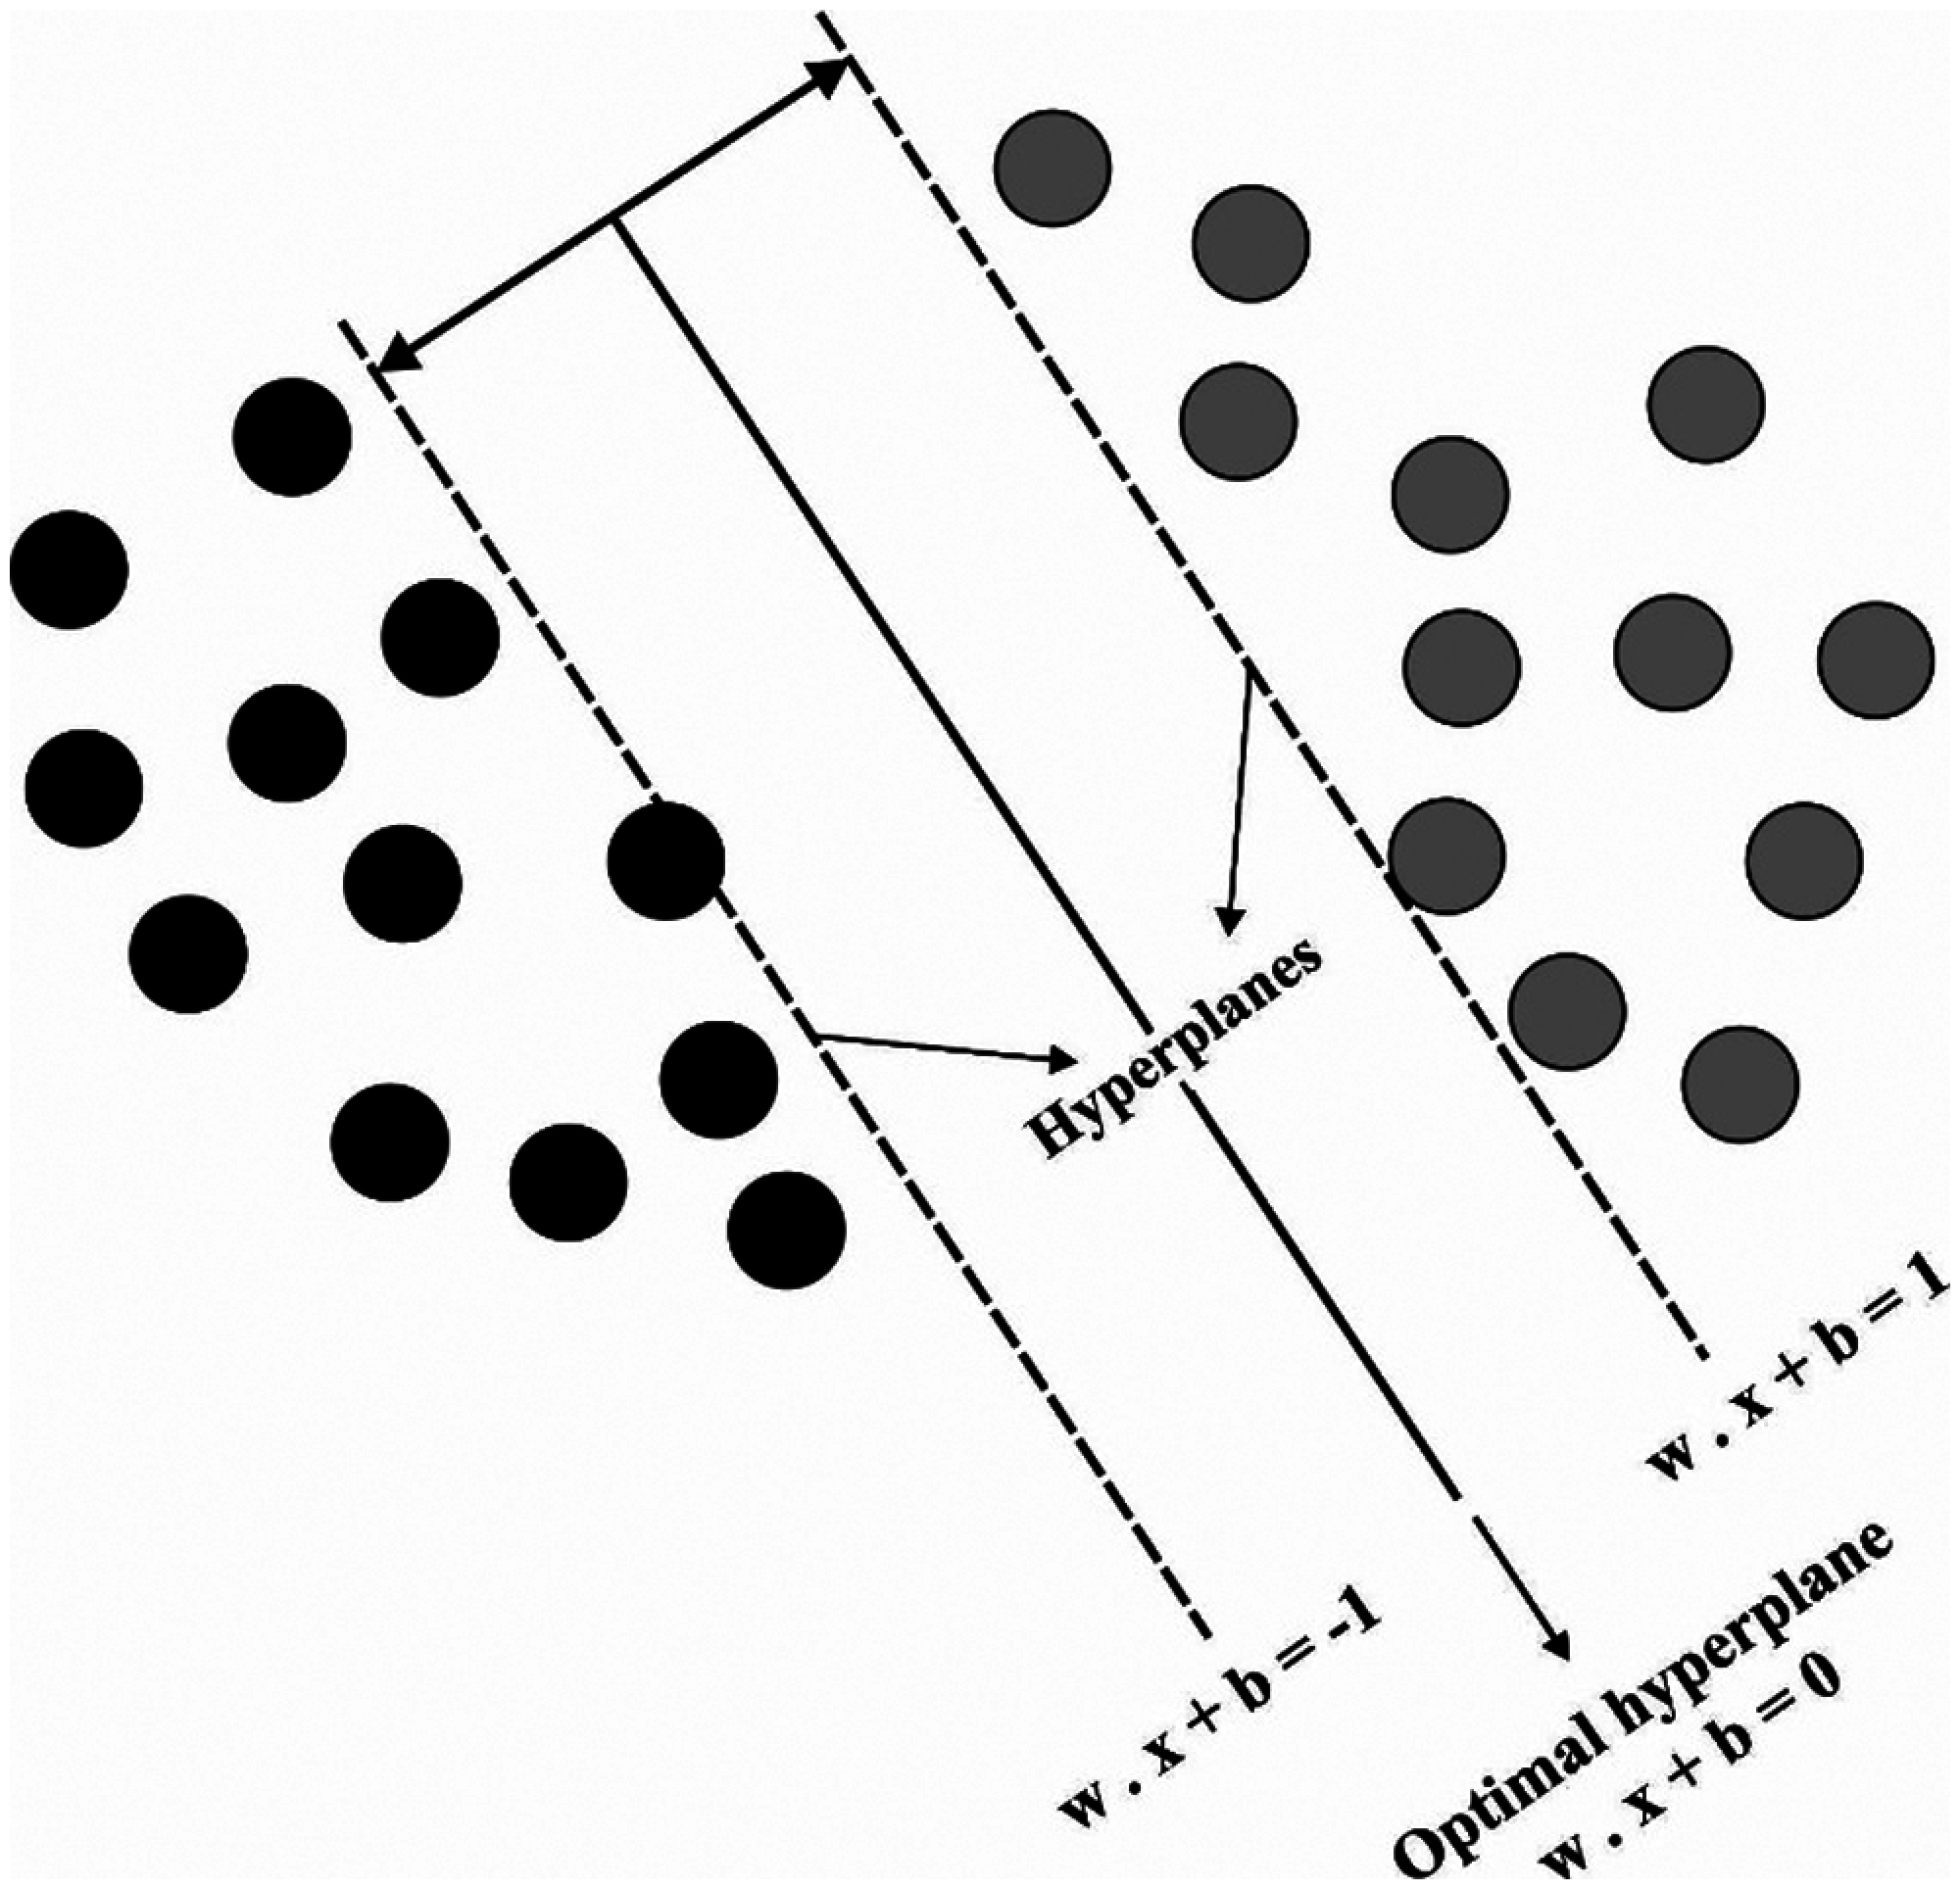
Figure 3: Hyperplanes of SVM
Further, C implies the regularization parameter from FSVM. Afterwards, the misclassification cost-to-data point
Here,
By resolving Karush-Kuhn-Tucker (KTT) state in comparison with (16), the separation hyperplanes are written as follows
At last, the decision function of FSVM method is demonstrated as follows
In fuzzy membership function, the misclassification cost
To reduce the outcomes of among-class imbalance.
To differentiate within-class significance of altered training data points.
Assume
The output value of functions
At the end, GOA is applied to appropriately tune the parameters involved in FSVM model. This is performed so that the outcomes of EEG recognition get significantly increased [21, 22]. GOA is a newly-presented metaheuristic technique that depends on the swarming behavior of every creature. While grasshoppers are herbivores, they can severely damage the crops. In a swarm of grasshoppers, both nymphs and adults are present. While the former rolls on the ground, consumes succulents and soft plants. The latter i.e., adult grasshopper jumps high on the search for feeder. Thus, it has huge area for exploration. Thus the outcomes i.e., both movement types, are monitored as follows; slow and abrupt progress of huge range that signifies exploration and exploitation. The swarming performance of grasshopper is mathematically modeled as follows:
where
where
where f implies the intensity of attraction and l denotes the attractive length scale. When searching for food, grasshoppers make three kinds of regions with respect to human interface such as attraction, repulsion, and comfort zone [23]. If grasshoppers are distantly placed, the function “s” is not capable to implement strong forces. In order to solve this, the G module in (20) is provided as follows
where g refers to gravitational constant and
where u refers to constant drift and
where
where
where
The current section validates the performance of the proposed IOFSVM-EEG model on two public EEG datasets. The former one is available in the form of BCI Competition III dataset IVa. EEG data is gathered at a sampling rate of 100 Hz from 118 electrodes for five subjects (named “aa”, “al”, “av”, “aw”, and “ay”) at the imagination of right hand or foot movement. The next dataset i.e., BCI Competition IV dataset IIb is gathered from 9 subjects at 3 electrodes C3, Cz, and C4 with a sampling rate of 250 Hz, during right hand and left hand MI tasks.
Tab. 1 provides the brief results of the comparative analysis of IOFSVM-EEG model against existing techniques on the applied BCI Competitive III dataset IVa.

Fig. 4 depicts the results achieved from accuracy analysis of the presented IOFSVM-EEG model against existing techniques under different subjects. The figure demonstrates that the presented IOFSVM-EEG model achieved maximum performance over other methods under all the applied subjects. For the applied ‘aa’ subject, the proposed IOFSVM-EEG model offered a maximum accuracy of 0.92, whereas MLP, SVM, GKSVM, GKELM, PKELM, and MKELM models obtained least accuracy values such as 0.81, 0.81, 0.82, 0.83, 0.83, and 0.83 respectively. Likewise, for the applied ‘al’ subject, the presented IOFSVM-EEG model accomplished a superior accuracy of 0.99, whereas MLP, SVM, GKSVM, GKELM, PKELM, and MKELM techniques accomplished minimal accuracy values such as 0.98, 0.98, 0.98, 0.98, 0.98, and 0.99 respectively. Similarly, for the applied ‘av’ subject, the projected IOFSVM-EEG approach offered a maximum accuracy of 0.78, whereas MLP, SVM, GKSVM, GKELM, PKELM, and MKELM techniques obtained the least accuracy values being 0.69, 0.69, 0.70, 0.70, 0.70, and 0.71 correspondingly. Eventually, for the applied ‘aw’ subject, the proposed IOFSVM-EEG manner attained a high accuracy of 0.94. In such scenario, MLP, SVM, GKSVM, GKELM, PKELM, and MKELM models obtained least accuracy values as follows; 0.89, 0.90, 0.90, 0.91, 0.91, and 0.91 respectively. Meanwhile, for the applied ‘ay’ subject, the proposed IOFSVM-EEG method offered a maximum accuracy of 0.96, whereas MLP, SVM, GKSVM, GKELM, PKELM, and MKELM methodologies achieved minimal accuracy values such as 0.92, 0.92, 0.92, 0.93, 0.93, and 0.93 correspondingly.
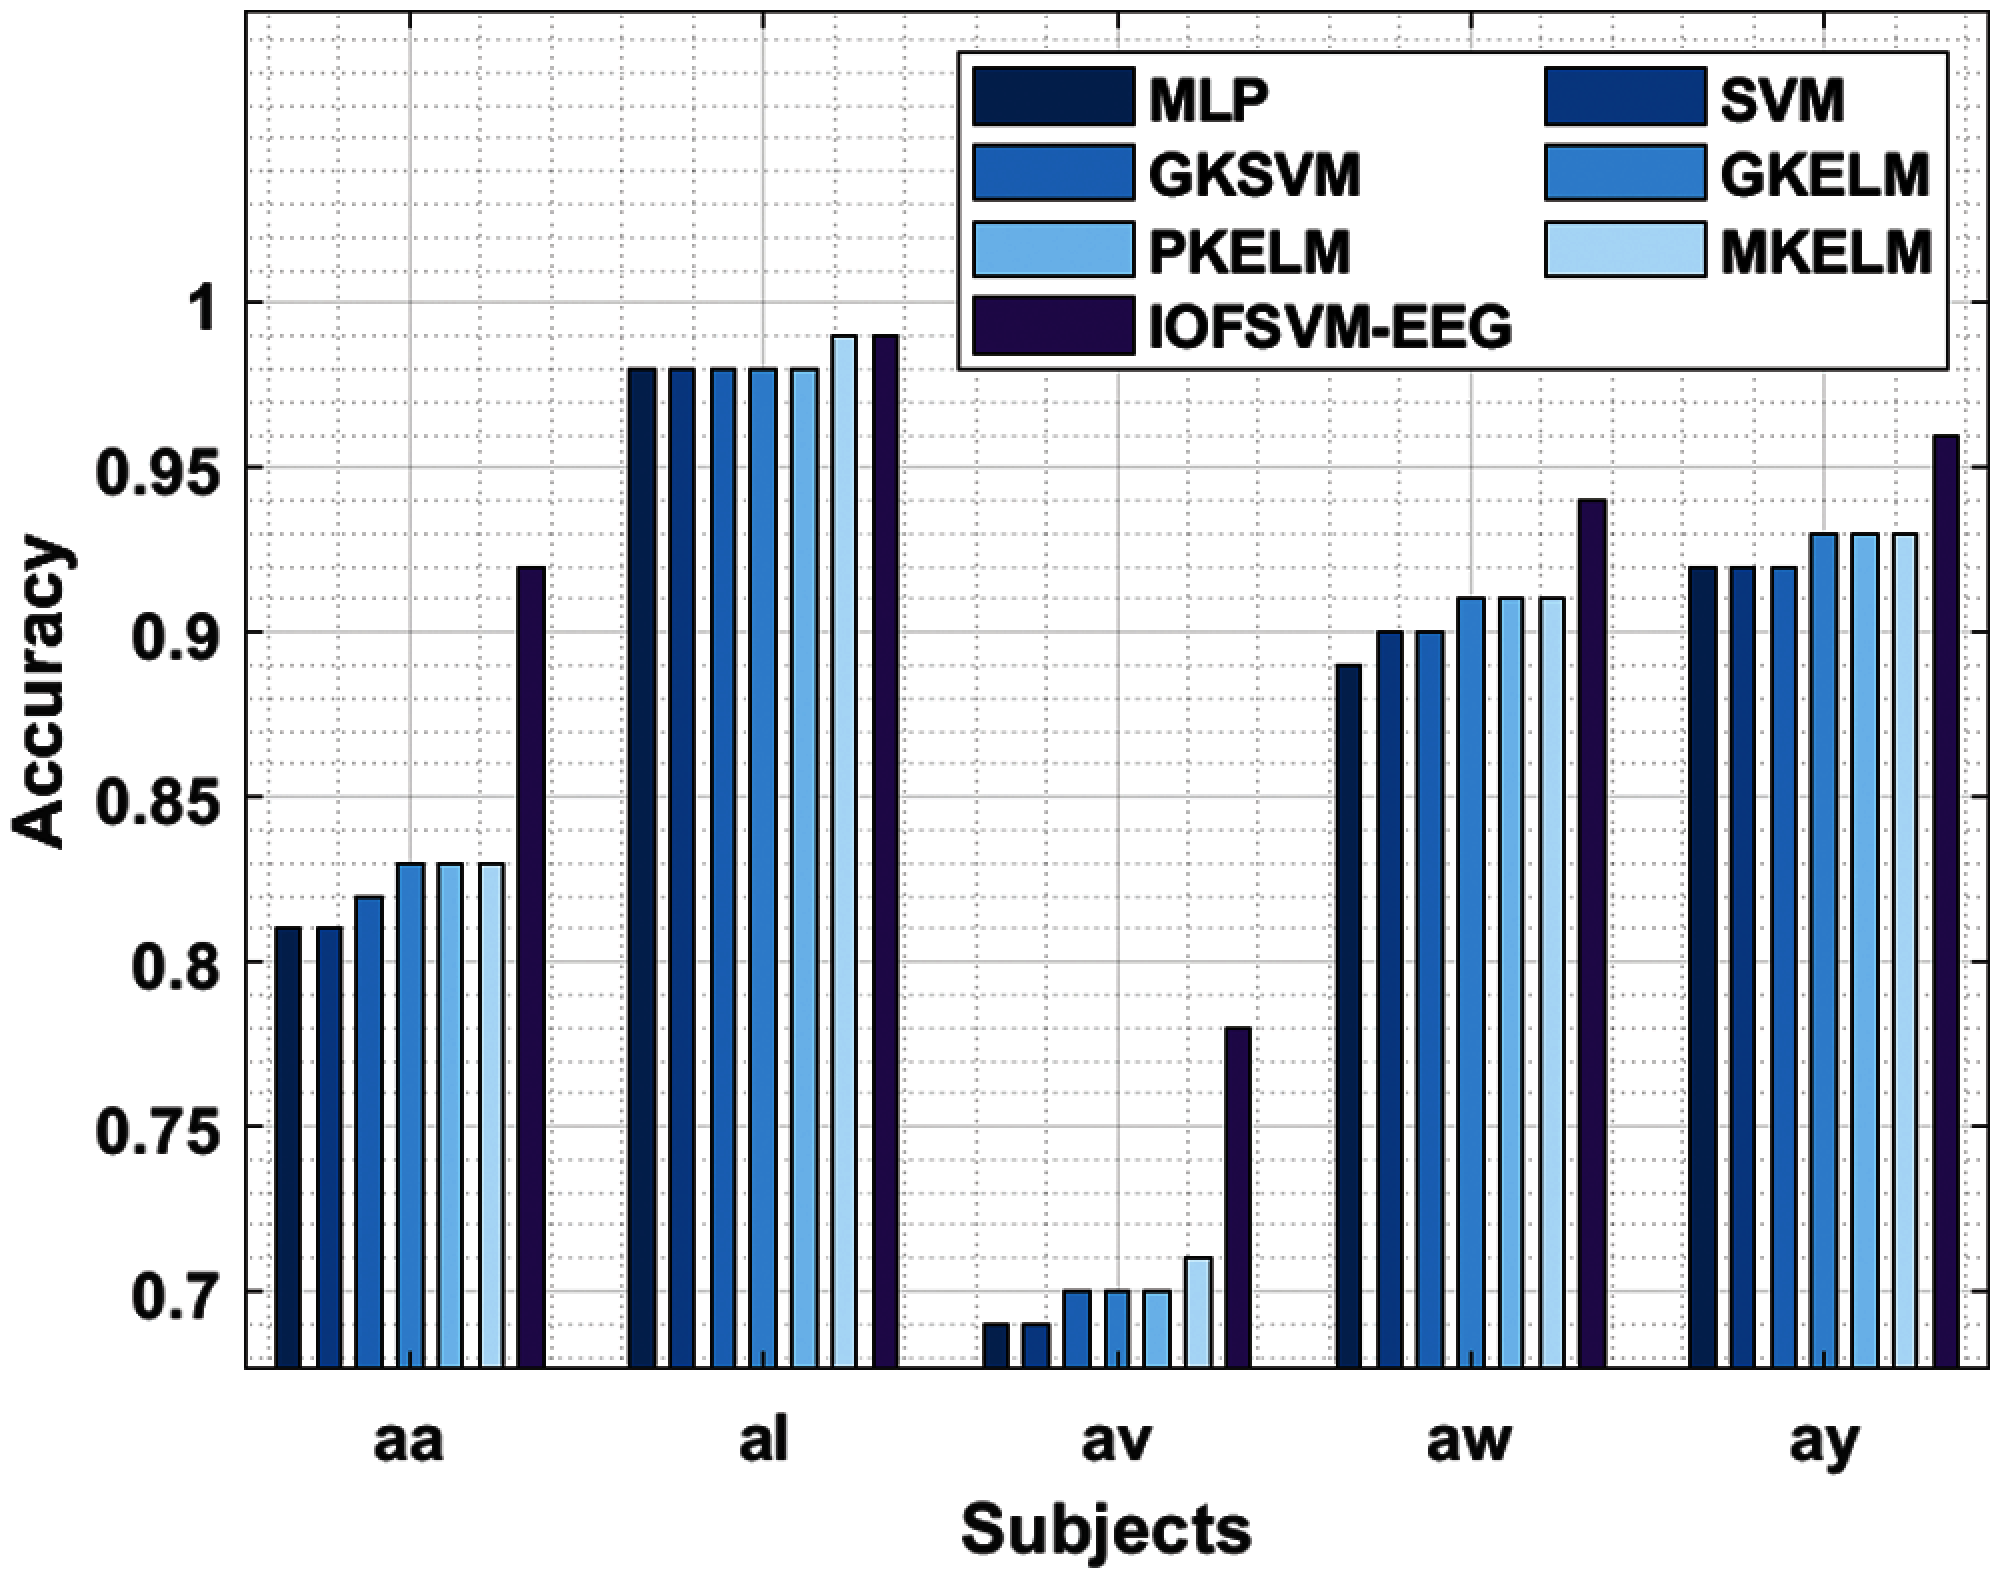
Figure 4: Accuracy analysis of IOFSVM-EEG model on BCI competition III dataset IVa
Fig. 5 shows the results of performance analysis attained by IOFSVM-EEG model and existing techniques in terms of average accuracy. The experimental results inferred that the presented IOFSVM-EEG model achieved maximum average accuracy of 0.918 i.e., a superior performance in comparison with other techniques such as MLP, SVM, GKSVM, GKELM, PKELM, and MKELM models which obtained the least average accuracy values being 0.858, 0.860, 0.864, 0.870,0.870, and 0.874 respectively.
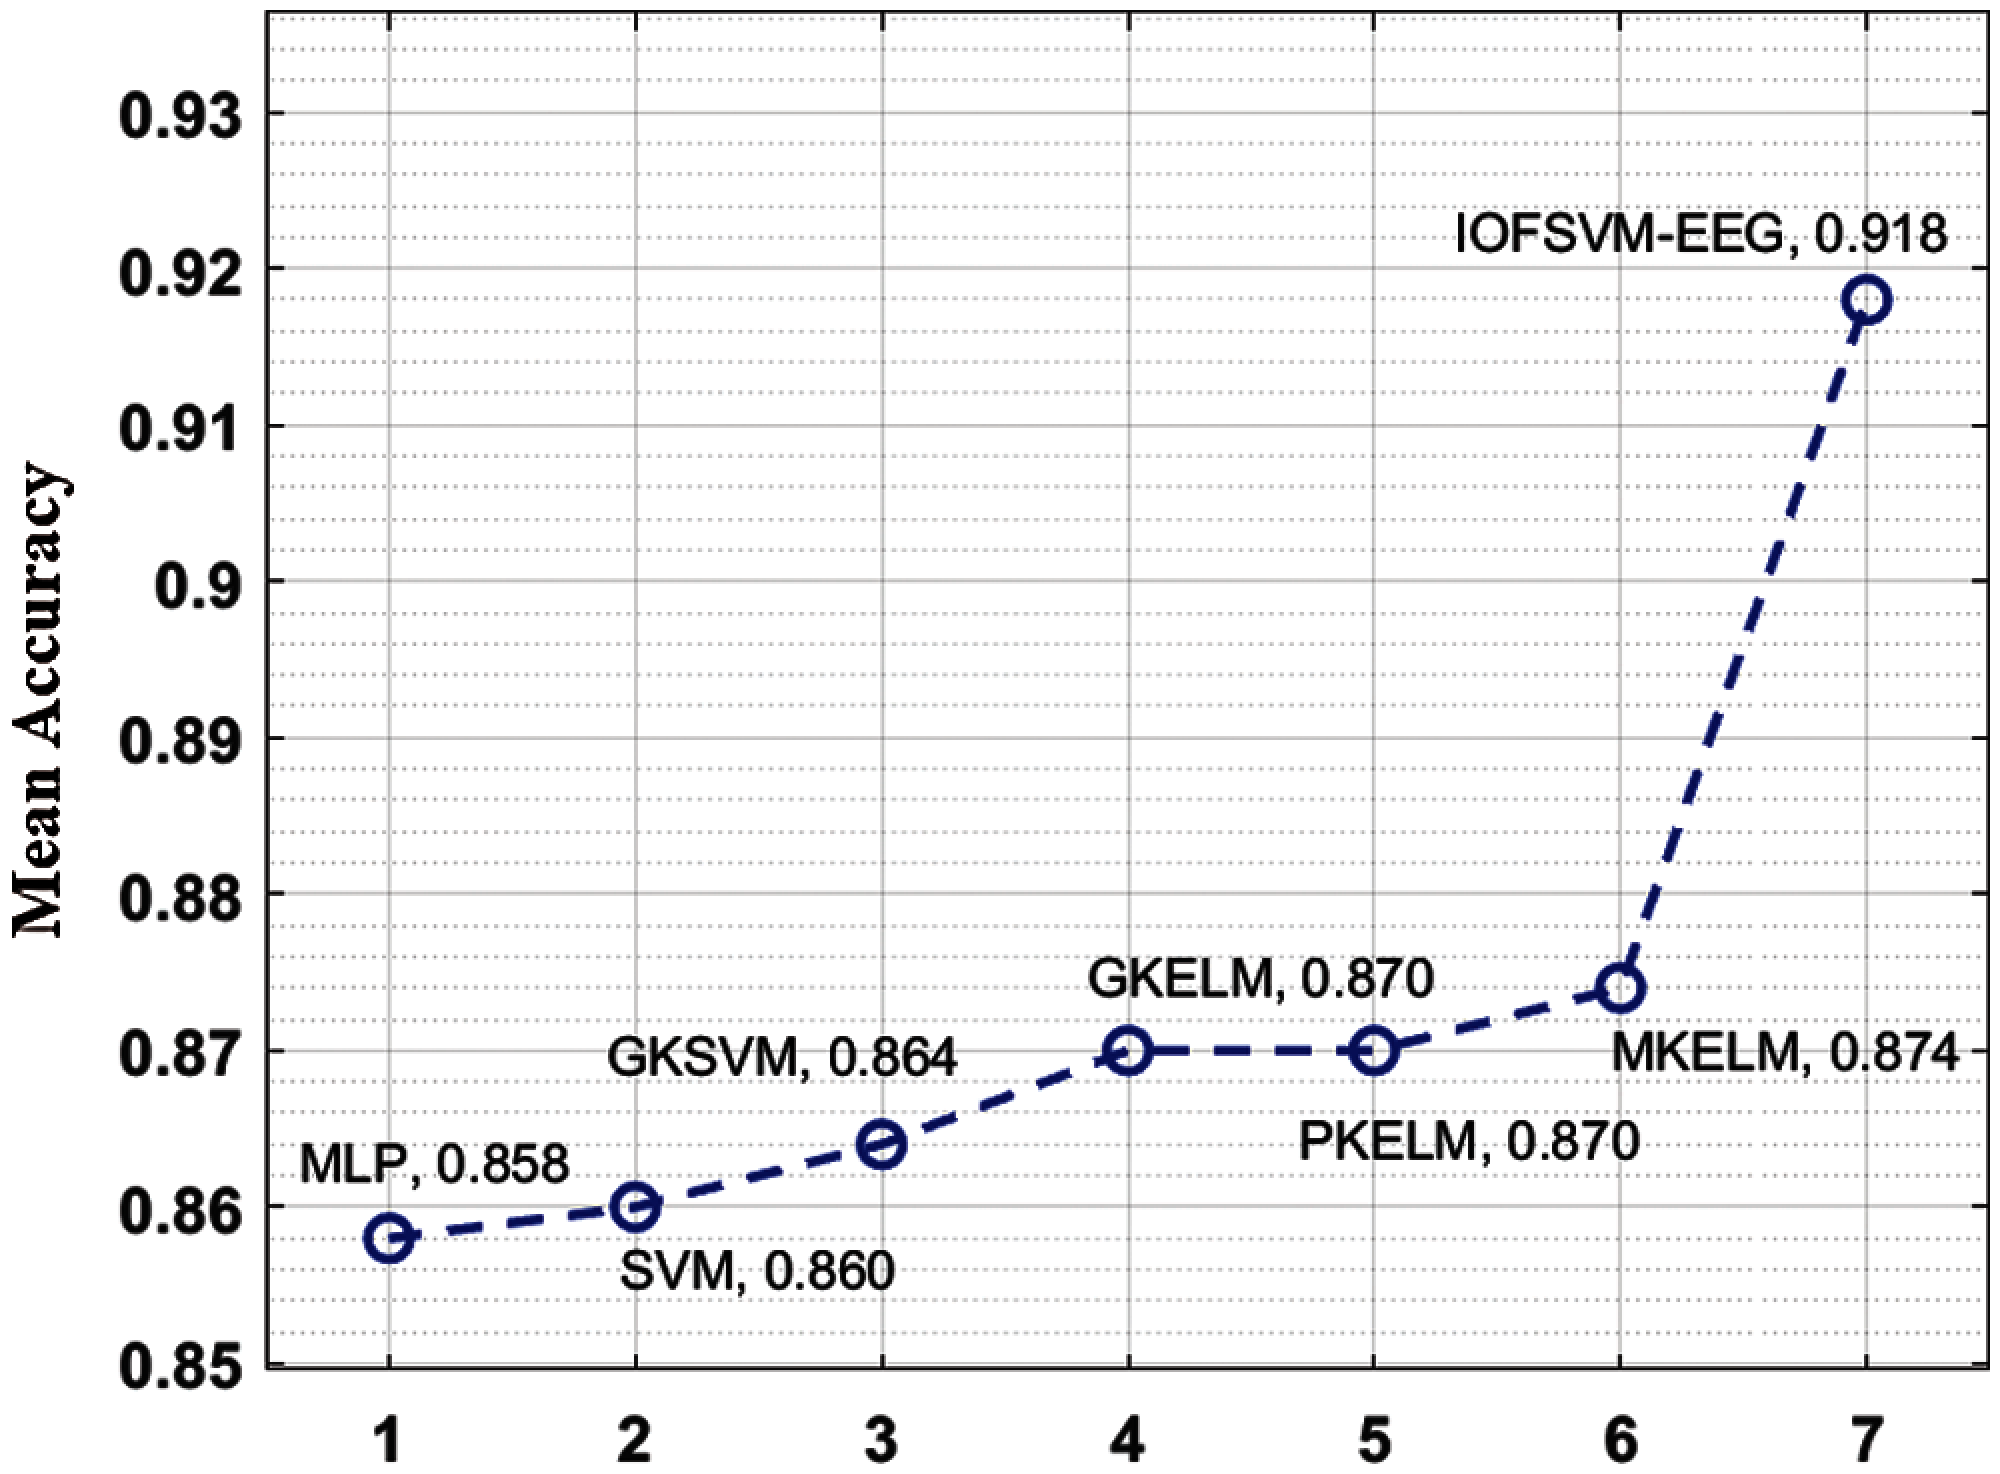
Figure 5: Mean accuracy analysis of IOFSVM-EEG model on BCI competition III dataset IVa
Tab. 2 shows the results of a detailed comparison of IOFSVM-EEG manner with other recent approaches on the applied BCI Competitive IV dataset IIb.
Fig. 6 shows the results of accuracy analysis attained by IOFSVM-EEG method and other existing methods under distinct subjects. According to the figure, the proposed IOFSVM-EEG method outperformed other methods by achieving maximum performance under all the applied subjects. For instance, when applying ‘80103T’ subject, the projected IOFSVM-EEG model offered the maximum accuracy of 0.81, whereas MLP, SVM, GKSVM, GKELM, PKELM, and MKELM techniques obtained least accuracy values such as 0.76, 0.77, 0.76, 0.77, 0.77, and 0.78 respectively. At the same time, when applying ‘80303T’ subject, the proposed IOFSVM-EEG model offered the maximum accuracy of 0.68, whereas MLP, SVM, GKSVM, GKELM, PKELM, and MKELM algorithms accomplished the least accuracy values such as 0.50, 0.52, 0.52, 0.53, 0.54, and 0.54 correspondingly. Also, when applying ‘80503T’ subject, the presented IOFSVM-EEG model offered a superior accuracy of 0.87, whereas MLP, SVM, GKSVM, GKELM, PKELM, and MKELM techniques obtained low accuracy values such as 0.83, 0.83, 0.84, 0.84, 0.84, and 0.85 respectively. Along with that, for the applied ‘80703T’ subject, the proposed IOFSVM-EEG model produced high accuracy of 0.91, whereas MLP, SVM, GKSVM, GKELM, PKELM, and MKELM models obtained the least accuracy values such as 0.83, 0.83, 0.84, 0.84, 0.86, and 0.87 correspondingly. In the meantime, when applying ‘80903T’ subject, the proposed IOFSVM-EEG method achieved high accuracy of 0.89, whereas the MLP, SVM, GKSVM, GKELM, PKELM, and MKELM techniques accomplished less accuracy values such as 0.82, 0.82, 0.82, 0.83, 0.83, and 0.84 respectively.
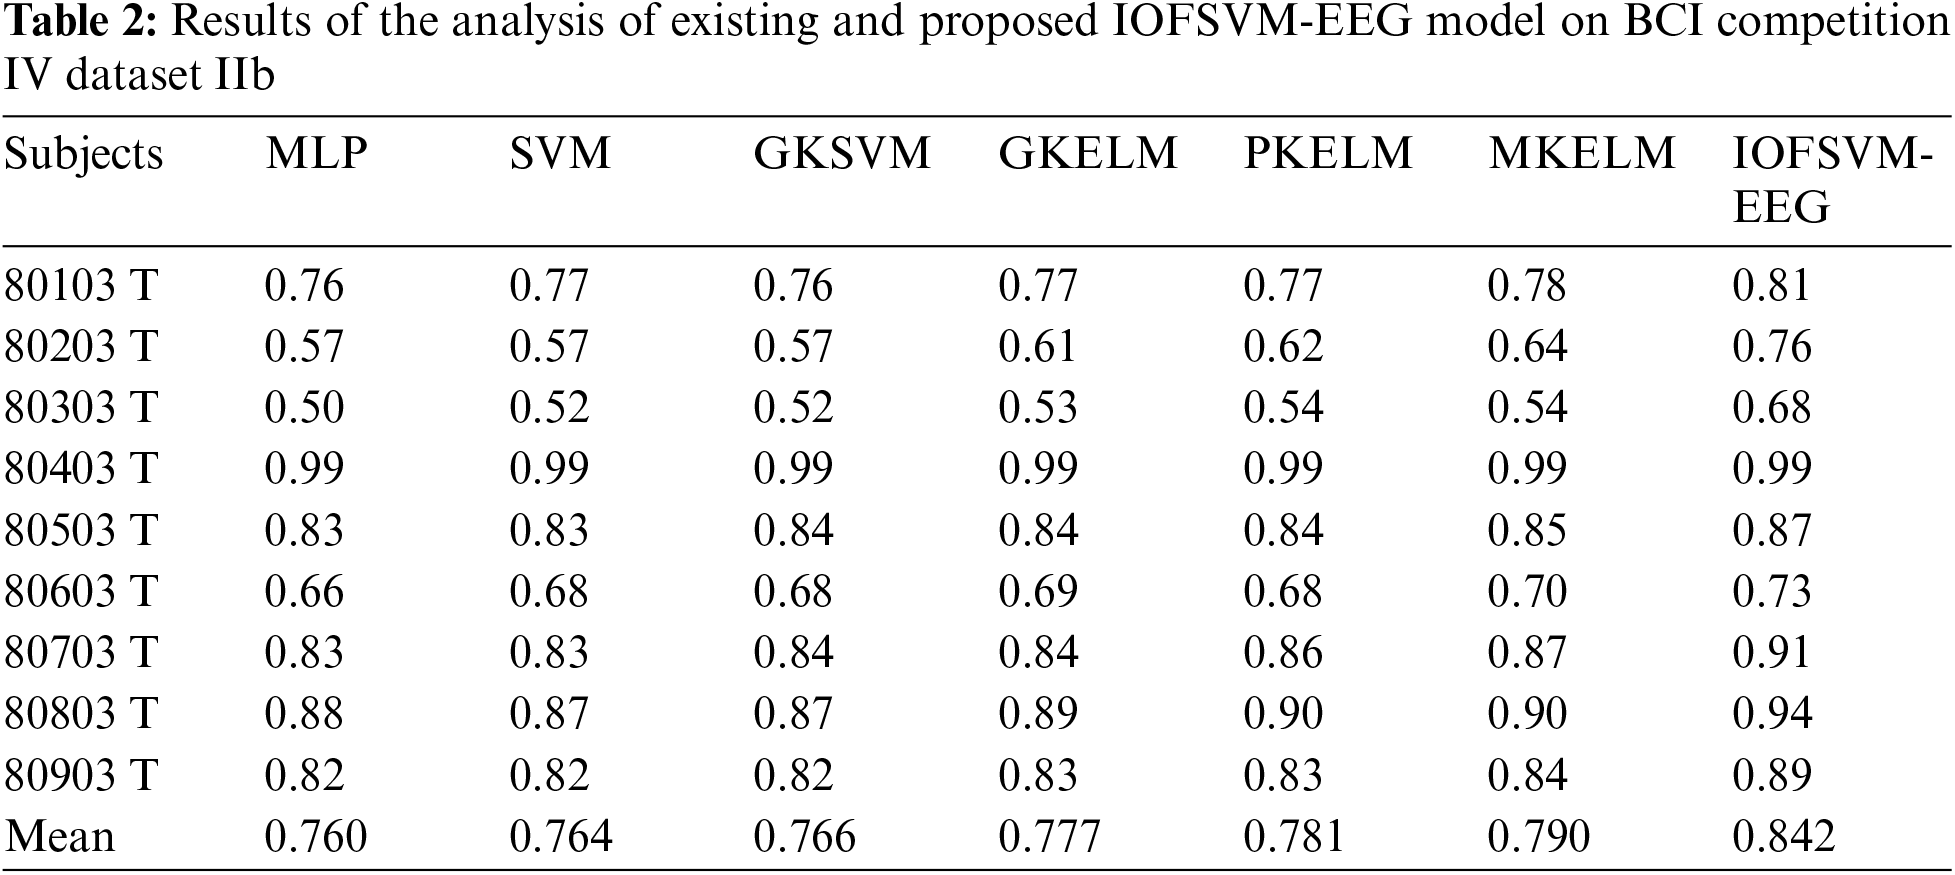

Figure 6: Accuracy analysis of IOFSVM-EEG model on BCI competition IV dataset IIb
Fig. 7 shows the performance analysis results of IOFSVM-EEG method and other existing approaches with respect to average accuracy. The experimental outcomes inferred that IOFSVM-EEG model outperformed other models with a superior performance i.e., maximum average accuracy of 0.842. However, other models such as MLP, SVM, GKSVM, GKELM, PKELM, and MKELM methodologies achieved minimal average accuracy values being 0.760, 0.764, 0.766, 0.777, 0.781, and 0.790 correspondingly.
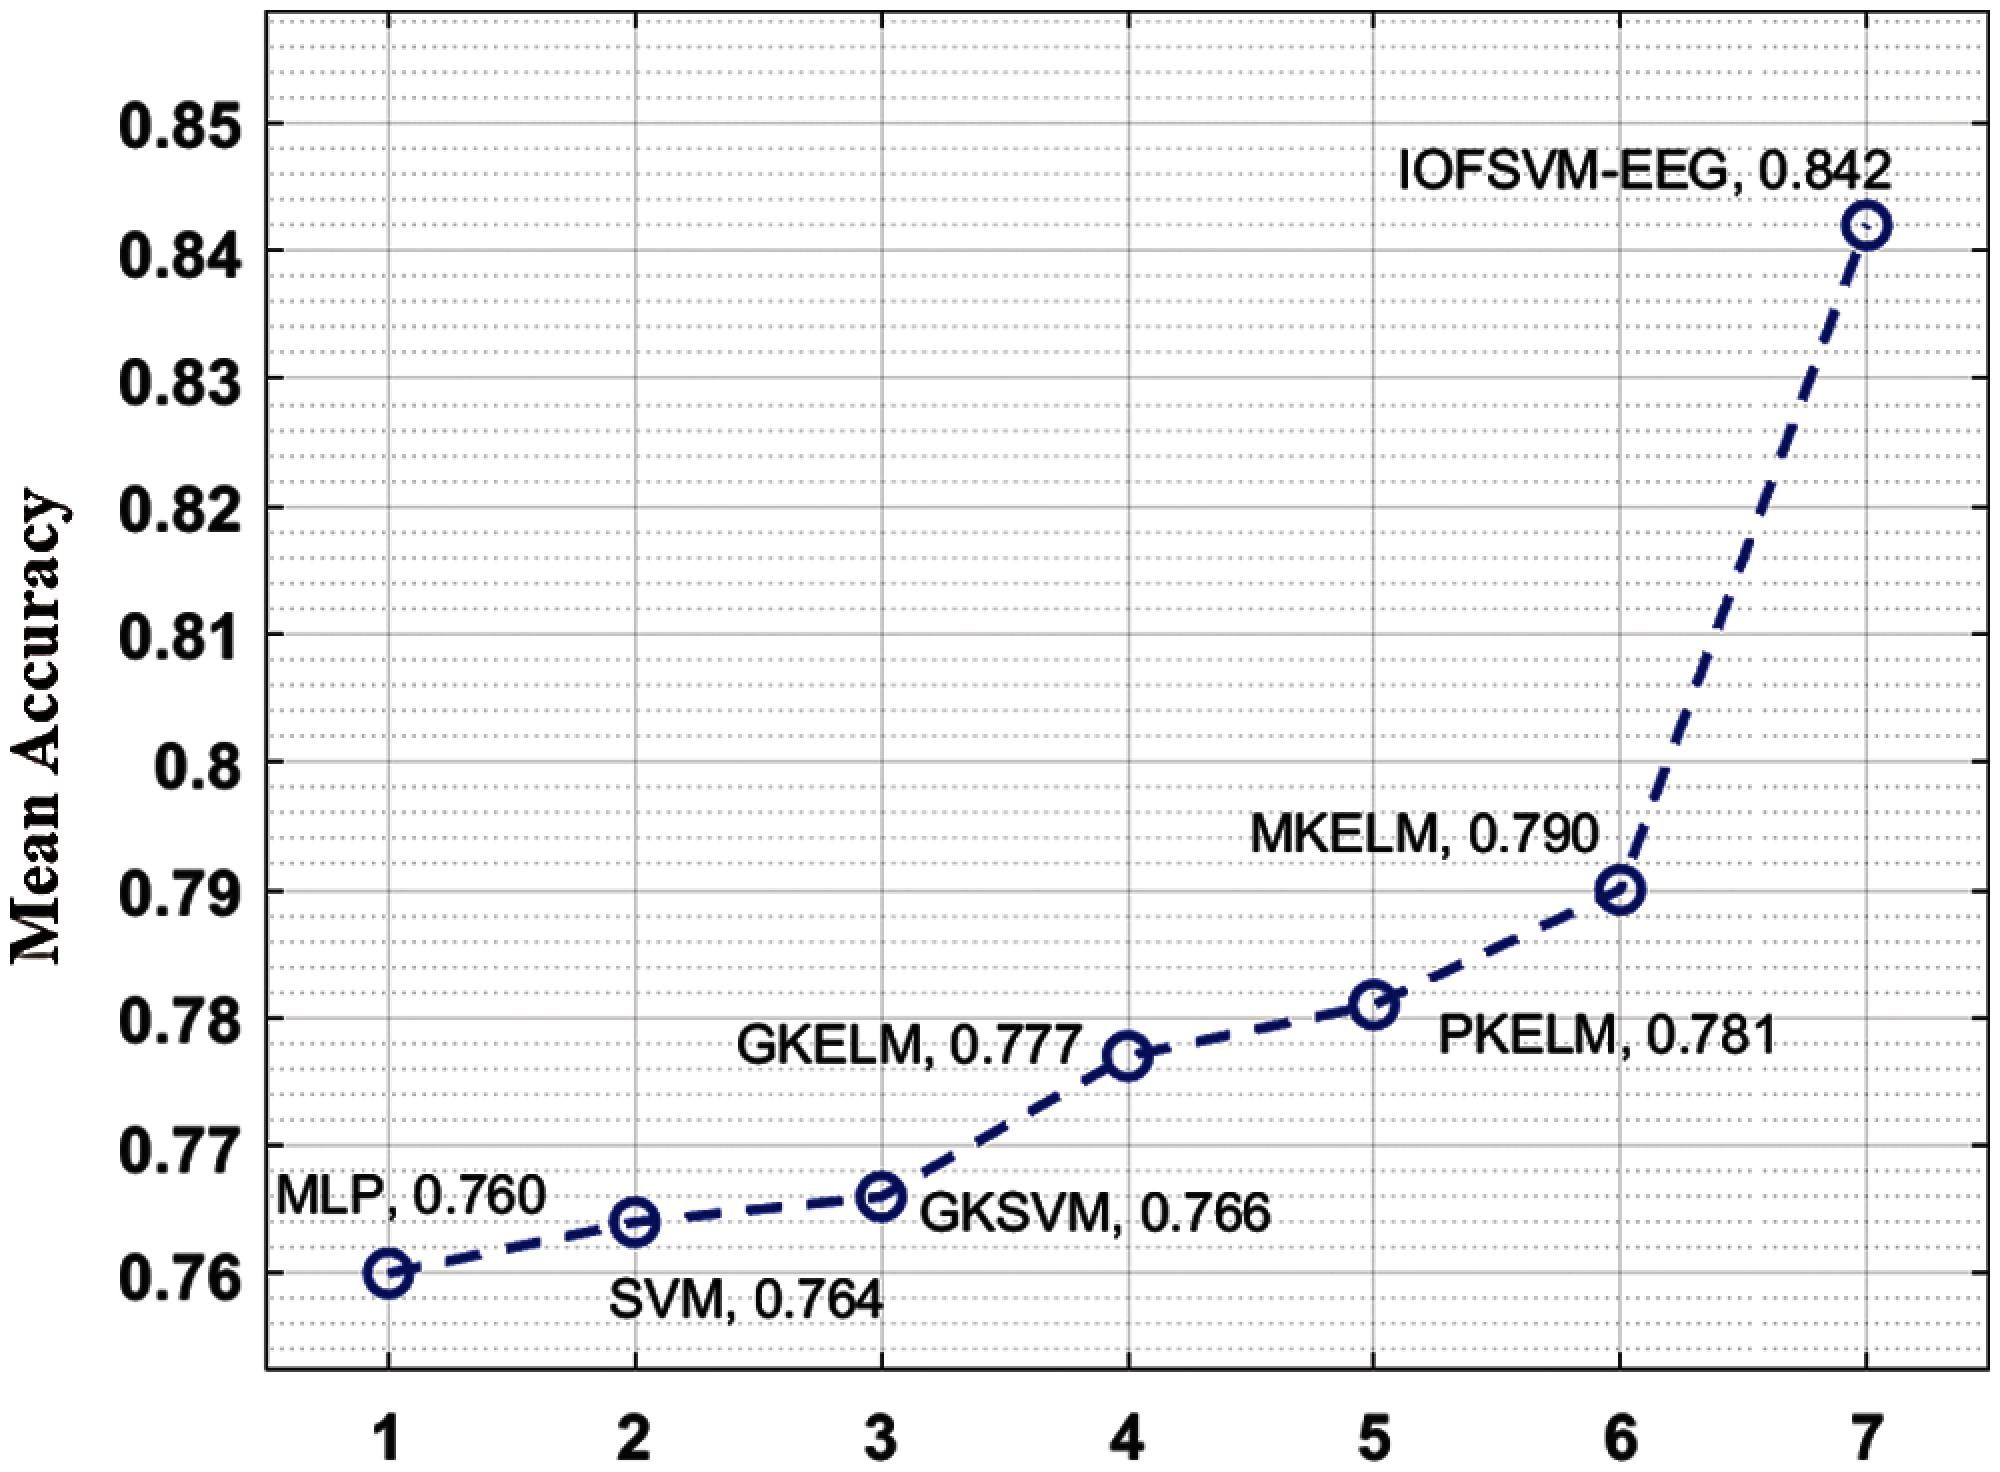
Figure 7: Mean accuracy analysis of IOFSVM-EEG model on BCI competition IV dataset IIb
The current research article developed a new EEG recognition method using IOFSVM-EEG model for BCI systems. The goal of the proposed IOFSVM-EEG model is to effectively recognize and appropriately classify the EEG systems. The proposed model encompasses ICA-based pre-processing, CSP-based feature extraction, FSVM-based classification, and GOA-based parameter tuning. GOA is applied to optimally adjust the parameters involved in FSVM model. This phenomenon helps in considerable improvement of EEG recognition outcome. To examine the improved EEG recognition performance of the proposed IOFSVM-EEG model, a comprehensive experimental analysis was conducted on benchmark dataset and the outcomes were analyzed under distinct measures. The experimental results highlighted that the proposed method achieved supreme performance over existing state-of-the-art methods. As a part of future extension, the EEG recognition performance of IOFSVM-EEG model on BCI systems can be boosted with the help of advanced deep learning architectures.
Funding Statement: The authors extend their appreciation to the Deanship of Scientific Research at King Khalid University for funding this work under grant number (RGP 2/25/42), received by Fahd N. Al-Wesabi. https://www.kku.edu.sa. This research was funded by the Deanship of Scientific Research at Princess Nourah bint Abdulrahman University through the Fast-track Research Funding Program.
Conflicts of Interest: The authors declare that they have no conflicts of interest to report regarding the present study.
1. F. Lotte, L. Bougrain, A. Cichocki, M. Clerc, M. Congedo et al., “A review of classification algorithms for EEG-based brain–computer interfaces: A 10 year update,” Journal of Neural Engineering, vol. 15, no. 3, pp. 031005, 2018. [Google Scholar]
2. M. Clerc, L. Bougrain and F. Lotte, Brain-computer Interfaces 1: Foundations and Methods, London, UK: Hoboken, NJ, USA: ISTE; Wiley, 2016. [Google Scholar]
3. J. R. Wolpaw, D. J. McFarland, G. W. Neat and C. A. Forneris, “An EEG-based brain-computer interface for cursor control,” Electroencephalography and Clinical Neurophysiology, vol. 78, no. 3, pp. 252–259, 1991. [Google Scholar]
4. M. Kołodziej, A. Majkowski and R. Rak, “Matlab FE_Toolbox-an universal utility for feature extraction of EEG signals for BCI realization,” Przeglad Elektrotechniczny, vol. 86, no. 1, pp. 44–46, 2010. [Google Scholar]
5. N. Padfield, J. Zabalza, H. Zhao, V. Masero and J. Ren, “EEG-Based brain-computer interfaces using motor-imagery: Techniques and challenges,” Sensors, vol. 19, no. 6, p.1 423, 2019. [Google Scholar]
6. A. Nijholt, “The future of brain-computer interfacing (keynote paper),” in 2016 5th Int. Conf. on Informatics, Electronics and Vision (ICIEVDhaka, Bangladesh, pp. 156–161, 2016. [Google Scholar]
7. L. F. Nicolas-Alonso and J. Gomez-Gil, “Brain computer interfaces, a review,” Sensors, vol. 12, no. 2, pp. 1211–1279, 2012. [Google Scholar]
8. J. A. Caldwell, B. Prazinko and J. L. Caldwell, “Body posture affects electroencephalographic activity and psychomotor vigilance task performance in sleep-deprived subjects,” Clinical Neurophysiology, vol. 114, no. 1, pp. 23–31, 2003. [Google Scholar]
9. F. Lotte, “A tutorial on EEG signal-processing techniques for mental-state recognition in brain–computer interfaces,” In: Miranda E., Castet J. (eds.) Guide to Brain-Computer Music Interfacing, Springer, London, pp. 133–161, 2014. [Google Scholar]
10. C. Neuper and G. Pfurtscheller, “Neurofeedback training for BCI control,” In: Graimann B., Pfurtscheller G., Allison B. (eds.) Brain-Computer Interfaces. The Frontiers Collection, Springer, Berlin, Heidelberg, Germany, pp. 65–78, 2010. [Google Scholar]
11. Z. Jin, G. Zhou, D. Gao and Y. Zhang, “EEG classification using sparse Bayesian extreme learning machine for brain–computer interface,” Neural Computing and Applications, vol. 32, no. 11, pp. 6601–6609, 2020. [Google Scholar]
12. Y. Zhang, G. Zhou, J. Jin, Q. Zhao, X. Wang et al., “Sparse Bayesian classification of eeg for brain–computer interface,” IEEE Transactions on Neural Networks and Learning Systems, vol. 27, no. 11, pp. 2256–2267, 2016. [Google Scholar]
13. H. S. Kim, R. Eykholt and J. D. Salas, “Nonlinear dynamics, delay times, and embedding windows,” Physica D: Nonlinear Phenomena, vol. 127, no. 1–2, pp. 48–60, 1999. [Google Scholar]
14. Y. Zhang, Y. Wang, G. Zhou, J. Jin, B. Wang et al., “Multi-kernel extreme learning machine for EEG classification in brain-computer interfaces,” Expert Systems with Applications, vol. 96, pp. 302–310, 2018. [Google Scholar]
15. E. Dong, K. Zhou, J. Tong and S. Du, “A novel hybrid kernel function relevance vector machine for multi-task motor imagery EEG classification,” Biomedical Signal Processing and Control, vol. 60, pp. 101991, 2020. [Google Scholar]
16. P. Gaur, K. McCreadie, R. B. Pachori, H. Wang and G. Prasad, “An automatic subject specific channel selection method for enhancing motor imagery classification in EEG-bCI using correlation,” Biomedical Signal Processing and Control, vol. 68, pp. 102574, 2021. [Google Scholar]
17. X. Zheng, X. Liu, Y. Zhang, L. Cui and X. Yu, “A portable HCI system-oriented EEG feature extraction and channel selection for emotion recognition,” International Journal of Intelligent Systems, vol. 36, no. 1, pp. 152–176, 2021. [Google Scholar]
18. H. Jiang, Z. Wang, R. Jiao and S. Jiang, “Picture-induced eeg signal classification based on cvc emotion recognition system,” computers,” Materials & Continua, vol. 65, no. 2, pp. 1453–1465, 2020. [Google Scholar]
19. J. Wang, Z. Feng, N. Lu, L. Sun and J. Luo, “An information fusion scheme based common spatial pattern method for classification of motor imagery tasks,” Biomedical Signal Processing and Control, vol. 46, pp. 10–17, 2018. [Google Scholar]
20. J. Liu, “Fuzzy support vector machine for imbalanced data with borderline noise,” Fuzzy Sets and Systems, vol. 413, pp. 64–73, 2021. [Google Scholar]
21. K. K. Patro, S. P. R. Reddi, S. K. E. Khalelulla, P. Rajesh Kumar and K. Shankar, “ECG data optimization for biometric human recognition using statistical distributed machine learning algorithm,” The Journal of Supercomputing, vol. 76, no. 2, pp. 858–875, 2020. [Google Scholar]
22. K. Shankar, Y. Zhang, Y. Liu, L. Wu and C. -H. Chen, “Hyperparameter tuning deep learning for diabetic retinopathy fundus image classification,” IEEE Access, vol. 8, pp. 118164–118173, 2020. [Google Scholar]
23. W. -H. Liao, Y. Kao and Y. -S. Li, “A sensor deployment approach using glowworm swarm optimization algorithm in wireless sensor networks,” Expert Systems with Applications, vol. 38, no. 10, pp. 12180–12188, 2011. [Google Scholar]
 | This work is licensed under a Creative Commons Attribution 4.0 International License, which permits unrestricted use, distribution, and reproduction in any medium, provided the original work is properly cited. |