DOI:10.32604/cmc.2022.020919
| Computers, Materials & Continua DOI:10.32604/cmc.2022.020919 | |
| Article |
Covid-19 CT Lung Image Segmentation Using Adaptive Donkey and Smuggler Optimization Algorithm
1Department of Computer Science, CHRIST (Deemed to be University), Bengaluru, India
2Department of Computer Science and Engineering, CHRIST (Deemed to be University), Bengaluru, India
3Information Systems Department, College of Computer and Information Science, Princess Nourah Bint Abdulrahman University, Riyadh, KSA 84428, Saudi Arabia
4Department of Mathematics, Faculty of Science, Cairo University, Giza, 12613, Egypt
5Computer Sciences Department, College of Computer and Information Science, Princess Nourah Bint Abdulrahman University, Riyadh, Saudi Arabia
6Department of Electrical Engineering, Faculty of Engineering-Shoubra, Benha University, Cairo, Egypt
*Corresponding Author: Ala Saleh Alluhaidan. Email: asalluhaidan@pnu.edu.sa
Received: 14 June 2021; Accepted: 23 August 2021
COVID’19 has caused the entire universe to be in existential health crisis by spreading globally in the year 2020. The lungs infection is detected in Computed Tomography (CT) images which provide the best way to increase the existing healthcare schemes in preventing the deadly virus. Nevertheless, separating the infected areas in CT images faces various issues such as low-intensity difference among normal and infectious tissue and high changes in the characteristics of the infection. To resolve these issues, a new inf-Net (Lung Infection Segmentation Deep Network) is designed for detecting the affected areas from the CT images automatically. For the worst segmentation results, the Edge-Attention Representation (EAR) is optimized using Adaptive Donkey and Smuggler Optimization (ADSO). The edges which are identified by the ADSO approach is utilized for calculating dissimilarities. An IFCM (Intuitionistic Fuzzy C-Means) clustering approach is applied for computing the similarity of the EA component among the generated edge maps and Ground-Truth (GT) edge maps. Also, a Semi-Supervised Segmentation (SSS) structure is designed using the Randomly Selected Propagation (RP) technique and Inf-Net, which needs only less number of images and unlabelled data. Semi-Supervised Multi-Class Segmentation (SSMCS) is designed using a Bi-LSTM (Bi-Directional Long-Short-Term-memory), acquires all the advantages of the disease segmentation done using Semi Inf-Net and enhances the execution of multi-class disease labelling. The newly designed SSMCS approach is compared with existing U-Net++, MCS, and Semi-Inf-Net. factors such as MAE (Mean Absolute Error), Structure measure, Specificity (Spec), Dice Similarity coefficient, Sensitivity (Sen), and Enhance-Alignment Measure are considered for evaluation purpose.
Keywords: Adaptive donkey and snuggler optimization.bi-directional long short term memory; coronavirus disease 2019; randomly selected propagation; semi-supervised learning
The onset of Coronavirus is established in Wuhan city of Hubei Province, China, in 2019 December with proof of individual-to-individual spread. These viruses have been around for many years and have infected various animals/mammal species and humans. The WHO announced this deadly virus, COVID’19, by March 11, 2020, as a pandemic, which put the entire world into a mandatory lockdown. This virus belongs to the RNA viruses and can cause serious viral pathogens both in humans and animals. The pandemic infection is induced by the causative agent [1] named severe acute respiratory syndrome coronavirus. Totally more than 1,50,000 corona-positive cases are detected by the middle of March 2020. Also, the number of affected cases and lost lives other than China is more than the number of the Chinese ones [2]. Symptoms in the majority of the affected persons are fever, pulmonary opacities, and respiratory symptoms identified using CT scans, in which 20%--30% of the affected persons need ventilation with 10% of deaths in different reports [2]. A few percentages of patients who do not have any symptoms of this virus are also considered a source of disease transmission [3]. The WHO recorded 1,610,909 cases with 99,690 deaths by 11 April 2020 [1]. The number of new cases is substantially increasing in several countries, while the affected ratios reduce in China. The nucleotides from the specimens acquired by bronchoalveolar lavage, oropharyngeal swab, tracheal aspirate, and nasopharyngeal swab [4] are determined by RT-PCR (Reverse Transcription Polymerase Chain Reaction) diagnostic approach. Also, RT-CPR is inadequate for identifying the deadly infection Therefore, several non-laboratory and laboratory diagnostic methods are carried out for finding the cause, location, and seriousness of this deadly infection. The laboratory diagnostic approaches consider pleural-fluid-analysis, complete blood count, and blood-gas-analysis [5], The non-laboratory diagnostic approaches consider the image-based techniques for recording and analyzing the lung areas by utilizing CT scan, chest radiography (X-ray), and bronchoscope. Although, the CT and X-ray are generally utilized for recording the lungs image and the recorded image is analyzed by a doctor or for detecting the seriousness of the disease.
As CT images obtained from infected patients often indicate two-sided irregular images/ground-glass dullness in the lungs [6], computerized tomography is the essential method for identifying the infection in the lungs due to the viral infection. The CT is simple to operate and is highly sensitive to screen corona infection [7] in comparison with RT-PCR. Also, the human delineation of lungs infection is difficult and time-consuming. The observation of this infection by the radiologists is a subjective project that is frequently controlled by clinical experience and individual influence. The Deep Learning (DL) method and Artificial Intelligence (AI) method are utilized for identifying the imaging characteristics of the deadly disease since the number of newly infected persons are increased rapidly. The DL method is designed for identifying the patients affected with COVID-19 through radiological imaging [8]. Also, COVID-Net was established for finding the COVID-19 infected cases via chest radiography images [9]. One anomaly identification approach is established for helping radiologists in examining the numerous X-ray images of the chest. A position-attention-oriented approach is applied to compute the infection probability of corona [10]. Also, one deep learning-based software is created by utilizing 3D CT images so as to identify the corona infection. The list of the deadly infection-related AI works is described in. The detection of this deadly infectious virus is difficult in situations like: (1) There are high changes in size, texture, and position of infections in CT images (i.e.,) the integrations are very small so that it may cause negative detection occurs from the entire CT image, (2) The inter-class variation is low (i.e.,) There is blurred effect and low contrast in images which leads to false identification of the disease, and (3) As the extend of COVID’19 is quick, it is difficult to accumulate the required labeled data within less time. Therefore, to resolve the above-mentioned issues, a new Inf-Net approach is designed to automatically determine the infected areas from images of the chest. Although, in this Inf-Net approach, some of the edges are not able to be determined accurately because of the poor extraction of features. So that the segmentation results are not accurate. To resolve this drawback, Edge-Attention Representation (EAR) is designed using ADSO. The similarity of the EA component among the generated edge maps and GT edge maps is computed using the IFCM clustering approach. A Bi-LSTM classifier is utilized for detecting infected areas from the CT images of the chest automatically for a multi-class segmentation network. The factors such as Mean Absolute Error (MAE), Structure measure, Specificity (Spec), Dice Similarity coefficient, Sensitivity (Sen), and Enhance-Alignment Measure are considered for evaluation purposes.
Wang et al. [9] introduced a method that detects Coronavirus from the images of Chest X-Ray, is non-proprietary and publicly accessible DCNN is termed as COVID-Net. Researchers and citizen data scientists use COVID-Net and COVIDx datasets to speed up the accuracy of Deep Learning Solutions to detect these deadly infection cases. Wang et al. [11] suggested that the Artificial Intelligence DL technique could extort COVID’19 specific graphical attributes and save critical time for disease control. It provides a medical analysis before pathogenic examination and presented radiographical changes in CT images. These findings indicate the significance to extort radiological graphical features for COVID’19 identification using the DL technique. Chen et al. [12] stated that for diagnosing COVID-19, a computerized tomography is the chosen imaging technique. To perform model validation and development, nearly 46,096 anonymous images were gathered from 106 admitted individuals, together with 51 COVID (+) individuals and 55 control individuals affected by other infections in Renim Hospital of Wuhan University. The DL technique proved equivalent performance with proficient radiologists and significantly enhanced radiologists’ competence in medical practice.
Gozes et al. [13] created a method that employs robust 2D and 3D DL techniques, which change and adapt current artificial intelligence methods and combines them with medical perceptive. Many traditional evaluations were performed to examine the methods’ execution for identifying alleged COVID’19 thoracic CT attributes and evaluating the progress of infection in every affected individual overrun employing a 3D volume review, producing a Corona score. The findings showed that AI-based image analysis could detect Coronavirus with high accuracy and quantify and track illness burden.
Tang et al. [14] introduced a Random Forest(RF) based on quantitative features trained to assess the severity(severe or non-severe). The RF model calculates the importance of each quantitative feature, which reflects the correlation to the severity of the disease. The quantitative feature calculated from the right lung is more severe than the left lung. Machine Learning methods explore the severity-related features and comprehend regular harshness evaluation (either non-severe or severe) of the deadly infection derived from chest CT images.
Song et al. [15] introduced a method to identify patients with the disease using a DL-dependent CT identification model (Deep-Pneumonia). This model differentiates the bacteria pneumonia-infected patients and Coronavirus-infected patients with a recall (sensitivity) of 0.96 and AUC of 0.95. The suggested model can quickly and accurately identify infected people. To automatically quantify infection ROIs and their volumetric proportions relating to lung, Shan et al. [16] introduced a DL-related segmentation model. Human-In-The-Loop (HITL) technique was used to aid radiologists with affected part segmentation, reducing the entire segmentation period to four minutes behind three iterations of system updates. Finally, potential applications were considered, including examining subsequent CT scans and infection patterns in the lobes and segments connected with clinical results.
Yan et al. [17] designed deep CNN for separating chest images having corona infection. Initially, a new set of CT images including 165,667 chest images obtained from 861 corona-positive patients are preserved. A Feature Variation (FV) unit is utilized for adjusting the global features for separating the infected patients. The experiments performed by the researchers in Germany and China affirmed that the newly designed CNN approach is high in performance. Amyar et al. [18] described one multitask deep learning approach for identifying corona disease-infected persons and separating the viral lesions from CT images. There are three different actions carried out in the combined form: segmentation, classification, and reconstruction. An encoder is included for carrying out feature representation in three actions, and also one multi-layer perceptron (MLP) and two decoders for carrying out classification, segmentation, and reconstruction processes.
Polsinelli et al. [19] established a light CNN-related method of SqueezeNet for ensuring efficient segregation of corona-related computerized tomography images concerning erstwhile images obtained for pneumonia and/or fit computerized tomography images. Li et al. [20] designed recognition NN (COVNet) for obtaining attributes from the chest computerized tomography images of the infected persons. COVNet was applied on 4357 chest images of 3322 infected persons. The COVNet approach gives 95% accurate results. The computerized tomography images which are employed for the COVID research process are not shared in public [20].
Jaiswal et al. [21] introduced a DTL (Deep Transfer Learning) for separating the corona infected from uninfected persons. The features are obtained from the self-learned weights on the Image Net dataset by utilizing CNN structure. The results depict that the new DTL based corona classification approach has high performance than the traditional methods. Harmon et al. [22] described a deep learning training approach in which various global groups of 1280 individuals are allowed to localize pleura/lung parenchyma after performing the categorization of 1337 corona infected persons. AI-based approach is utilized for detecting the CT images combining with corona related pneumonia, and for differentiating non-corona pneumonia with high precision in various patients.
Fan et al. [23] designed a new lung Inf-Net approach for detecting the infected areas from the chest CT images. A PPD is utilized for combining high-level attributes and creating one universal map. Also, the implied and express models are designed for improving the representations. A Semi-supervised segmentation structure is applied on the basis of a randomly chosen propagation technique. Jain et al. [24] described x-ray scans for both the healthy and virus-infected persons. The deep-learning based CNN approach is generated after cleaning the images and employing data augmentation. Here Xception, Inception V3, and ResNext approaches are compared for analyzing the accuracy of each approach. The anomaly areas are also identified using the anomaly identification unit, which is failed to identify whether the anomaly area is related to viral infection. The main drawback with this virus infection segmentation method is that it has a low high-quality pixel-level observation. Therefore, the aim is to consider only limited observations and support unlabeled data in an efficient manner.
In this work, COVID-19 Inf-Net is suggested for CT images. The dissimilarity is calculated by introducing EAR through the ADSO approach. The similarity of the EA component among the generated edge maps and GT edge maps is computed using the IFCM clustering approach. One Parallel Partial Decoder (PPD) is utilized in this approach for combining the features from high-level layers. The integrated features extract related data and create one global map as assistance region for the successive steps. The lack of labeled data is reduced by suggesting SSS (Semi-Supervised Segmentation) system for the COVID’19 disease segmentation process [25]. multi-class infection labeling execution is enhanced. The experimental results depict that the development of the SSMCS-Inf-Net+Bi-LSTM approach for multi-class labelling of various lung illnesses.
3.1 Lung Infection Segmentation Network (Inf-Net)
Inf-Net approach includes three RA (Reverse Attention) segments that are interlinked to PDP. The computerized tomography images are initially transmitted to two convolutional layers for acquiring high-definition low-level features. The characterization of objective region boundaries is enhanced significantly by using Edge Attention (EA) module. EA module is optimized using the ADSO approach. Afterward, the low-level features
The edge information is acquired for providing important constraints to support the feature extraction for segmentation [26]. Therefore, the low-level attributes f2 are transmitted to the designed EA module for exactly learn edge-attention representation. Especially, the attribute f2 is transferred to one convolutional layer with a filter for creating an edge map. At last, the difference of EA component among the generated edge map
In which
3.2.1 Edge-Attention Representation (EAR) via the Adaptive Donkey and Smuggler Optimization (ADSO)
Edge Attention Representation (EAR) is carried out through the ADSO approach. This approach resembles the behavior such as searching and choosing the best edge map and GT of the donkeys. Two modes like Smuggler and Donkeys are utilized for performing the search behavior of the best gradient values in the edges and edge map. All the edges are identified, and the highest gradient edges are detected in the Smuggler mode. Multiple donkey behaviors like Run, Face & Suicide, and Face & Support are used in Donkey's mode (Refer Fig. 2) [27].
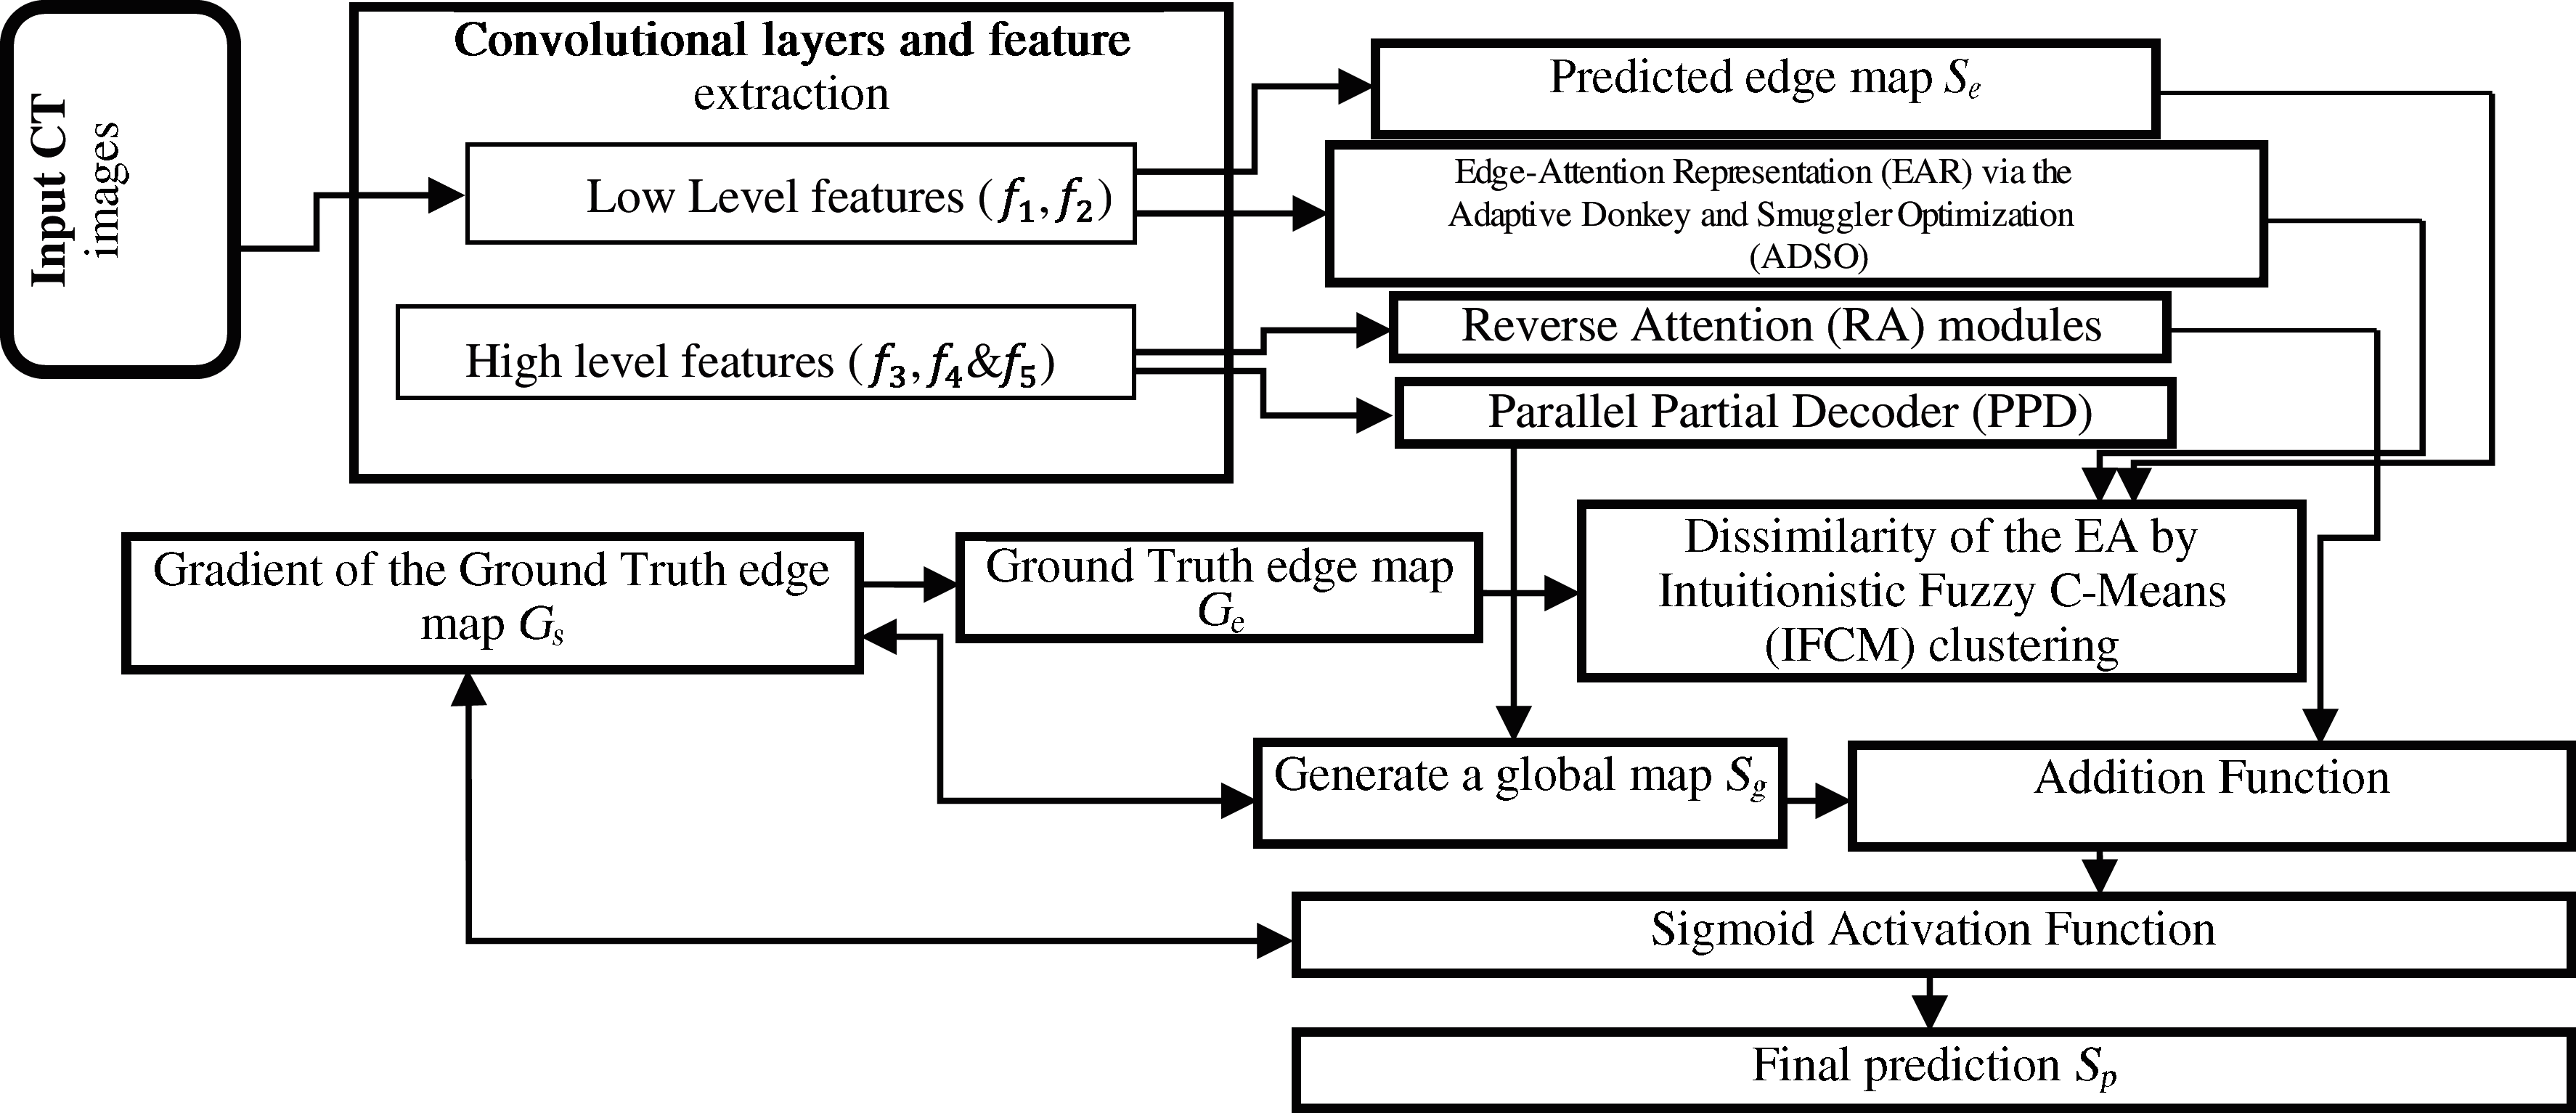
Figure 1: The architecture of proposed Inf-Net model
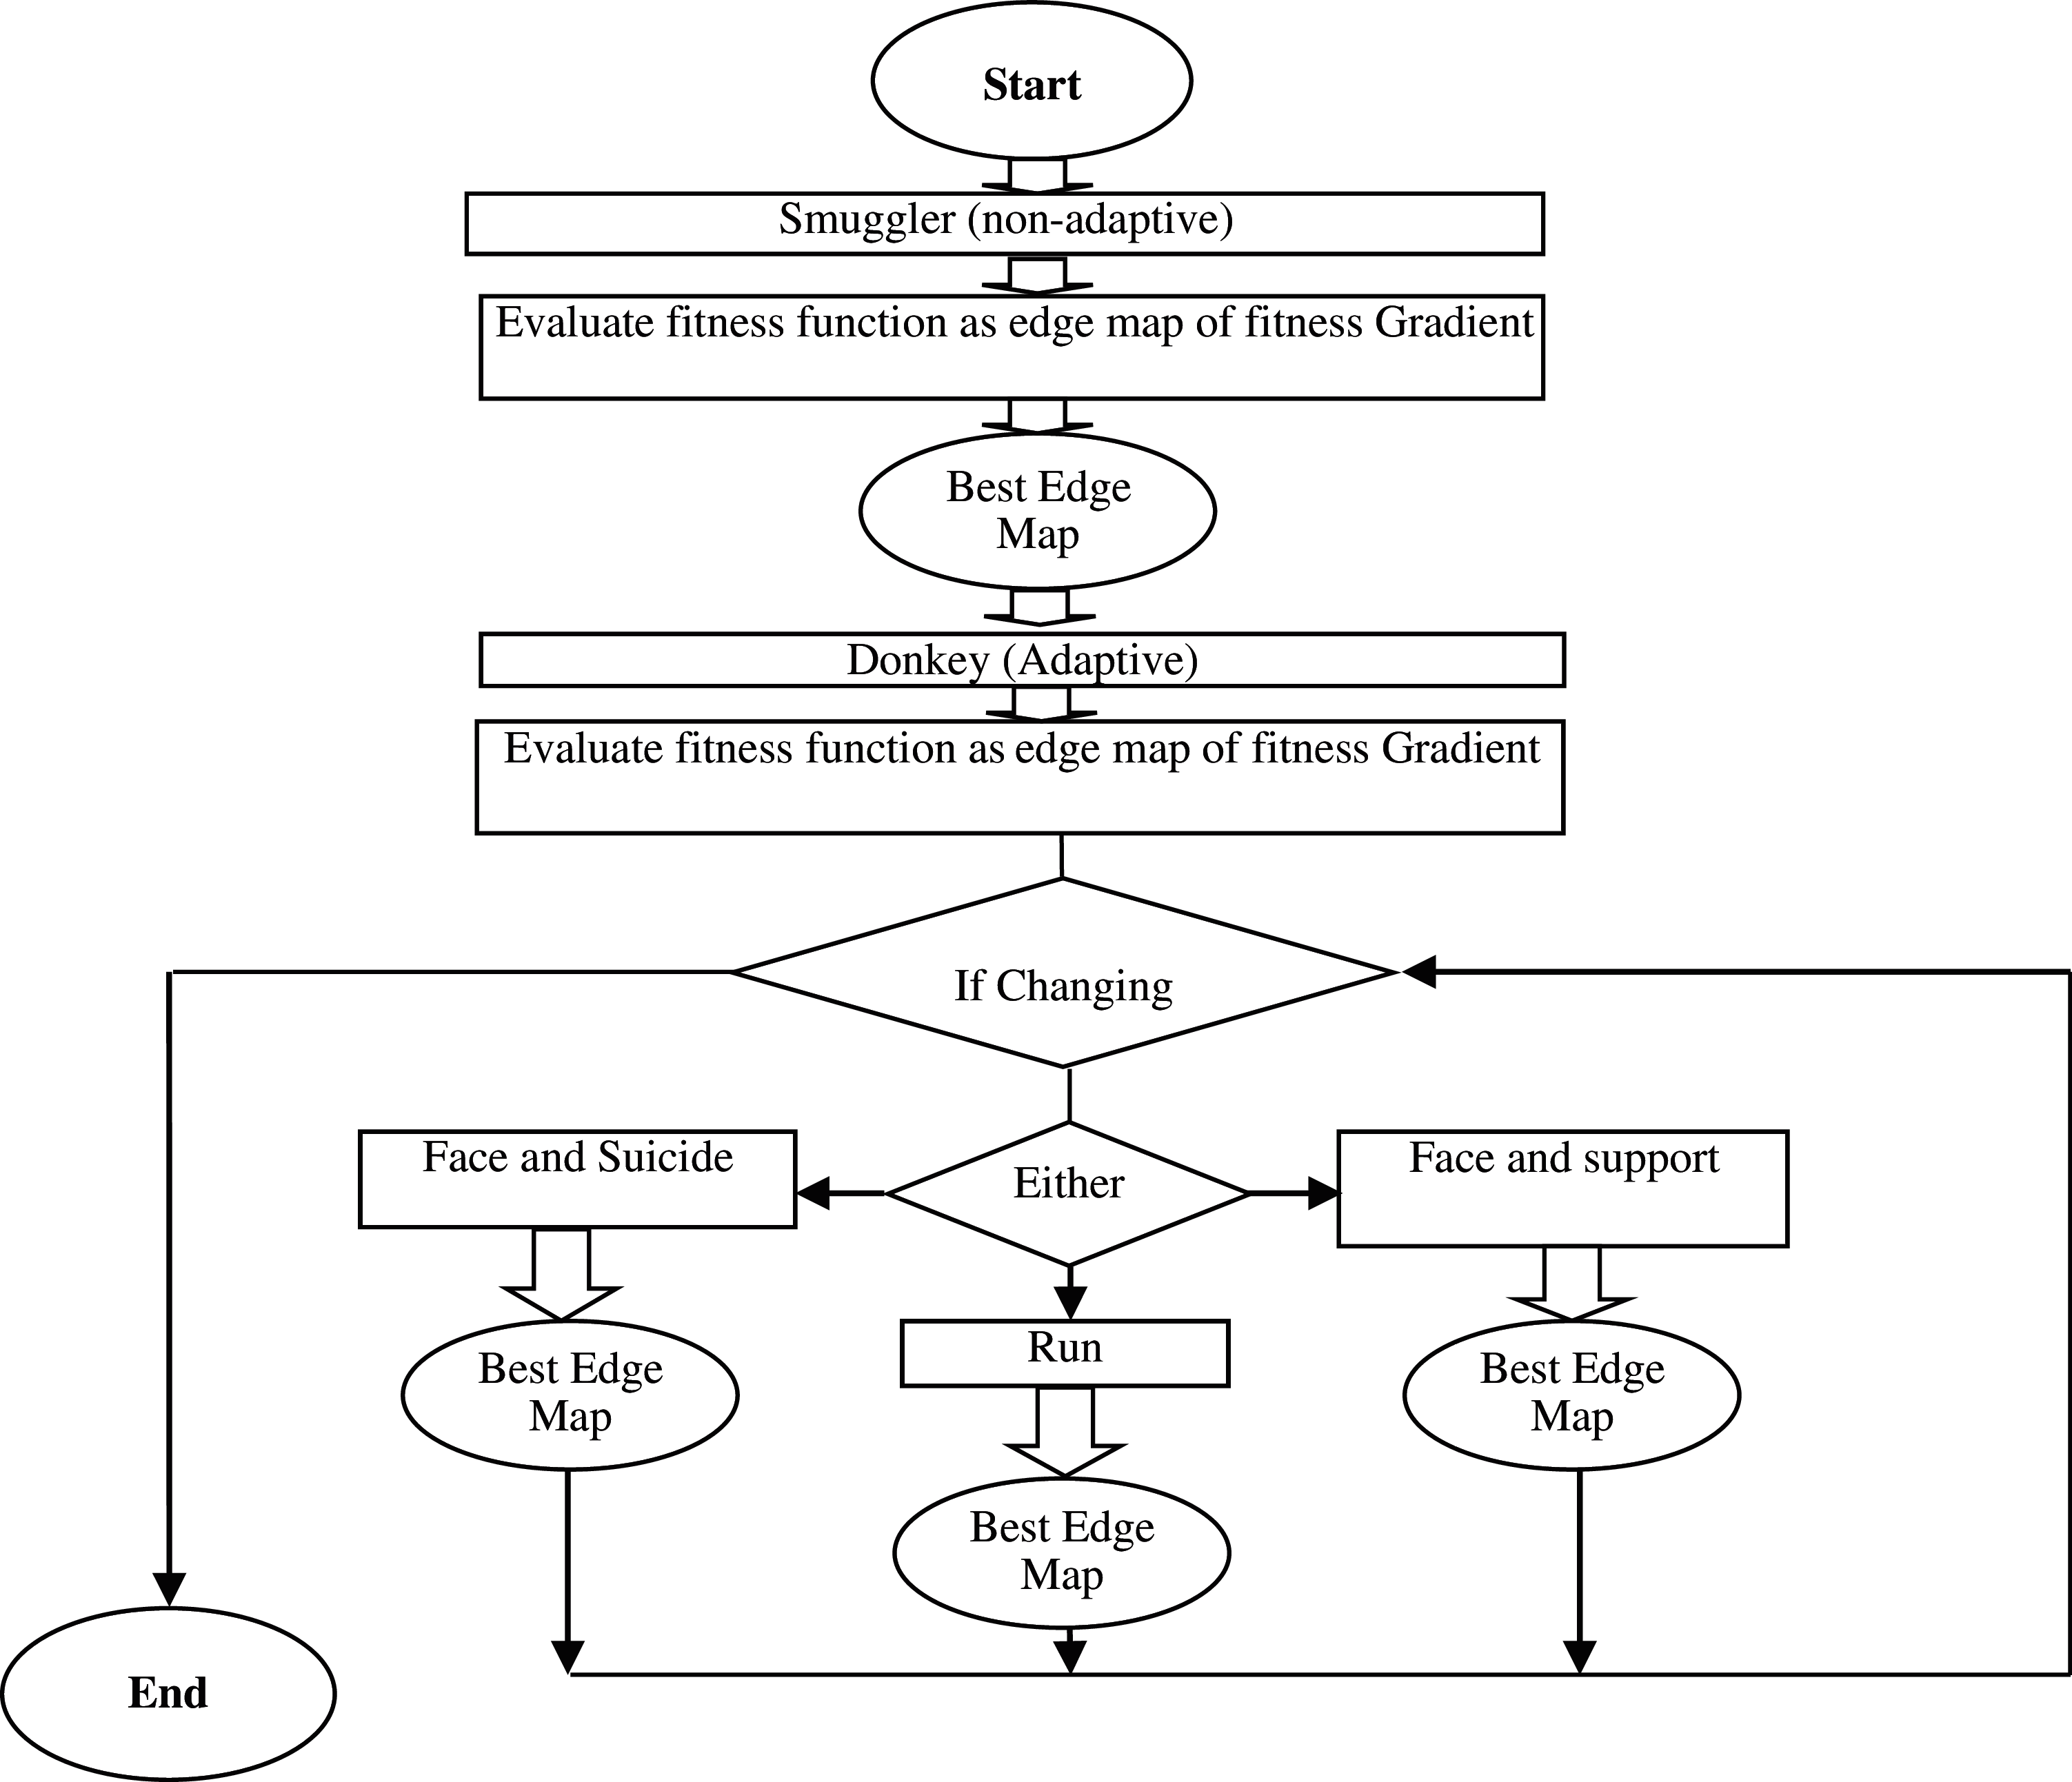
Figure 2: Procedure execution
A smuggler is not adaptive to any variations it is referred to as the invariable portion of the procedure. In this, the smuggler inspects all the possible edges from the image to the mapped edge and then concludes the best gradient on the basis of the condition of the image and the gradient of the image. Then, the Donkey is transferred on the basis of the concluded gradient. The fitness computation is performed in the smuggler portion for identifying the best ESR to reach the edge map based on the operator.
The Non-Adaptive routing seems to be better due to its simple functioning and accurate results with remarkably uniform topology and traffic. The estimation of the gradient is based on the present edge in the EAR approach. This operation is performed on the basis of Donley's behavior.
Run: edge map path is varied to other finest results. While the finest result is identified in an invariable portion of the procedure, the best solution is fell, and a new finest result is assigned based on new variations
Face and Suicide: edge map is to be optimized as the best edge map is finalized. At the same time fall the present edge map and utilize the other best solution while finalizing the gradient of the edges. Suppose the best solution finalized in the first portion of the algorithm is not the best because of many variations affecting its fitness value
Face and Support: When the present gradient does not reach the best solution which is assigned by the smuggler, the solution is dropped by setting the next best result in the answers to perform a similar operation.
Fig. 2 depicts the functioning of the procedure. A two-part algorithm is built using the Smuggler and Donkey behaviors for detecting the best edge map and for reacting to any variations for preserving the best edge map.
Pseudocode of the ADSO Algorithm
Part I: The Smuggler
Begin
1. Finding the gradient value for every solution
2. Computing the fitness value for every solution using Eq. (2) as follows,
Here i denotes the number of possible solutions for edge map,
3. Select the finest result and transfer the Donkey.
End
Part II: The Donkey
Begin
1. Utilize the identified result.
2. Calculate the present result with respect to fitness (Continue executing fitness function for identifying a good edge map result based on the fitness gradient)
3. If Yes: (there are lesser gradient)
3.1. Run: The fitness of the possible edge maps are recalculated, and the best edge map is updated.
3.2.Face and Suicide: By Eq. (3), the second-best solution is identified for functioning as the finest result. In which the fitness of probable solution is not recalculated.
In which i denotes amount of probable result of the edge map. The fitness of the best edge map will be the minimum one in the solution. The fitness of the best edge map is subtracted from the fitness of the possible edge maps for finding the least variation, which is measured as new feasible result.
3.3. Face and Support: If a feasible result is not attained, a mutation operator is applied till the actual feasible result is found. The local optima issue is evolved here, and so adaptive mutation operator is included by interchanging the gradients of the edge maps. Here the re-examination of fitness of probable result is done.
Eq. (4) decides on the solution that is utilized for the next best edge map by deducting the fitness of probable edge map from the fitness of finest edge map. After which Eq. (5) combine the finest edge map with next best edge map to create a feasible sustained solution that employs two edge map to do single work.
End
3.2.2 Intuitionistic Fuzzy C-Means (IFCM) Clustering
The edges are mapped, and a clustering algorithm is used to assess the EA module's resemblance among generated edge maps and the edge maps generated from GT by IFCM [28]. The IFCM uses intuitionistic fuzzy distance measure. In this research, a new IFCM clustering approach is designed using intuitionistic fuzzy set (IFS) theory for computing the hesitation degree arising at the time of application of membership function. In intuitionistic fuzzy set, the image is altered to intuitionistic domain via describing proper membership and non-membership functions. Once the membership and non-membership functions are acquired, the changes of the respective functions are performed based on the determined similarity between the generated edge map
In which
Having condition as
Here
An intuitionistic fuzzy subset A with hesitation degree
With a specific condition as
Here
At last, the membership functions and the cluster centre are updated based on the stopping criteria at every iteration.
3.3 Paralleled Partial Decoder (PPD)
Multiple traditional medical image segmentation networks separate infected organs by utilizing High and low-level attributes in the encoder. PDP is used for combining the high-level features, which is demonstrated in Fig. 3. Particularly, for I input CT image, two low-level set attributes {
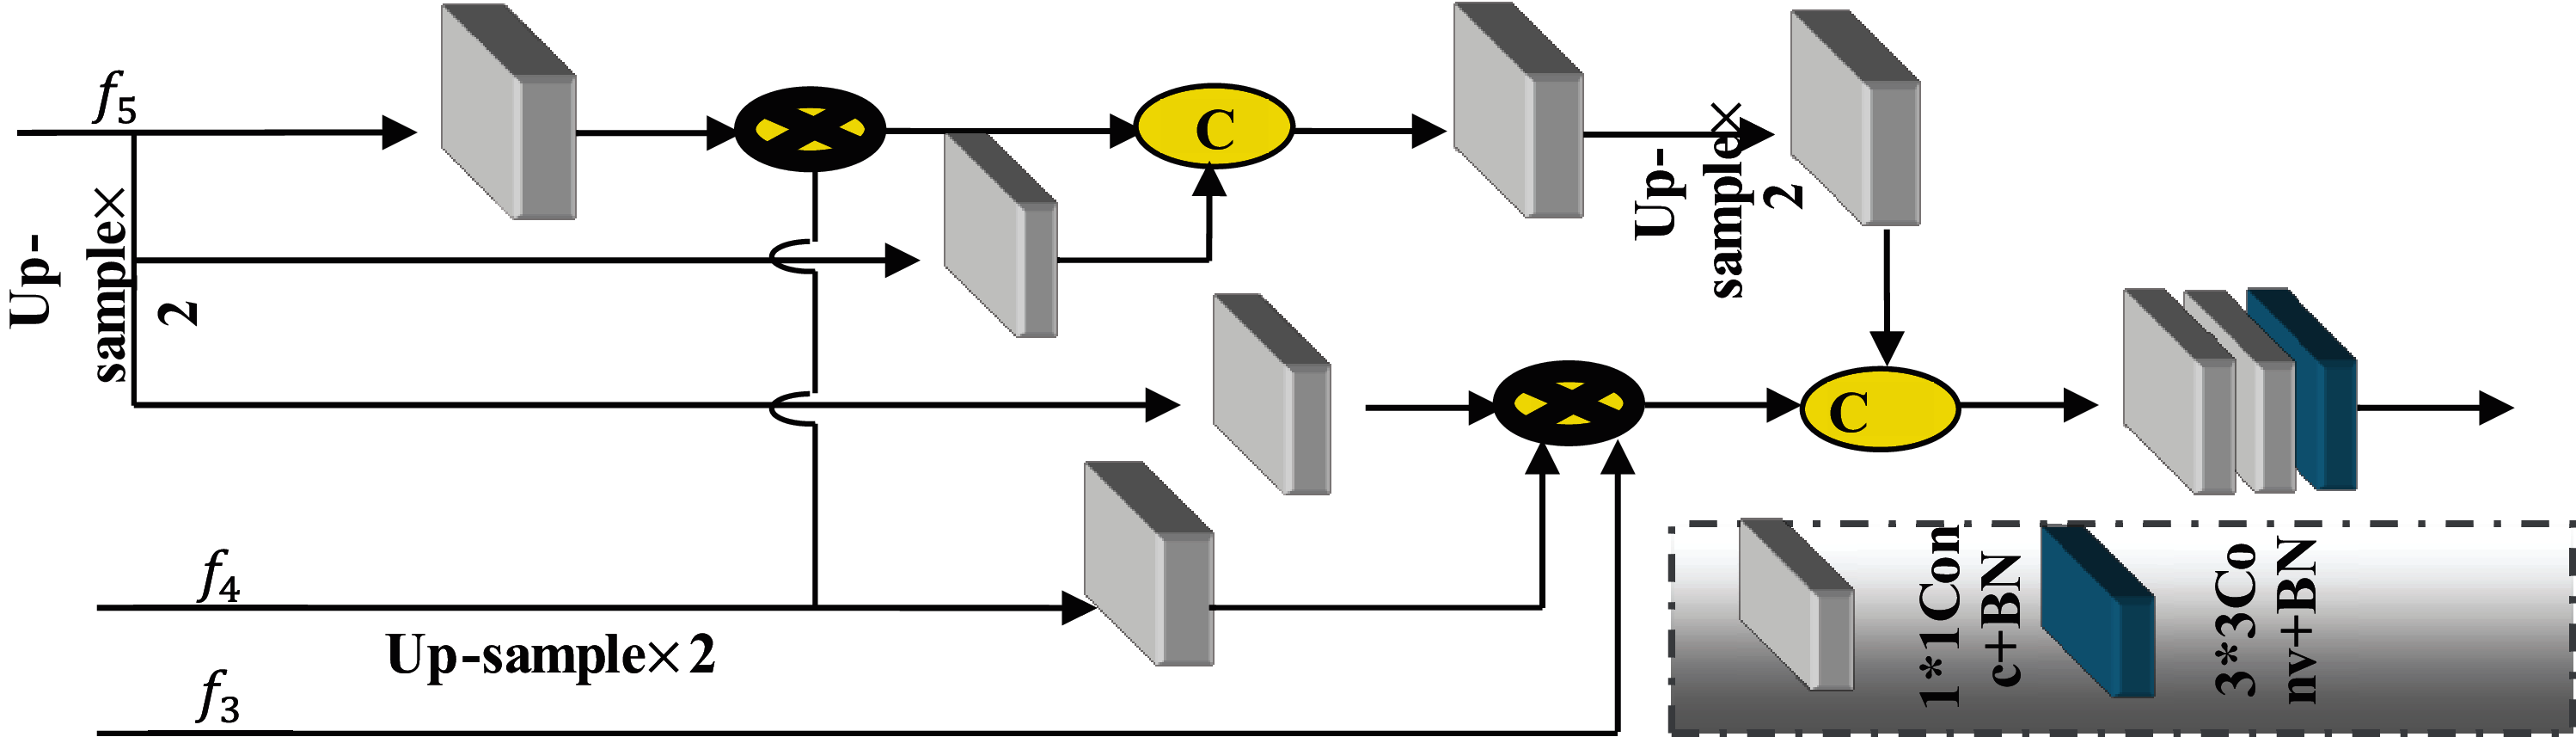
Figure 3: Parallel partial decoder (PPD) employed for generating global map
PDP is utilized as a new decoder element for combining the high-level features with parallel connection. This PDP outputs a coarse global map
3.3.1 Reverse Attention (RA) Module
Initially, PPD functions as a rough locator and outputs Sg global map, that provides lung infected areas a rough location without any structural information (Refer Fig. 4). Secondly, it functions as a fine labeller for mining different infected areas in a deleting manner. Especially, the new approach exactly studies the repeal concentration in three parallel high-level attributes rather than simply combining features from all levels. It can utilize the complementary areas and information by deleting the identified infected areas from high-level side-output attributes, in which the evaluation is high-sampled from the deep layer. RA attribute result is acquired via performing product of high-level side-output attributes
Here
In which
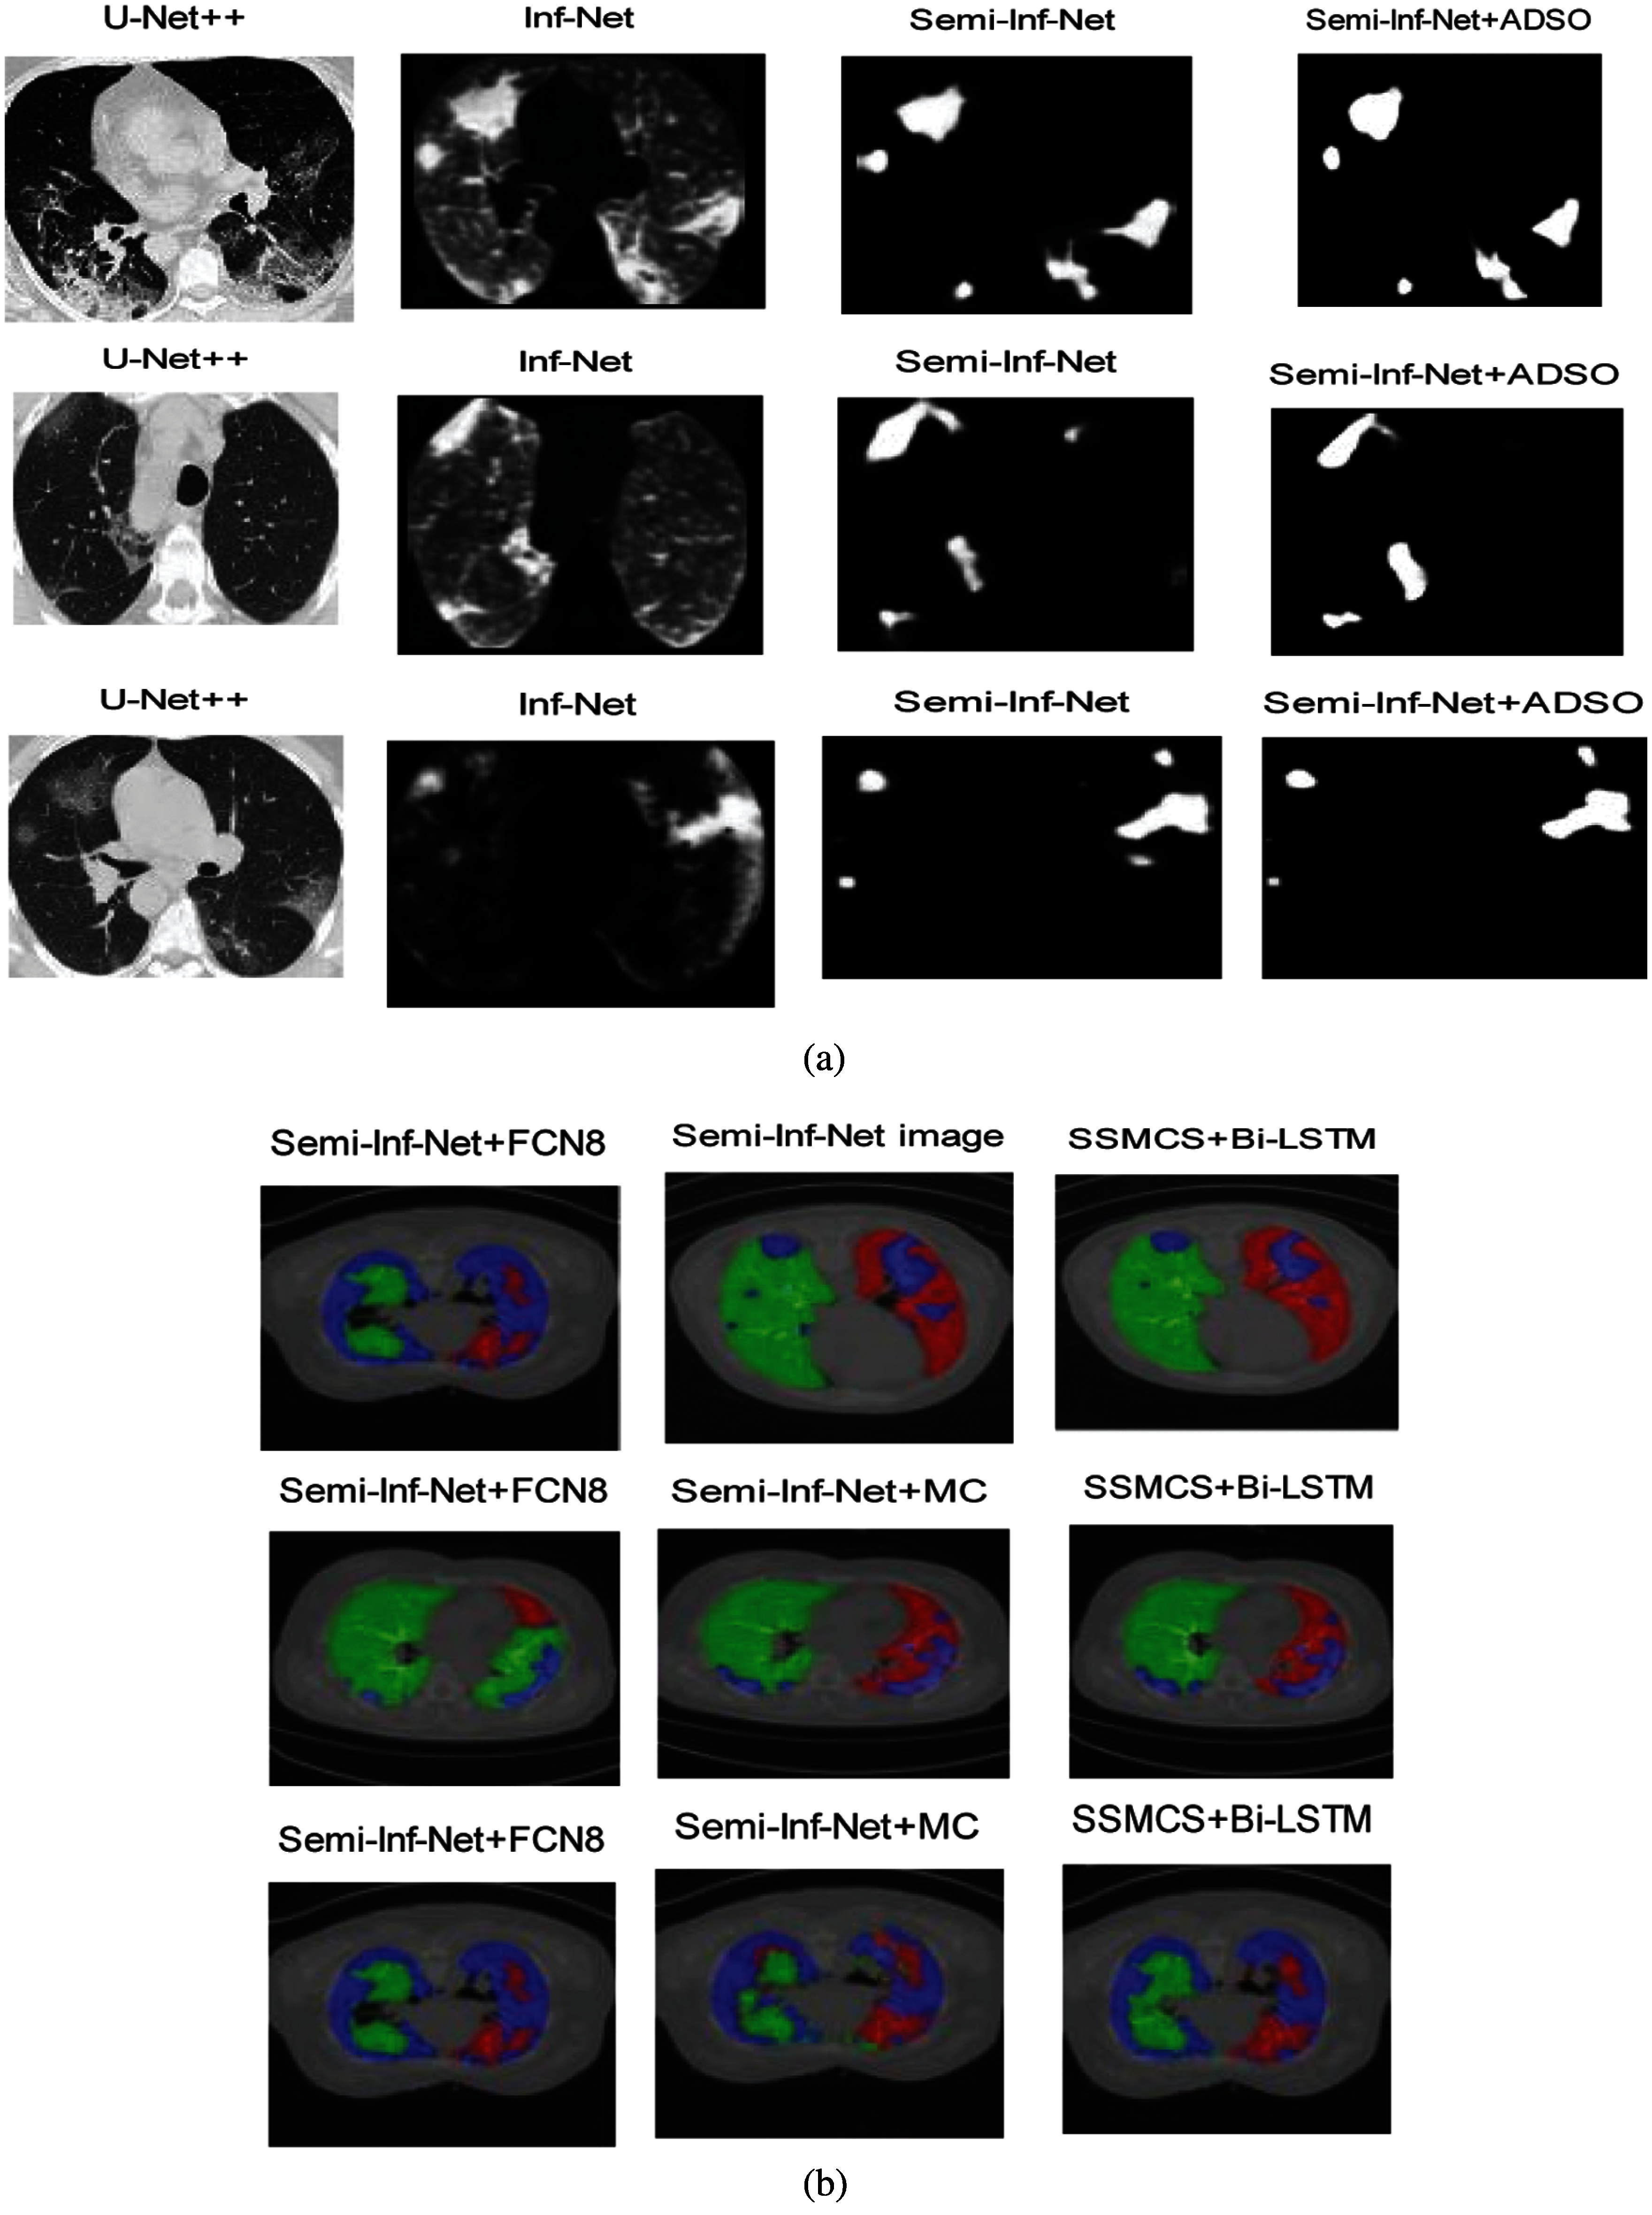
Figure 4: (a) Lung infection segmentation visual comparison (b) multi-class lung infection segmentation visual comparison
Here the weight is denoted as
The training dataset is efficiently augmented by this new method as it uses a semi-supervised learning approach for controlling various unlabelled CT images. Also, the inputs are needed to be resized uniformly to 352
3.5 Semi-Inf-Net with Multi-Class Segmentation
The U-Net and the Bi-LSTM classifier are two backbones used in multi-class segmentation works that are not bound by a specific type of segmentation work. Before training, all of the inputs are shrunk to 512512 pixels. A uniform Xavier is used to initialize the network, which is then trained using a SGD optimizer with 0.99 momentum,
In which b & W denotes bias and weight of the Bi-LSTM classifier
The sigmoid equation is provided as
In an LSTM cell, there are 3 gates:
(i) Utilize the Bi-LSTM output directly. That is, H = Z
(ii) Calculate the weighted sum of Y and Z. That is,
(iii) join Y and Z along with period steps. i.e., as Y and Z are
(iv) join Y and Z along every vector y and z. i.e., H is a
After choosing an explicit upper layer formation, the max-pooling function is performed along timesteps on H to get
In this research, the experiments are performed over the COVID’19 segmentation dataset, which contain 100 axial computerized tomography images obtained from various infected persons. The entire CT images are accumulated by Italian Society of Medical and Interventional Radiology. computerized tomography images are separated by the radiologists by various labels for determining lung infections. Only 100 labelled images are considered as this is the first accessible Corna virus dataset used for the segmentation of lung infections. semi-Supervised disease segmentation database (COVID-SemiSeg) is utilized to support unlabelled computerized tomography images to supplement the training dataset. COVID’19 computerized tomography Segmentation is applied as labelled data denoted as
Structure Measure (
where
Enhanced-Alignment Measure (
Here h and w symbolize the height and width of ground-truth G, respectively, and (x, y) signifies the pixel coordinates in G.
Mean Absolute Error (MAE): It calculates the pixel-by-pixel difference amongst
Three modern models Sem-Inf-Net, U-Net++, Inf-Net, and the suggested Semi-Inf-Net+ADSO algorithm, were used to compare the infection segmentation performance. The quantitative findings are provided in Tab. 1. As can be observed, in terms of metrics, the suggested Semi-Inf-Net + ADSO method outperforms Sem-Inf-Net, U-Net++, Inf-Net.
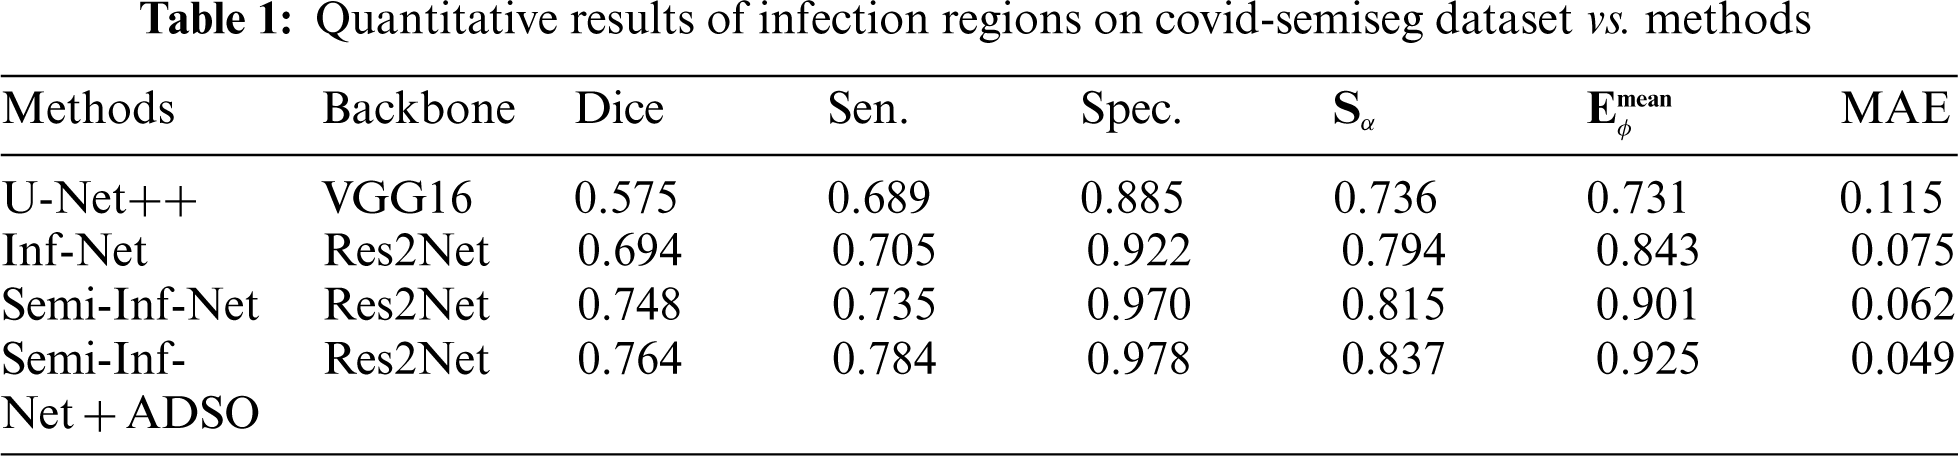
Fig. 4a shows that Semi-Inf-Net + ADSO and Semi-Inf-Net significantly outperform the other approaches in lung infection segmentation.
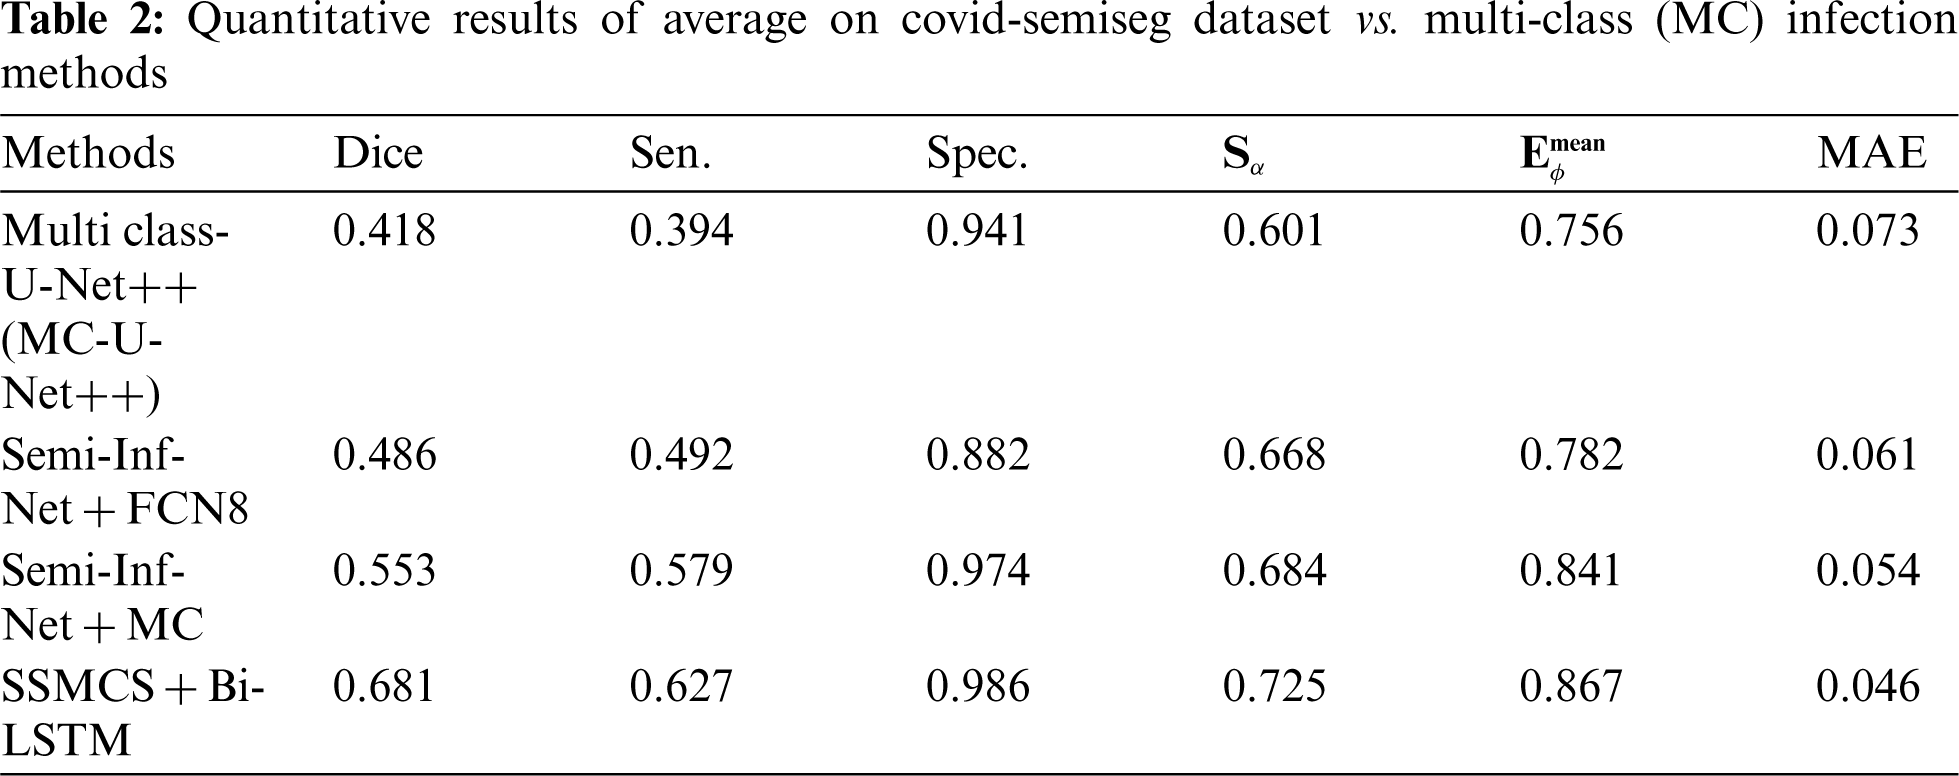
Fig. 4b shows that SSMCS + Bi-LSTM and Semi-Inf-Net + MC significantly outperform the other approaches in lung infection segmentation. From Fig. 5, it is concluded that the proposed SSMCS+Bi-LSTM and Semi-Inf-Net+ADSO classifier gives higher results when compared to other methods.
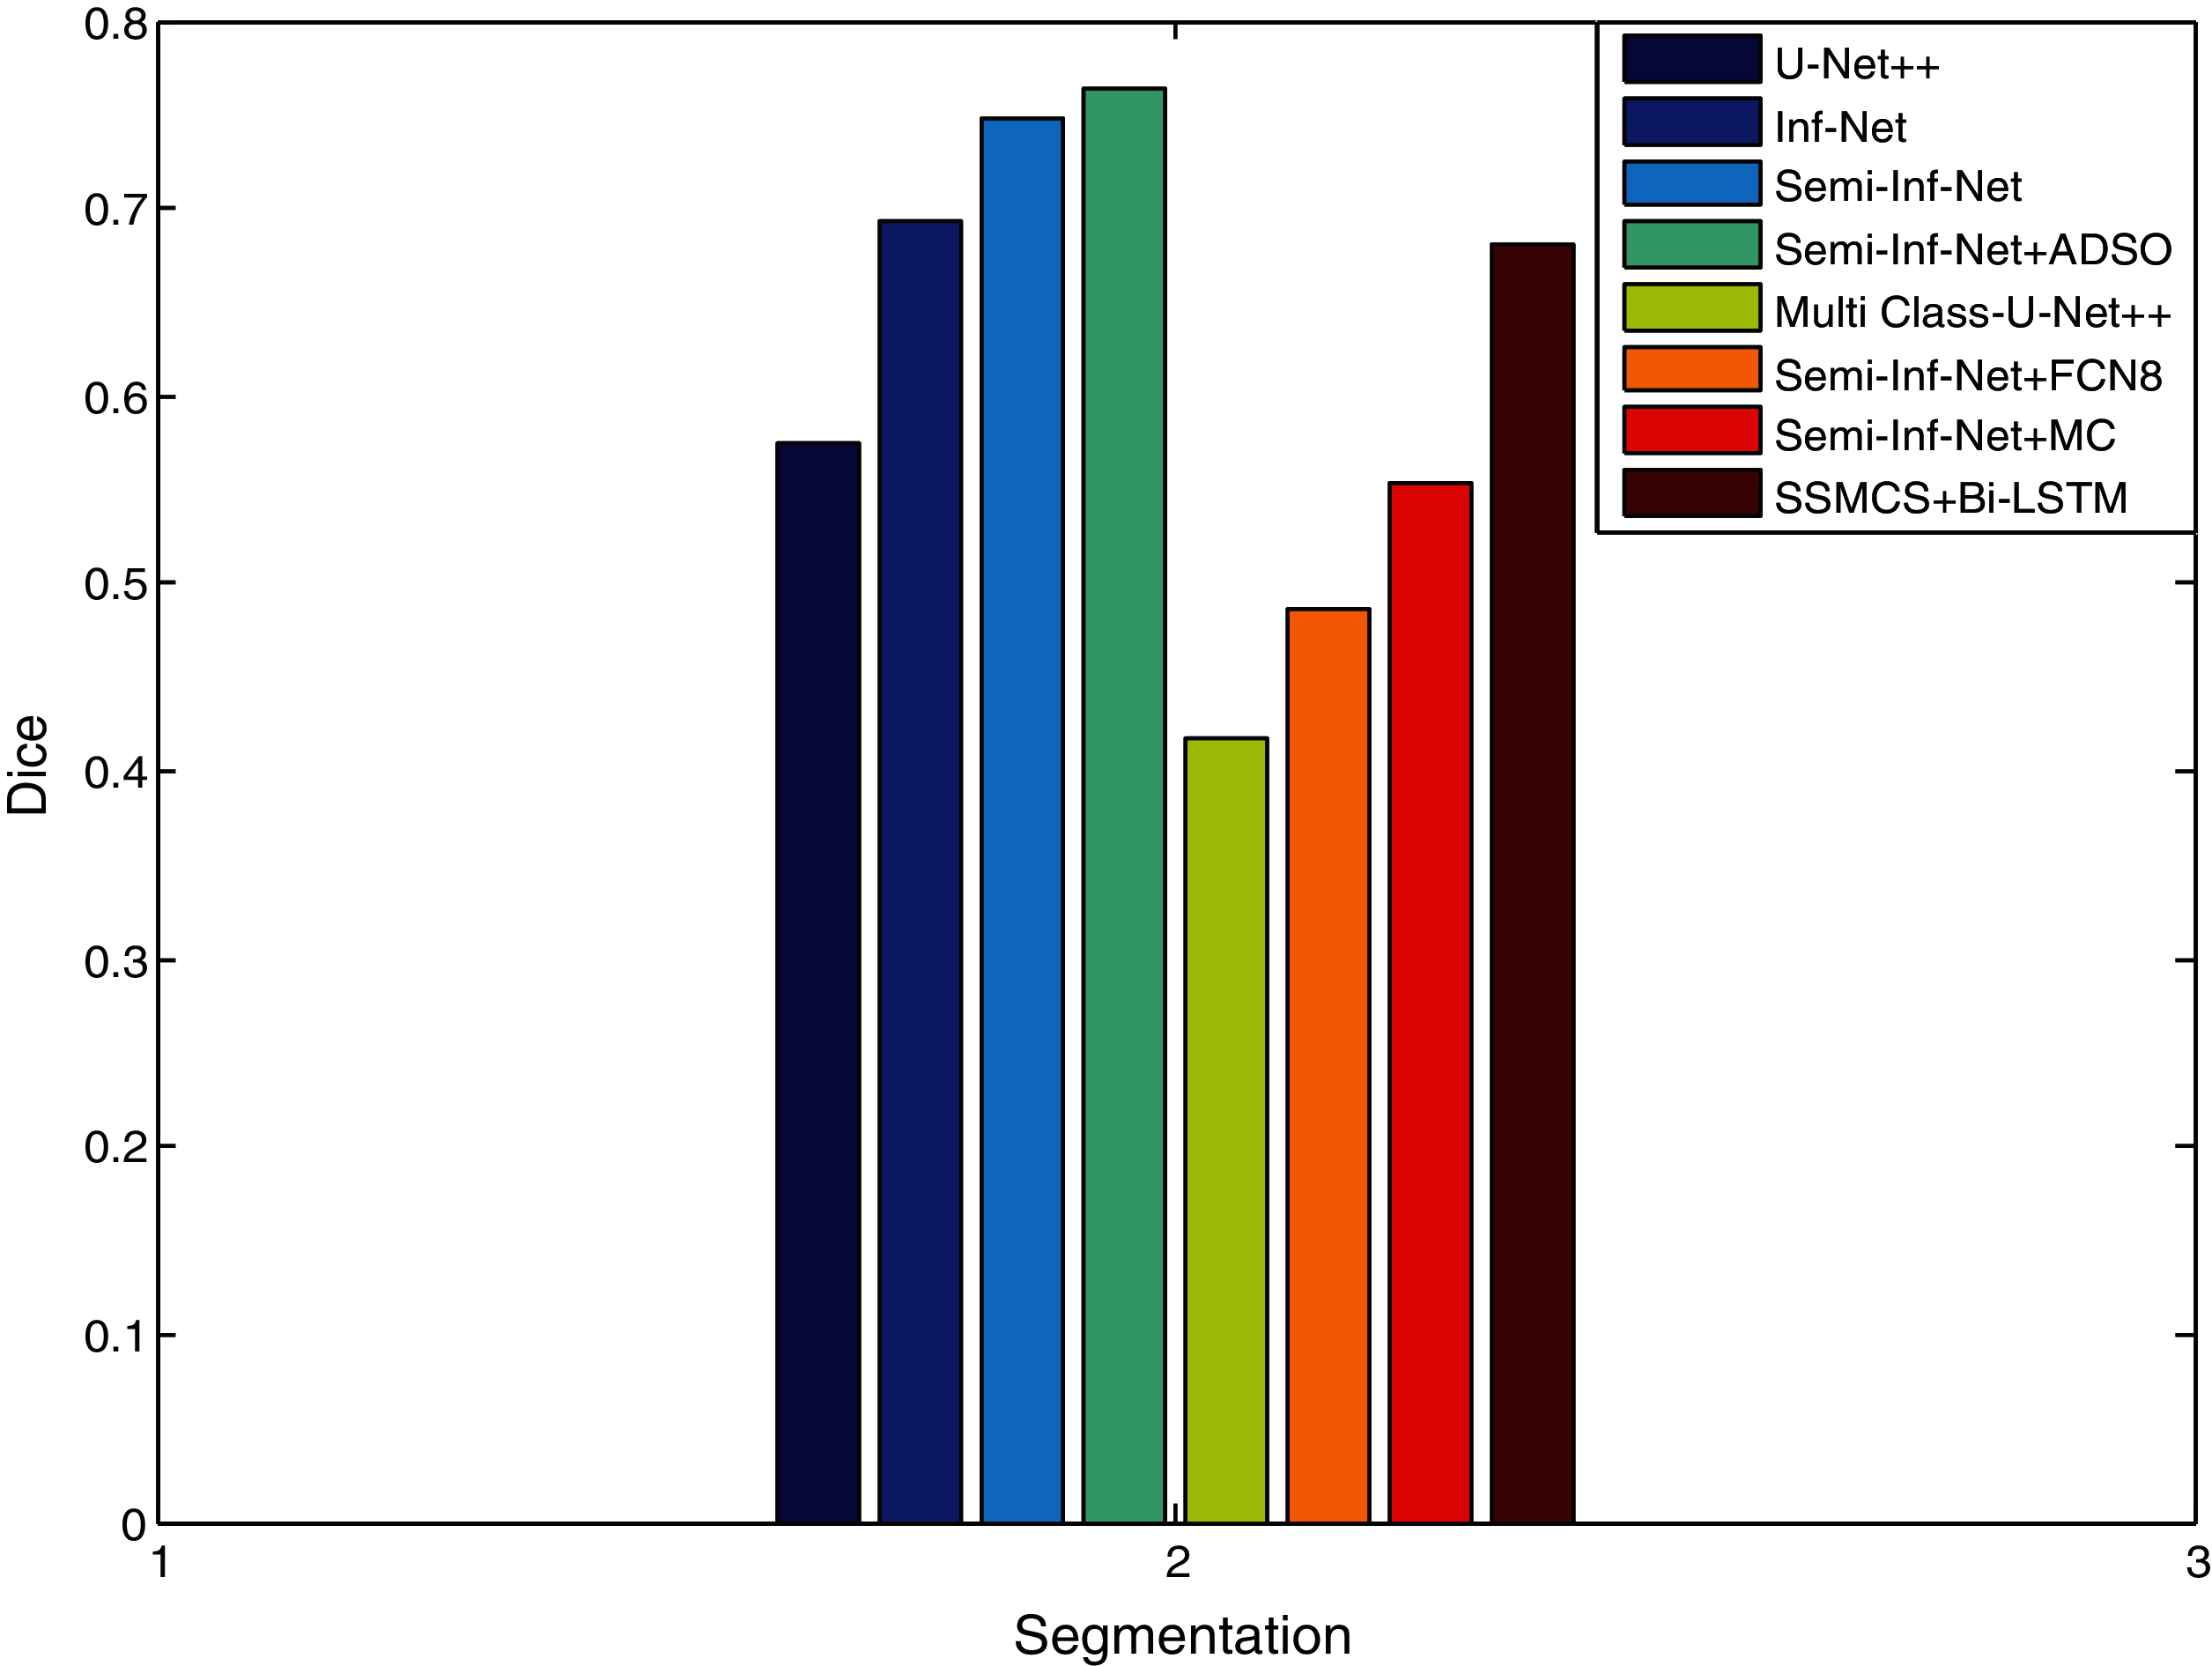
Figure 5: DICE similarity measure comparison vs. methods
The proposed SSMCS + Bi-LSTM and Semi-Inf-Net + ADSO classifier gives dice value of 0.681 and 0.764, the other methods such as U-Net++, Inf-Net, Semi-Inf-Net, MC-U-Net++, Semi-Inf-Net+FCN8, and Semi-Inf-Net+MC gives dice value of 0.575, 0.694, 0.748, 0.418, 0.486, and 0.553 respectively (See Tabs. 1 and 2).
The dice similarity of the Semi-Inf-Net + ADSO is higher when compared to other methods since the Edge-Attention Representation (EAR) is optimized via the ADSO algorithm. Fig. 6 shows that the proposed SSMCS+Bi-LSTM and Semi-Inf-Net + ADSO classifier provides a better sensitivity results when compared to existing approaches. The findings show that as compared to Inf-Net approaches, lung infection multi-class approaches have lower sensitivity.
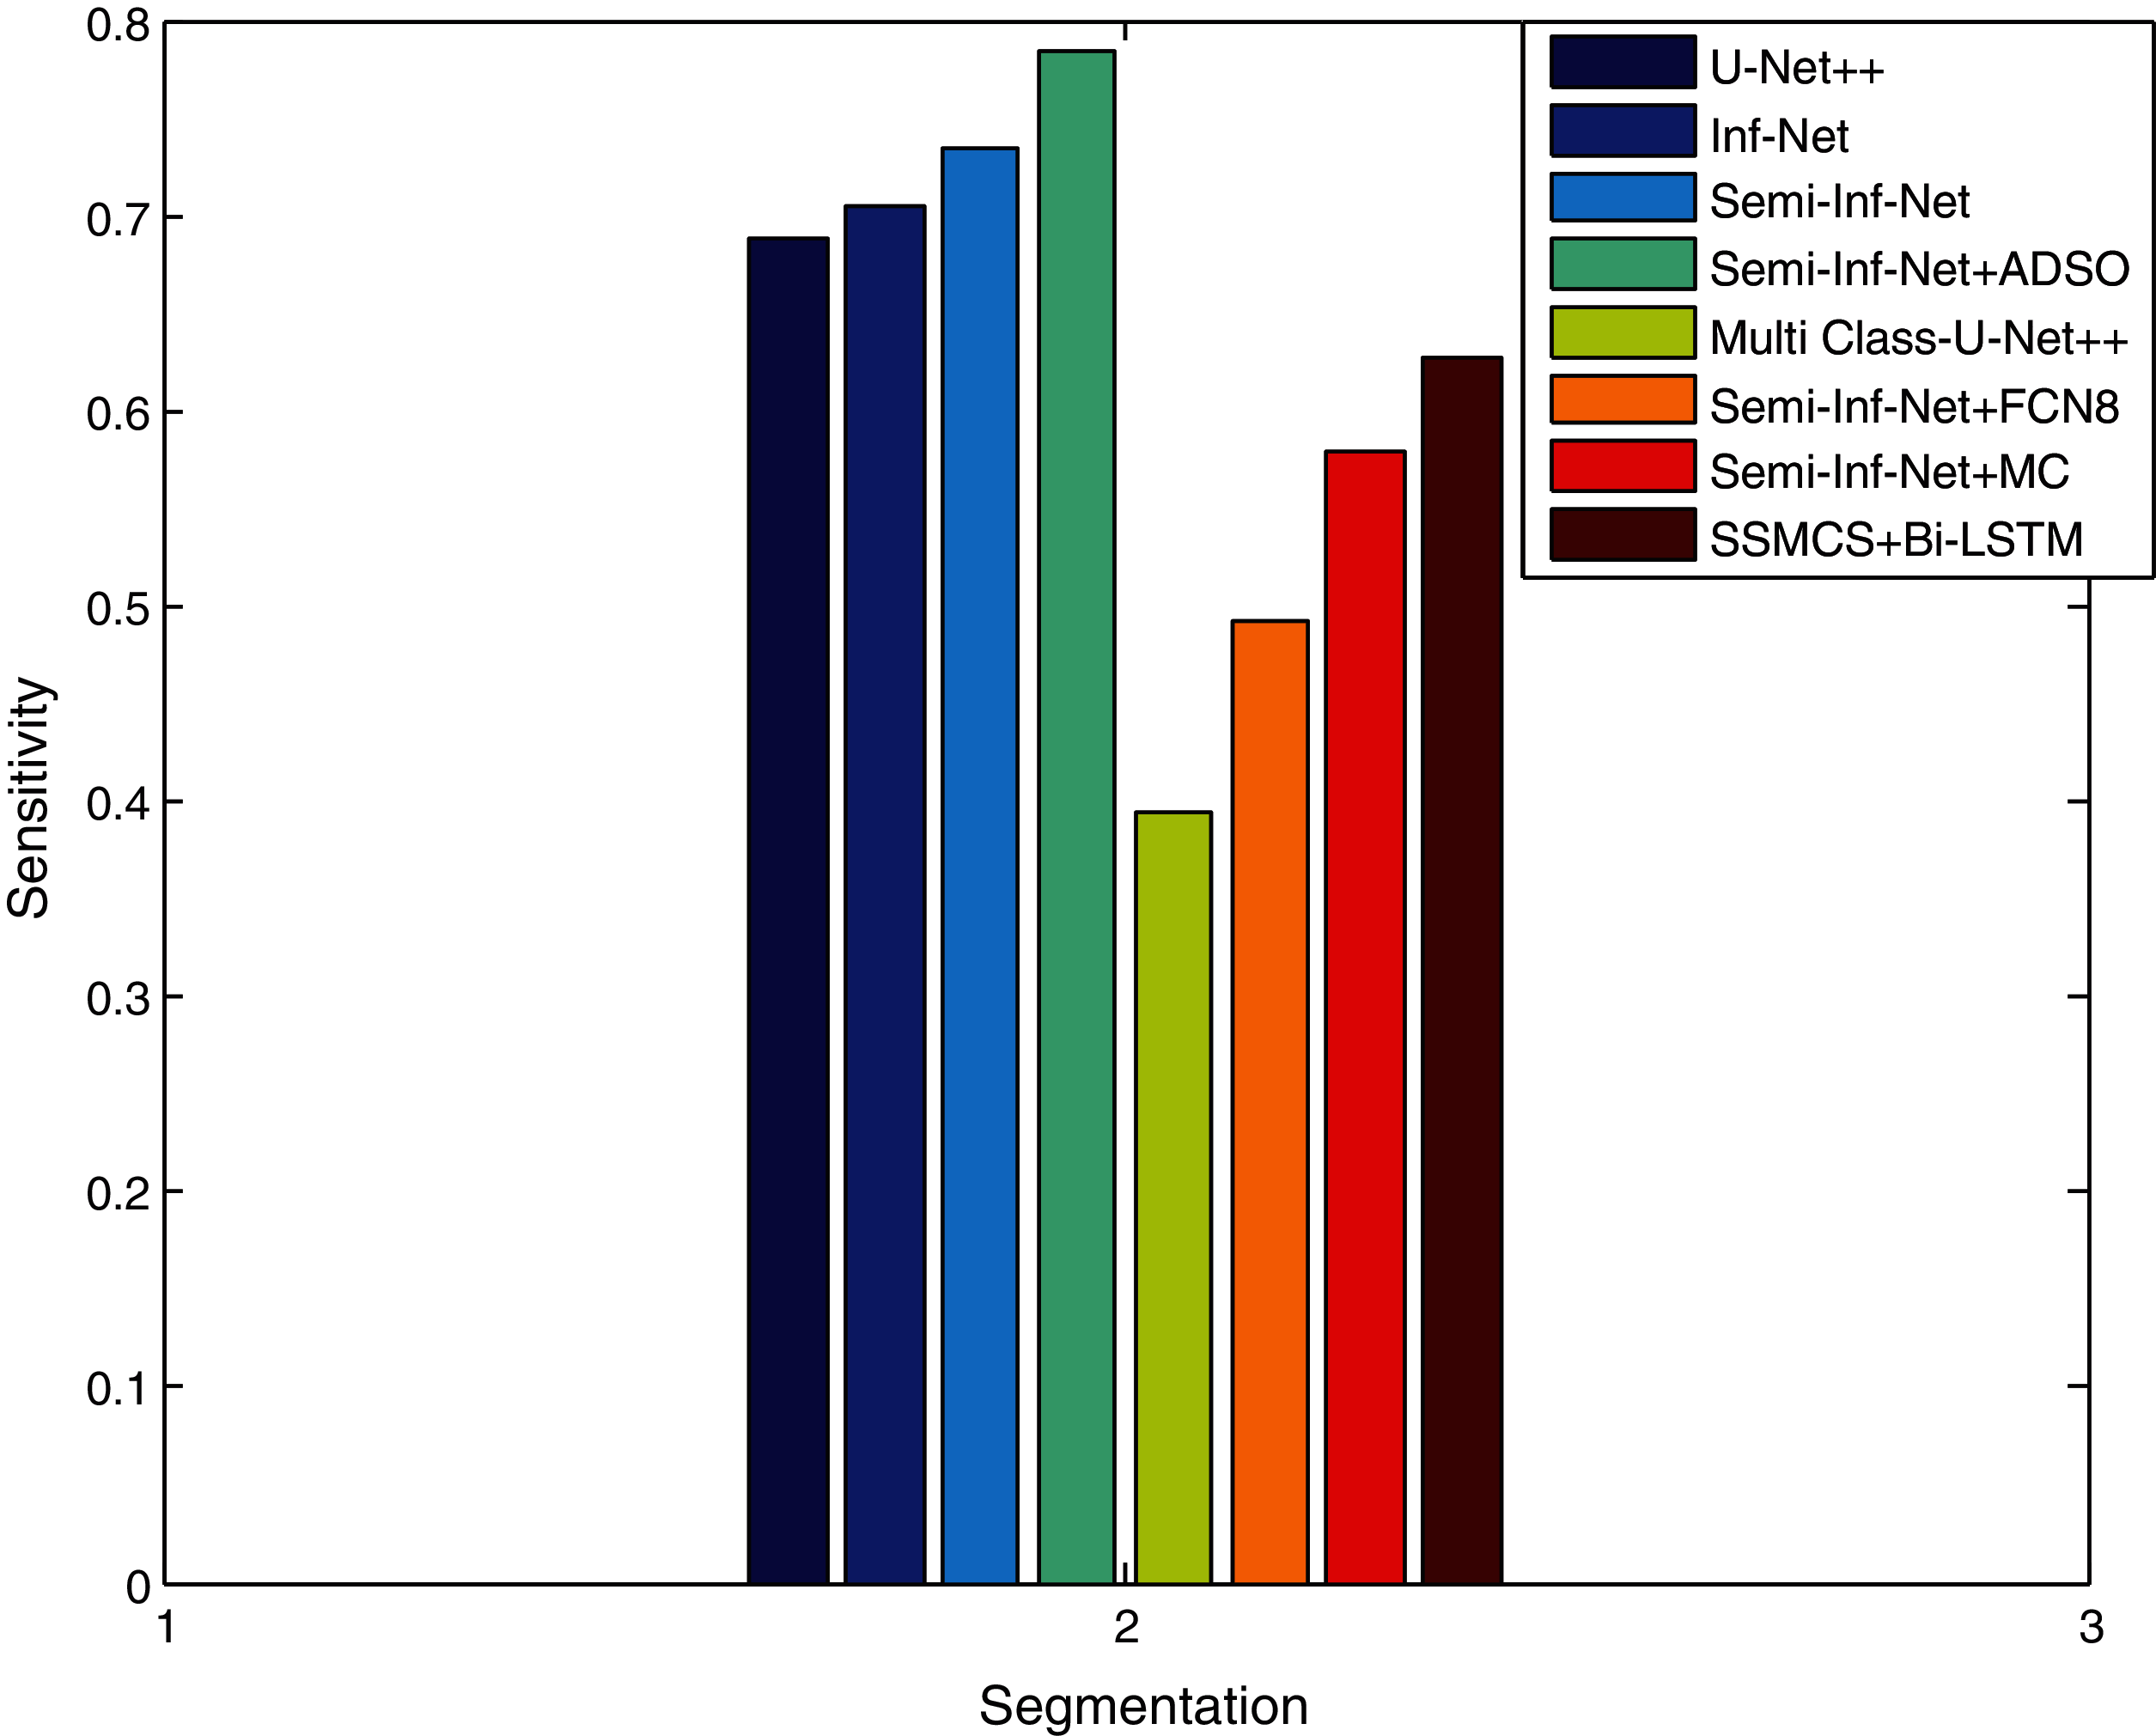
Figure 6: Sensitivity comparison vs. methods
Fig. 7 compares segmentation approaches such as Semi-Inf-Net and Inf-Net with classifiers with regard to specificity. Other techniques like Sem-Inf-Net + FCN8, U-Net++, Sem-Inf-Net + MC, Inf-Net, MC-U-Net++ and Semi-Inf-Net gives values of 88.2%, 88.5%, 97.4%, 92.2%, 94.1%, 97.)% respectively, while the proposed Semi-Inf-Net + ADSO and SSMCS + Bi-LSTM classifier gives 97.8% and 98.6%.(See Tabs. 1 and 2). Fig. 8 shows segmentation approaches like Semi-Inf-Net and Inf-net with structural classifiers. Other approaches such as U-Net, Inf-Net, Semi-Inf-Net, MC-U-Net++, Semi-Inf-Net + MC are proposed for a value of 0.736, 0.794, 0.815, 0.601, 0.668, and 0.684 respectively; and 0.735 and 0.638 and 0.640 are provided by the SSCMS + Bi-LSTM and SSI-NET + ADSO classifiers(See Tabs. 1 and 2). The result shows that when compared to typical Inf-Net classifiers, the Semi-Inf-Net + MCS produce lower error outputs.
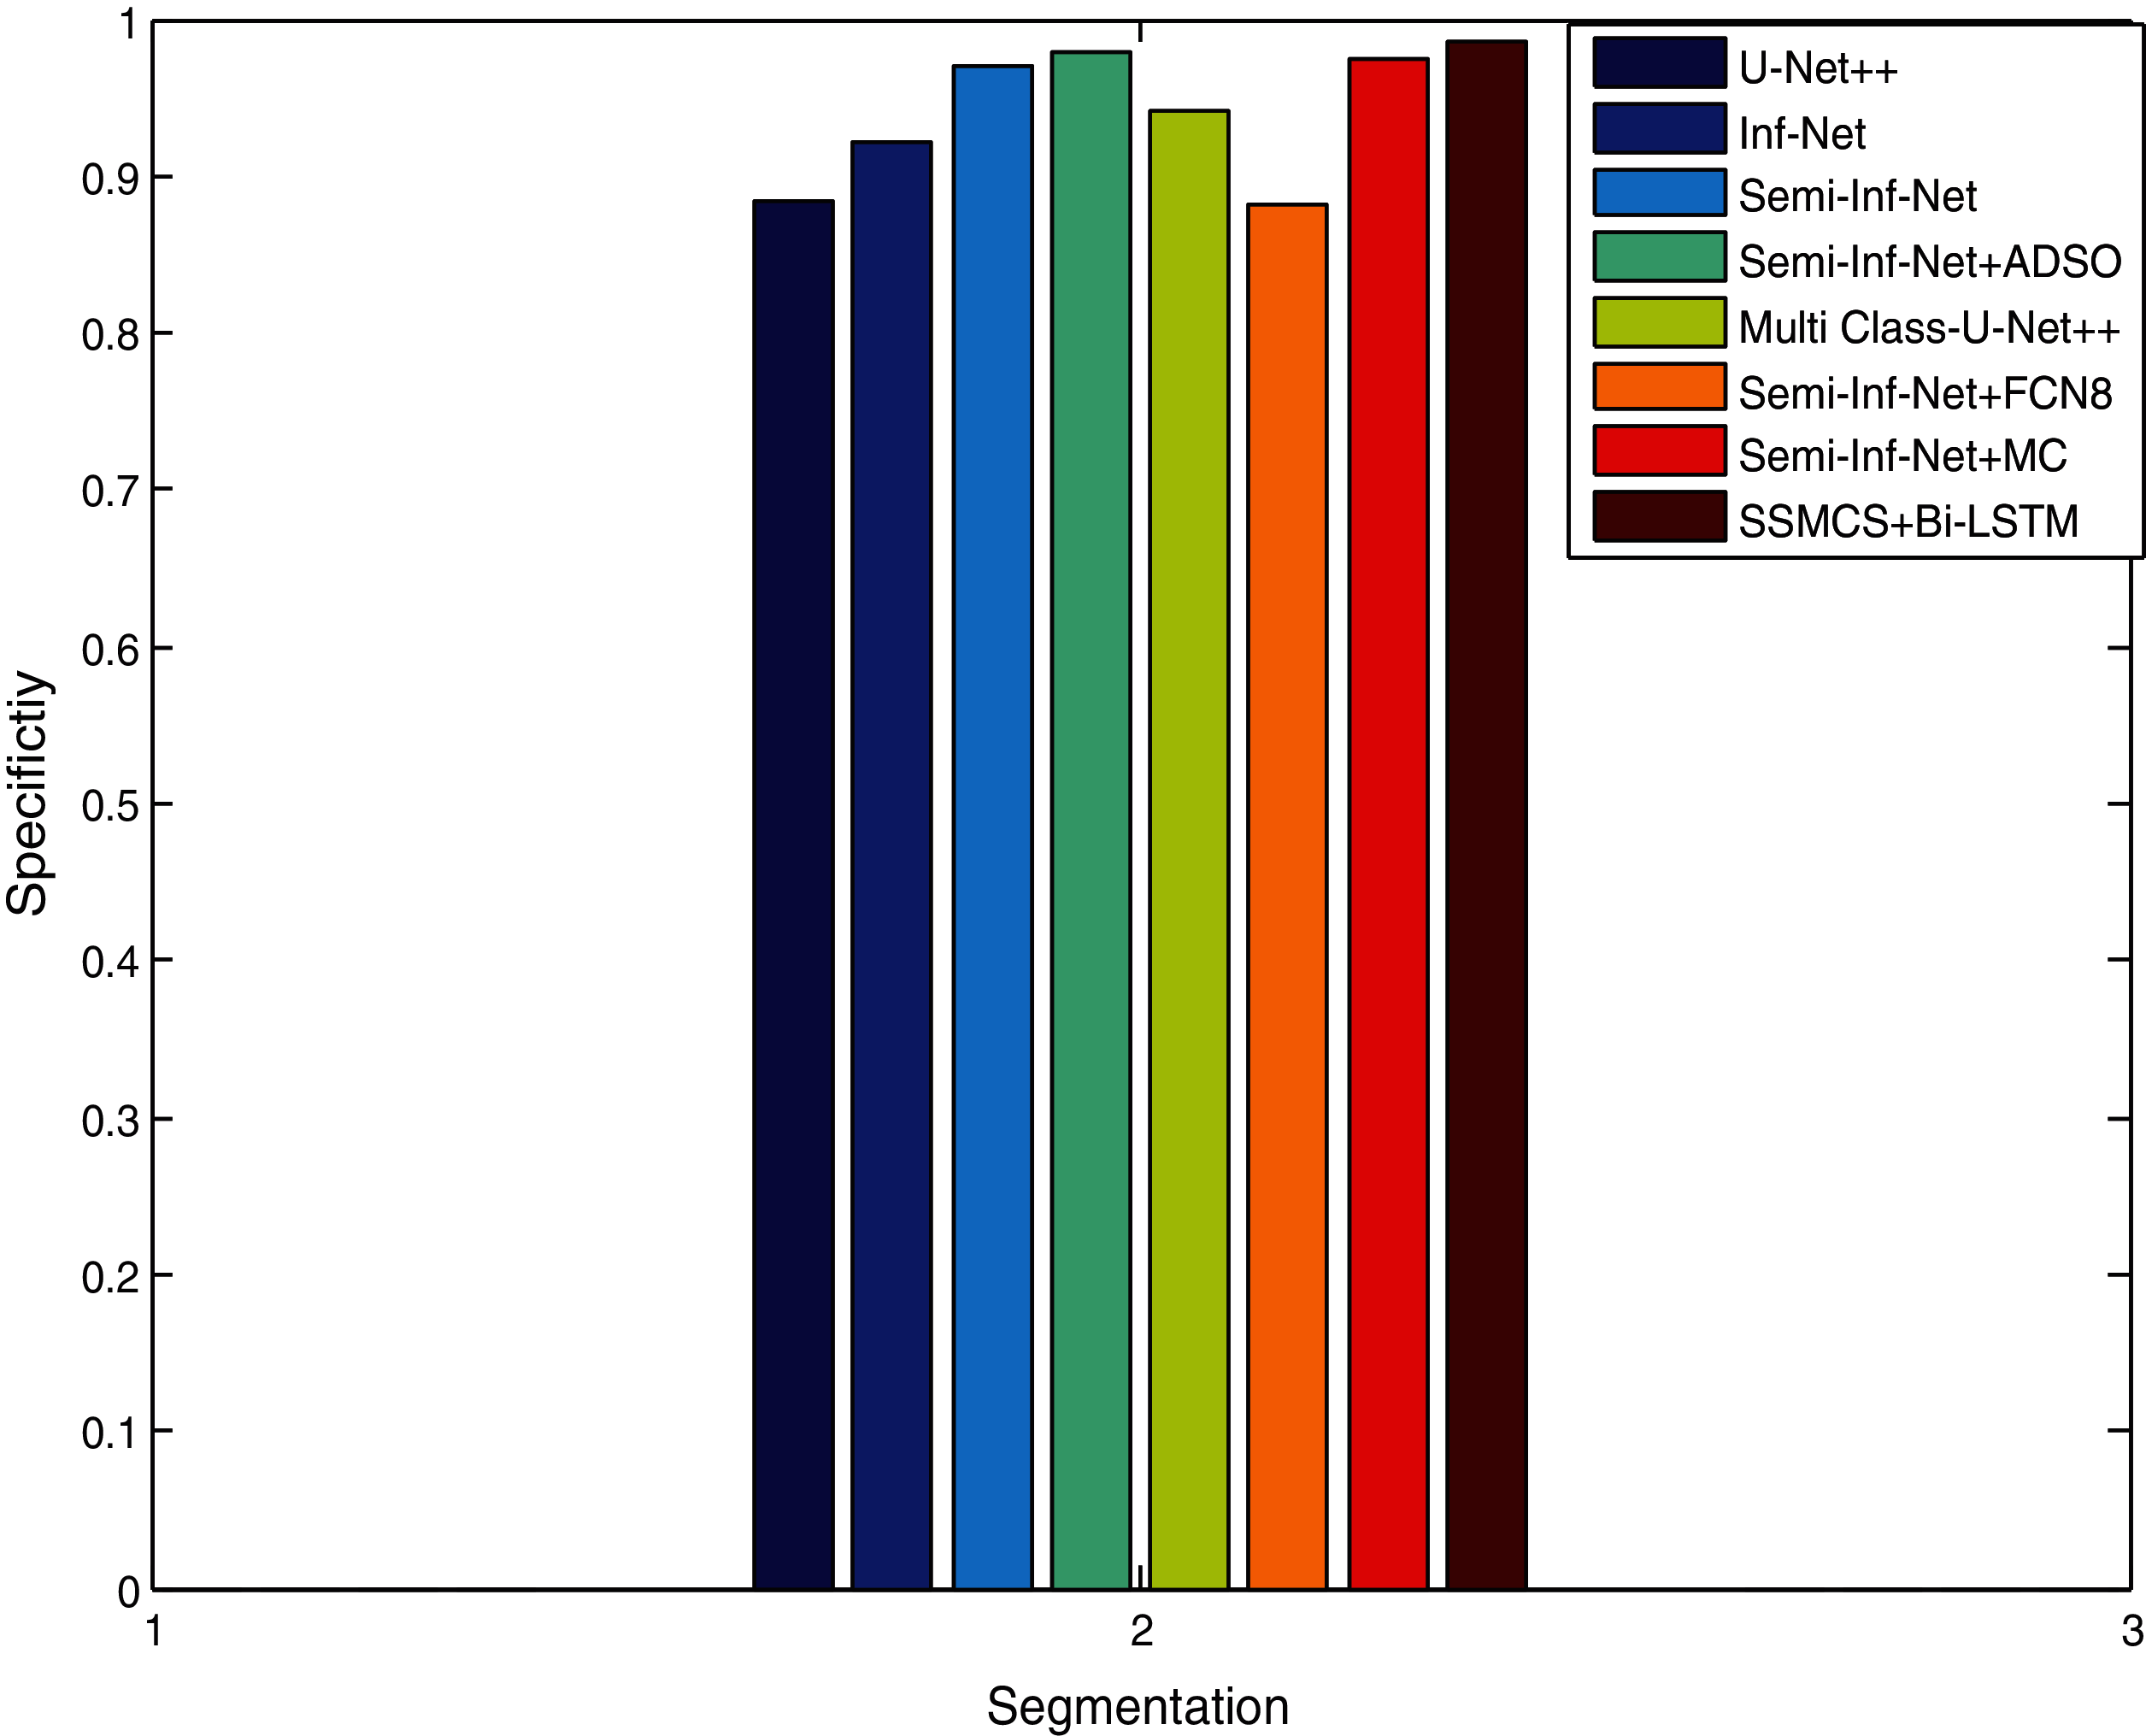
Figure 7: Specificity comparison vs. methods
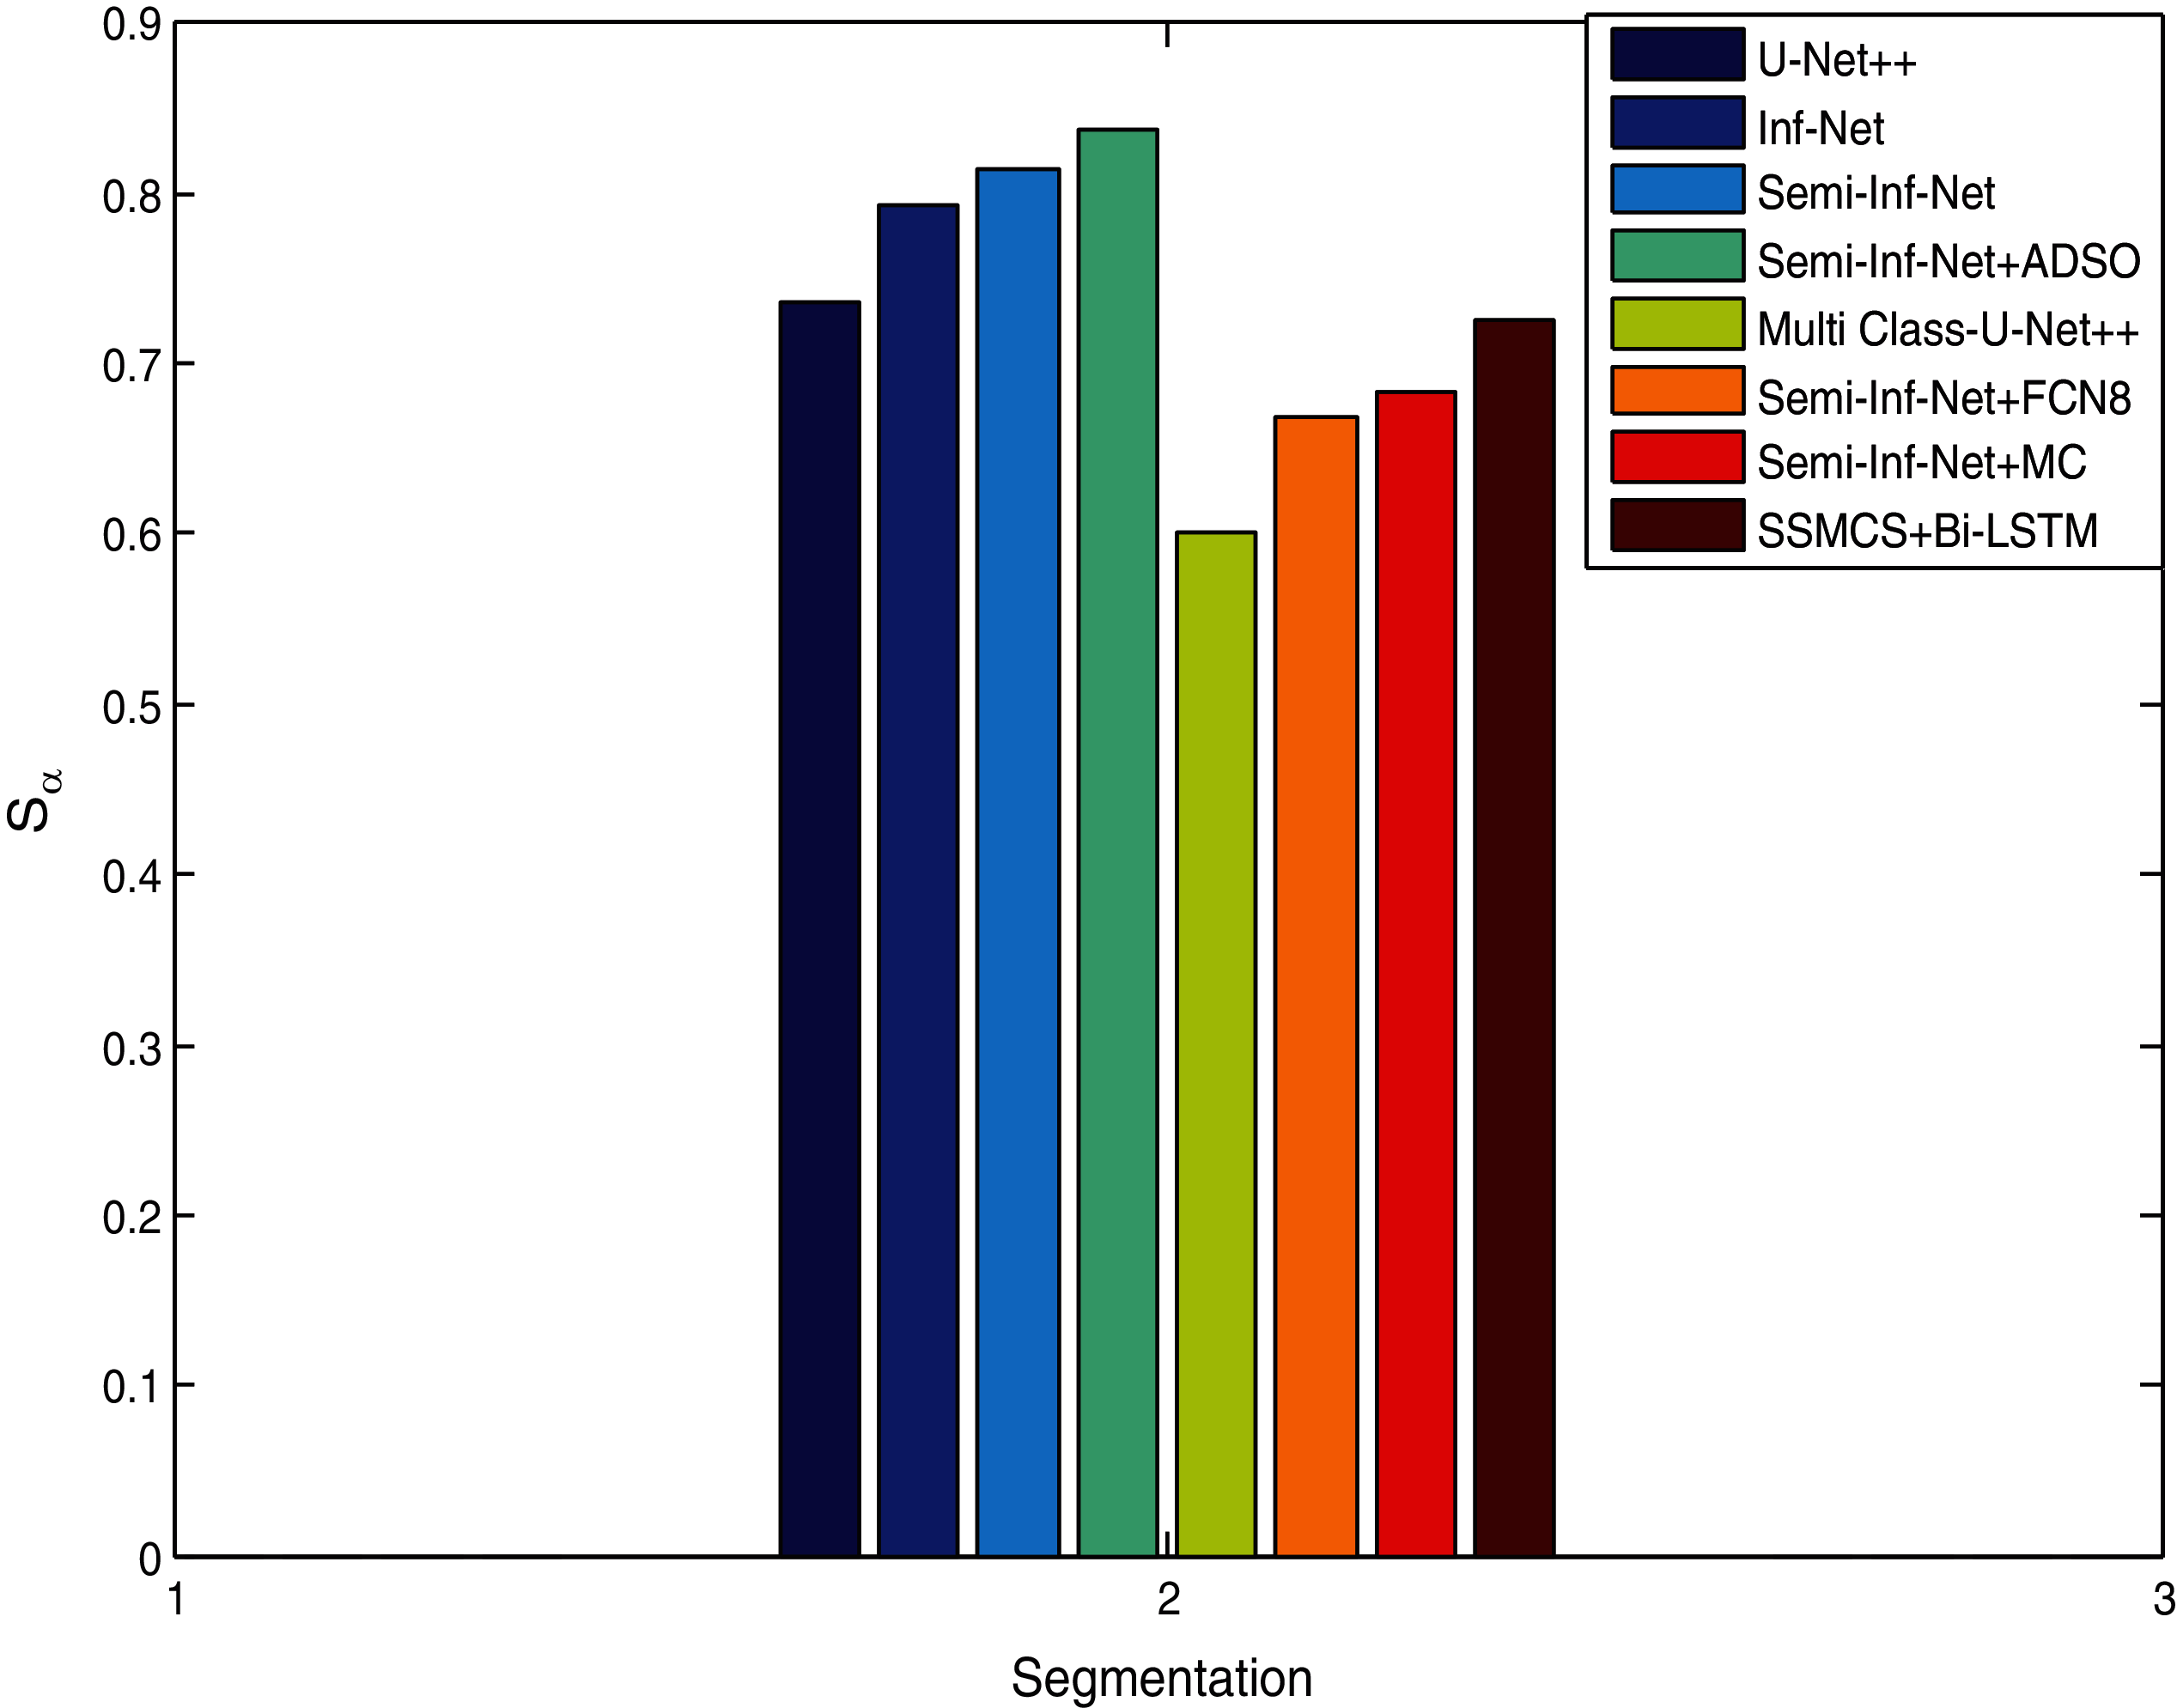
Figure 8: Structure measure comparison vs. methods
5 Conclusion with Future Enhancement
The article suggested innovative COVID’19 lung computerized tomography disease segmentation network that employs an explicit edge-attention and implicit reverse attention to augment the region affected with infection, named as Semi-Supervised version of Inf-Net. Improving the segmentation accuracy illustrates how a semi-supervised learning framework can increase fewer amounts of training samples. PPD is used to construct a global map and merge high-level attributes. To learn edge representation by Adaptive Donkey and Smuggler Optimization (ADSO), an Edge Attention (EA) module is suggested. The ground truth edge map similarity and produced edge map are calculated via an algorithm known as the Intuitionistic Fuzzy C-Means (IFCM). The Bi-LSTM is introduced for multi-class segmentation. The random sampling strategy enlarges the training set with unlabeled data in the Sem-Inf-Net, and it is a multi-class infection labelling that is introduced to get the infection regions of different types of lung infections. In multiple layers, the output at each timestep from both directions becomes the input of the Bi-LSTM in the next layer. The accuracy of the method is dropped while considering non-affected pieces. As a scope of future work, running an extra portion-wise classification model (e.g., affected Vs non-affected) is an efficient solution for evading the execution drop of a non-affected slice.
Acknowledgement: This research was funded by the Deanship of Scientific Research at Princess Nourah bint Abdulrahman University through the Fast-track Research Funding Program.
Funding Statement: This research was funded by the Deanship of Scientific Research at Princess Nourah bint Abdulrahman University through the Fast-track Research Funding Program.
Conflicts of Interest: The authors unanimously declare that they have no interest in reporting the present study.
1. N. Zhu, D. Zhang, W. Wang, X. Li, B. Yang et al., “A novel coronavirus from patients with pneumonia in China,” New England Journal of Medicine, vol. 382, no. 8, pp. 727–733, 2020. [Google Scholar]
2. C. I. Paules, H. D. Marston and A. S. Fauci, “Coronavirus infections—more than just the common cold,” Jama, vol. 323, no. 8, pp. 707–708, 2020. [Google Scholar]
3. Y. Bai, L. Yao, T. Wei, F. Tian, D. Y. Jin et al., “Presumed asymptomatic carrier transmissio n of COVID-19,” Jama, vol. 323, no. 14, pp. 1406–1407, 2020. [Google Scholar]
4. H. X. Bai, B. Hsieh, Z. Xiong, K. Halsey, J. W. Choi et al., “Performance of radiologists in differentiating COVID-19 from non-COVID-19 viral pneumonia at chest CT,” Radiology, vol. 296, no. 2, pp. E46–E54, 2020. [Google Scholar]
5. P. Rajpurkar, J. Irvin, K. Zhu, B. Yang, H. Mehta, T. Duan et al., “Chexnet: Radiologist-level pneumonia detection on chest x-rays with deep learning,” arXiv preprint arXiv:1711.05225, pp. 1–7, 2017. [Google Scholar]
6. Y. Fang, H. Zhang, J. Xie, M. Lin, L. Ying et al., “Sensitivity of chest CT for COVID-19: Comparison to RT-PCR,” Radiology, vol. 296, no. 2, pp. E115–E117, 2020. [Google Scholar]
7. D. Wang, B. Hu, C. Hu, F. Zhu, X. Liu et al., “Clinical characteristics of 138 hospitalized patients with 2019 novel coronavirus–infected pneumonia in Wuhan, China,” Jama, vol. 323, no. 11, pp. 1061–1069, 2020. [Google Scholar]
8. V. Rajinikanth, N. Dey, A. N. J. Raj, A. E. Hassanien, K. C. Santosh et al., “Harmony-search and otsu based system for coronavirus disease (COVID-19) detection using lung CT scan images,” arXiv preprint arXiv: 2004.03431, pp. 1–13, 2020. [Google Scholar]
9. L. Wang, Z. Q. Lin and A. Wong, “Covid-net: A tailored deep convolutional neural network design for detection of covid-19 cases from chest x-ray images,” Scientific Reports, vol. 10, no. 1, pp. 1–12, 2020. [Google Scholar]
10. X. Xu, X. Jiang, C. Ma, P. Du, X. Li et al., “A deep learning system to screen novel coronavirus disease 2019 pneumonia,” Engineering, vol. 6, no. 10, pp. 1122–1129, 2020. [Google Scholar]
11. S. Wang, B. Kang, J. Ma, X. Zeng, M. Xiao et al., “A deep learning algorithm using CT images to screen for corona virus disease (COVID-19),” MedRxiv, pp. 1–26, 2020. [Google Scholar]
12. J. Chen, L. Wu, J. Zhang, L. Zhang, D. Gong et al., “Deep learning-based model for detecting 2019 novel coronavirus pneumonia on high-resolution computed tomography,” Scientific Reports, vol. 10, no. 1, pp. 1–11, 2020. [Google Scholar]
13. O. Gozes, M. Frid-Adar, H. Greenspan, P. D. Browning, H. Zhang et al., “Rapid ai development cycle for the coronavirus (covid-19) pandemic: Initial results for automated detection & patient monitoring using deep learning ct image analysis,” arXiv preprint arXiv:2003.05037, pp. 1–22, 2020. [Google Scholar]
14. Z. Tang, W. Zhao, X. Xie, Z. Zhong, F. Shi et al., “Severity assessment of coronavirus disease 2019 (COVID-19) using quantitative features from chest CT images,” arXiv preprint arXiv:2003.11988, pp. 1–18, 2020. [Google Scholar]
15. Y. Song, S. Zheng, L. Li, X. Zhang, X. Zhang et al., “Deep learning enables accurate diagnosis of novel coronavirus (COVID-19) with CT images,” MedRxiv, pp. 1–10, 2020. [Google Scholar]
16. F. Shan, Y. Gao, J. Wang, W. Shi, N. Shi et al., “Lung infection quantification of COVID-19 in CT images with deep learning,” arXiv preprint arXiv:2003.04655, pp. 1–19, 2020. [Google Scholar]
17. Q. Yan, B. Wang, D. Gong, C. Luo, W. Zhao et al., “COVID-19 chest CT image segmentation--a deep convolutional neural network solution,” arXiv preprint arXiv:2004.10987, pp. 1–10, 2020. [Google Scholar]
18. A. Amyar, R. Modzelewski, H. Li and S. Ruan, “Multitask deep learning based CT imaging analysis for COVID-19 pneumonia: Classification and segmentation,” Computers in Biology and Medicine, pp. 1–10, 2020. [Google Scholar]
19. M. Polsinelli, L. Cinque and G. Placidi, “A light CNN for detecting covid-19 from CT scans of the chest,” Pattern Recognition Letters, pp. 95–100, 2020. [Google Scholar]
20. L. Li, L. Qin, Z. Xu, Y. Yin, X. Wang et al., “Artificial intelligence distinguishes COVID-19 from community acquired pneumonia on chest CT,” Radiology, vol. 296, pp. 1–15, 2020. [Google Scholar]
21. A. Jaiswal N. Gianchandani, D. Singh, V. Kumar and M. Kaur, “Classification of the COVID-19 infected patients using densenet201 based deep transfer learning,” Journal of Biomolecular Structure and Dynamics, vol. 39, no. 15, pp. 1–8, 2020. [Google Scholar]
22. S. A. Harmon, T. H. Sanford, S. Xu, E. B. Turkbey, H. Roth et al., “Artificial intelligence for the detection of COVID-19 pneumonia on chest CT using multinational datasets,” Nature Communications, vol. 11, no. 1, pp. 1–7, 2020. [Google Scholar]
23. D. P. Fan, T. Zhou, G. P. Ji, Y. Zhou, G. Chen et al., “Inf-net: Automatic covid-19 lung infection segmentation from CT images,” IEEE Transactions on Medical Imaging, vol. 39, no. 8, pp. 2626–2637, 2020. [Google Scholar]
24. R. Jain, M. Gupta, S. Taneja and D. J. Hemanth, “Deep learning based detection and analysis of COVID-19 on chest X-ray images,” Applied Intelligence, pp. 1–11, 2020. [Google Scholar]
25. J. X. Zhao, J. J. Liu, D. P. Fan, Y. Cao, J. Yang et al., “EGNet: Edge guidance network for salient object detection,” in Proc. of the IEEE/CVF Int. Conf. on Computer Vision, Seoul, Korea (Southpp. 8779–8788, 2019. [Google Scholar]
26. Z. Wu, L. Su and Q. Huang, “Stacked cross refinement network for edge-aware salient object detection,” in Proc. of the IEEE/CVF Int. Conf. on Computer Vision, Seoul, Korea (Southpp. 7264–7273, 2019. [Google Scholar]
27. A. S. Shamsaldin, T. A. Rashid, R. A. Al-Rashid Agha, N. K. Al-Salihi and M. Mohammadi, “Donkey and smuggler optimization algorithm: A collaborative working approach to path finding,” Journal of Computational Design and Engineering, vol. 6, no. 4, pp. 562–583, 2019. [Google Scholar]
28. Z. Xu and J. Wu, “Intuitionistic fuzzy C-means clustering algorithms,” Journal of Systems Engineering and Electronics, vol. 21, no. 4, pp. 580–590, 2010. [Google Scholar]
29. K. C. Hung, “Medical pattern recognition: Applying an improved intuitionistic fuzzy cross-entropy approach,” Advances in Fuzzy Systems, vol. 2012, no. 863549, pp. 1–6, 2012. [Google Scholar]
30. S. Gao, M. M. Cheng, K. Zhao, X. Y. Zhang, M. H. Yang et al., “Res2net: A new multi-scale backbone architecture,” IEEE Transactions on Pattern Analysis and Machine Intelligence, vol. 43, no. 2, pp. 652–662, 2019. [Google Scholar]
 | This work is licensed under a Creative Commons Attribution 4.0 International License, which permits unrestricted use, distribution, and reproduction in any medium, provided the original work is properly cited. |