DOI:10.32604/cmc.2022.018613
| Computers, Materials & Continua DOI:10.32604/cmc.2022.018613 | |
| Article |
Automatic Heart Disease Detection by Classification of Ventricular Arrhythmias on ECG Using Machine Learning
1Department of Computer Science and Information Technology, University of Sargodha, Sargodha, 40100, Pakistan
2School of Systems and Technology, University of Management and Technology, Lahore, 54782, Pakistan
3COMSAT University Islamabad, Wah Campus, Wah Cantt, Pakistan
4College of Computer Engineering and Sciences, Prince Sattam Bin Abdulaziz University, Al-Khraj, Saudi Arabia
5Department of ICT Convergence, Soonchunhyang University, Asan, 31538, Korea
6Department of Computer Science, HITEC University Taxila, Pakistan
*Corresponding Author: Yunyoung Nam. Email: ynam@sch.ac.kr
Received: 14 March 2021; Accepted: 18 April 2021
Abstract: This paper focuses on detecting diseased signals and arrhythmias classification into two classes: ventricular tachycardia and premature ventricular contraction. The sole purpose of the signal detection is used to determine if a signal has been collected from a healthy or sick person. The proposed research approach presents a mathematical model for the signal detector based on calculating the instantaneous frequency (IF). Once a signal taken from a patient is detected, then the classifier takes that signal as input and classifies the target disease by predicting the class label. While applying the classifier, templates are designed separately for ventricular tachycardia and premature ventricular contraction. Similarities of a given signal with both the templates are computed in the spectral domain. The empirical analysis reveals precisions for the detector and the applied classifier are 100% and 77.27%, respectively. Moreover, instantaneous frequency analysis provides a benchmark that IF of a normal signal ranges from 0.8 to 1.1 Hz whereas IF range for ventricular tachycardia and premature ventricular contraction is 0.08–0.6 Hz. This indicates a serious loss of high-frequency contents in the spectrum, implying that the heart’s overall activity is slowed down. This study may help medical practitioners in detecting the heart disease type based on signal analysis.
Keywords: Heart disease; signals; preprocessing; detection; machine learning
Machine learning showed significant success in the area of medicine such as heart disease classification [1], brain tumor [2,3], lung cancer [4], skin cancer [5,6], stomach [7,8], Covid19 [9,10], and detection of cancer and hypertension [11,12]. These diseases cause severe consequences; even human deaths like Cardiac Arrhythmia is one of the most common causes of death in the world. Cardiac Arrhythmia represents cardiac or heartbeat disorders. It indicates the perturbation in the normal sinus rhythm of the myocardium. In cardiac Arrhythmia, the heartbeat may be very slow, fast, or irregular. It is the unresolved clinical problem causing 0.4 million deaths in the United States annually while in Pakistan, facing cardiac Arrhythmia, and the death rate is almost 15.36% (196,258 people) [13] of total deaths. According to the statistics of the World Health Organization, the death toll caused by cardiovascular disease (CVD) is up to 17.9 million worldwide every year, accounting for 1/3 of the total death toll in the world [14].
This paper focuses on detecting diseased signals and arrhythmias classification into two target classes: ventricular tachycardia and premature ventricular contraction. The main aim is to determine if a signal was collected from a healthy or sick person. The detector works by calculating the instantaneous frequency (IF). First, a given signal is detected from a patient, and a classifier classifies the disease by predicting the class. Applying the supervised learning-based classifier, templates are designed separately for ventricular tachycardia and premature ventricular contraction. Similarities of a given signal with both the templates are computed in the spectral domain.
The heart is the central part of the human body that supplies oxygenated blood to the entire body. It is composed of four valves, and four chambers; [14] the upper chambers are called atria, while the lower chambers are called ventricles. The right ventricle is the lower right part of the heart. When the right atrium contracts, it receives deoxygenated blood. The left ventricle is the lower left part of the myocardium that accepts oxygenated blood from the atrium. The right atrium is the upper right chamber of the heart that receives deoxygenated blood from the body. Left Atrium is the upper left part of the heart. It accepts oxygenated blood from the lungs. Once both atria are filled with blood, they contract, and the oxygenated blood from the left atrium flows into the left ventricle [15]. Veins from the upper body and head go empty into the right atrium of the heart while the veins from the lower parts of the body feed into it, which goes empty into the right atrium of the heart.
Electrocardiogram (ECG) represents the amount of electrical activity vs. time. Normally, the ECG signal frequency is 0.05–100 Hz, and the dynamic range is 1–10 mv. ECG signal is recognized by its five peaks denoted by letters of the alphabets P, Q, R, S, and T [16]. Its components explain the ECG, so we present them in a separate heading as below.
As shown in Fig. 1, an ECG contains five waves (P, R, Q, S, and T). The P wave is generated with the contraction of the atria [17]. It is the small upward wave that is generated by the first deflection of the heartbeat. It indicates that the atrial vein has an electrical impulse. The magnitude of the P wave is 50–100 mili-volts, and the duration is 100 ms. After the P wave, another wave appears the heartbeat’s downward deflection, known as the Q wave. The duration of Q wave is 0.08–0.10 s. The R wave represents the second trough or second peak after the P wave. It intimates the beginning of depolarization in ventricles. The extraction of heart ventricles produces a wave known as T wave. The approximate deflection of T wave is 0.5 mv, and the duration is 0.20 s.
In the normal rhythm, the heart rate ranges from 60 to 100 bpm (beats per minute In electrocardiography. There is no disorder in the signal, then it is called normal sinus rhythm.). When the heart rate increases above 100 bpm, the rhythm is known as sinus tachycardia. If the heart rate is much slower, it is known as bradycardia [18]. Heart Arrhythmias can be categorized as Sinus Node Arrhythmias, Atrial Arrhythmias, Junctional Arrhythmias, and Ventricular arrhythmias. Disturbance in the Sinoatrial node causes the disturbance in the normal rhythm of the signal; this causes the sinus node arrhythmias [19]. During the sinus node arrhythmias, the P-wave in the ECG is normal. Atrial Arrhythmias arise outside the Sino-atrial node, forming electrical impulses. In this type of Arrhythmia, the heartbeat is very fast that ranges from 160 to 240 bpm, and the QRS complex and a T-wave are normal. The cause of the junctional arrhythmias is the atrioventricular junction node that generates the impulse. These arrhythmias cause the abnormality in P wave. In Ventricular arrhythmias, the impulses arise from the ventricles and go to the rest of the heart outwards. In ventricular arrhythmias, QRS complexes are ample and odd in shape. The ventricular arrhythmias have three types: premature ventricular contractions, ventricular tachycardia, and ventricular fibrillation, as shown in Figs. 2a–2c, respectively.
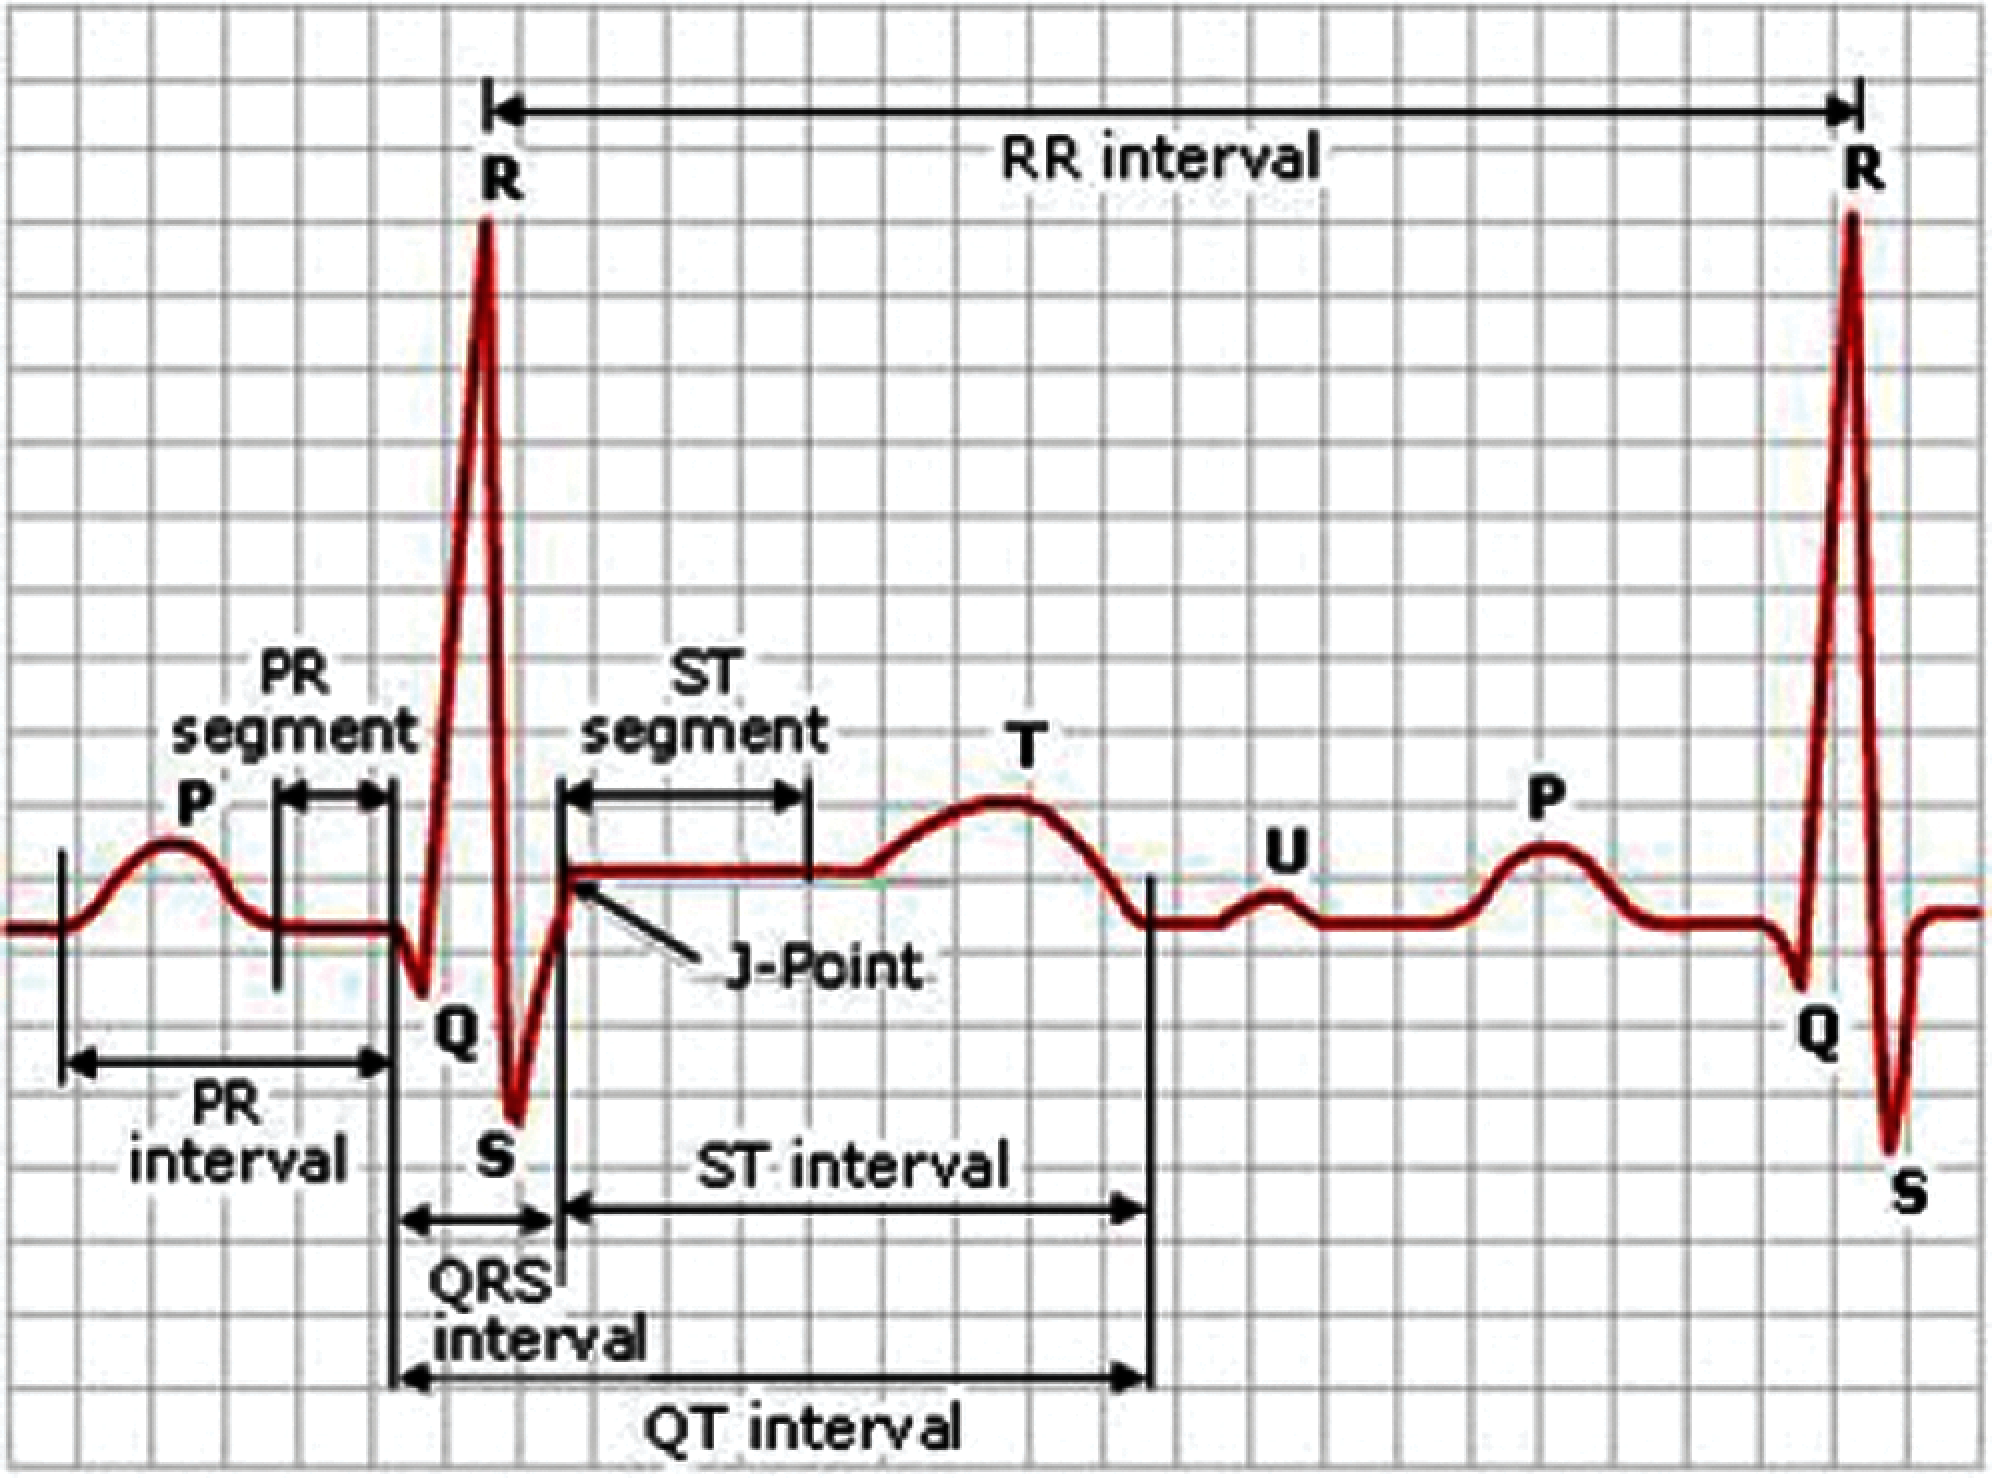
Figure 1: A sample ECG signal and its different components
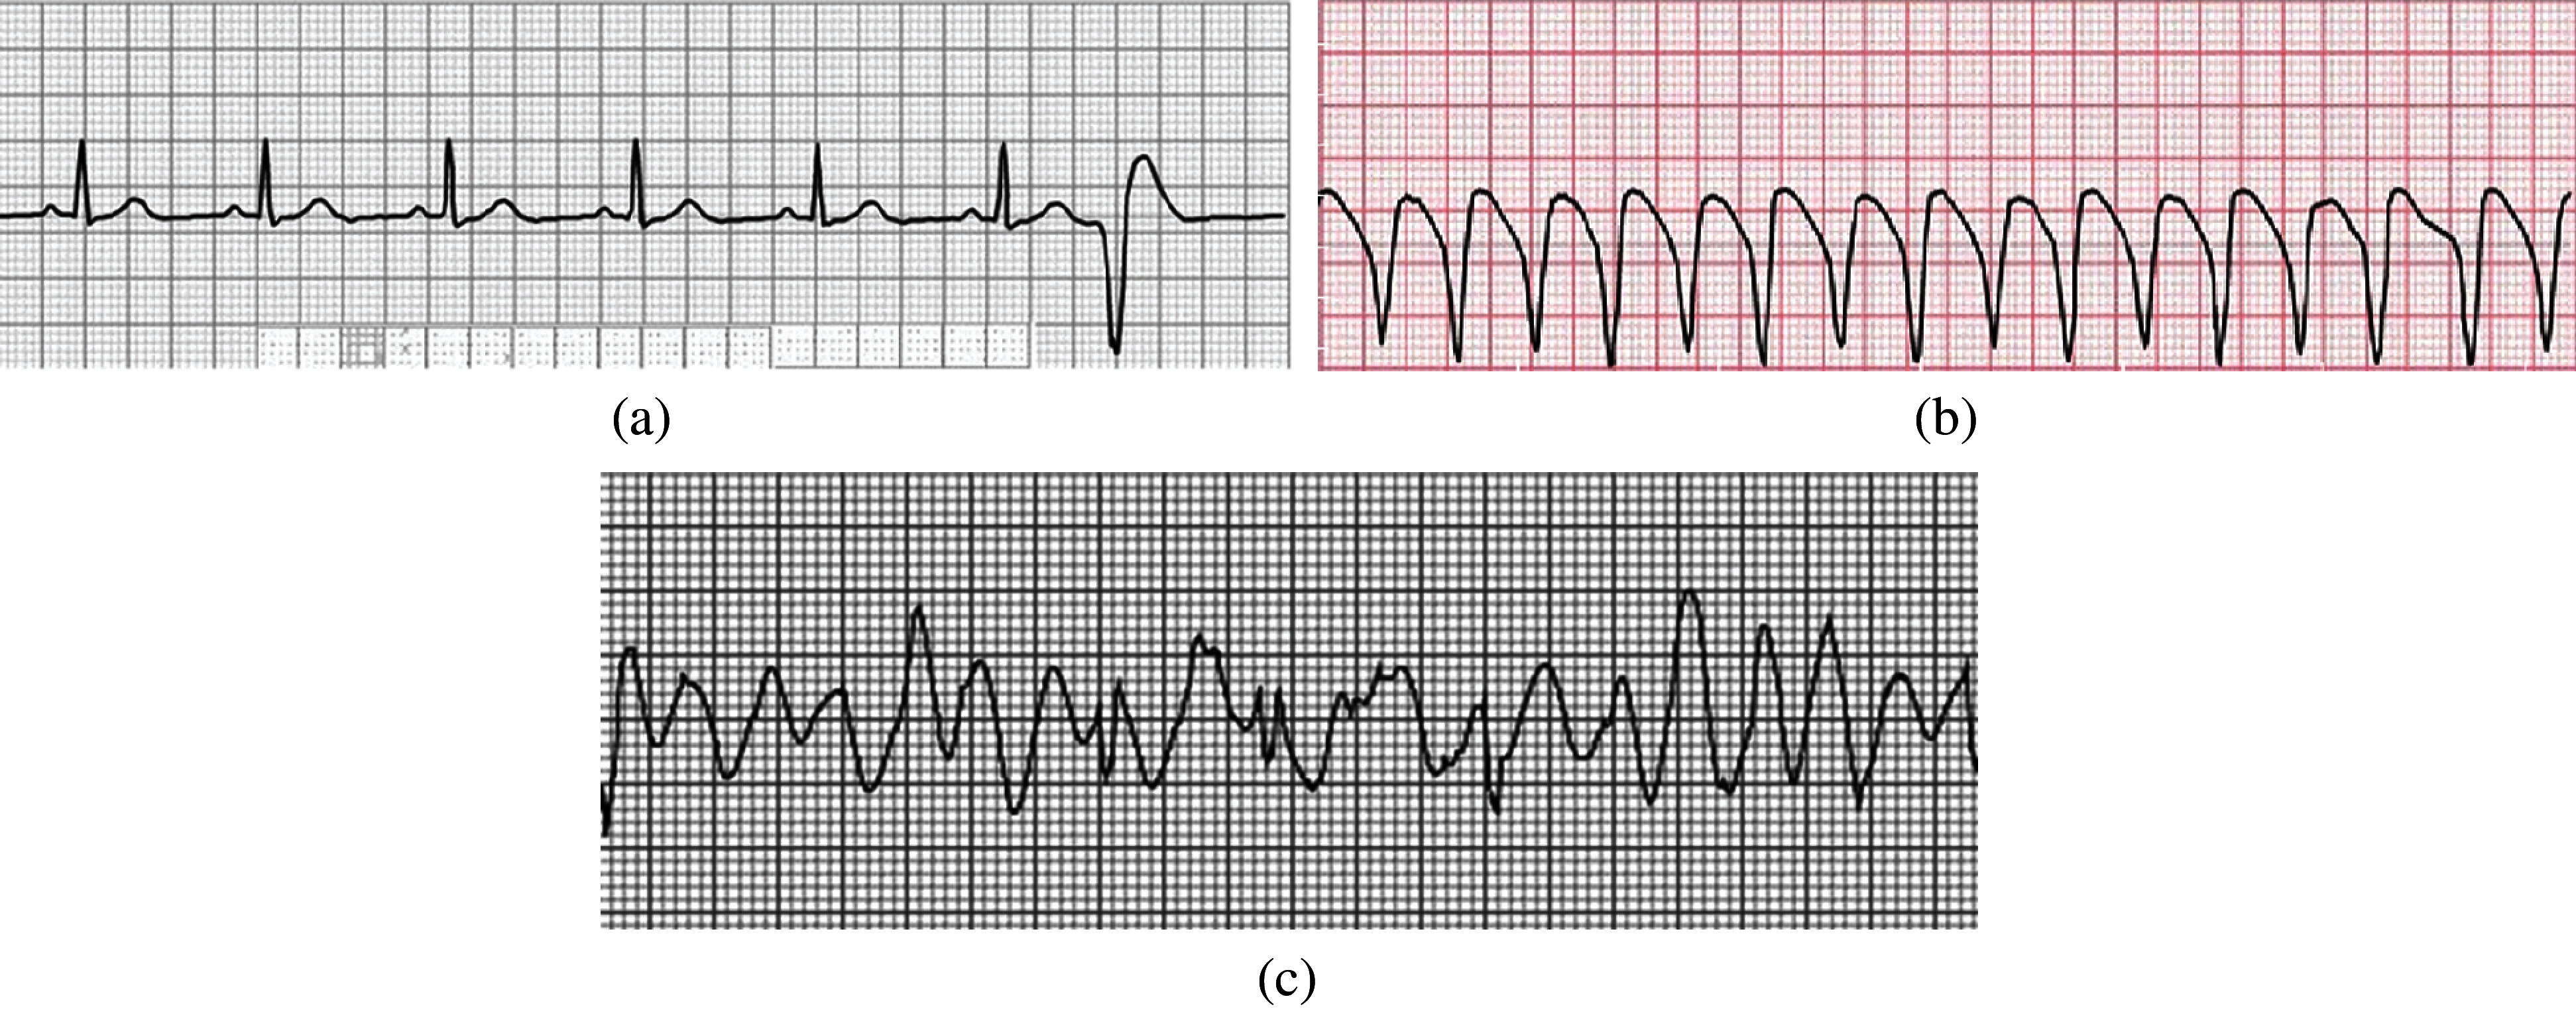
Figure 2: (a) Premature ventricular contraction (b) Ventricular tachycardia (c) Ventricular fibrillation
This work aims at detecting automatic heart disease by classification of ventricular arrhythmias on ECG using machine learning techniques.
i) The proposed methodology helps determine and detect whether the person belongs to a healthy or a diseased category.
ii) This proposed research methodology consists of preprocessing, resampling and normalization, and the detector is also designed.
iii) Mathematical modeling is presented for signal detection, template, detector.
iv) The proposed system shows enhanced performance results as compared to existing approaches I the relevant literature.
The paper’s remainder is arranged as follows: Section 2 discusses the literature work related to the problem and discusses methods related to the classification of ventricular arrhythmias from ECG; in Section 3, the research methodology followed in this paper is given. Section 4 presents and discusses the results of the findings, and in Section 5 conclusion of the overall research work is given.
Digital signal and data processing is a significant research domain in biomedical engineering research. Researchers from different parts of the world have applied different method and techniques for the automatic detection of heart diseases. Various methodologies have been implemented for digital signal preprocessing, feature extraction from ECG and ECG signals, specifically ventricular arrhythmias signals classification.
2.1 Artifacts in ECG Signals and Feature Extraction
The ECG signals are normally corrupted with different types of noise. Signal preprocessing extracts the required information from a noisy ECG signal. There are various types of artifacts that can cause abnormal ECG patterns; signals become noisy and distorted. Base-line drift can be caused in ECG signals when breathing [20]. Its frequency is 0.25 Hz. To remove baseline drift, a notch filter is used [19]. Additive white Gaussian noise is assumed as noise statistics. To remove noise, we use a low pass filter with a cut-off frequency of 0.2 Hz [21].
The features of ECG signals include the information regarding classification present in the signals. To recognize and extract different ECG waveforms features, a neuro-fuzzy approach has been used [22]. It applied two techniques to characterize the QRS complex by using Hermite polynomials and Hermite kernel expansion coefficients. The research consisted of Markov modeling techniques to detect and analyze QRS complex and R-R intervals as ECG features to classify ventricular Arrhythmia, which researchers used [23]. This technique was used to detect low amplitude P wave from the ECG signal. A wavelet transform based approach extracts P, T and QRS waves and baseline artefacts. Frequency domain, time domain and statistical feature were utilized in [24] for feature extraction. According to this approach, for each segment that is extracted from the signal, the attributes P, Q, R, S and T are determined by discrete wavelet to transform [25,26].
An efficient approach to retrieve features from ECG signals is given in [27]. A synthesis coding technique was presented. The algorithm used in that approach has predefined distortion to encode each heartbeat to extract ECG features while maintaining the defined distortion level [28]. Zhao et al. used wavelet transform and support vector machine for ECG feature extraction and heart rhythms classification [29]. A multiresolution wavelet transform was introduced in 2005 to extract feature from the ECG signals. It used the modified lead II for signal processing. The researchers used records from the MIT-BIH Database to apply two different types of wavelet filters which are Daubechies4 and Daubechies6.
2.2 Ventricular Diseases Classification Approaches
In ECG classification analysis, most of the researchers have focused on increasing the accuracy level of classification. Several computational approaches have been applied, such as neural networks, digital signal analysis, statistical techniques and support vector machine. Detection of life-threatening ventricular arrhythmias in real-time was addressed by [30,31]. An algorithm named DIAGNOSIS was developed to classify ECG signals using four parameters regarding frequency domain. Sets of rules were used that were based on the comparison of the parameters with predefined thresholds. Four types of signals were discriminated including ventricular fibrillation, imitative artifacts, ventricular rhythms and predominant sinus rhythm. The sequential hypothesis method was detected between two ventricular Arrhythmia; ventricular fibrillation and ventricular tachycardia [32]. The researchers in [33] used early detection automatic detection based on artificial intelligence to assist the ophthalmologist in testing the eyes to avoid blindness and provide a more precise and reliable assessment of a patient’s condition. Diabetic retinopathy (DR) is an inevitable retinal disease caused by diabetes. The patient’s elevated blood sugar level causes DR, which is difficult to treat. Since no early signs occur at the initial level, they can’t be identified early. A generalized discriminant analysis (GDA) technique and a multi-layer perceptron (MLP) neural network classifier were utilized by [34] to develop an effective algorithm for arrhythmia classification. Nine features were obtained from the heart rate variability (HRV) signals.
The novel multi-threaded fitness evaluation approach and the genetic algorithm were used to handle many data sets. A backpropagation neural network addressed by [35] used discrete wavelet transform to classify ECG signals. The features were broken up into two classes: discrete wavelet transform-based features and morphological features. The feed-forward backpropagation and logistic regression variable selection method was used for classification [36,37].
There are several shortcomings in the above-discussed techniques. Some approaches consider a long period for processing, while others are dependent on the ECG signal characteristics. Some of the classifiers need an artifact removal procedure. A few algorithms analyze one part of the signal and detect only one or two abnormalities. It is observed that a common problem with the above-discussed techniques is that when the size of the training parameters increases, structural complexity also grows.
This paper’s research methodology consists of preprocessing, resampling and normalization; and is discussed in detail in later sections. In this paper, the model of the signals is considered as:
where s(n) and
where N0 is a constant
We carry out the following steps in preprocessing to achieve the same sampling rate with the same signal powers. ECG signals we obtained are sampled at different sampling rates. Also, signals are recorded using different machines, which may cause some comparative amplification/attenuation to signals.
Resampling This step resamples the signals so that all signals have the same sampling rate.
Normalization Signals are normalized so that the power of every signal is unity. Let xi(n) and
where d is defined as follows.
For a time-frequency distribution P(
For a signal x(n) of length N, spectrum
For
Let
where
where
where xi (for
where
3.3.1 Complexity Analysis of the Template Design
Complexity of the equation
It is assumed that the templates are different from each other for different diseases. Suppose the classifier is designed to calculate a signal’s similarity with both the templates and decide (label). This task is performed in the spectral domain. Eq. (5), with a change of units, is rewritten as:
The sequence of spectral coefficients
The algorithm for detecting a patient’s condition and detecting whether a person belongs to a healthy or diseased category is given below.
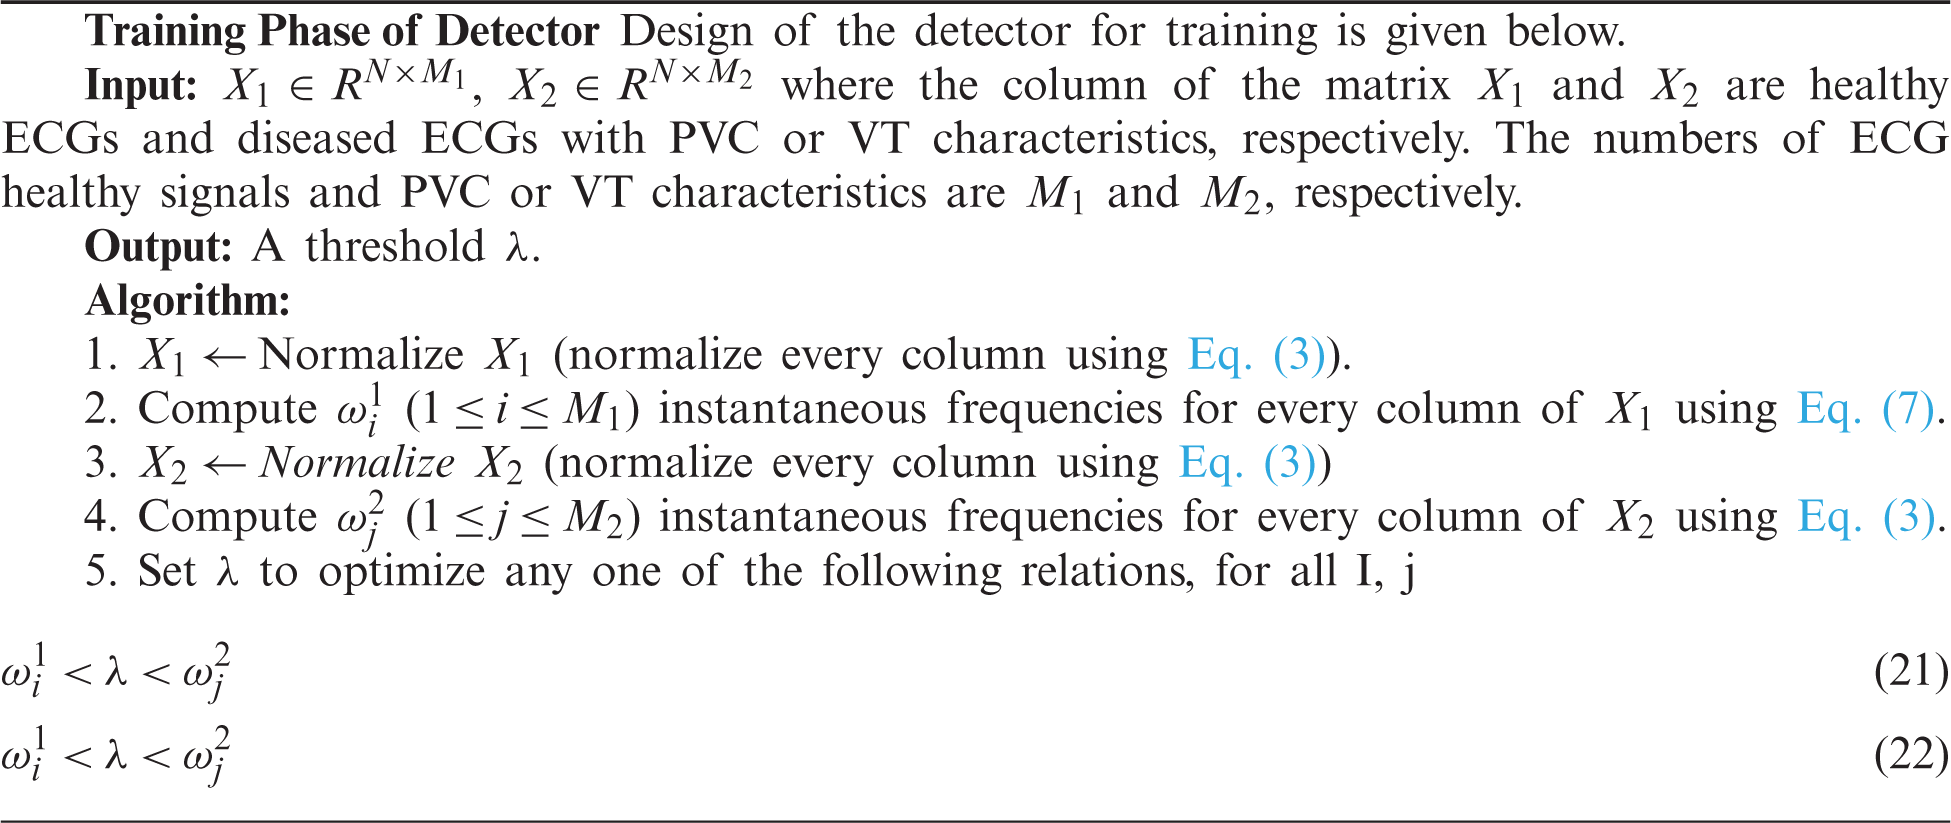
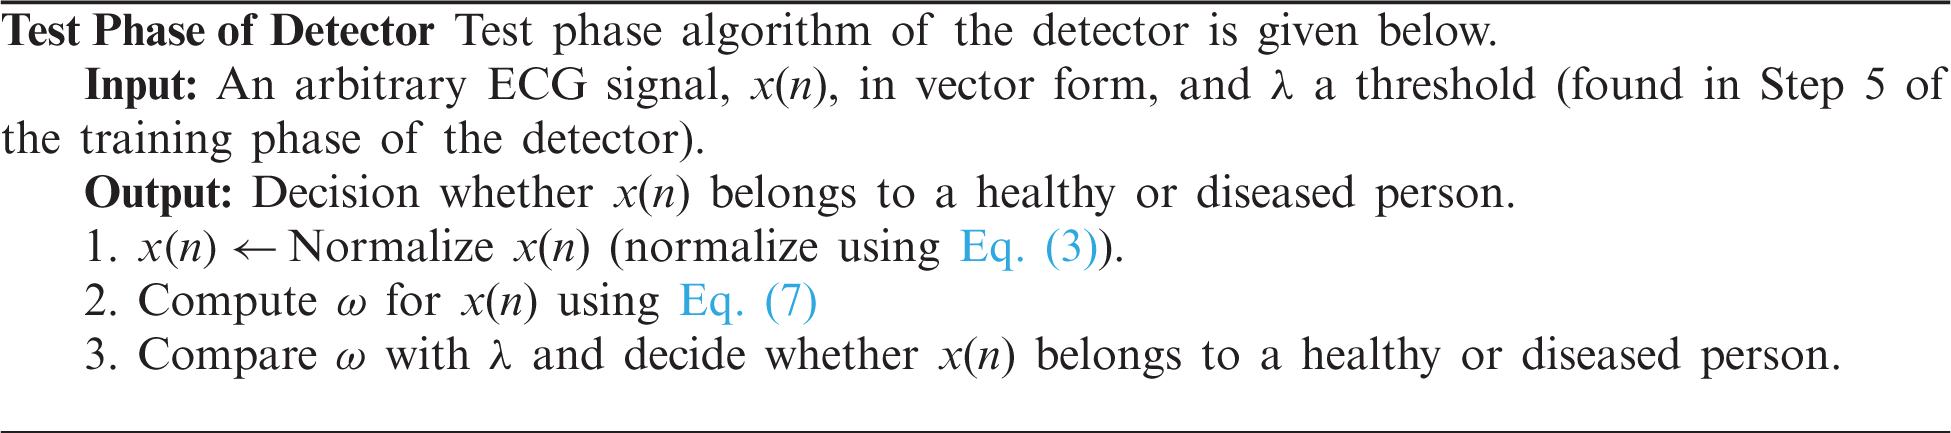
There are two parts of classification. One is training the process, which is given in the form of an algorithm given as a Training Algorithm. In the second part, signals were introduced to the classifying algorithm given as Testing Algorithm to know whether the signal has ventricular tachycardia or premature ventricular contraction. The training Algorithm is given below.
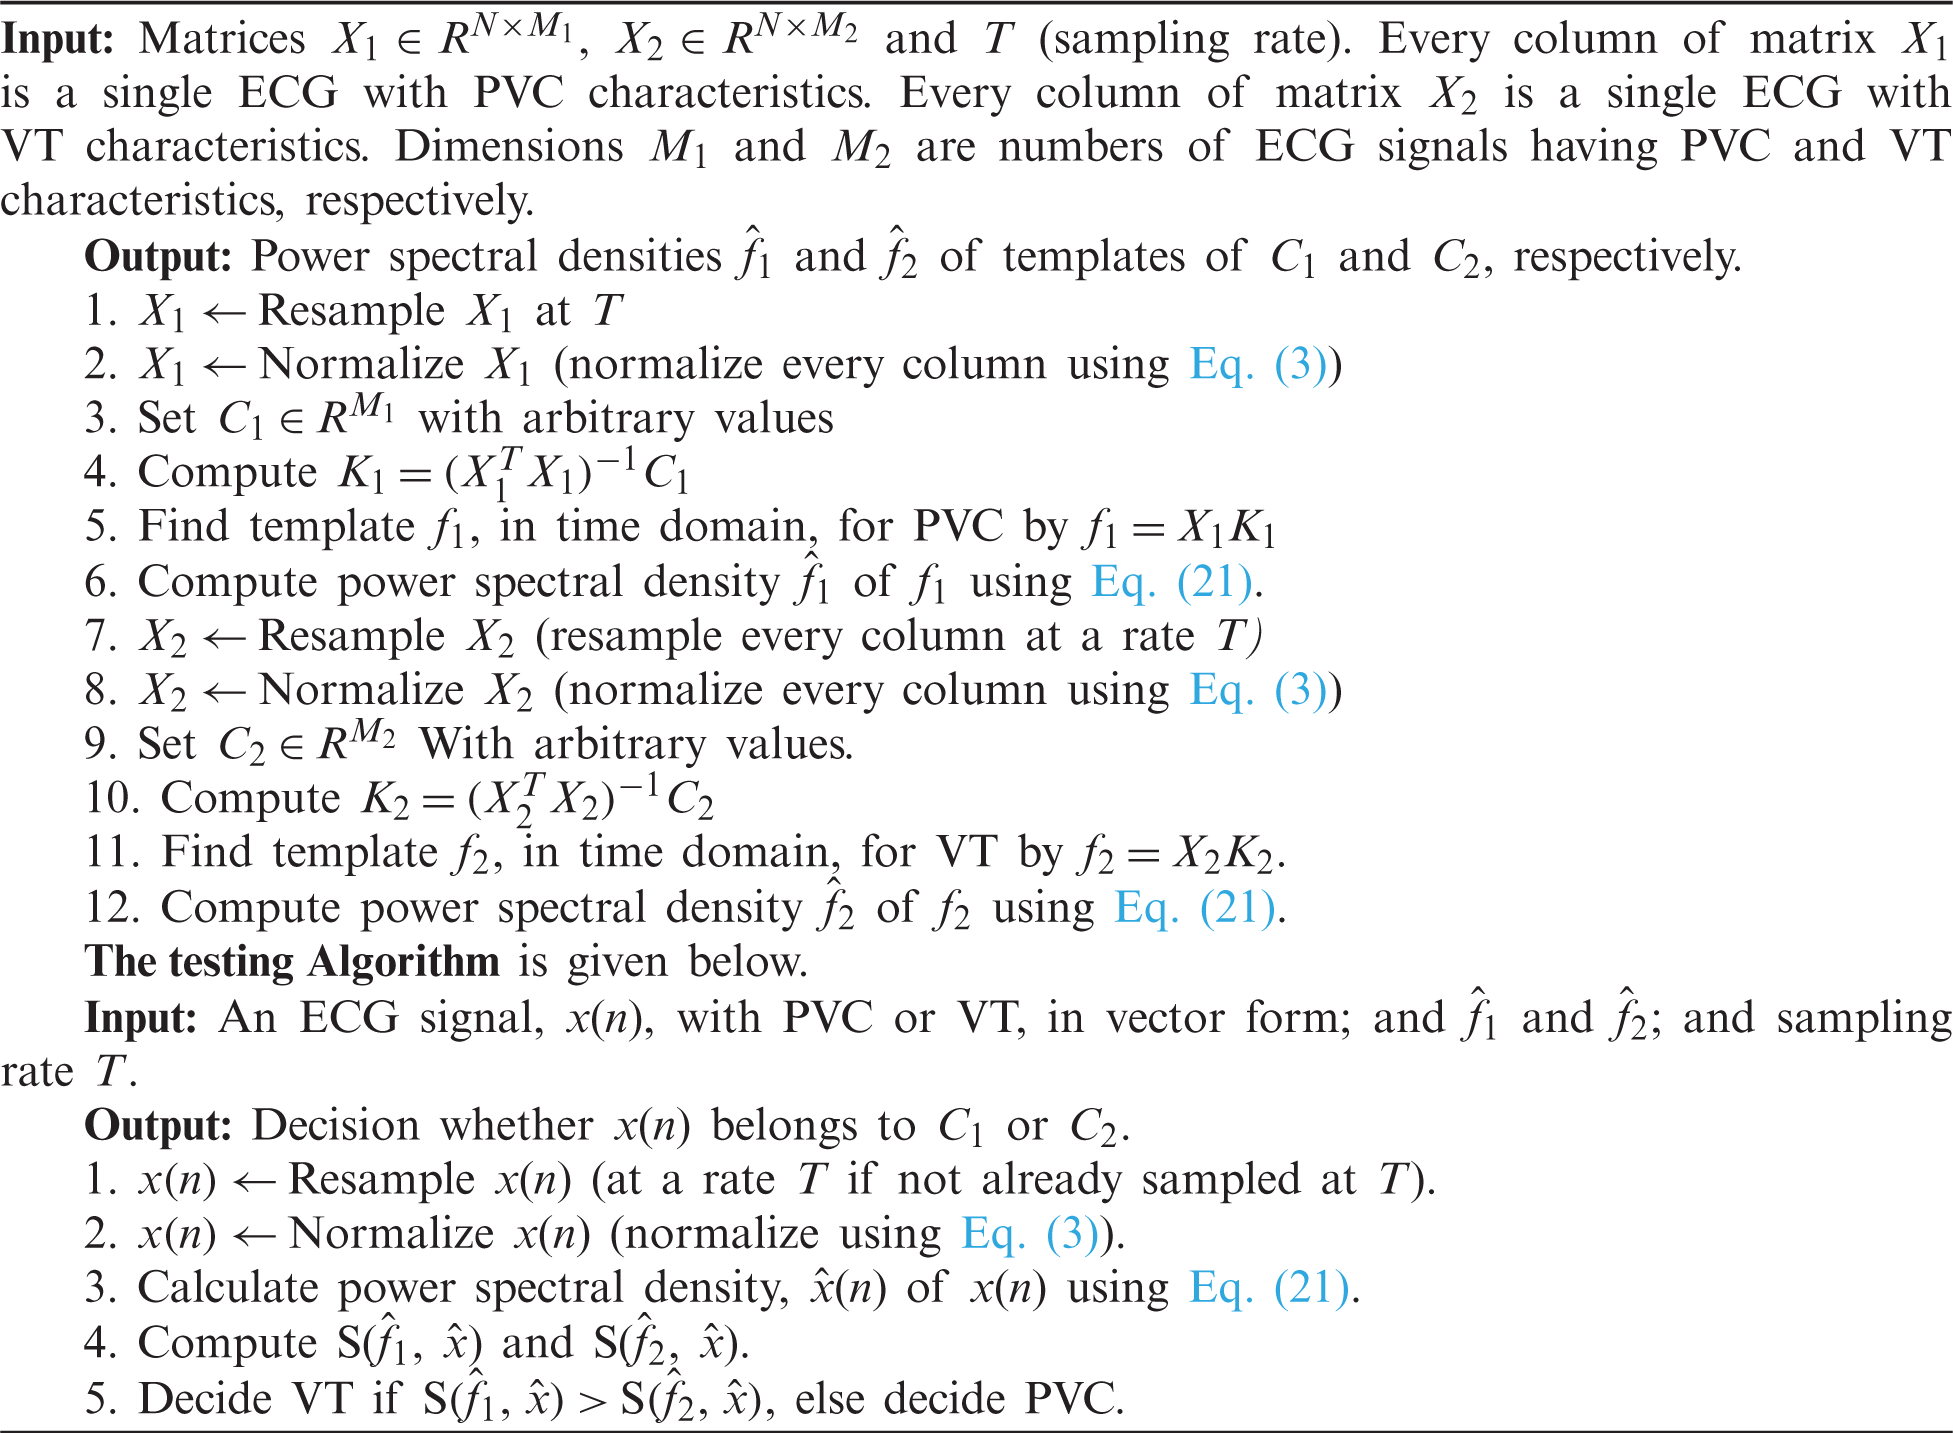
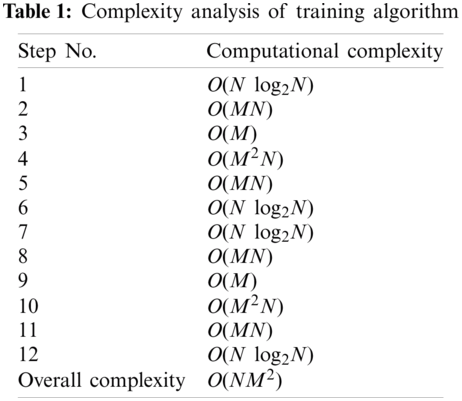
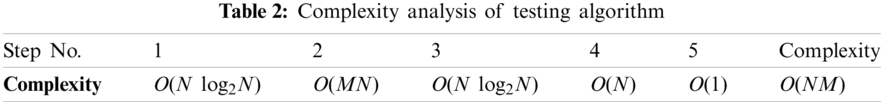
3.7 Complexity Analysis of Algorithms
Complexities of steps of Training Algorithms and Classification Algorithms are given in Tabs. 1 and 2 respectively.
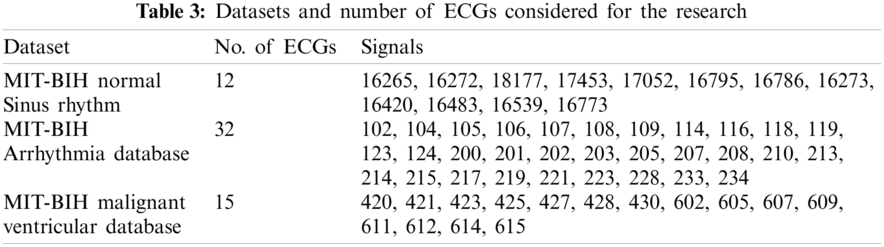
We have used three datasets, namely MIT-BIH Normal Sinus Rhythm (nsrdb) [38], MIT-BIH Arrhythmia Database (mitdb) [38] and MIT-BIH MalignantVentricular Ectopy Database (vfdb) [38], for detection and classification purpose. Every ECG is in vector form. Such a form of data represents the input to experiments. We carried out simulations using Matlab software.
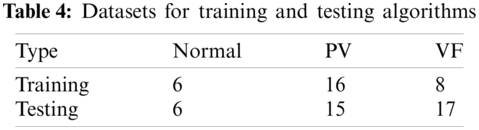
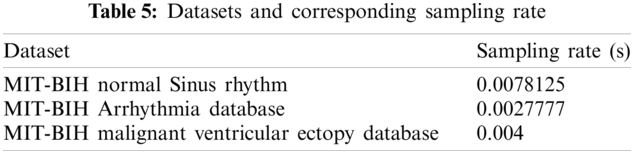
Data preprocessing included two steps: namely normalization and resampling. Normalization is performed for all the signals in the processes of detection and classification. Tab. 3 shows the datasets and respective sampling rates. Tab. 4 shows the datasets for Training and Testing Algorithms. For detection, signals are not resampled as it is possible to compute instantaneous frequencies for any arbitrary sampling rate. For the classification of diseases, ECGs taken from MITBIH Arrhythmia Database are resampled at 0.004 sec as shown in Tabs. 5 and 6.
4.2 Results of Detection and Classification
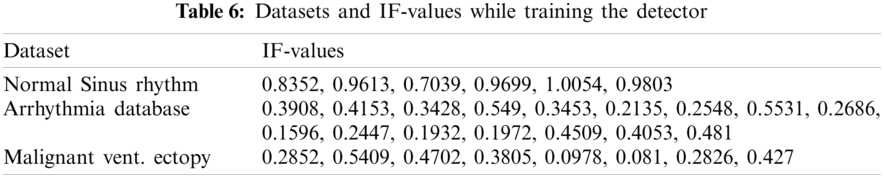
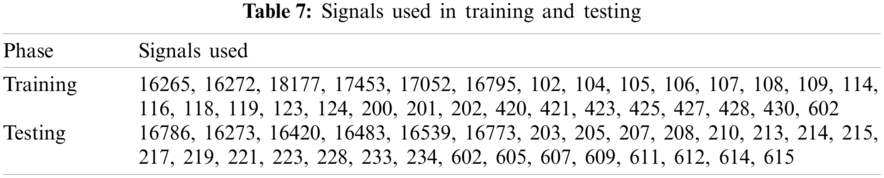
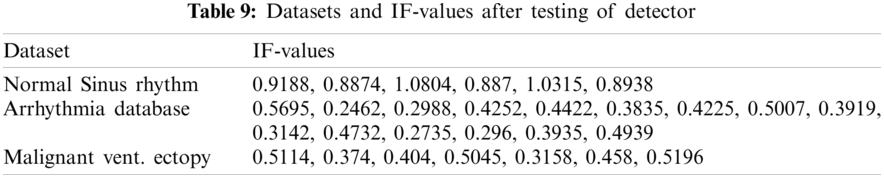
As given in Tab. 7, 30 records were given as input to the detector’s training part. Tab. 7 shows the instantaneous frequencies of all the 30 signals. From Tab. 7, we set the value of IF as 0.7. Therefore, any value of IF smaller than 0.7 indicates that the given signal is diseased.
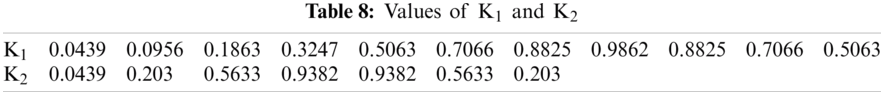
Detection rate during training is 100%. Next, the diseased signals were introduced to the classifier’s training part to achieve the templates’ power spectral densities. K1 and K2 set for training are shown in Figs. 3a and 4b. And Tab. 8 shows the values of K1 and K2, plotted in Figs. 3a and 3b.
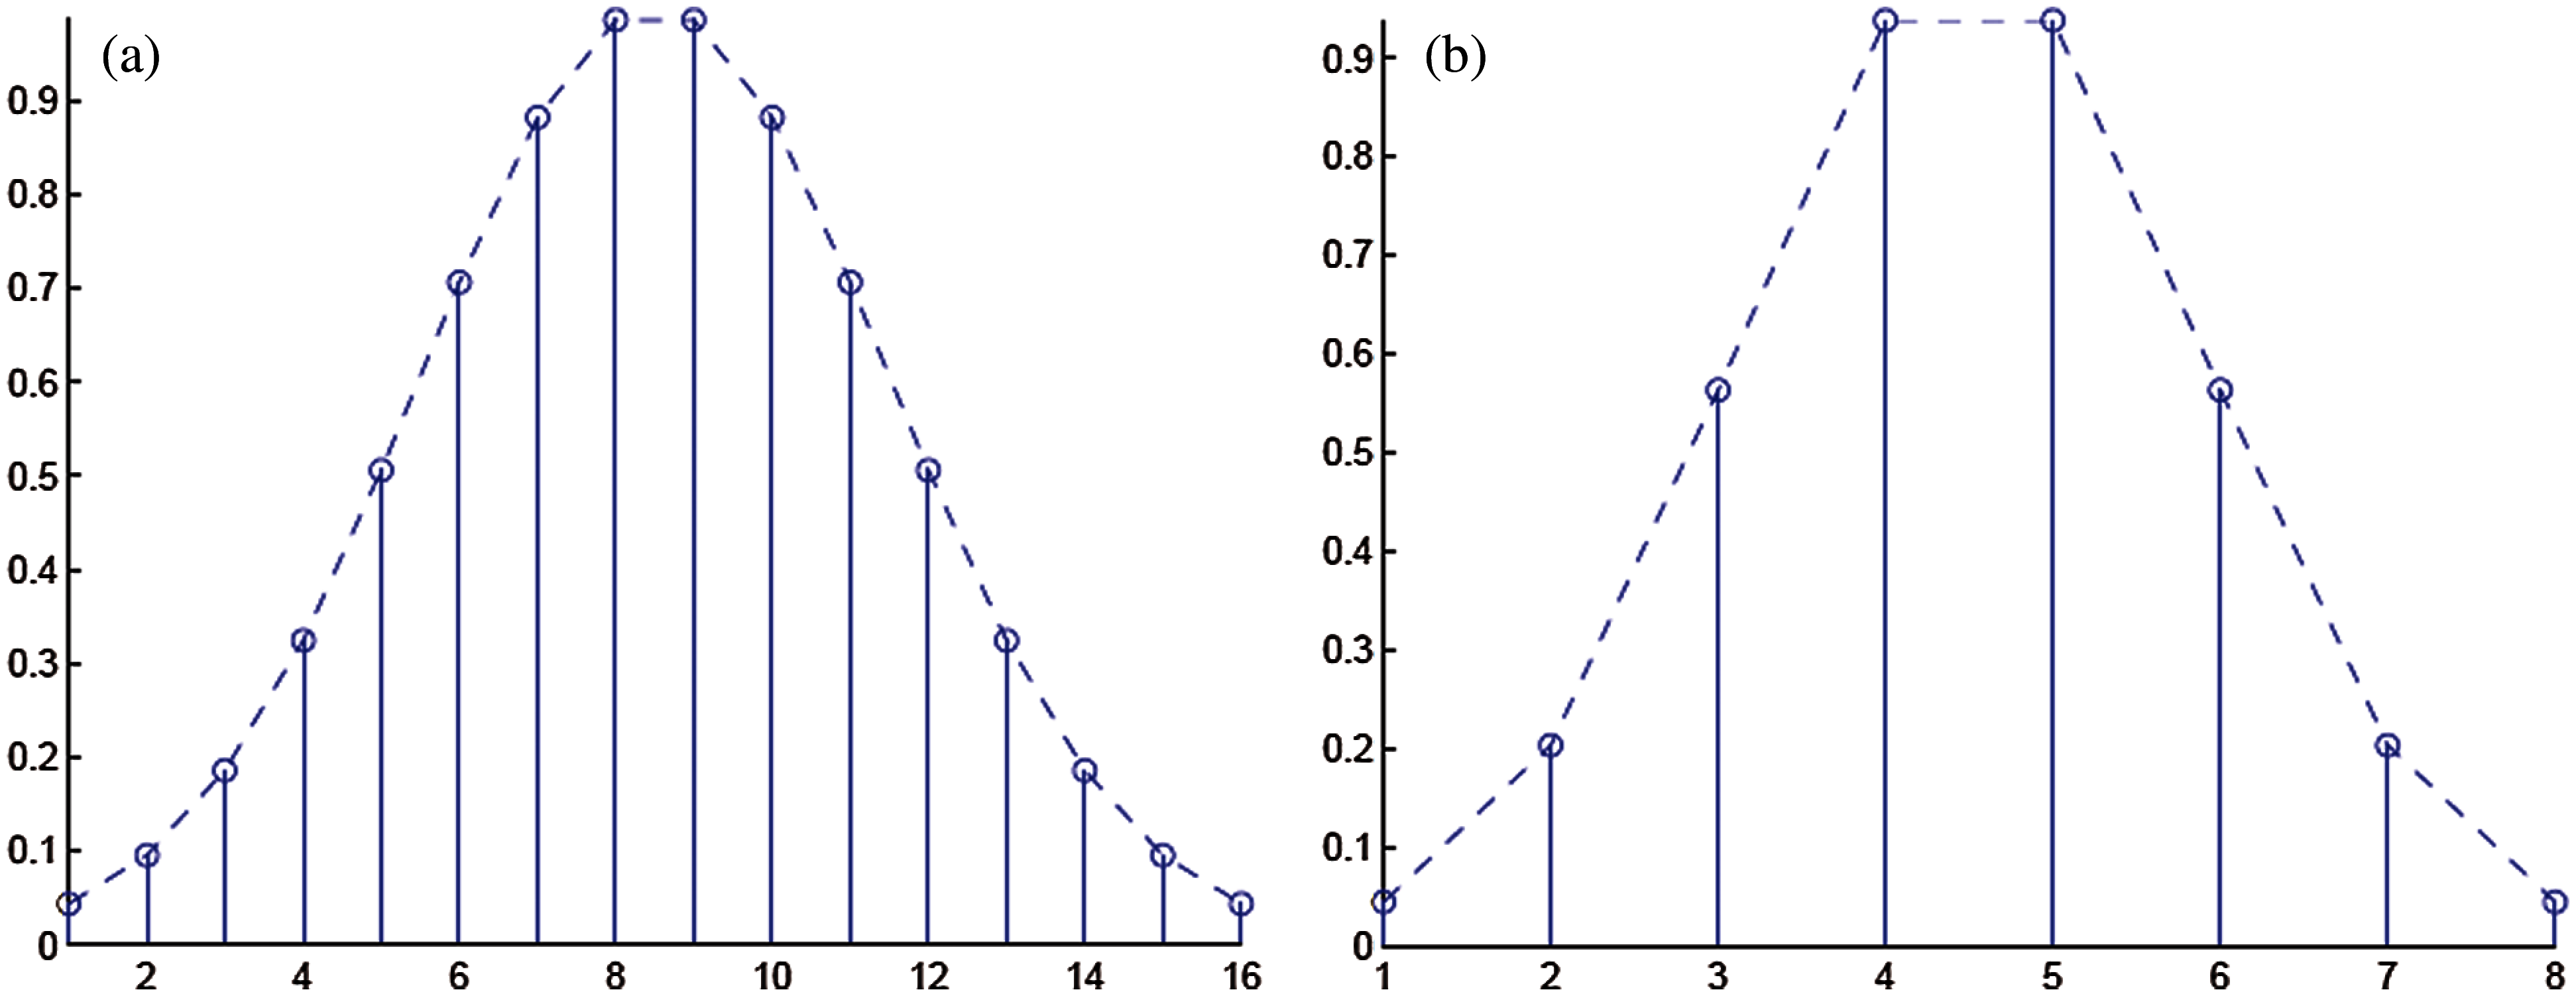
Figure 3: (a) Coefficients C1 set for the template for signals taken from MIT-BIH Arrhythmia database (b) Coefficients C2 set for the template for signals taken from MIT-BIH malignant ventricular ectopy database
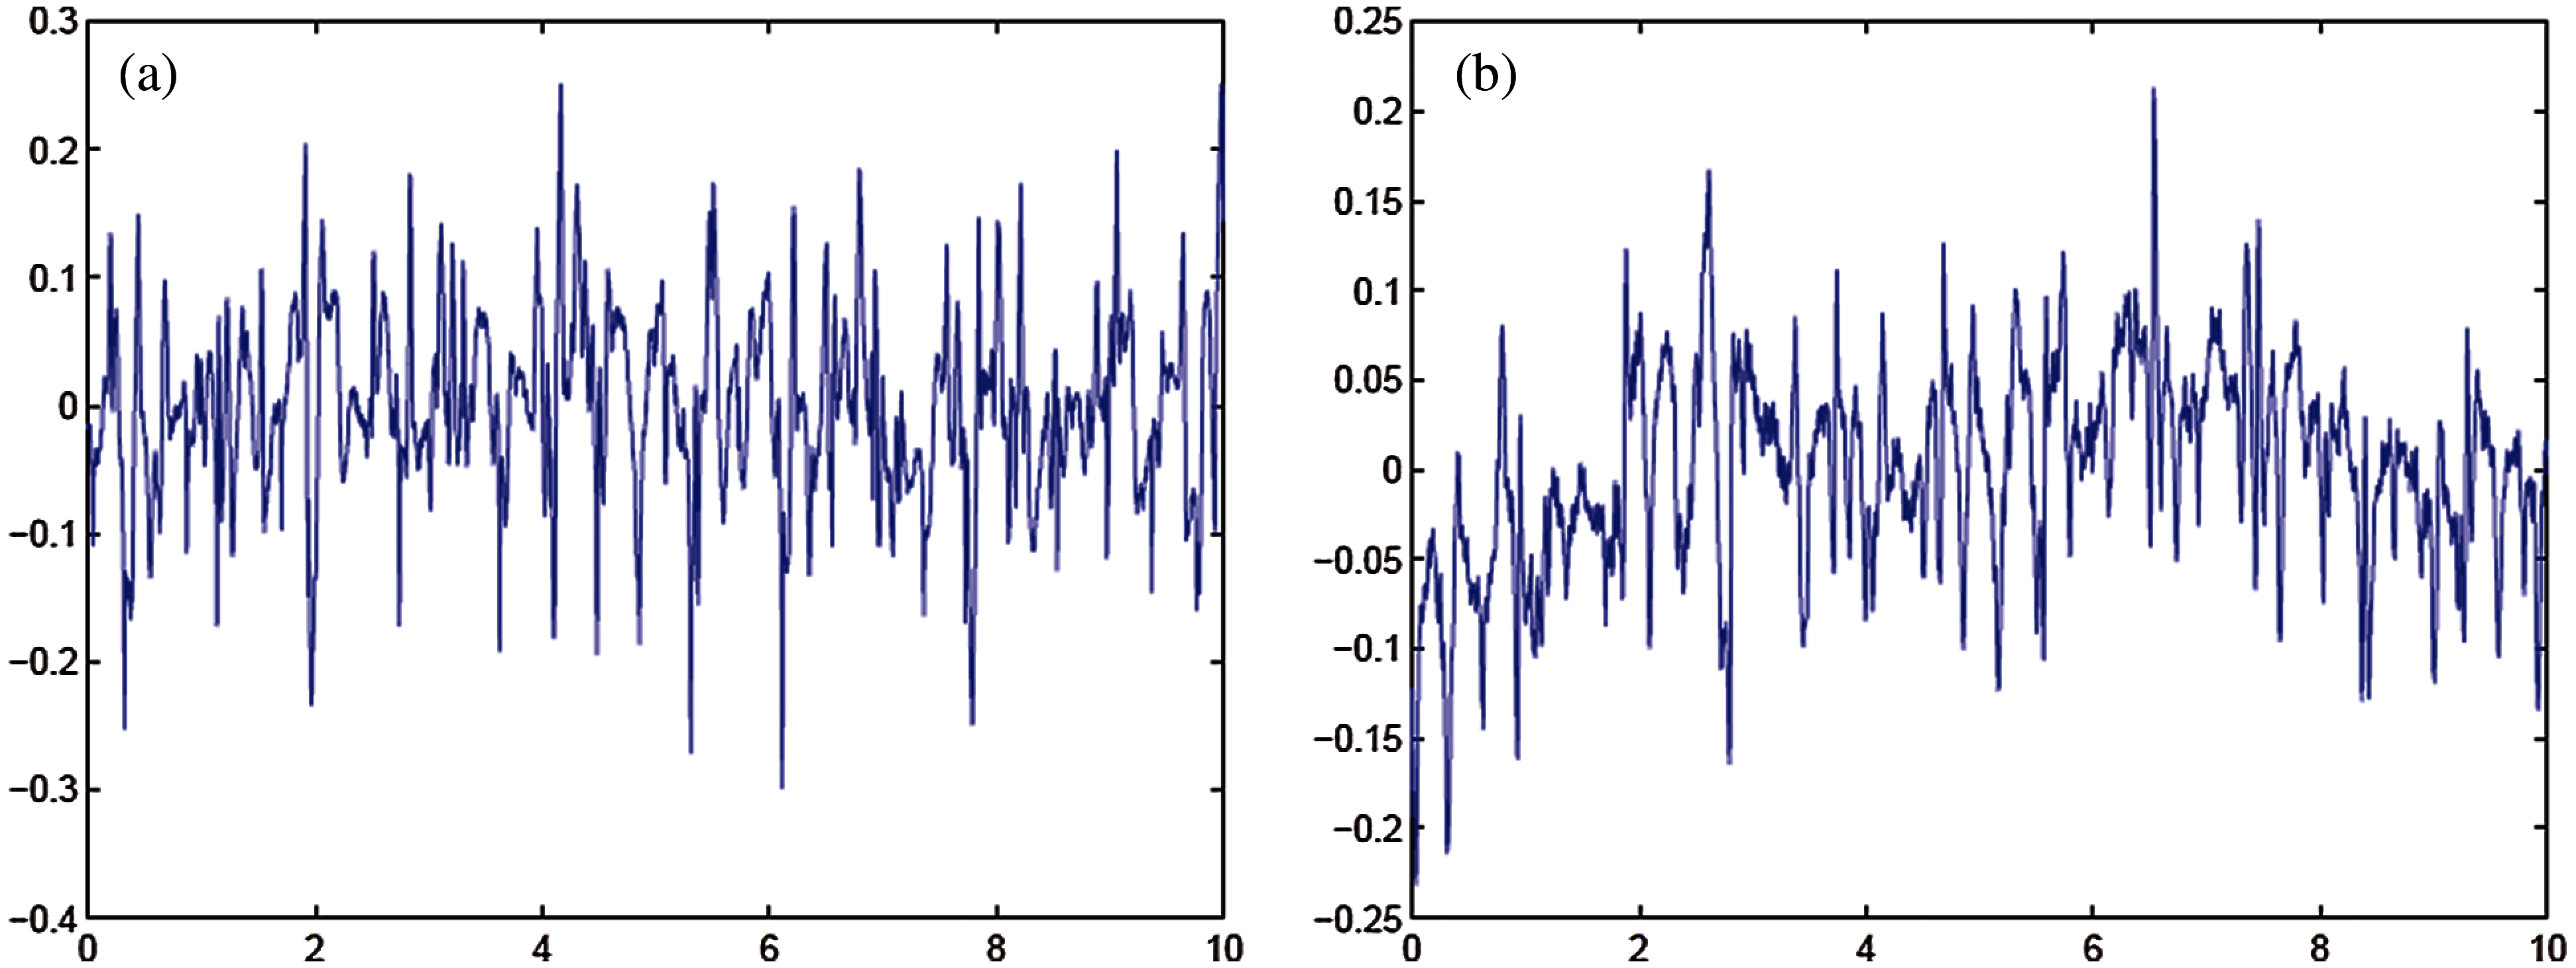
Figure 4: (a) Template for signals taken from MIT-BIH Arrhythmia database (b) Template for signals taken from MIT-BIH malignant ventricular ectopy database
Figs. 4, 5 shows the templates and their power spectral densities, respectively. It is observed that there is a wide difference between the power spectral densities of the two templates.
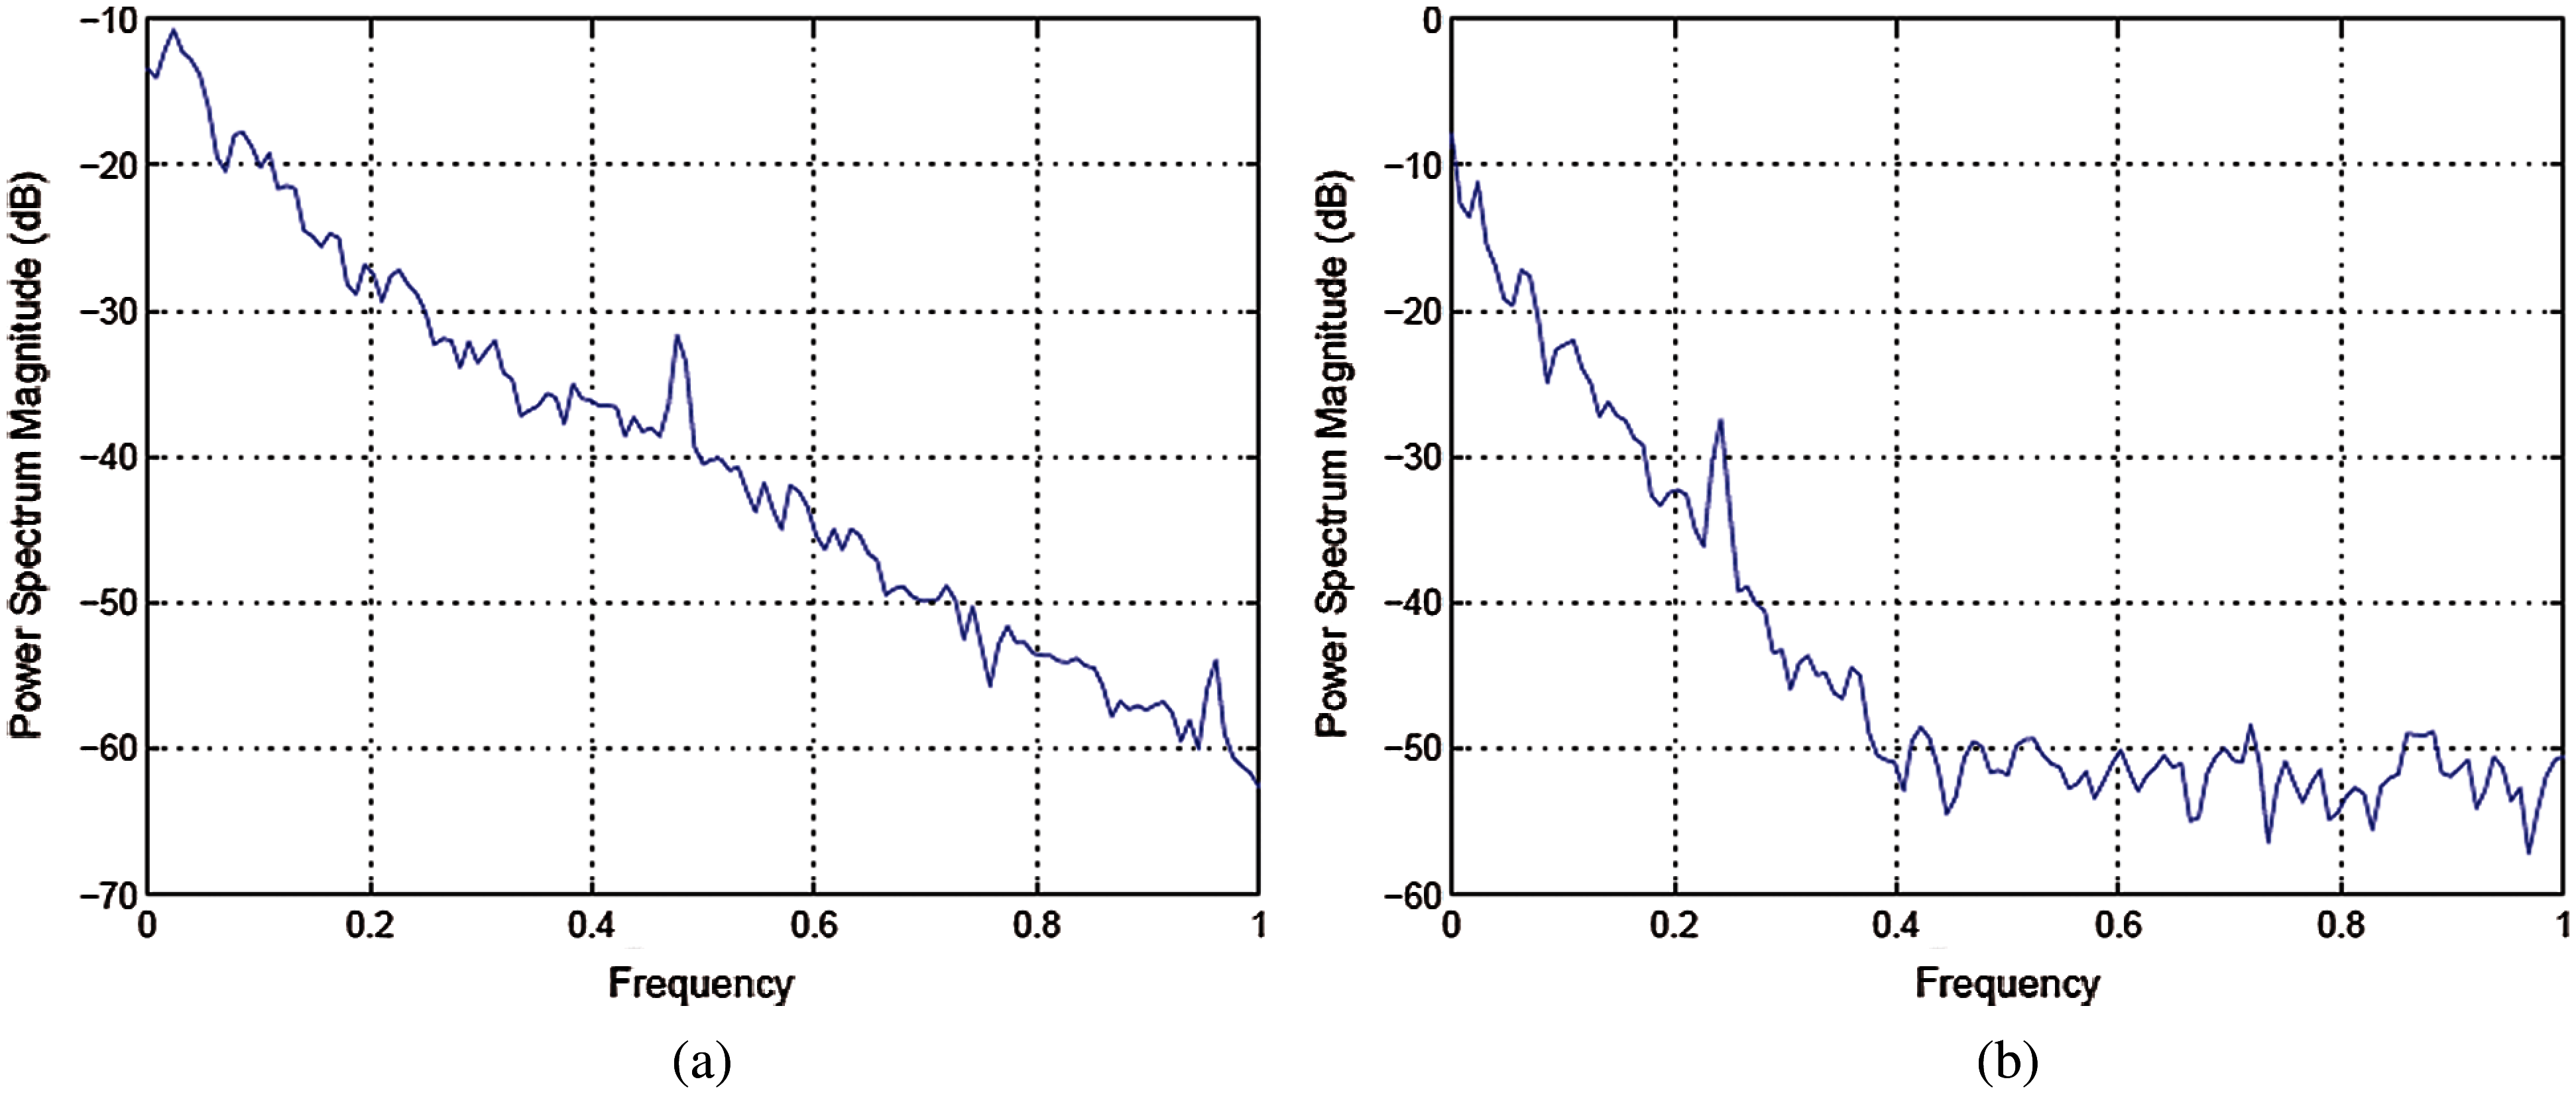
Figure 5: (a) Power spectral density of template for signals taken from MIT-BI Arrhythmia database (b) Power spectral density of template for signals taken from MIT-BIH malignant ventricular ectopy database
As given in Tab. 7, 26 records were given as input to the detector’s testing part. Tab. 7 shows the instantaneous frequencies of all 28 signals. All the diseased signals are below 0.7, and normal signals are above 0.7. Therefore, 22 signals of the two diseases were subject to the classifier. Results of the classifier for both the diseases are given in Tabs. 9 and 10.
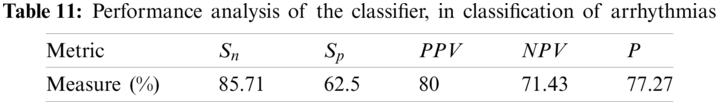
In order to test the effectiveness of the proposed detector and classifier, standard performance metrics have been used, such as sensitivity, specificity, and precision.
Considering Tab. 7, with the value of
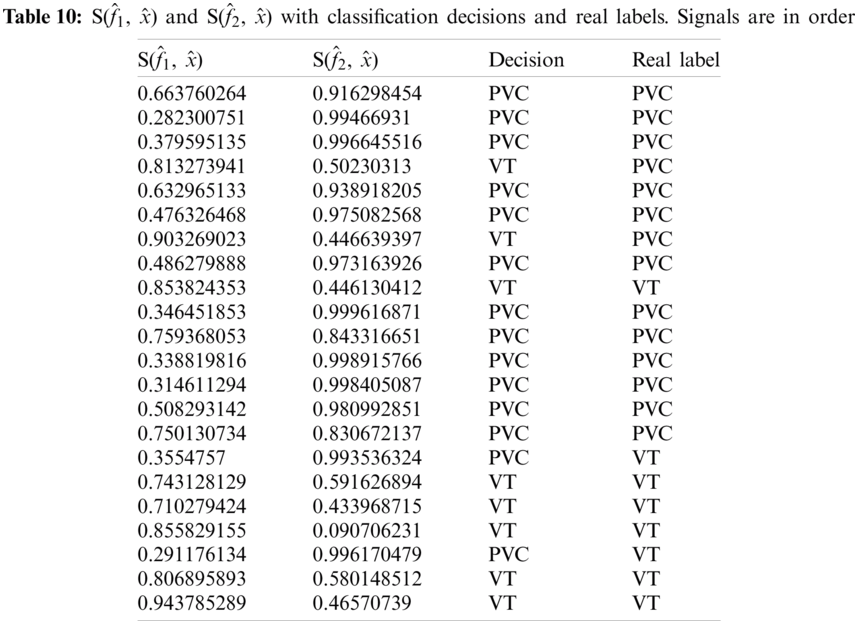
Considering Tab. 7, we have taken 15 signals from MIT-BIH Arrhythmia Database with a label PVC (NP = 15) and 7 signals from MIT-BIH Malignant Ventricular Ectopy Database (NN = 7) with a label of VF, as a test dataset subjected to the classifier, thus N = 22. Again from Tab. 4, it is clear that TP = 12, FP = 3, TN = 5 and FN = 2. Ideally, the values of all these measurements must be high. Performance analysis of the classifier is given in Tab. 11.
In this research, we designed algorithms for the detection and classification of ventricular cardiac diseases. Firstly, the detection algorithm works for the detection of a diseased signal. Normal signals were taken from MIT-BIH Normal Sinus Rhythm. If a given signal is diseased, it passes through the classifier to identify the disease. We considered only two diseases: ventricular tachycardia (taken from MIT-BIH Malignant Ventricular Ectopy Database) and premature ventricular contraction (taken from MIT-BIH Arrhythmia Database). Signals taken from every database were divided into two sets. One set was introduced in the training of the detector and classifier. The other set was used to test and observe the performance of the proposed detector and classifier. Through the evaluation process, the main conclusion drawn is as follows. Removal of noise and wander baseline are not necessary if the signals are transformed to a spectral domain. As it is assumed that signals have additive white Gaussian noise, there is a constant value added to the signals’ spectrum. This does not affect the value of the instantaneous frequencies and does not affect decisions drawn from spectra of the templates. As far as wander baseline is concerned, its magnitude is so small that it has a little effect on IF spectra of templates. It has been observed that the same results are obtained if X1 is resampled to the sampling rate of X2 and vice versa. High values of instantaneous frequencies for normal signals show that high-frequency components are suppressed in the case of diseased signals.
Funding Statement: This research was supported by the MSIT (Ministry of Science and ICT), Korea, under the ICAN (ICT Challenge and Advanced Network of HRD) program (IITP-2021-2020-0-01832) supervised by the IITP (Institute of Information & Communications Technology Planning & Evaluation) and the Soonchunhyang University Research Fund.
Conflicts of Interest: The authors declare that they have no conflicts of interest to report regarding the present study.
1. J. P. Li, A. U. Haq, S. U. Din, J. Khan and A. Saboor, “Heart disease identification method using machine learning classification in e-healthcare,” IEEE Access, vol. 8, pp. 107562–107582, 2020. [Google Scholar]
2. M. I. Sharif, M. Alhussein, K. Aurangzeb and M. Raza, “A decision support system for multimodal brain tumor classification using deep learning,” Complex & Intelligent Systems, vol. 11, pp. 1–14, 2021. [Google Scholar]
3. I. Ashraf, M. Alhaisoni, R. Damaševičius, R. Scherer, A. Rehman et al., “Multimodal brain tumor classification using deep learning and robust feature selection: A machine learning application for radiologists,” Diagnostics, vol. 10, pp. 565, 2020. [Google Scholar]
4. M. A. Khan, S. Rubab, A. Kashif, M. I. Sharif, N. Muhammad et al., “Lungs cancer classification from CT images: An integrated design of contrast based classical features fusion and selection,” Pattern Recognition Letters, vol. 129, pp. 77–85, 2020. [Google Scholar]
5. Y.-D. Zhang, M. Sharif and T. Akram, “Pixels to classes: Intelligent learning framework for multiclass skin lesion localization and classification,” Computers & Electrical Engineering, vol. 90, pp. 106956, 2021. [Google Scholar]
6. T. Akram, Y.-D. Zhang and M. Sharif, “Attributes based skin lesion detection and recognition: A mask RCNN and transfer learning-based deep learning framework,” Pattern Recognition Letters, vol. 3, pp. 1–7, 2021. [Google Scholar]
7. M. S. Sarfraz, M. Alhaisoni, A. A. Albesher, S. Wang and I. Ashraf, “StomachNet: Optimal deep learning features fusion for stomach abnormalities classification,” IEEE Access, vol. 8, pp. 197969–197981, 2020. [Google Scholar]
8. S. Kadry, M. Alhaisoni, Y. Nam, Y. Zhang, V. Rajinikanth et al., “Computer-aided gastrointestinal diseases analysis from wireless capsule endoscopy: A framework of best features selection,” IEEE Access, vol. 8, pp. 132850–132859, 2020. [Google Scholar]
9. T. Akram, S. Gul, A. Shahzad, M. Altaf, S. S. R. Naqvi et al., “A novel framework for rapid diagnosis of COVID-19 on computed tomography scans,” Pattern Analysis and Applications, vol. 7, pp. 1–14, 2021. [Google Scholar]
10. N. Hussain, A. Majid, M. Alhaisoni, S. A. C. Bukhari, S. Kadry et al., “Classification of positive COVID-19 CT scans using deep learning,” Computers, Materials and Continua, vol. 66, no. 3, pp. 1–15, 2021. [Google Scholar]
11. M. U. Khan, S. Aziz, T. Akram, F. Amjad, K. Iqtidar et al., “Expert hypertension detection system featuring pulse plethysmograph signals and hybrid feature selection and reduction scheme,” Sensors, vol. 21, pp. 247, 2021. [Google Scholar]
12. S. Zahoor, I. U. Lali, K. Javed and W. Mehmood, “Breast cancer detection and classification using traditional computer vision techniques: A comprehensive review,” Current Medical Imaging, vol. 4, pp. 1–21, 2020. [Google Scholar]
13. D. Poulikakos, K. Hnatkova, S. Skampardoni, D. Green and M. Malik, “Sudden cardiac death in dialysis: Arrhythmic mechanisms and the value of non-invasive electrophysiology,” Frontiers in Physiology, vol. 10, pp. 144, 2019. [Google Scholar]
14. Cardiovascular diseases-Global facts and figures-World Heart Federation. 2017. [Online]. Available: https://www.world-heart-federation.org/resources/cardiovascular-diseases-cvds-global-facts-figures/. Last Accessed 21 March 2021. [Google Scholar]
15. K. A. Holst, S. M. Said, T. J. Nelson, B. C. Cannon and J. A. Dearani, “Current interventional and surgical management of congenital heart disease: Specific focus on valvular disease and cardiac arrhythmias,” Circulation Research, vol. 120, no. 6, pp. 1027–1044, 2017. [Google Scholar]
16. W. Xue, G. Brahm, S. Pandey, S. Leung and S. Li, “Full left ventricle quantification via deep multitask relationships learning,” Medical Image Analysis, vol. 43, no. 2, pp. 54–65, 2018. [Google Scholar]
17. M. Naz, J. H. Shah, M. Sharif, M. Raza and R. Damaševičius, “From ECG signals to images: A transformation based approach for deep learning,” PeerJ Computer Science, vol. 7, no. 1, pp. e386, 2021. [Google Scholar]
18. N. Mamorita, N. Arisaka, R. Isonaka, T. Kawakami and A. Takeuchi, “Development of a smartphone app for visualizing heart sounds and murmurs,” Cardiology, vol. 137, no. 3, pp. 193–200, 2017. [Google Scholar]
19. E. M. Cherry and F. H. Fenton, “Visualization of spiral and scroll waves in simulated and experimental cardiac tissue,” New Journal of Physics, vol. 10, no. 12, pp. 125016, 2008. [Google Scholar]
20. T. Ince, S. Kiranyaz and M. Gabbouj, “A generic and robust system for automated patient-specific classification of ECG signals,” IEEE Transactions on Biomedical Engineering, vol. 56, no. 5, pp. 1415–1426, 2009. [Google Scholar]
21. J.-M. Belda-Lois, S. Mena-del Horno, I. Bermejo-Bosch, J. C. Moreno, J. L. Pons et al., “Rehabilitation of gait after stroke: A review towards a top-down approach,” Journal of Neuroengineering and Rehabilitation, vol. 8, pp. 1–20, 2011. [Google Scholar]
22. Y.-C. Yeh and W.-J. Wang, “QRS complexes detection for ECG signal: The difference operation method,” Computer Methods and Programs in Biomedicine, vol. 91, no. 3, pp. 245–254, 2008. [Google Scholar]
23. B. Manju and M. Sneha, “ECG denoising using wiener filter and Kalman filter,” Procedia Computer Science, vol. 171, pp. 273–281, 2020. [Google Scholar]
24. K.-P. Lin and W. H. Chang, “QRS feature extraction using linear prediction,” IEEE Transactions on Biomedical Engineering, vol. 36, no. 10, pp. 1050–1055, 1989. [Google Scholar]
25. D. A. Coast, R. M. Stern, G. G. Cano and S. A. Briller, “An approach to cardiac arrhythmia analysis using hidden Markov models,” IEEE Transactions on Biomedical Engineering, vol. 37, no. 9, pp. 826–836, 1990. [Google Scholar]
26. F. Jager, “Feature extraction and shape representation of ambulatory electrocardiogram using the Karhunen–Lòeve transform,” Electrotechnical Review, vol. 69, pp. 83–89, 2002. [Google Scholar]
27. I. Clark, R. Biscay, M. Echeverría and T. Virués, “Multiresolution decomposition of non-stationary EEG signals: A preliminary study,” Computers in Biology and Medicine, vol. 25, no. 4, pp. 373–382, 1995. [Google Scholar]
28. A. Rezaei, A. Koulouri and S. Pursiainen, “Randomized multiresolution scanning in focal and fast E/MEG sensing of brain activity with a variable depth,” Brain Topography, vol. 33, no. 2, pp. 161–175, 2020. [Google Scholar]
29. S. Saxena, A. Sharma and S. Chaudhary, “Data compression and feature extraction of ECG signals,” International Journal of Systems Science, vol. 28, no. 5, pp. 483–498, 1997. [Google Scholar]
30. A. Kumar, R. Ranganatham, S. Singh, R. Komaragiri and M. Kumar, “A robust digital ECG signal watermarking and compression using biorthogonal wavelet transform,” Research on Biomedical Engineering, vol. 37, no. 1, pp. 79–85, 2021. [Google Scholar]
31. Q. Zhao and L. Zhang, “ECG feature extraction and classification using wavelet transform and support vector machines,” in 2005 Int. Conf. on Neural Networks and Brain, NY, USA, pp. 1089–1092, 2005. [Google Scholar]
32. S. Barro, R. Ruiz, D. Cabello and J. Mira, “Algorithmic sequential decision-making in the frequency domain for life threatening ventricular arrhythmias and imitative artefacts: A diagnostic system,” Journal of Biomedical Engineering, vol. 11, no. 4, pp. 320–328, 1989. [Google Scholar]
33. R. Panda, S. Jain, R. Tripathy and U. R. Acharya, “Detection of shockable ventricular cardiac arrhythmias from ECG signals using FFREWT filter-bank and deep convolutional neural network,” Computers in Biology and Medicine, vol. 124, no. 3, pp. 103939, 2020. [Google Scholar]
34. N. V. Thakor, Y.-S. Zhu and K.-Y. Pan, “Ventricular tachycardia and fibrillation detection by a sequential hypothesis testing algorithm,” IEEE Transactions on Biomedical Engineering, vol. 37, no. 9, pp. 837–843, 1990. [Google Scholar]
35. F. Nawaz, M. Ramzan, K. Mehmood, H. U. Khan and M. R. Bhutta, “Early detection of diabetic retinopathy using machine intelligence through deep transfer and representational learning,” Computers, Materials and Continua, vol. 66, no. 2, pp. 1631–1645, 2021. [Google Scholar]
36. F. Yaghouby, A. Ayatollahi and R. Soleimani, “Classification of cardiac abnormalities using reduced features of heart rate variability signal,” World Applied Sciences Journal, vol. 31, pp. 1–12, 2009. [Google Scholar]
37. H. M. Rai and A. Trivedi, “ECG signal classification using wavelet transform and back propagation neural network,” in 2012 5th Int. Conf. on Computers and Devices for Communication, NY, USA, pp. 1–4, 2012. [Google Scholar]
38. A. L. Goldberger, L. A. Amaral, L. Glass, J. M. Hausdorff, P. C. Ivanov et al., “PhysioBank, PhysioToolkit, and PhysioNet: Components of a new research resource for complex physiologic signals,” Circulation, vol. 101, pp. e215–e220, 2000. [Google Scholar]
 | This work is licensed under a Creative Commons Attribution 4.0 International License, which permits unrestricted use, distribution, and reproduction in any medium, provided the original work is properly cited. |